
Abstract
Malaysia, as one of the most open economies in Asia, requires the strategic selection of key trade partners to ensure sustainable trade-led economic growth. This study employs two alternative approaches—the global extraction method (GEM), which is Malaysia-centric and measures Malaysia’s vulnerability to the removal of specific partners, and the Intercountry Trade Impact Index (ITII), which is system-wide and captures partners’ global significance through their interdependencies and economic weight—to analyse and rank Malaysia’s trade partners, comparing these results with actual trade performance data. The analysis utilises the 2020 OECD Inter-country Input-Output tables, aggregated to reflect Malaysia’s trade relationships. Results from the GEM highlight the Association of Southeast Asian Nations (ASEAN), South Korea, New Zealand, Australia and Japan as key trade partners. Alternatively, the ITII approach identifies major partners, including China, New Zealand, the United States, Other Europe and the rest of the world. An integrated ranking across all methods, including trade volume considerations, consistently positions ASEAN, Japan, China, South Korea and New Zealand as Malaysia’s top-five trade partners, offering a comprehensive and balanced strategy for re-evaluating Malaysia’s trade policies.
Keywords
Introduction
Trade policymaking is a critical yet complex endeavour for nations worldwide. This complexity is particularly pronounced in Malaysia, a developing country where trade constitutes a substantial portion of the economy. According to VanGrasstek (2008), trade typically accounts for a significant share of Malaysia’s gross domestic product (GDP). In 2024, Malaysia achieved a remarkable trade record, with total trade reaching RM 2.879 trillion (Malaysia External Trade Statistics, 2024). According to the World Bank (2025), the degree of economic trade openness in Malaysia reached 131% of its GDP by the end of 2023. This underscores the pivotal role of trade in Malaysia’s economic growth. However, the challenges of trade policymaking are multifaceted. Policymakers must uphold trade-driven growth while ensuring that Malaysia’s high trade share remains stable in the years ahead. The Ministry of International Trade and Industry of Malaysia publishes an annual report on the country’s trade performance, known as the Trade Performance of Malaysia. This report aligns closely with the data provided in the WITS (2025), ensuring consistency and accuracy in trade statistics. In its latest report, the Association of Southeast Asian Nations (ASEAN), China, the United States, the European Union and Taiwan were identified as Malaysia’s major trading partners, collectively accounting for over 68.4% of the country’s total trade volume (Malaysia External Trade Statistics, 2024). ASEAN has been recognised as a strategic partner for Malaysia, with trade between Malaysia and ASEAN countries amounting to RM 720.66b, representing 27.3% of Malaysia’s total trade. Within ASEAN, Malaysia’s top-three trading partners are Singapore, Thailand and Indonesia. In addition, trade with China constitutes 17.1% of Malaysia’s total trade, making China the second most significant trading partner. Since 2015, the United States has held its position as Malaysia’s third-largest trading partner. The European Union ranks fourth, accounting for 6.5% of Malaysia’s total trade, with major contributors including the Netherlands, Germany, Belgium, Italy, Spain, France, Poland, Hungary, the Czech Republic and Sweden. 1 This study argues that future trade partner selection should not rely only on statistical reports of trade volumes with other countries or regions. In other words, trade volume does not necessarily reflect the true structural importance of a partner within global value chains (GVCs) or the extent of Malaysia’s vulnerability to potential disruptions. For example, two partners with similar trade volumes may differ substantially in how their extraction affects Malaysia’s output and in how their influence propagates on Malaysia through the global economy. Hence, two dimensions are critical: first, the degree of Malaysia’s interdependence with trading partners in goods and services, both through intermediate and final products, which reflects the country’s vulnerability in international trade, and second, the systemic significance of these partners in the global economy, which makes them strategically important for Malaysia’s long-term trade resilience. By integrating these dimensions, trade policy can better align with Malaysia’s objective of sustaining trade-driven growth while enhancing resilience in an interconnected global economy.
Malaysia’s trade landscape demonstrates both concentration in traditional partners, such as ASEAN, China, the United States and the European Union, and diversification through Malaysia’s FTAs and emerging markets. These developments illustrate Malaysia’s deepening integration into global trade networks and its efforts to broaden economic linkages. Yet, despite the centrality of trade to Malaysia’s development, a large body of existing academic research has not kept pace with these evolving dynamics.
First, studies on trade openness and economic growth confirm that openness has contributed positively to Malaysia and ASEAN’s development (Anoruo & Ahmad, 2022; Narayan, 2025; Sulaiman & Ramli, 2019). Nguyen Thi and Nguyen (2025) investigated the conditional impact of trade openness on economic growth in ASEAN countries. They found a positive relationship between trade openness and economic growth. This research suggests that the benefits of trade openness are not uniform across all ASEAN countries but are influenced by the specific characteristics and policies of individual nations. Chandran and Munusamy (2009) examined the relationship between trade openness and manufacturing growth in Malaysia. The findings indicate that trade openness has a significant positive impact on the growth of the manufacturing sector, highlighting the importance of open trade policies in fostering manufacturing development. Nguyen et al. (2023) explored the impact of trade openness on economic stability in ASEAN countries. They reveal that trade openness contributes to economic stability; however, such stability varies across different countries based on different macroeconomic indicators. Yet, these studies mostly rely on aggregate indicators and therefore provide limited insights into the differentiated roles of individual partners.
A second group of research investigates bilateral and multilateral trade determinants, such as GDP, exchange rates and foreign direct investment (FDI), particularly with China, Japan and ASEAN (Abidin et al., 2013; Hammed Agboola et al., 2018; Ky, 2025; Murad et al., 2025). Sasana and Fathoni (2019) identified several critical factors influencing FDI inflows into ASEAN countries. These include market size (as measured by GDP), exchange rate stability, infrastructure quality and institutional frameworks. It highlights the importance of these determinants in shaping the investment environment and fostering economic growth within the region. Abidin et al. (2013) examined Malaysia’s bilateral trade, finding that stable exchange rates and strategic FDI enhance integration with key partners. Murad et al. (2025) found that Malaysia’s exports to Japan significantly boost economic growth, while imports and development aid from Japan have positive but insignificant effects. The results suggest that long-term export promotion policies have strengthened Malaysia’s export-driven development. Yusuf et al. (2021) showed that while stronger institutions in African OIC countries negatively affect bilateral trade with Malaysia, good institutional quality supports Malaysia’s economic growth, highlighting the need for institutional reforms in these countries to boost trade and development. While these contributions explain important drivers of trade, they do not evaluate the systemic importance of Malaysia’s partners within its overall trade portfolio.
More recently, scholars have turned towards digitalisation and e-commerce as emerging sources of competitiveness, especially for SMEs (Ammeran et al., 2023; Ayob, 2021; Hongqiangh et al., 2025; Lei et al., 2025; Narayan, 2025). For instance, Lei et al. (2025) analysed the effects of digital and sustainable trade facilitation on trade flows among ASEAN countries. Employing a gravity model with data from the UN Global Survey, the findings indicate that measures such as greater transparency in trade procedures, trade facilitation and cross-border digital trade significantly boost bilateral trade. Also, Narayan (2025) found that growing e-commerce in Indonesia and Malaysia enhances their exports, while higher e-commerce development in partner countries can reduce exports.
Another line of research focuses on geopolitical shifts and regional trade agreements, particularly the Regional Comprehensive Economic Partnership (RCEP) (Chong, 2021; Husaini Mohammad Rohimi et al., 2024; Xu et al., 2025). For example, Xu et al. (2025) found that RCEP enhances agricultural value-added exports, strengthens regional participation in value chains and delivers growing short- and long-term benefits, especially when non-tariff barriers are reduced.
In addition, the literature emphasises GVC participation as another point of study, particularly in manufacturing, energy and agriculture sectors, where Malaysia is deeply integrated with China, Japan and ASEAN (Athukorala, 2016; Ilmi & Hastiadi, 2019; Ji et al., 2022; Jiang & Husin, 2024; Phillips & Henderson, 2009; Zhang et al., 2024). For instance, Ji et al. (2022) revealed that forward-linkage GVC participation lowers energy use per value-added chain, while backward linkage increases it, highlighting that moving up value-added chains can reduce resource and environmental costs, especially for lower-middle income countries. These studies capture value-added linkages but usually focus on specific sectors or bilateral ties, without translating GVC participation into a systematic evaluation of partner importance.
Finally, sectoral and commodity-based studies—for instance, on palm oil or agri-food exports—provide insights into Malaysia’s comparative advantages (Hassanpour & Ismail, 2010; Liew et al., 2021; Lugo-Arias et al., 2024; Mizik et al., 2020). Lugo-Arias et al. (2024) examined factors affecting palm oil export competitiveness in 30 countries from 2011 to 2019. Using the symmetric comparative advantage index, they found that emerging countries show greater specialisation than industrialised ones. Results indicate that lower palm and vegetable oil prices, higher exchange rates and rising soybean and biodiesel prices improve palm oil export competitiveness. While these results are valuable, they cannot fully capture the aggregate implications for the wider economic approach.
Taken together, these aspects of research confirm the significance of openness, bilateral flows, digitalisation, regional agreements, GVC participation and sectoral competitiveness for Malaysia’s trade performance. However, three limitations stand out: first, many studies rely on aggregate measures that overlook the relative importance of individual partners; second, much of the work is confined to bilateral or sectoral cases; and third, few studies offer a systemic framework for identifying Malaysia’s most strategic partners. This study addresses the research gap by applying the global extraction method (GEM) and the Intercountry Trade Impact Index (ITII) to the OECD Inter-country Input-Output (ICIO) tables to systematically identify and rank Malaysia’s key trade partners. Unlike existing bilateral, digital or sectoral analyses, this approach provides a partner-specific, economy-wide perspective that captures both trade interdependencies and systemic significance, thereby ensuring a more robust assessment of Malaysia’s trade-driven growth through the measurement of global multipliers.
Two criteria guide the analysis. First, the degree of trade interdependence within global production processes must be assessed. To this end, GEM is employed to measure Malaysia’s vulnerability by estimating the reduction in output under the hypothetical extraction of a trading partner, thereby identifying partners critical to production networks. Second, the broader economic influence of each partner must be evaluated. For this, the ITII is applied, which extends beyond direct interdependencies by incorporating the average propagation length (APL), global multipliers and country size.
While both methods use global multipliers, they differ fundamentally in scope. GEM is Malaysia-centric, assessing the country’s vulnerability to the removal of specific partners (Dietzenbacher et al., 2019) and identifying which partners contribute most to Malaysia’s trade-driven growth (Hertwich et al., 2024). In contrast, ITII is system-wide, capturing partners’ global significance through their interdependencies and economic weight, thereby highlighting Malaysia’s strategic partners in a forward-looking perspective to ensure resilient and stable trade in the long term. Accordingly, GEM highlights Malaysia’s most critical partners in terms of direct exposure, while ITII identifies those whose global standing makes them strategically important for Malaysia’s long-term trade resilience. Together, these complementary perspectives provide a robust framework for evaluating Malaysia’s trade partners in the international economy.
The remainder of this article is organised as follows: The second section outlines the mathematical framework underpinning this study, introducing two alternative approaches derived from the relevant literature. The third section focuses on the data and presents the results of the analysis. Finally, the fourth section offers concluding remarks along with policy recommendations pertinent to the findings.
Mathematical Frameworks
Global Extraction Method
The hypothetical extraction method (HEM), first introduced by Paelinck et al. (1965) (in French) and later developed by Lahr and Miller (2001), measures interindustry linkages and the economic significance of individual industries. HEM simulates the hypothetical cessation of a specific industry’s operations within an input–output framework. It calculates the total output required across the economy to meet original final demands; the resulting reduction in outputs (compared to the baseline) quantifies the linkages associated with the extracted industry.
Dietzenbacher et al. (1993) first extended HEM to intercountry linkages, applying it to selected EU countries. With the emergence of global databases such as the World Input–Output Database, the approach was adapted at the global level by Tukker and Dietzenbacher (2013) and Los et al. (2016). More recently, the GEM, introduced by Dietzenbacher et al. (2019), incorporates more realistic assumptions about international trade. GEM remains under development and has been applied in studies by Tormo García et al. (2024), Wang et al. (2023) and Yan et al. (2020).
Based on the work of Dietzenbacher et al. (2019), suppose there are N countries with n industries in the framework of ICIO. As discussed earlier, to focus on trade partners, we assume that the GEM model is simplified to include only countries with all industries aggregated in the original table. Accordingly, consider the N × N matrix Z of intermediate deliveries, the N × N matrix F of final demands, the N-element output vector x and the N-element value-added vector v are (in a partitioned form) given by:
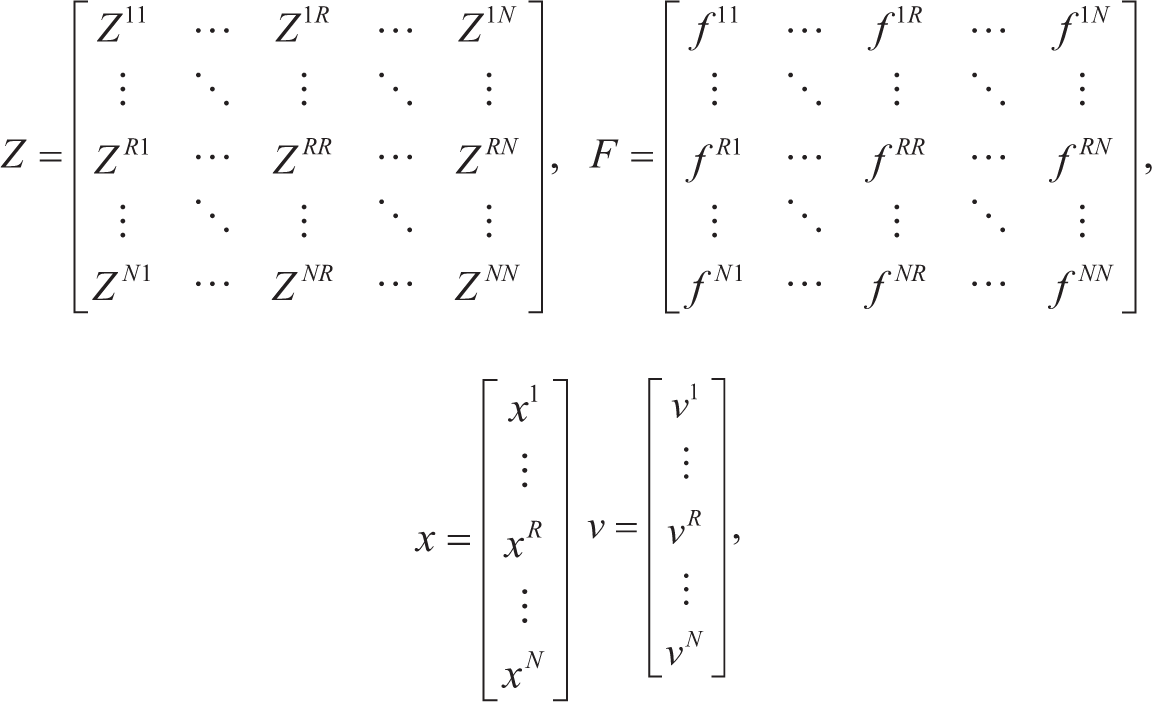
ZijRS are the elements of the N × N matrix of ZRS that provide the money value of intermediate deliveries in country R to country S, fiRS are the elements of vector fRS that provide the deliveries from country R for the final demand in country S. xiR of the N-element vector xR provides the output of country R and vjR of the N-element vector vR provides the value added generated by country R. Finally, based on input-output foundations discussed in Miller and Blair (2022), the N × N matrix with input or technical coefficients is given by A = Zx̂–1, indicating ARS = ZRS(x̂s)–1, which gives the intermediate inputs per unit of the receiving country’s output. The N-element final demand vector is given by f = FeN. Consider that country K is hypothetically extracted from the global economic system. The input coefficients in the row and column of the Kth country is then nullified, and so is the final demand for products from this country. That is:
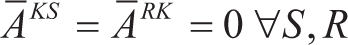
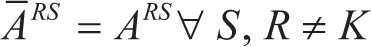

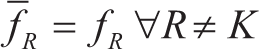
When extraction is applied to the ICIO table, it is assumed that the country S (≠ K) now must import its intermediate inputs of country K rather than supplying them domestically. The same principle holds for meeting the final demands associated with the products of the country K. The extraction of the country K will not change the circumstances in the country S. Therefore, imports from the country K to country S will not be substituted by inputs produced domestically. Hence, the differences between outputs observed in the new global economic system as the extraction of the country K and the initiative output level reveal the importance of the country K in this global economic system. That is, xT can be measured by (I – A)–1f = Lf, known as the global Leontief matrix or global production balance equation. Also, x̅T is measured by (I – A̅)− 1 f̅ = L̅f̅ known as the extracted global Leontief matrix, and ΔOUTPUT = én(x̅T − xT), the difference in the total output of country T.
Introduction of Intercountry Trade Impact Index
The new index for the impact of trade in the global economic system is composed of three components. For composing this index, we introduce three determinants, which are discussed in the following sections. These components include APL for applying in an intercountry framework, economic impact measured by global multipliers and country size based on the ICIO tables. Hence, the vulnerability trade index for the country R is formulated as follows:


and
where ITII
R
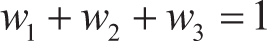
is the Intercountry Trade Impact Index of the country R, whereas wi represents the weight assigned to the ith component of the index, reflecting its relative importance or preference within the overall calculation. Also, IRi denotes the performance value of the Rth country with respect to the ith component. Due to the varying ranges of values across components, we apply normalisation to provide a consistent measurement in the vulnerability trade index. For normalisation, we use the following index:
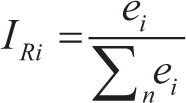
where IRi represents the ith element of the normalised vector IRi ei is the ith element of a representative vector e and Σnei is the sum of all elements of e. It is assumed that the elements of IRi consider only non-negative values. Therefore, it is clear that 0 ≤ IRi ≤ 1, so the value 1 for one country indicates the more relative importance of that country in the world economic system. The advantage of this index’s normalisation lies in its ability to preserve the relative ranking of countries in the final calculations.
Component I: Average Propagation Length
We employ the APL method in an interregional framework, based on Dietzenbacher and Romero (2007), Dietzenbacher et al. (2005) and Yu et al. (2014), as the first component of the ITII. The APL examines two key dimensions of international trade, drawing on Franco et al. (2011), De Benedictis and Taglioni (2011) and Xing (2017): the strength of interregional connections, assessed via backward linkages (buyers’ dependencies on supplying regions) and forward linkages (sellers’ dependencies on demanding regions). The distance (number of steps) in the trade process reveals the extent of direct connectivity and linkage size across countries in the global economy. APL quantifies this distance. In the backwards-looking approach, APL measures the average steps for an increase in the final demand in country A to propagate through the trade network and affect output in country B. In the forward-looking approach, APL measures the average steps for a cost push in country A’s production to impact output in country B. A key advantage of APL is its consistency: both backward- and forward-looking approaches produce identical results, as shown by Dietzenbacher et al. (2005).
For the derivation of the APL, the power series expansion of the global Leontief inverse ((I − A)−1 = L) and global Ghosh inverse ((I − B)−1 = G) is utilised. The elements of the APL matrix are mathematically specified as follows:
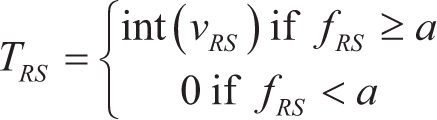
where vRS represents the average number of iterations needed to propagate a demand pull from country S to country R or cost push from country R to country S. This measures the depth of the connection between the two countries in the trade network. fRS reflects the average impact of a demand pull originating from country S to country R or cost push from country R to country S. It quantifies the strength of the trade relationship or economic influence between the two. a is an arbitrary threshold value introduced to ensure that only significant linkages are captured within the model, effectively filtering out irrelevant or negligible connections. Furthermore, vRS is defined as:
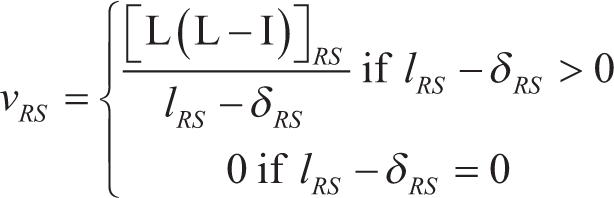
or alternatively,
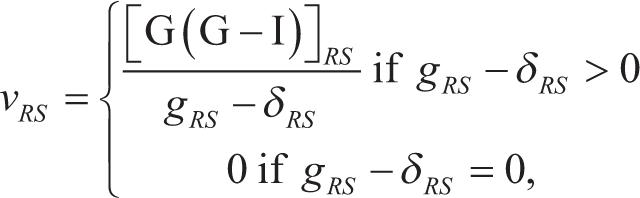
where L and G are the global Leontief and Ghosh inverse matrices, respectively. lRS is the RSth element of the global Leontief inverse matrix and gRS is the RSth element of the global Ghosh inverse matrix, both describing the degree of influence that country S (R) has on country R (S) in the trade network. δRS denotes the Kronecker delta, which takes on a value 1 when R = S (indicating an intra-regional relationship) and 0 otherwise.
According to Equations 3(a)-3(c), the normalised index for APL as defined by IR1 provides the sum of the propagation indices of all countries (regions) in the global economic system, as shown in Equation 3(d):
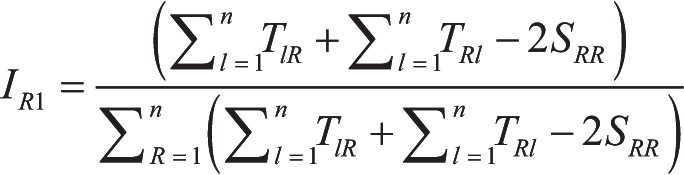
where Σ n l = 1 TlR represents the backward APL of the country R. It quantifies the number of inter-country interactions triggered by a change in the final demand within country R, indicating the depth of backward linkages. Σ n l = 1 TRl represents the forward APL of the country R. It measures the number of inter-country interactions resulting from a change in primary cost within the country R, capturing the extent of forward linkages. 2SRR corresponds to twice the value of the diagonal element of the APL matrix. It reflects inter-country propagation effects, which are significant for understanding domestic interdependence. n is the total number of countries in the global economic system, representing the scope of the trade network being analysed.
By subtracting the diagonal element twice (i.e., 2SRR), the initial self-effect of an exogenous change in country R—whether forward or backward—is removed. This adjustment eliminates direct self-linkages, ensuring the model focuses exclusively on inter-country trade interactions and enabling a cleaner analysis of external trade dynamics. This component measures the number of countries a nation is connected to, either as a consumer (backward) or as a producer (forward) in international trade. Its main purpose is to distribute the impact of allocated funds across the global economy through a given country. The more extensive a country’s trade linkages, the higher its priority in influencing global economic dynamics, underscoring the role of trade interconnectedness in determining economic importance and resource allocation.
Component II: Economic Impact
To assess the economic impact, we use the global output multiplier ratio as defined by Equation 4, derived from ICIO. The global output multiplier for each country or region is calculated using the global Leontief inverse matrix. Consequently, the normalised global output multiplier for each country is determined by Equation 4:
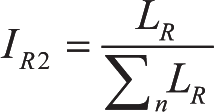
When the global output multiplier approaches unity, it indicates that the country has a highly complex interconnectedness and significant dependencies on other countries or regions within the framework of international trade as defined by ICIO. Therefore, this component serves as an indicator of the extent to which a country influences the global economic system.
Component III: Country Size
This study utilises the output (x vector) to quantify a country’s size in relation to the global economy, defined as follows:
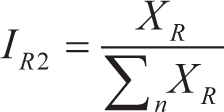
As this metric nears unity, the economic significance of the country increases. Consequently, this index identifies countries that warrant a higher priority for receiving additional goods and services to stimulate international trade.
Data and Results
Data
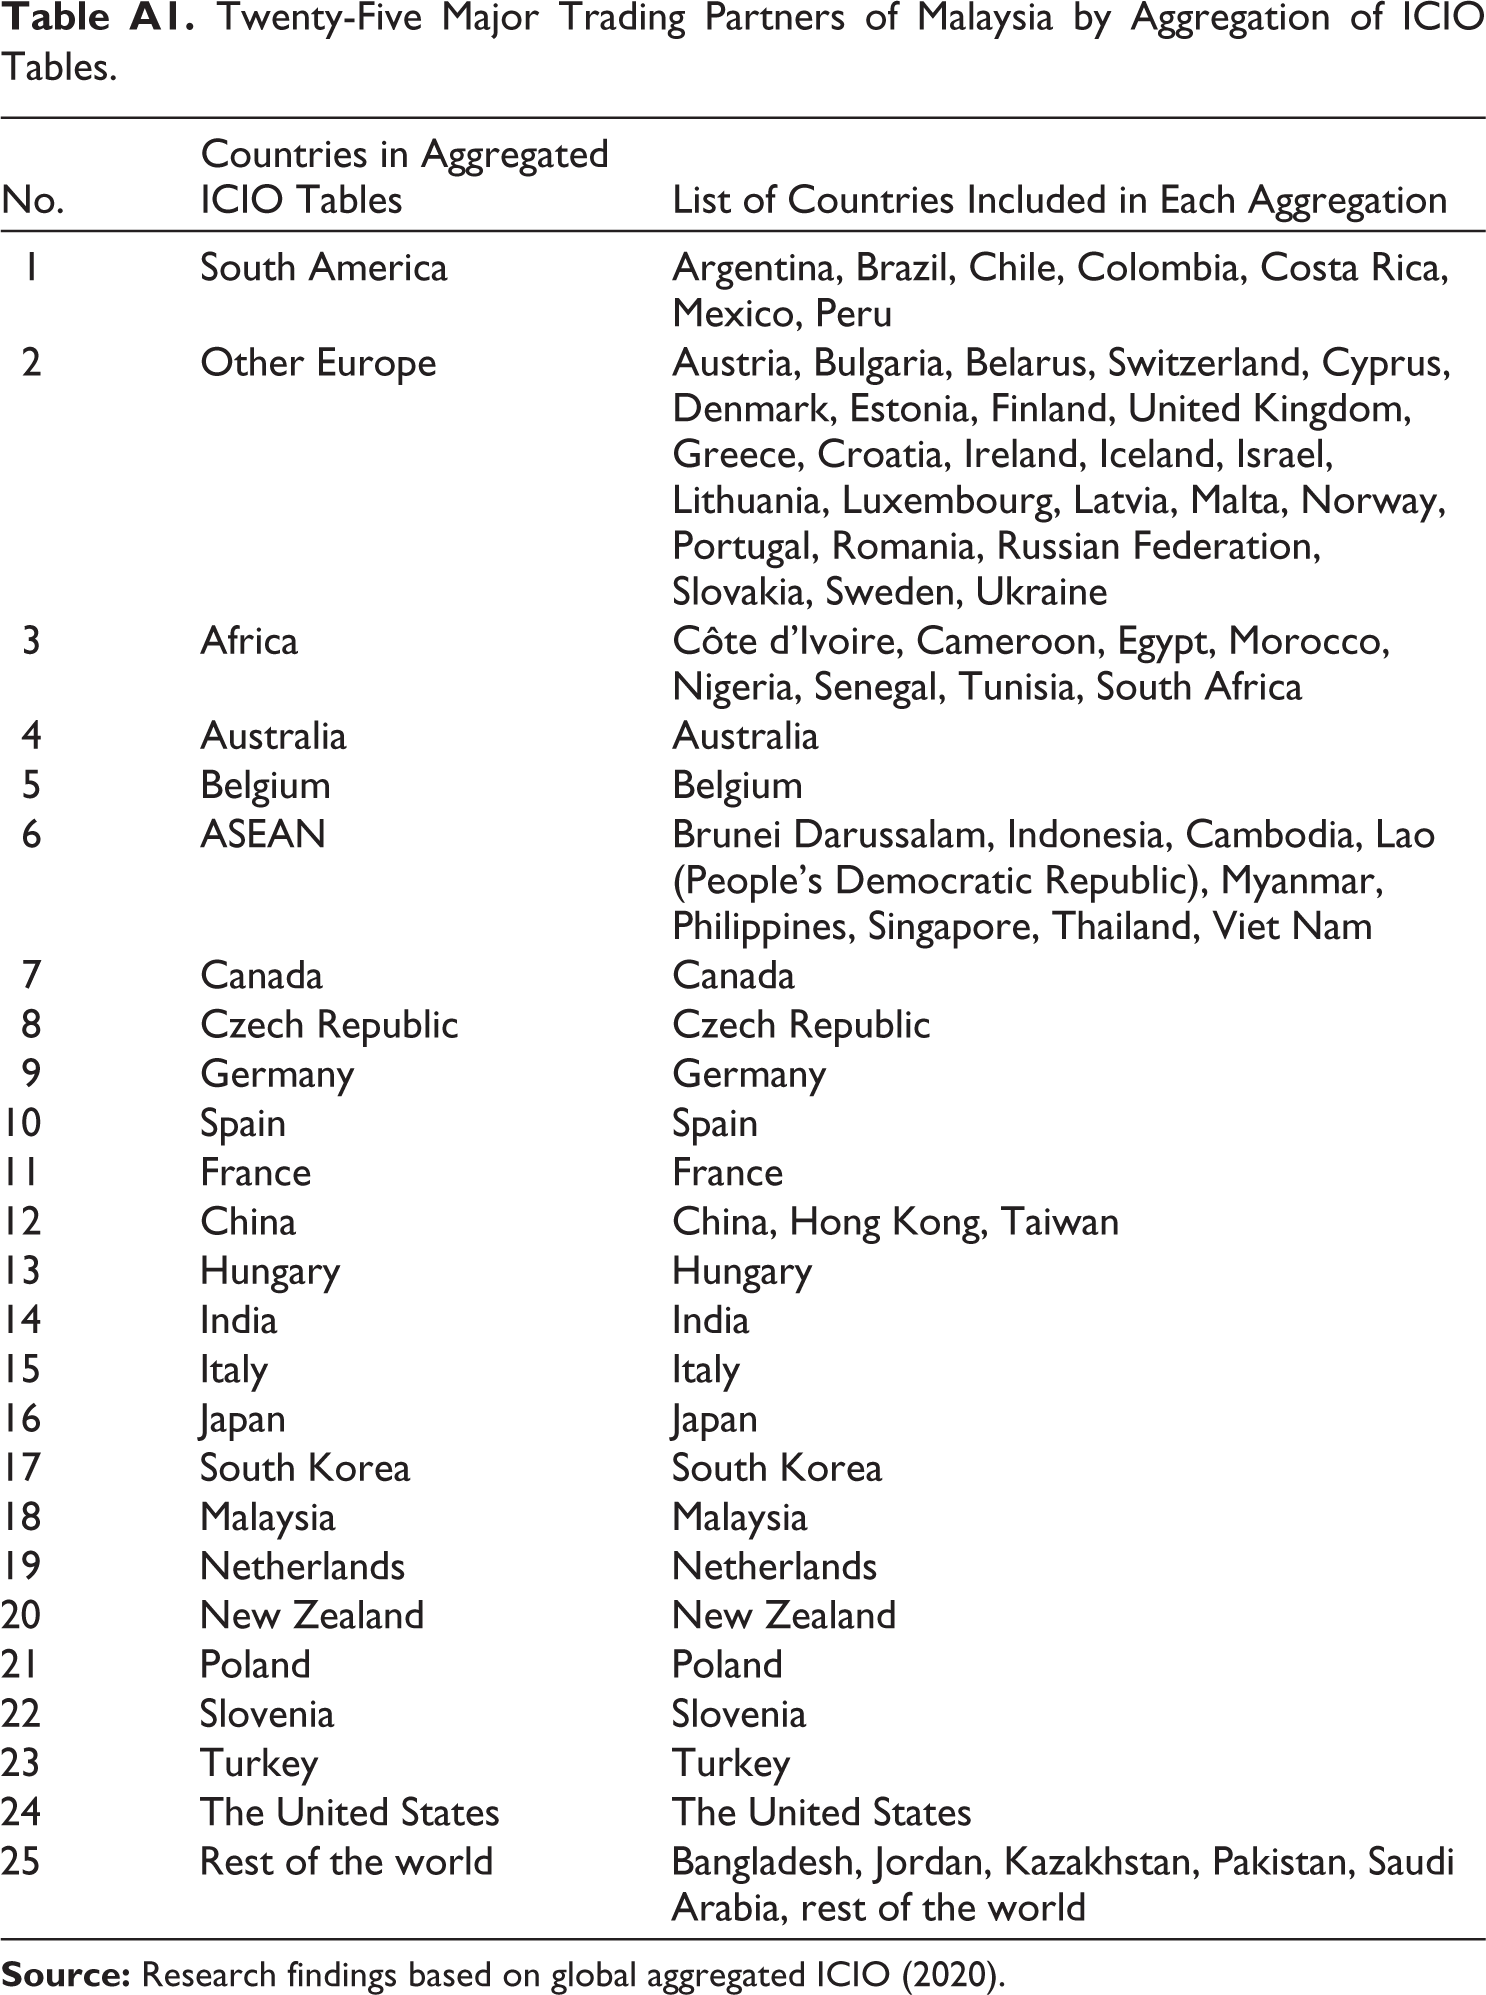
This study utilises the OECD’s ICIO tables for 2020, the most recent version available, which provides a consistent framework for mapping international flows of goods and services across countries (OECD, 2025). The data set covers 76 countries plus the rest of the world and 45 economic activities. For this analysis, the table is aggregated to focus on Malaysia’s 25 major trade partners, as reported in Malaysia External Trade Statistics (2024) and Trade Performance of Malaysia (2020), accounting for specific economic activities. 2
Aggregating economic activities in the ICIO tables simplifies complex data, eases analysis of trade flows and inter-country interactions, and emphasises major trade partners and their global economic significance. This country-centric approach aids policymakers in trade agreements, economic strategies and international collaboration, while ensuring data consistency and cross-country comparability, aligning with the study’s objectives outlined in the introduction section.
Results
As outlined in the introduction section, this study addresses the policy question: Which nations, regions or international organisations could serve as key trade partners to sustain Malaysia’s trade-led economic growth? To answer this, two methods are employed. The first method evaluates trade interdependency by simulating the complete hypothetical removal of one country or region from the global economy—the GEM. This approach quantifies the resulting reduction in Malaysia’s output, revealing which countries or regions exert the greatest impact on Malaysia’s economy. It also enables ranking countries or regions by the size of Malaysia’s output reduction after each extraction, assessing the effect of each extraction on global output and determining Malaysia’s average position in the international trade network. Table 1 reports the reduction in Malaysia’s output (in million USD) following the global extraction of various countries. Countries are ranked by the magnitude of this output reduction: a higher rank indicates greater output loss for Malaysia and thus stronger trade and economic interdependence.
Reduction in the Output of Malaysia After Global Extraction (Results by Country/Region, in Million USD).
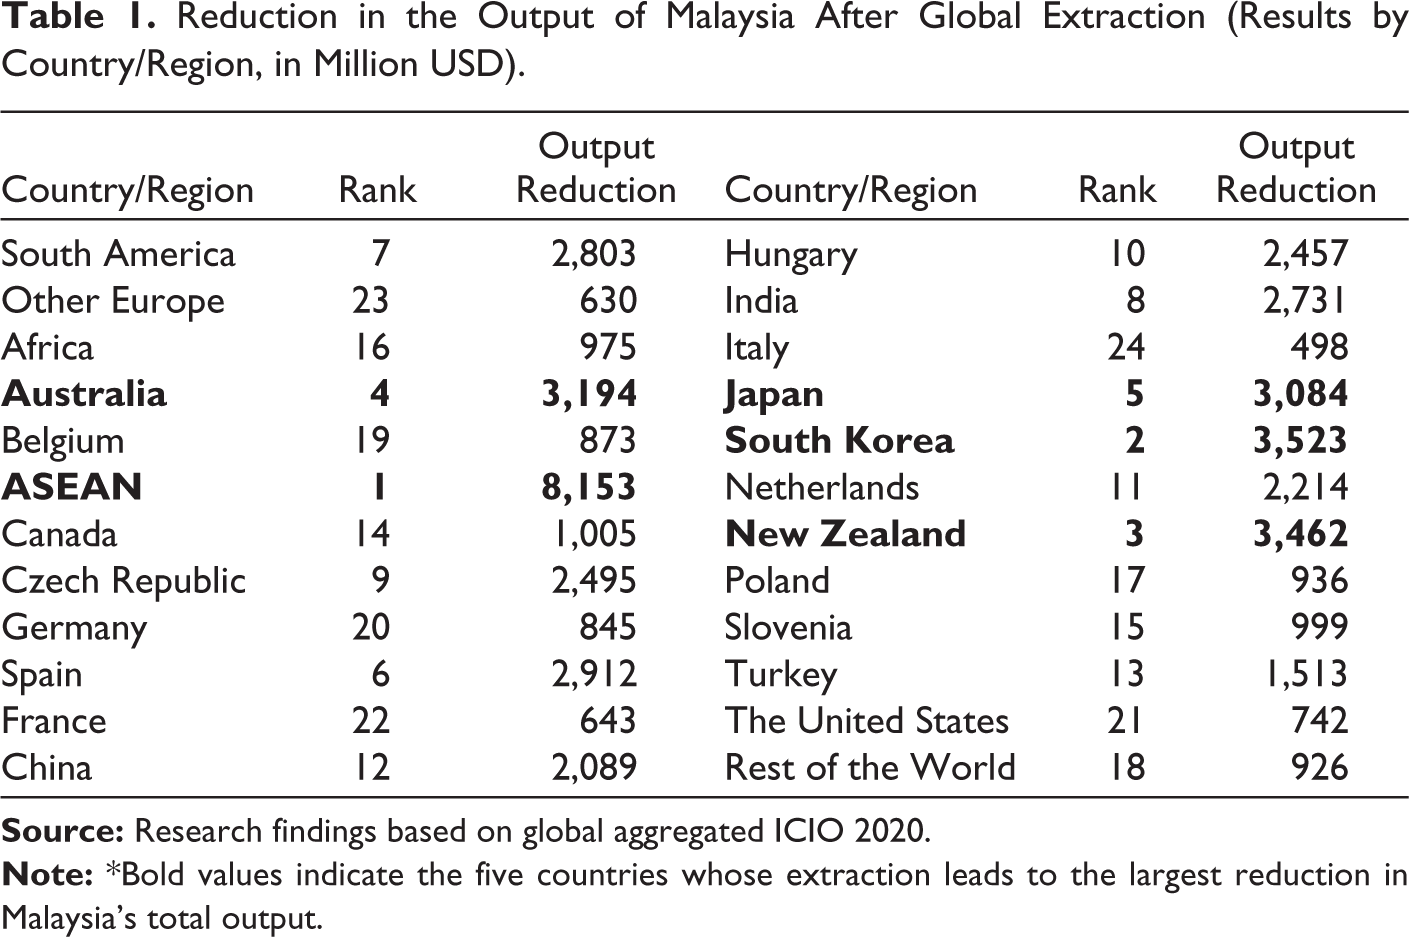
According to the GEM results (Table 1), ASEAN ranks first and registers the largest output reduction for Malaysia at $8,153m. This figure shows deep regional economic interdependence; any economic shock in Malaysia would create substantial reverberations across the entire ASEAN bloc. South Korea ranks second with $3,523m and demonstrates strong bilateral trade reliance. New Zealand ranks third at $3,462m. Despite the geographical distance, this result reveals substantial trade flows, likely in specific commodities or specialised industries, and points to a stronger economic bond than commonly perceived. Australia ranks fourth with $3,194m and confirms its vital role as a major trade partner. Geographical proximity and shared economic interests drive this significant relationship across various sectors. Japan ranks fifth at $3,084m and confirms its status as a major economic partner. Thus, the top-five key trade partners that exert the greatest influence on Malaysia’s output are ASEAN, South Korea, New Zealand, Australia and Japan.
According to Table 2, among the top-five trade partners (ASEAN, South Korea, New Zealand, Australia and Japan), China registers the highest output reduction after extraction from the global economy, followed by the United States (second) and Europe (third).
Reduction in Top-five Trade Partners’ Output of Malaysia after Global Extraction (Results by Country/Region, in Million USD).
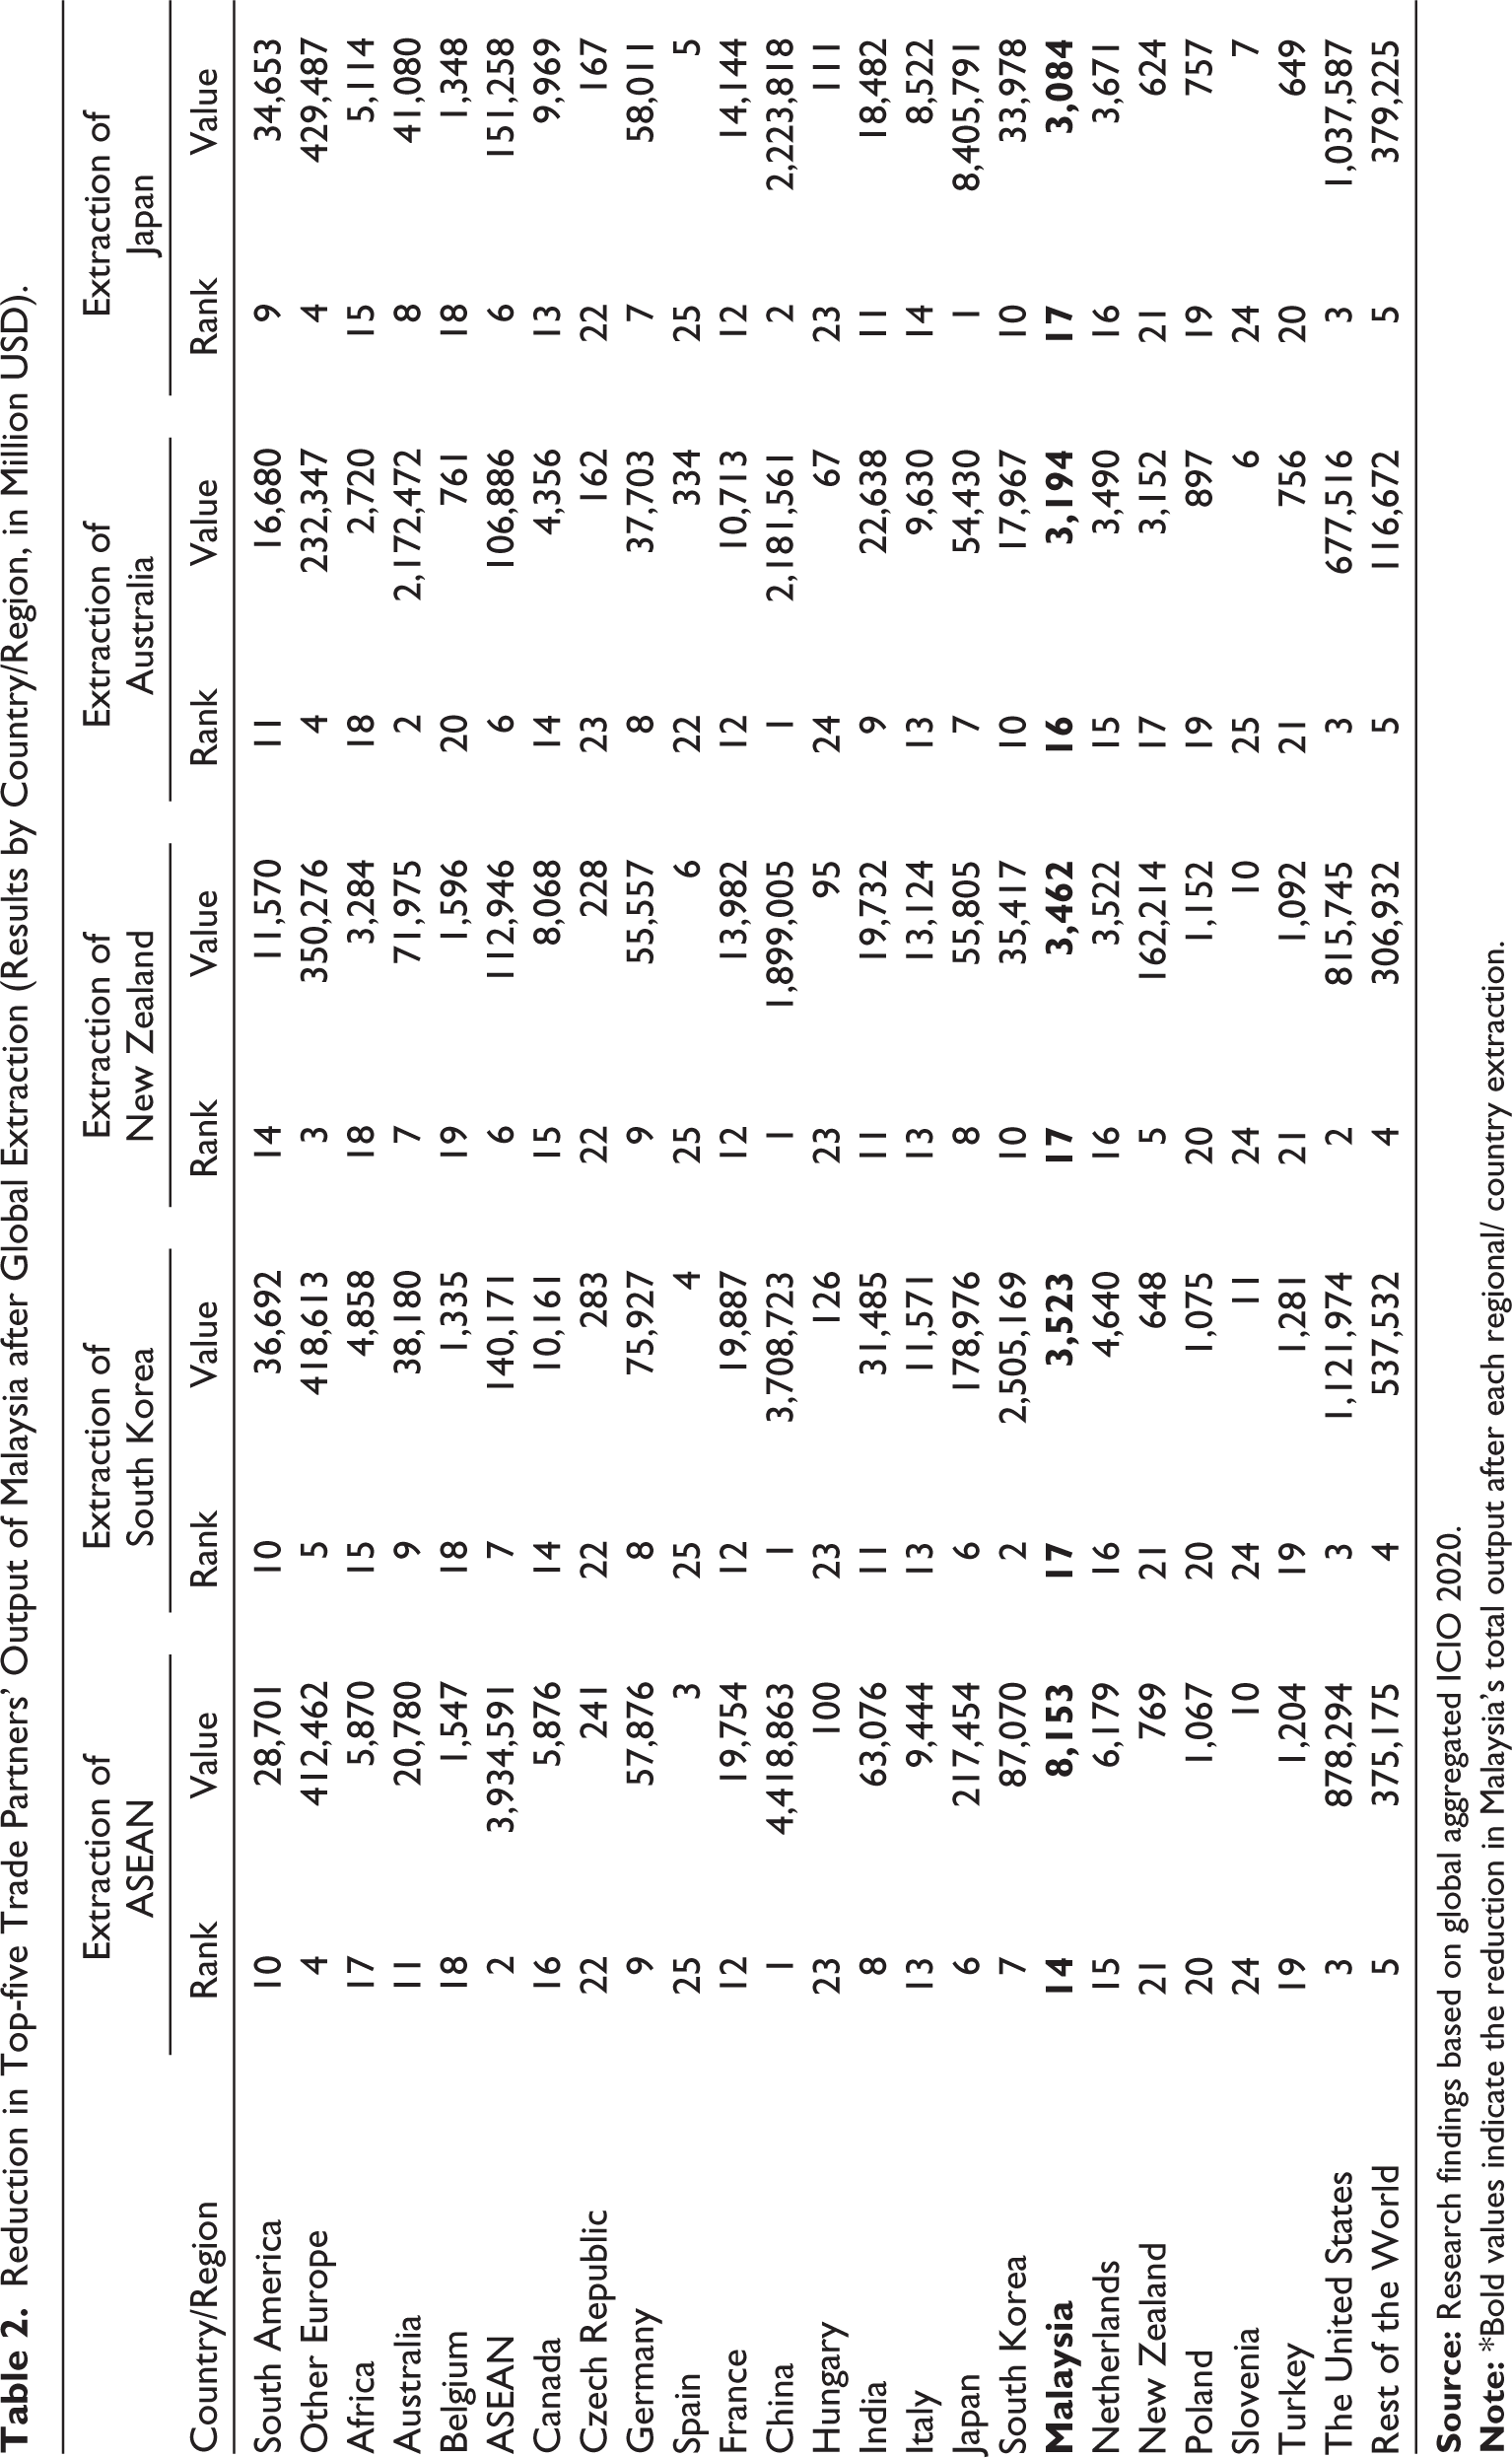
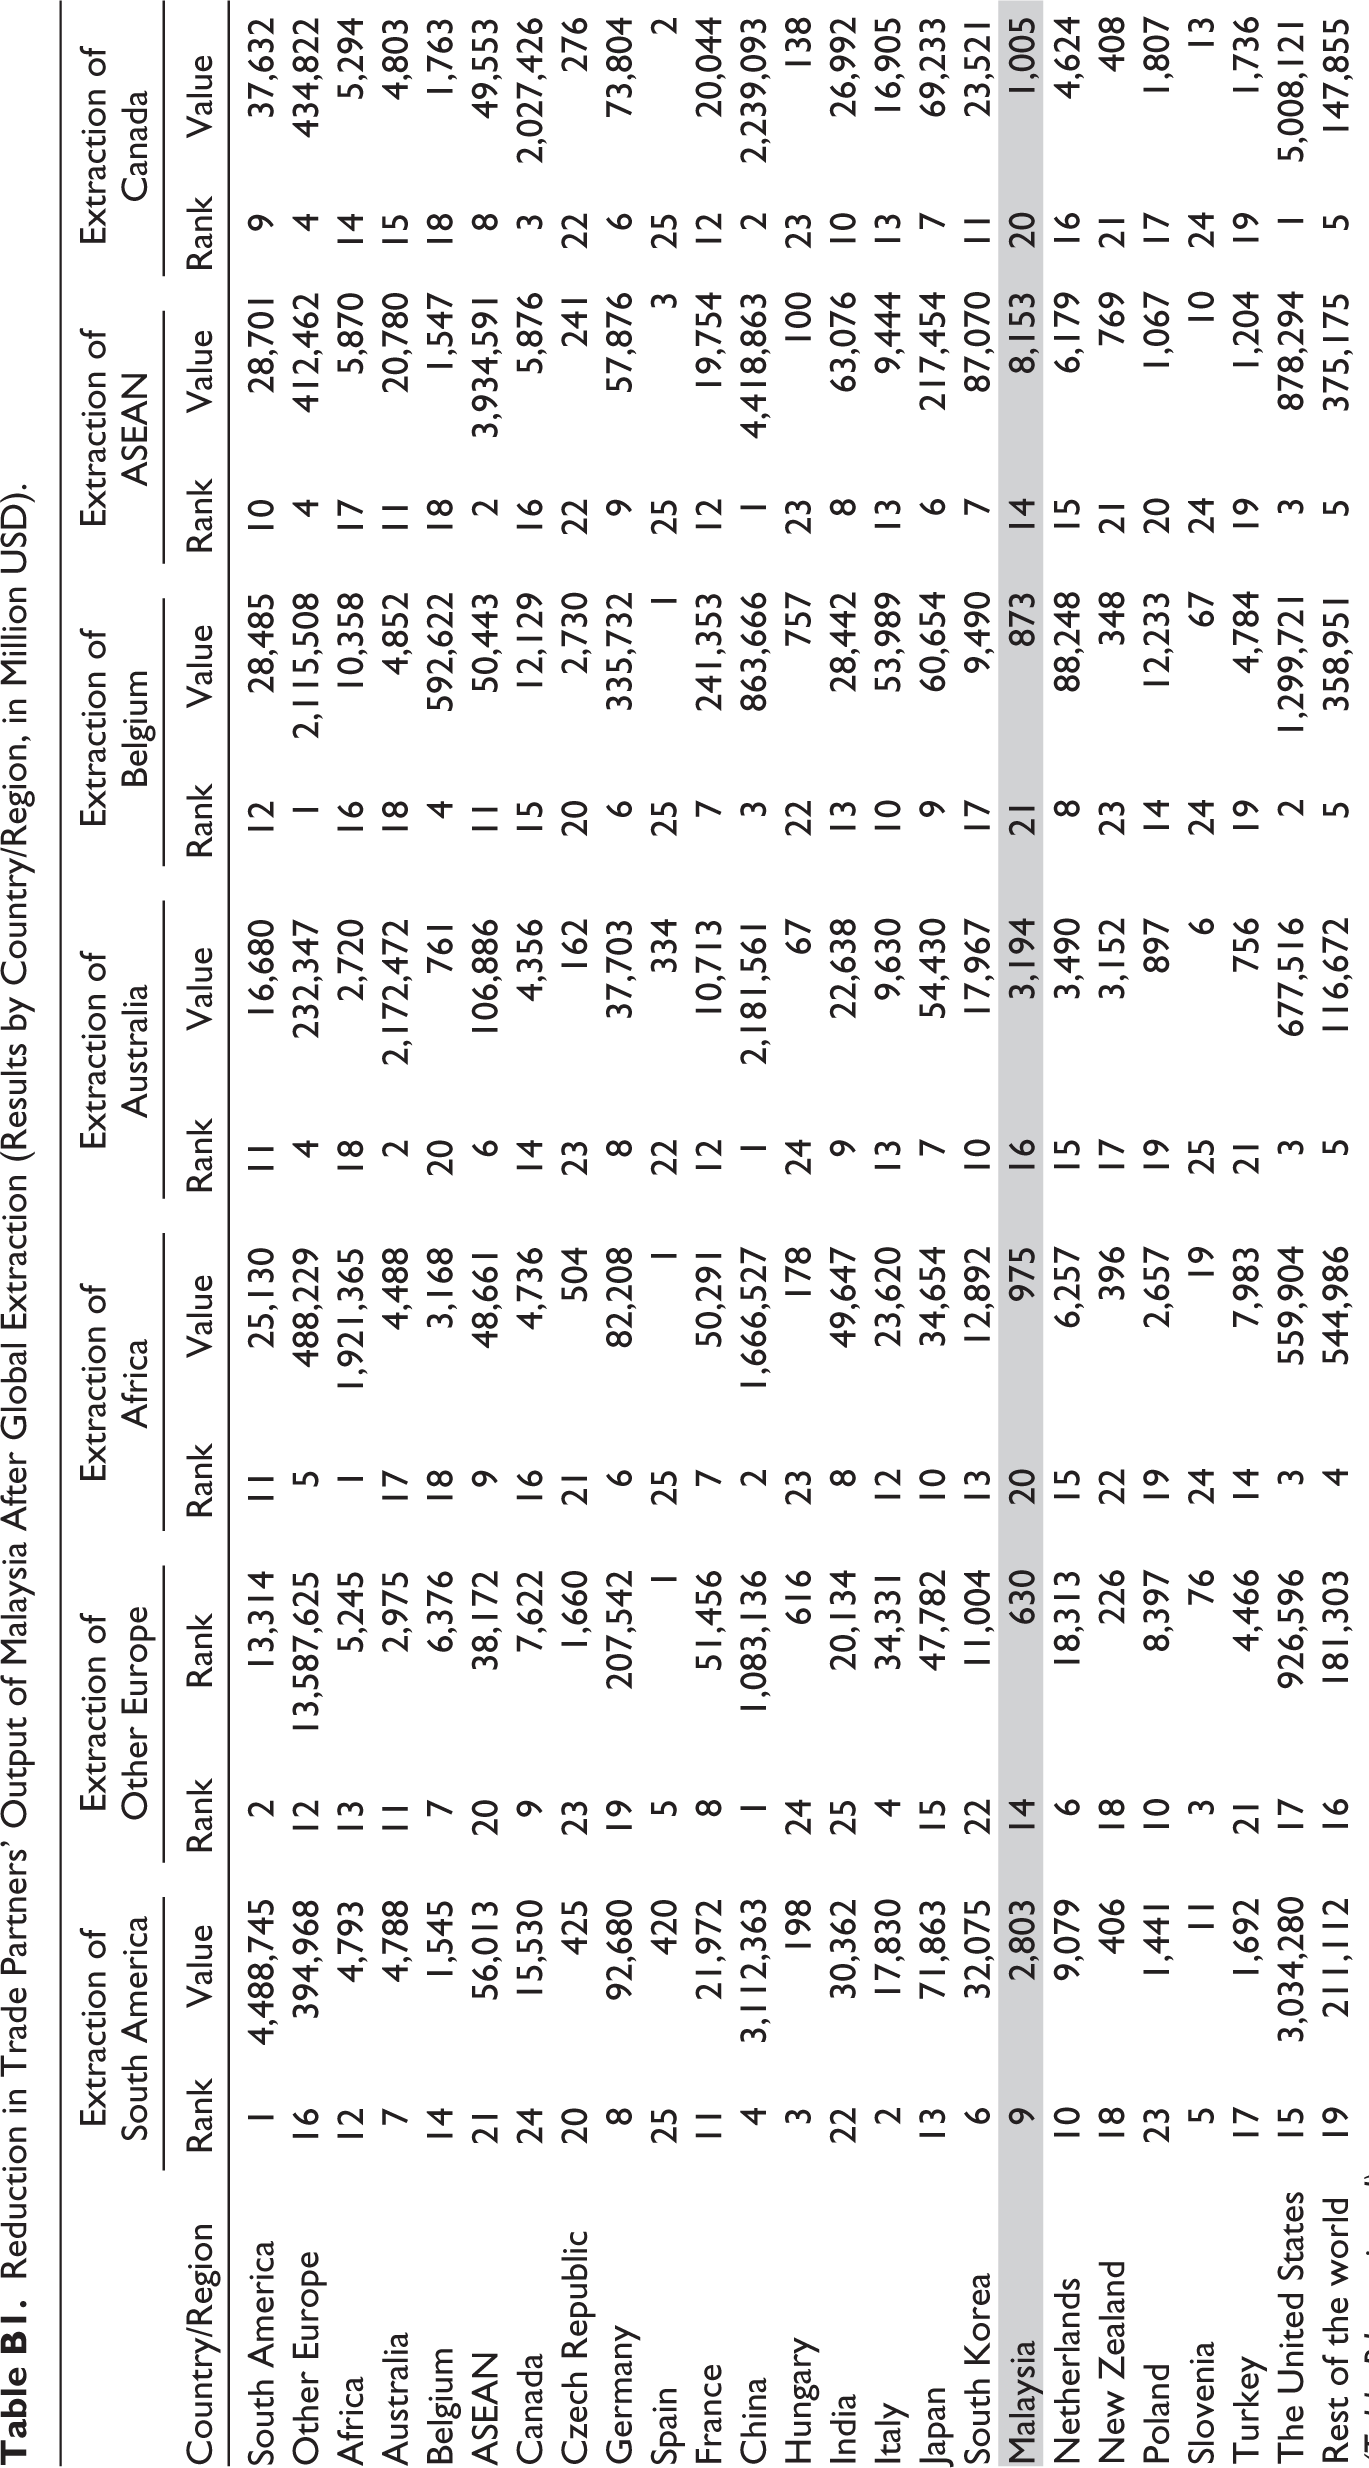
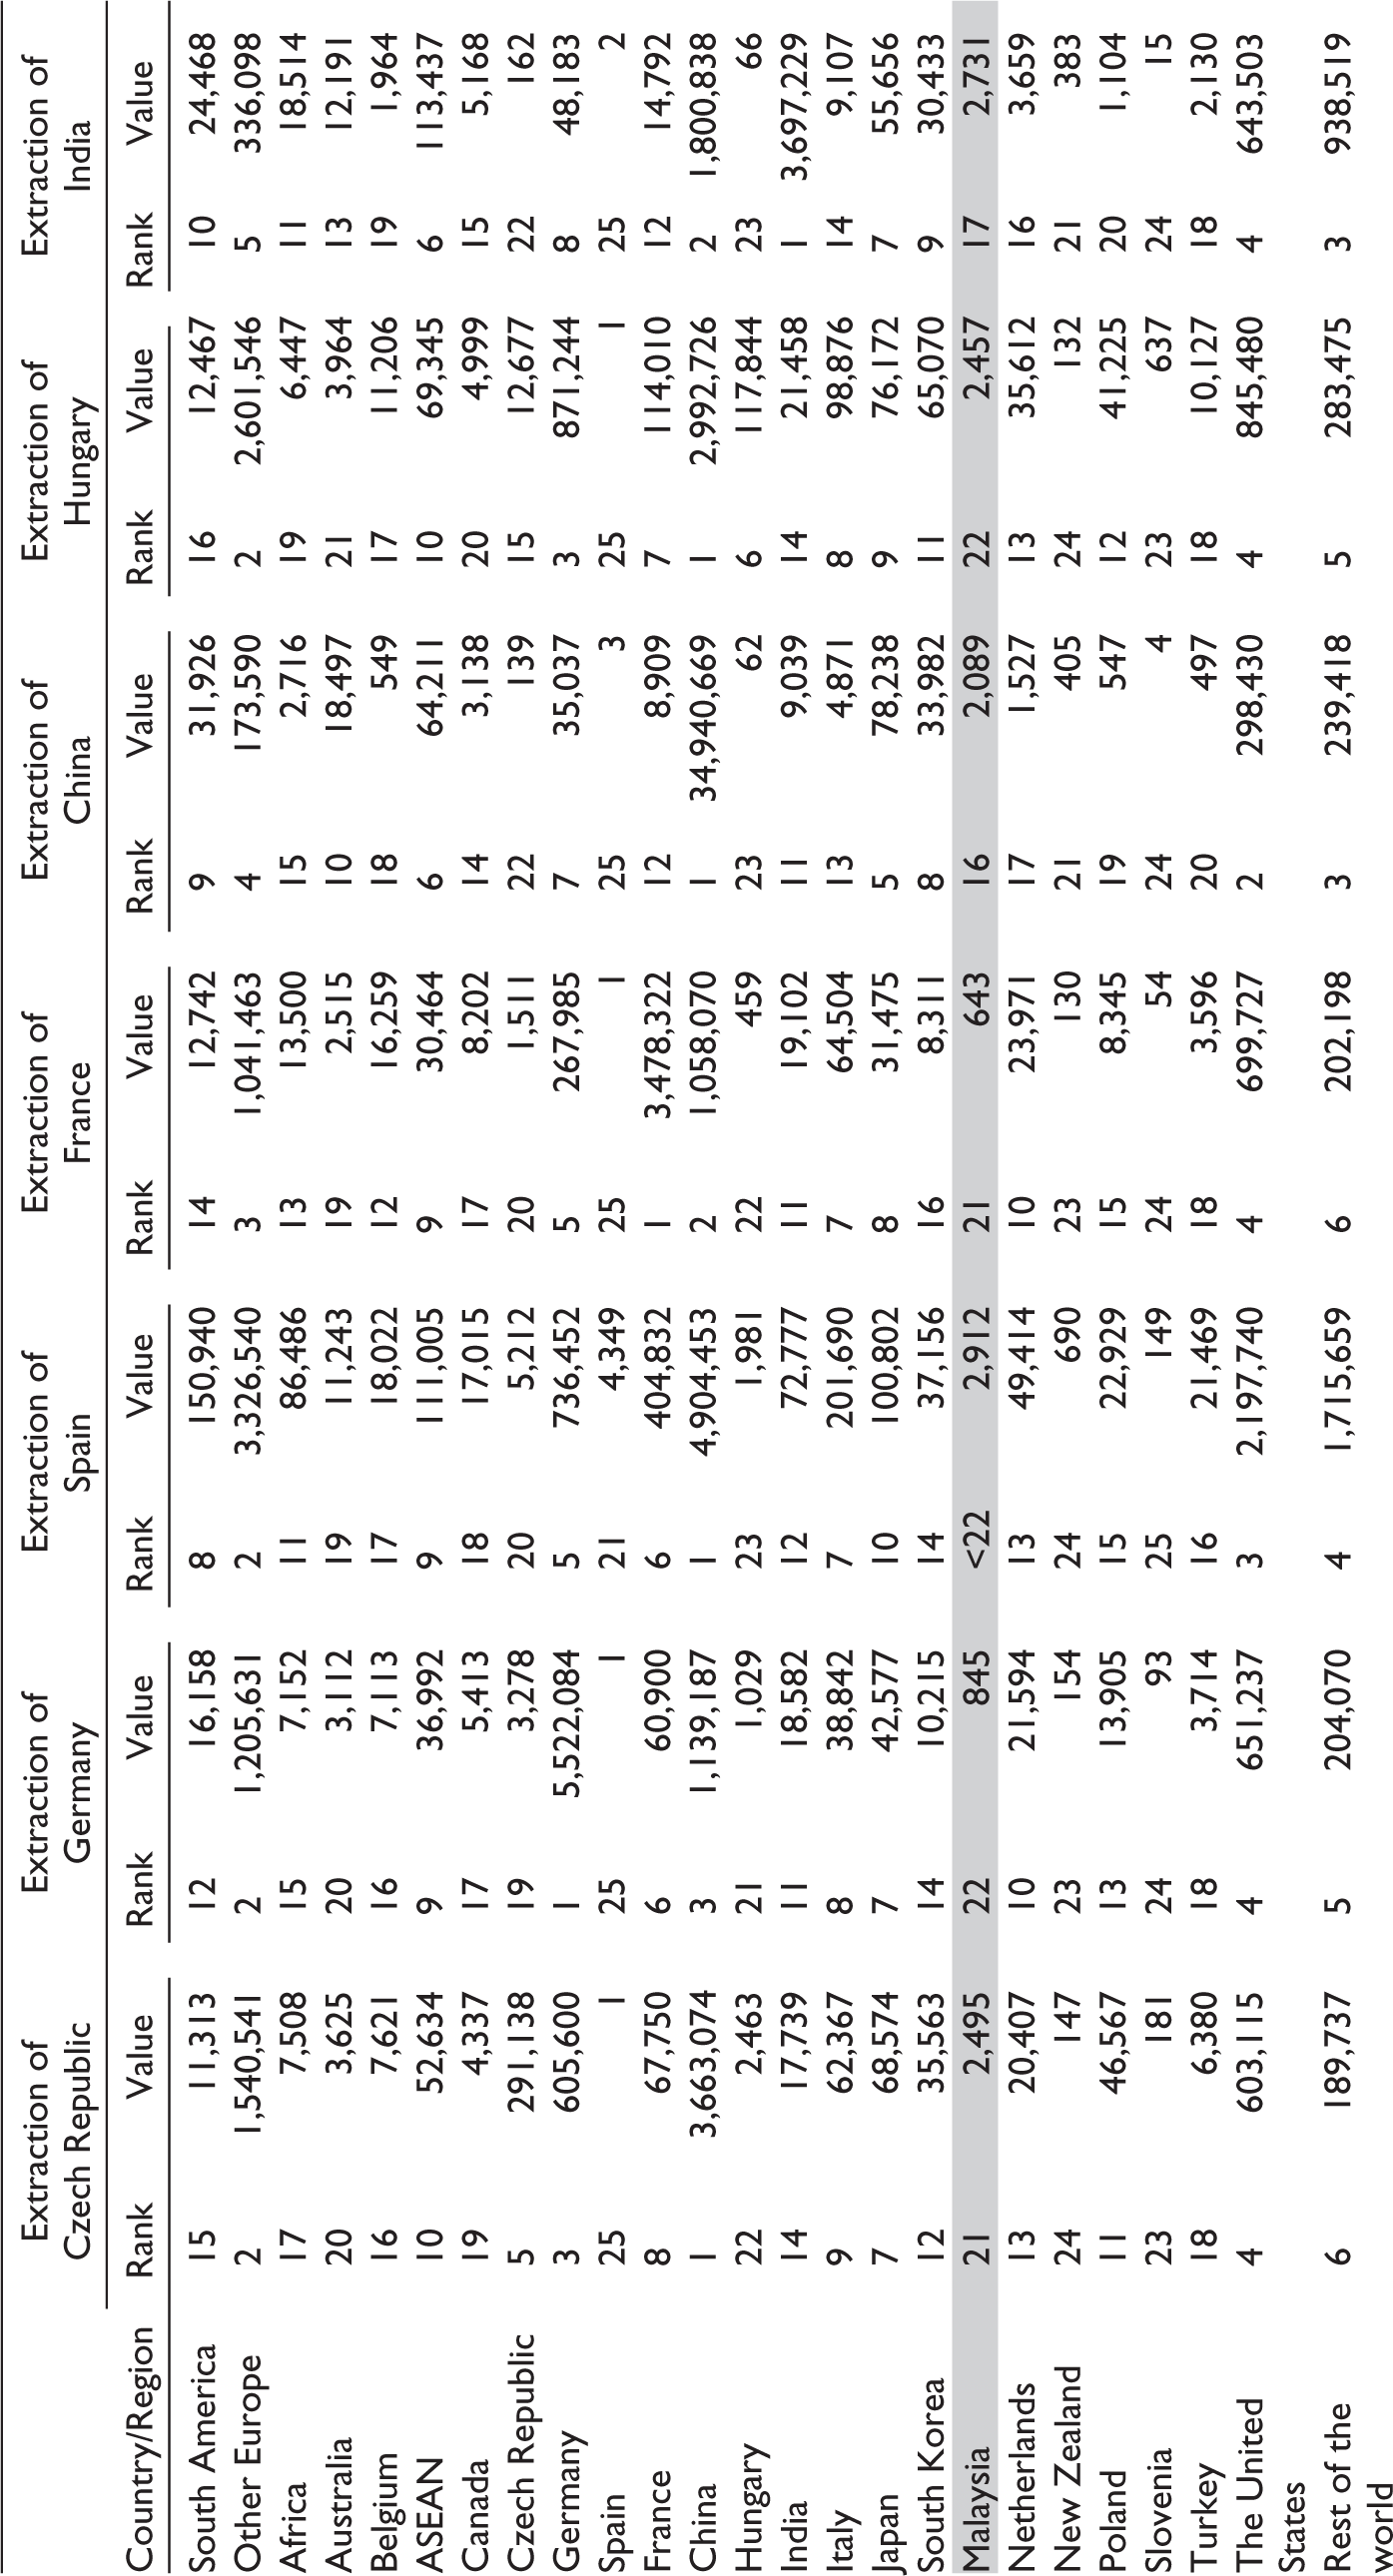
Malaysia’s average ranking in output reduction within the international trade system after the extraction of these five entities stands at 16. Across the full set of 24 countries (or regions), Malaysia’s overall ranking is 19 (see Appendix B for details).
The second method, the ITII, evaluates the economic influence of Malaysia’s trade partners on the global economy and complements the first method (GEM). ITII applies the APL—introduced earlier in the ‘Mathematical Frameworks’ section—to measure both the distance and the size of trade linkages between partners in the global system. By also incorporating global multipliers and country size, ITII highlights additional criteria relevant to identifying key trade partners for Malaysia.
Based on ITII, Table 3 presents four columns: the three main components of ITII and the final composite ITII, which identifies Malaysia’s key trade partners. Component I (APL) measures the scope and distance of global linkages. New Zealand ranks first, followed by China (second) and the rest of the world (third). These rankings reflect the significant reach and potential global trade impacts of their multipliers. Component II (economic impact) uses normalised global multipliers to show direct and indirect effects on the global output. New Zealand again ranks the highest, followed by China (second) and Other Europe (third). Component III (country/region size) reflects the normalised share of output in the global economy. China, the United States and Other Europe hold the top-three positions among the 25 countries or regions analysed.
Intercountry Trade Impact Index (ITII): Components and Index Values.

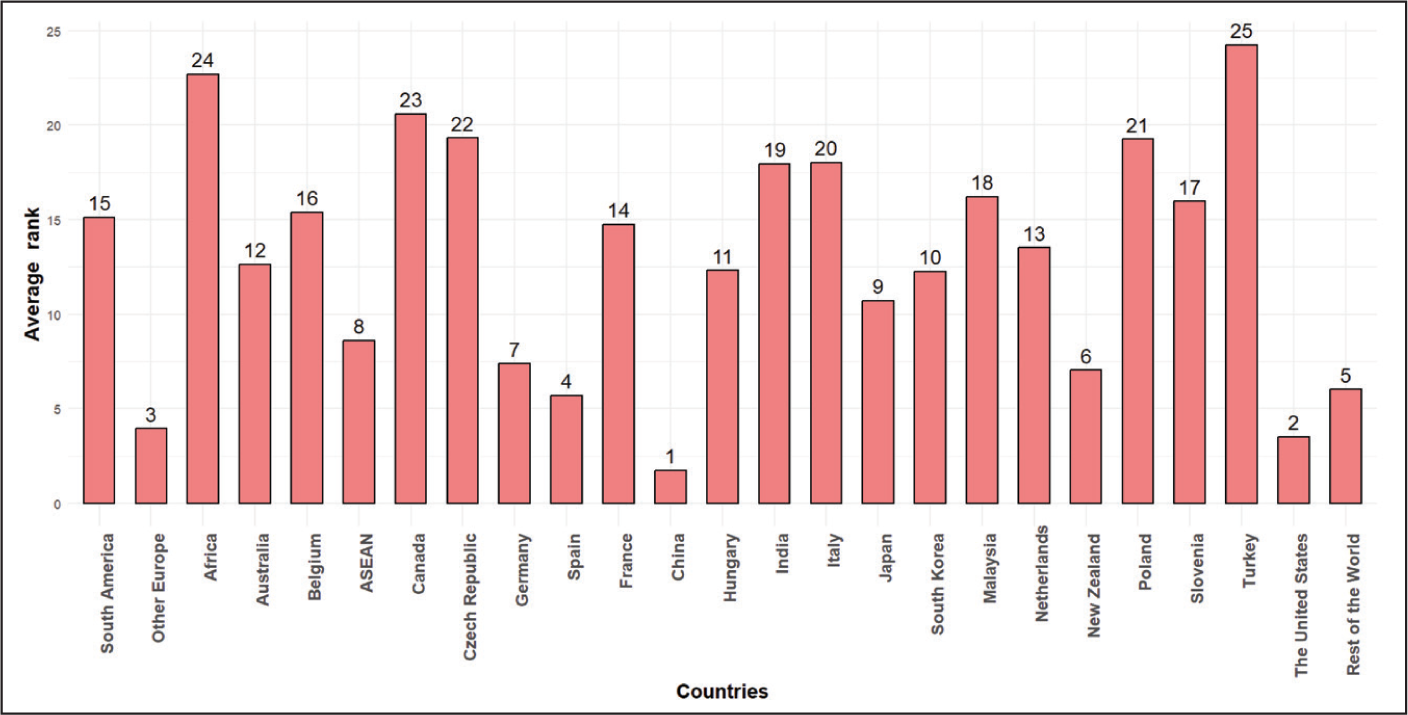
The fourth column of Table 3 shows the composite ITII, which combines the three components under equal weights. This index determines the overall ranking of Malaysia’s trade partners. China ranks first, reflecting the highest overall trade impact on the global economy. New Zealand and the United States hold second and third positions, respectively. Other Europe and the rest of the world rank fourth and fifth, respectively. Equal weighting of the three factors is not fully realistic. A sensitivity analysis via Monte Carlo simulation tests the ranking stability under varying weights generated with the R programming language (see Appendix C). Figure 1 displays the range of simulated average rankings. The results show minimal change: China remains firmly first; the United States and New Zealand stay second and third, respectively (in either order); and Other Europe and the rest of the world exhibit stable, closely matched positions across weight scenarios.
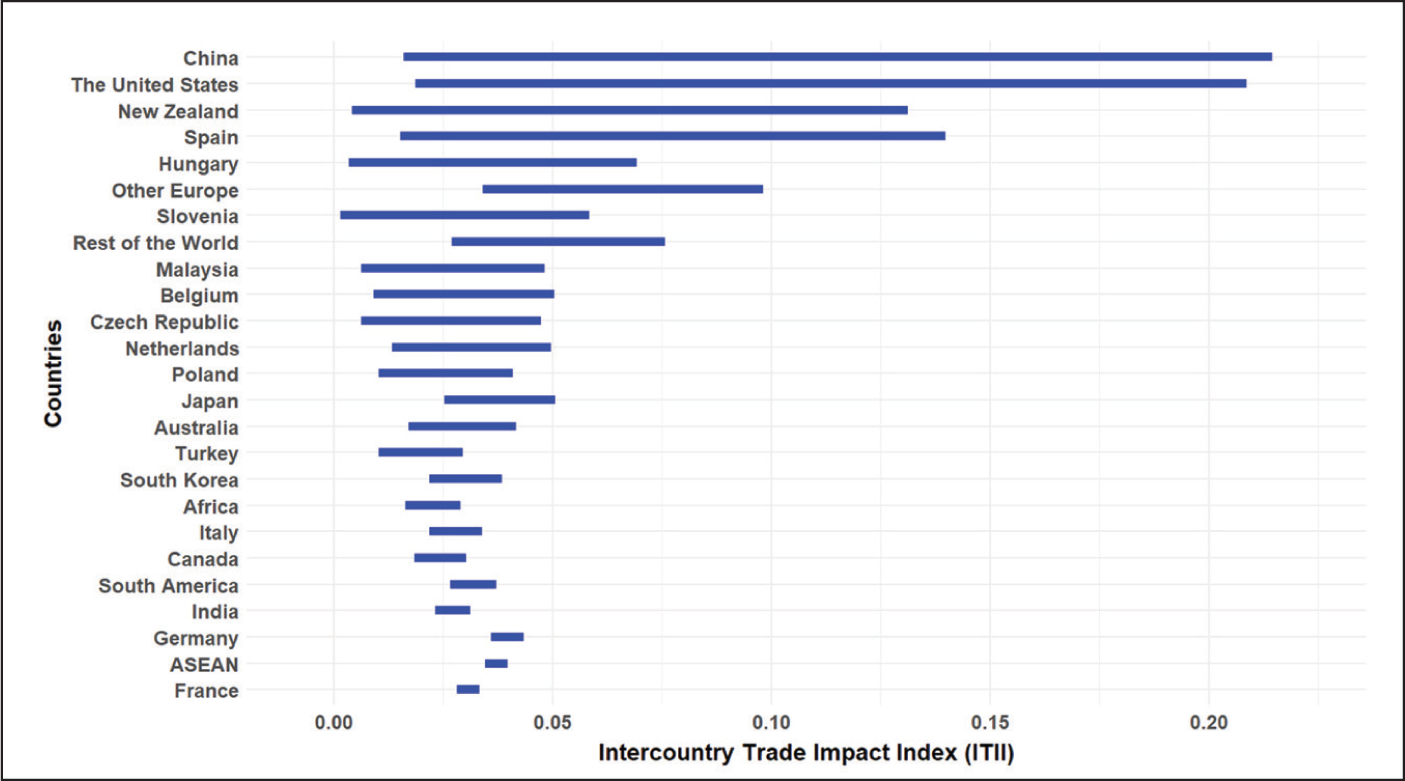
To further examine the ITII, a sensitivity analysis was performed using a Tornado diagram generated with the R programming language (see Appendix D). This approach evaluates how variations in ITII values affect country rankings. The analysis identifies the nations that consistently hold high or low ranks regardless of weight changes and countries whose rankings prove highly sensitive to shifts in weight preferences.
Figure 2 illustrates the range of possible ranks for each country under varying weights in the ITII. China exhibits the highest sensitivity, with its maximum ITII value surpassing all others, while the United States shows the second-highest sensitivity and experiences notable rank shifts depending on weight adjustments. New Zealand ranks third in sensitivity and maintains its position consistently, even under equal-weight scenarios. Figure 2 also orders countries by overall ranking volatility, from most to least volatile. These results closely match the original ITII findings, reinforce the identification of Malaysia’s key trade partners and highlight both the role of intercountry trade dynamics and the influence of methodological choices on rankings, thereby supporting the robustness of the framework.
Concluding Remarks and Policy Recommendations
This study builds on national reports on Malaysian trade policies (Trade Performance of Malaysia, 2020; Malaysia Trade Summary: WITS, 2025; World Bank, 2025), which traditionally highlight 25 countries as key trade partners under bilateral or multilateral agreements. Yet, a critical question arises: Does trade volume alone truly identify Malaysia’s most strategic partners? To address this, the study applies two advanced methods using the ICIO database. The first, the GEM, assesses the impact of removing individual partners from Malaysia’s trade network, identifying those whose absence would most reduce national output. The second, the ITII, incorporates factors such as APL, multiplier effects and country size to rank partners by systemic importance. Together, these approaches provide a more nuanced evaluation of Malaysia’s trade dependencies. Table 4 compares traditional trade-volume rankings with those generated by the two methodological approaches.
Table 4 highlights notable disparities between trade partner rankings derived from national reports and those obtained through this study’s methodologies. For instance, New Zealand ranks 3rd and 2nd under the GEM and ITII, respectively, yet is no higher than 16th in national reports. At the same time, several partners—such as ASEAN, the United States, Japan and South Korea—consistently remain highly ranked across both sources, reaffirming their pivotal roles in Malaysia’s trade landscape.
Ranking of Countries.
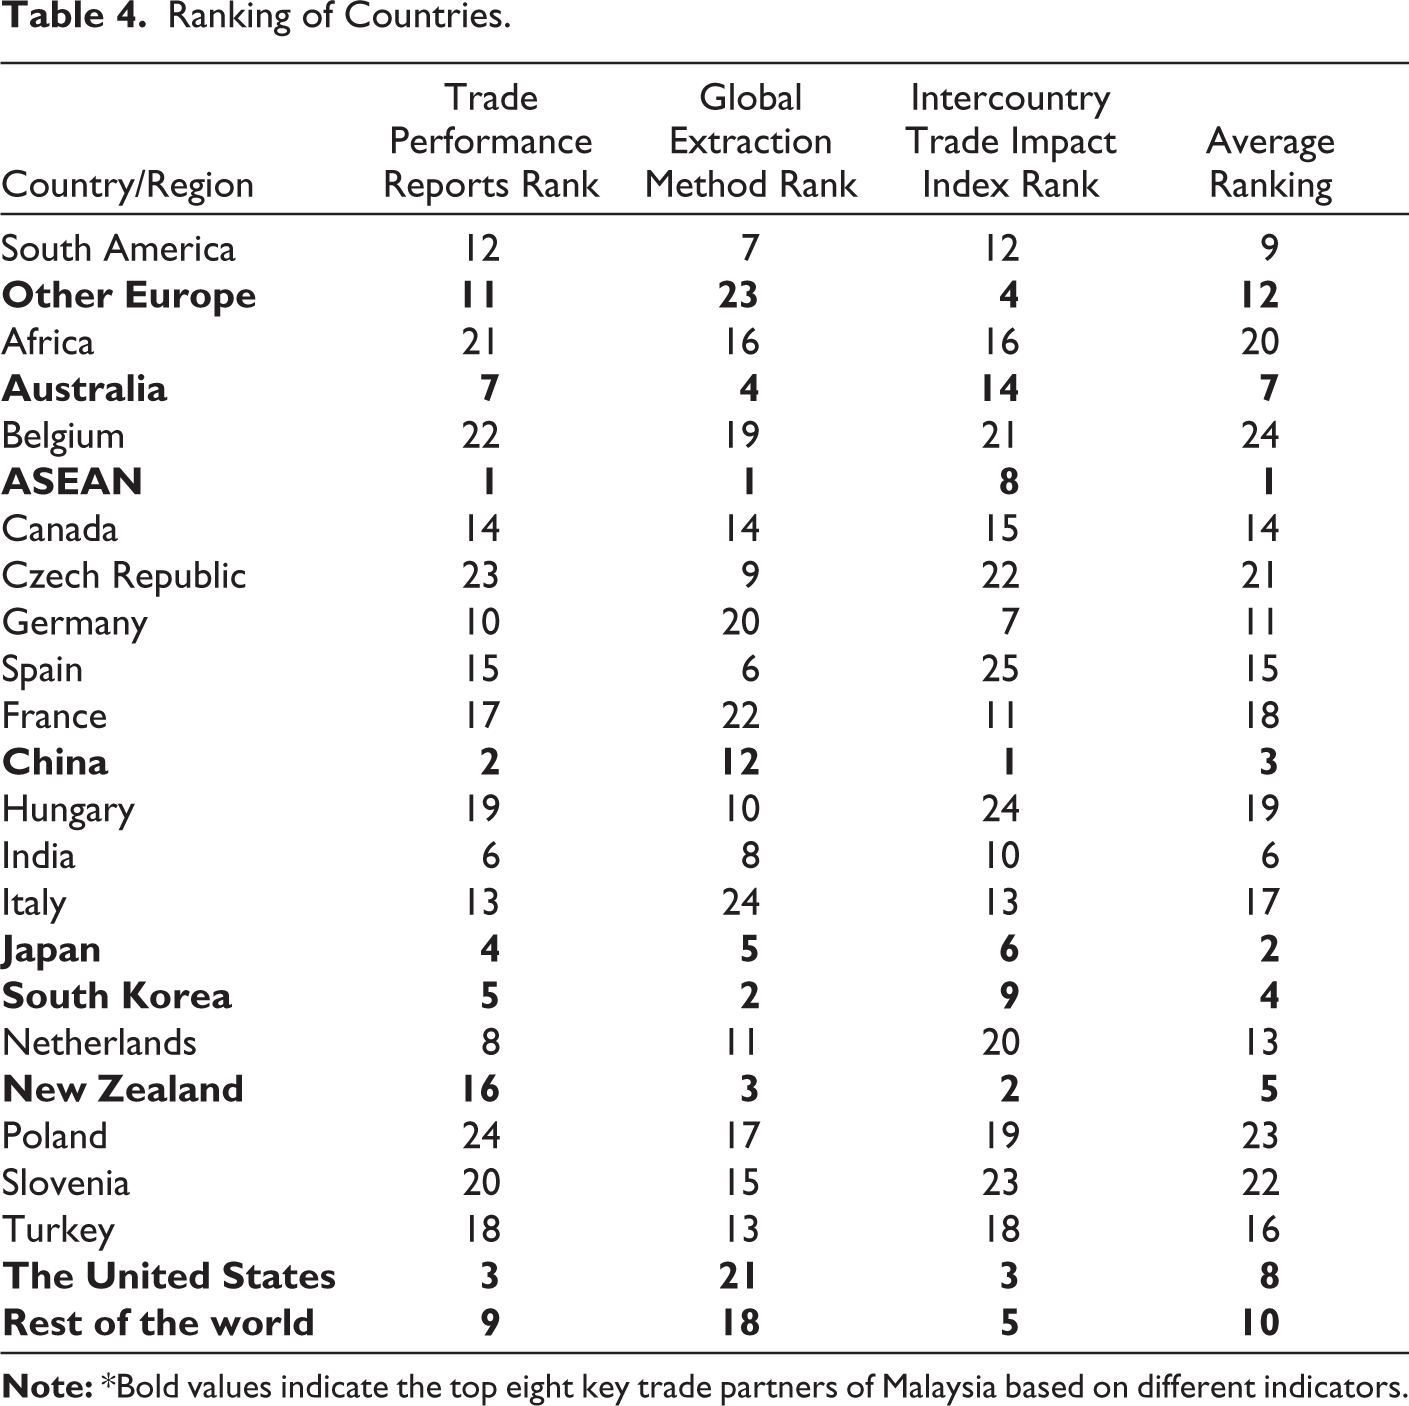
From a policy perspective, three approaches to identifying Malaysia’s key partners emerge. The first is a traditional reliance on trade performance reports and trade volume, which offers continuity but risks overlooking smaller yet strategically important partners and fails to capture the dynamic structure of global trade. The second involves the GEM, which quantifies the impact of losing access to specific markets and highlights countries with strong interdependencies, including ASEAN, South Korea, New Zealand, Australia and Japan. This approach underscores the importance of interconnectedness in sustaining Malaysia’s output. The third approach employs the ITII, which emphasises partners such as China, New Zealand, the United States, Europe and the rest of the world, based on their systemic influence, economic size and network connectivity. While valuable, this method also highlights the risks of heightened exposure to external shocks from globally dominant economies.
Hence, this study recommends that Malaysian policymakers trade with their key partners who can help with Malaysia’s domestic output and have similar economic structures and close geographical distance; use the GEM; and choose ASEAN, South Korea, New Zealand, Australia and Japan as key trade partners. If they pursue finding some countries to trade with, economic and political powers, China, New Zealand, the United States, Other Europe and the rest of the world might be selected. However, as mentioned, most of these countries experience more instability, like the countries in the rest of the world, and their economic structures are different from Malaysia’s. As a final point, the average ranking for all approaches shows that countries such as the ASEAN organisation, Japan, China, South Korea and New Zealand can be the key trade partners of Malaysia based on all these approaches.
Finally, this study recommends that Malaysian policymakers consider distinct strategies for selecting key trade partners based on their objectives. For fostering partnerships that align with Malaysia’s domestic output, economic structure and geographical proximity, the GEM suggests ASEAN, South Korea, New Zealand, Australia and Japan as major trade partners. Conversely, if the goal is to engage with countries wielding significant economic and political influence, partners such as China, New Zealand, the United States, Other Europe and the rest of the world may be prioritised. However, it is important to note that many of these nations, particularly in the rest of the world, face higher levels of instability and possess economic structures that differ significantly from that of Malaysia. Finally, the average rankings across all approaches highlight ASEAN, Japan, China, South Korea and New Zealand as consistent key trade partners, offering a balanced perspective for Malaysia’s trade strategy.
Footnotes
Declaration of Conflicting Interests
The author declared no potential conflicts of interest with respect to the research, authorship and/or publication of this article.
Funding
The author received no financial support for the research, authorship and/or publication of this article.
Appendix A
Twenty-Five Major Trading Partners of Malaysia by Aggregation of ICIO Tables.
| No. | Countries in Aggregated ICIO Tables | List of Countries Included in Each Aggregation |
| 1 | South America | Argentina, Brazil, Chile, Colombia, Costa Rica, Mexico, Peru |
| 2 | Other Europe | Austria, Bulgaria, Belarus, Switzerland, Cyprus, Denmark, Estonia, Finland, United Kingdom, Greece, Croatia, Ireland, Iceland, Israel, Lithuania, Luxembourg, Latvia, Malta, Norway, Portugal, Romania, Russian Federation, Slovakia, Sweden, Ukraine |
| 3 | Africa | Côte d’Ivoire, Cameroon, Egypt, Morocco, Nigeria, Senegal, Tunisia, South Africa |
| 4 | Australia | Australia |
| 5 | Belgium | Belgium |
| 6 | ASEAN | Brunei Darussalam, Indonesia, Cambodia, Lao (People’s Democratic Republic), Myanmar, Philippines, Singapore, Thailand, Viet Nam |
| 7 | Canada | Canada |
| 8 | Czech Republic | Czech Republic |
| 9 | Germany | Germany |
| 10 | Spain | Spain |
| 11 | France | France |
| 12 | China | China, Hong Kong, Taiwan |
| 13 | Hungary | Hungary |
| 14 | India | India |
| 15 | Italy | Italy |
| 16 | Japan | Japan |
| 17 | South Korea | South Korea |
| 18 | Malaysia | Malaysia |
| 19 | Netherlands | Netherlands |
| 20 | New Zealand | New Zealand |
| 21 | Poland | Poland |
| 22 | Slovenia | Slovenia |
| 23 | Turkey | Turkey |
| 24 | The United States | The United States |
| 25 | Rest of the world | Bangladesh, Jordan, Kazakhstan, Pakistan, Saudi Arabia, rest of the world |
Appendix B
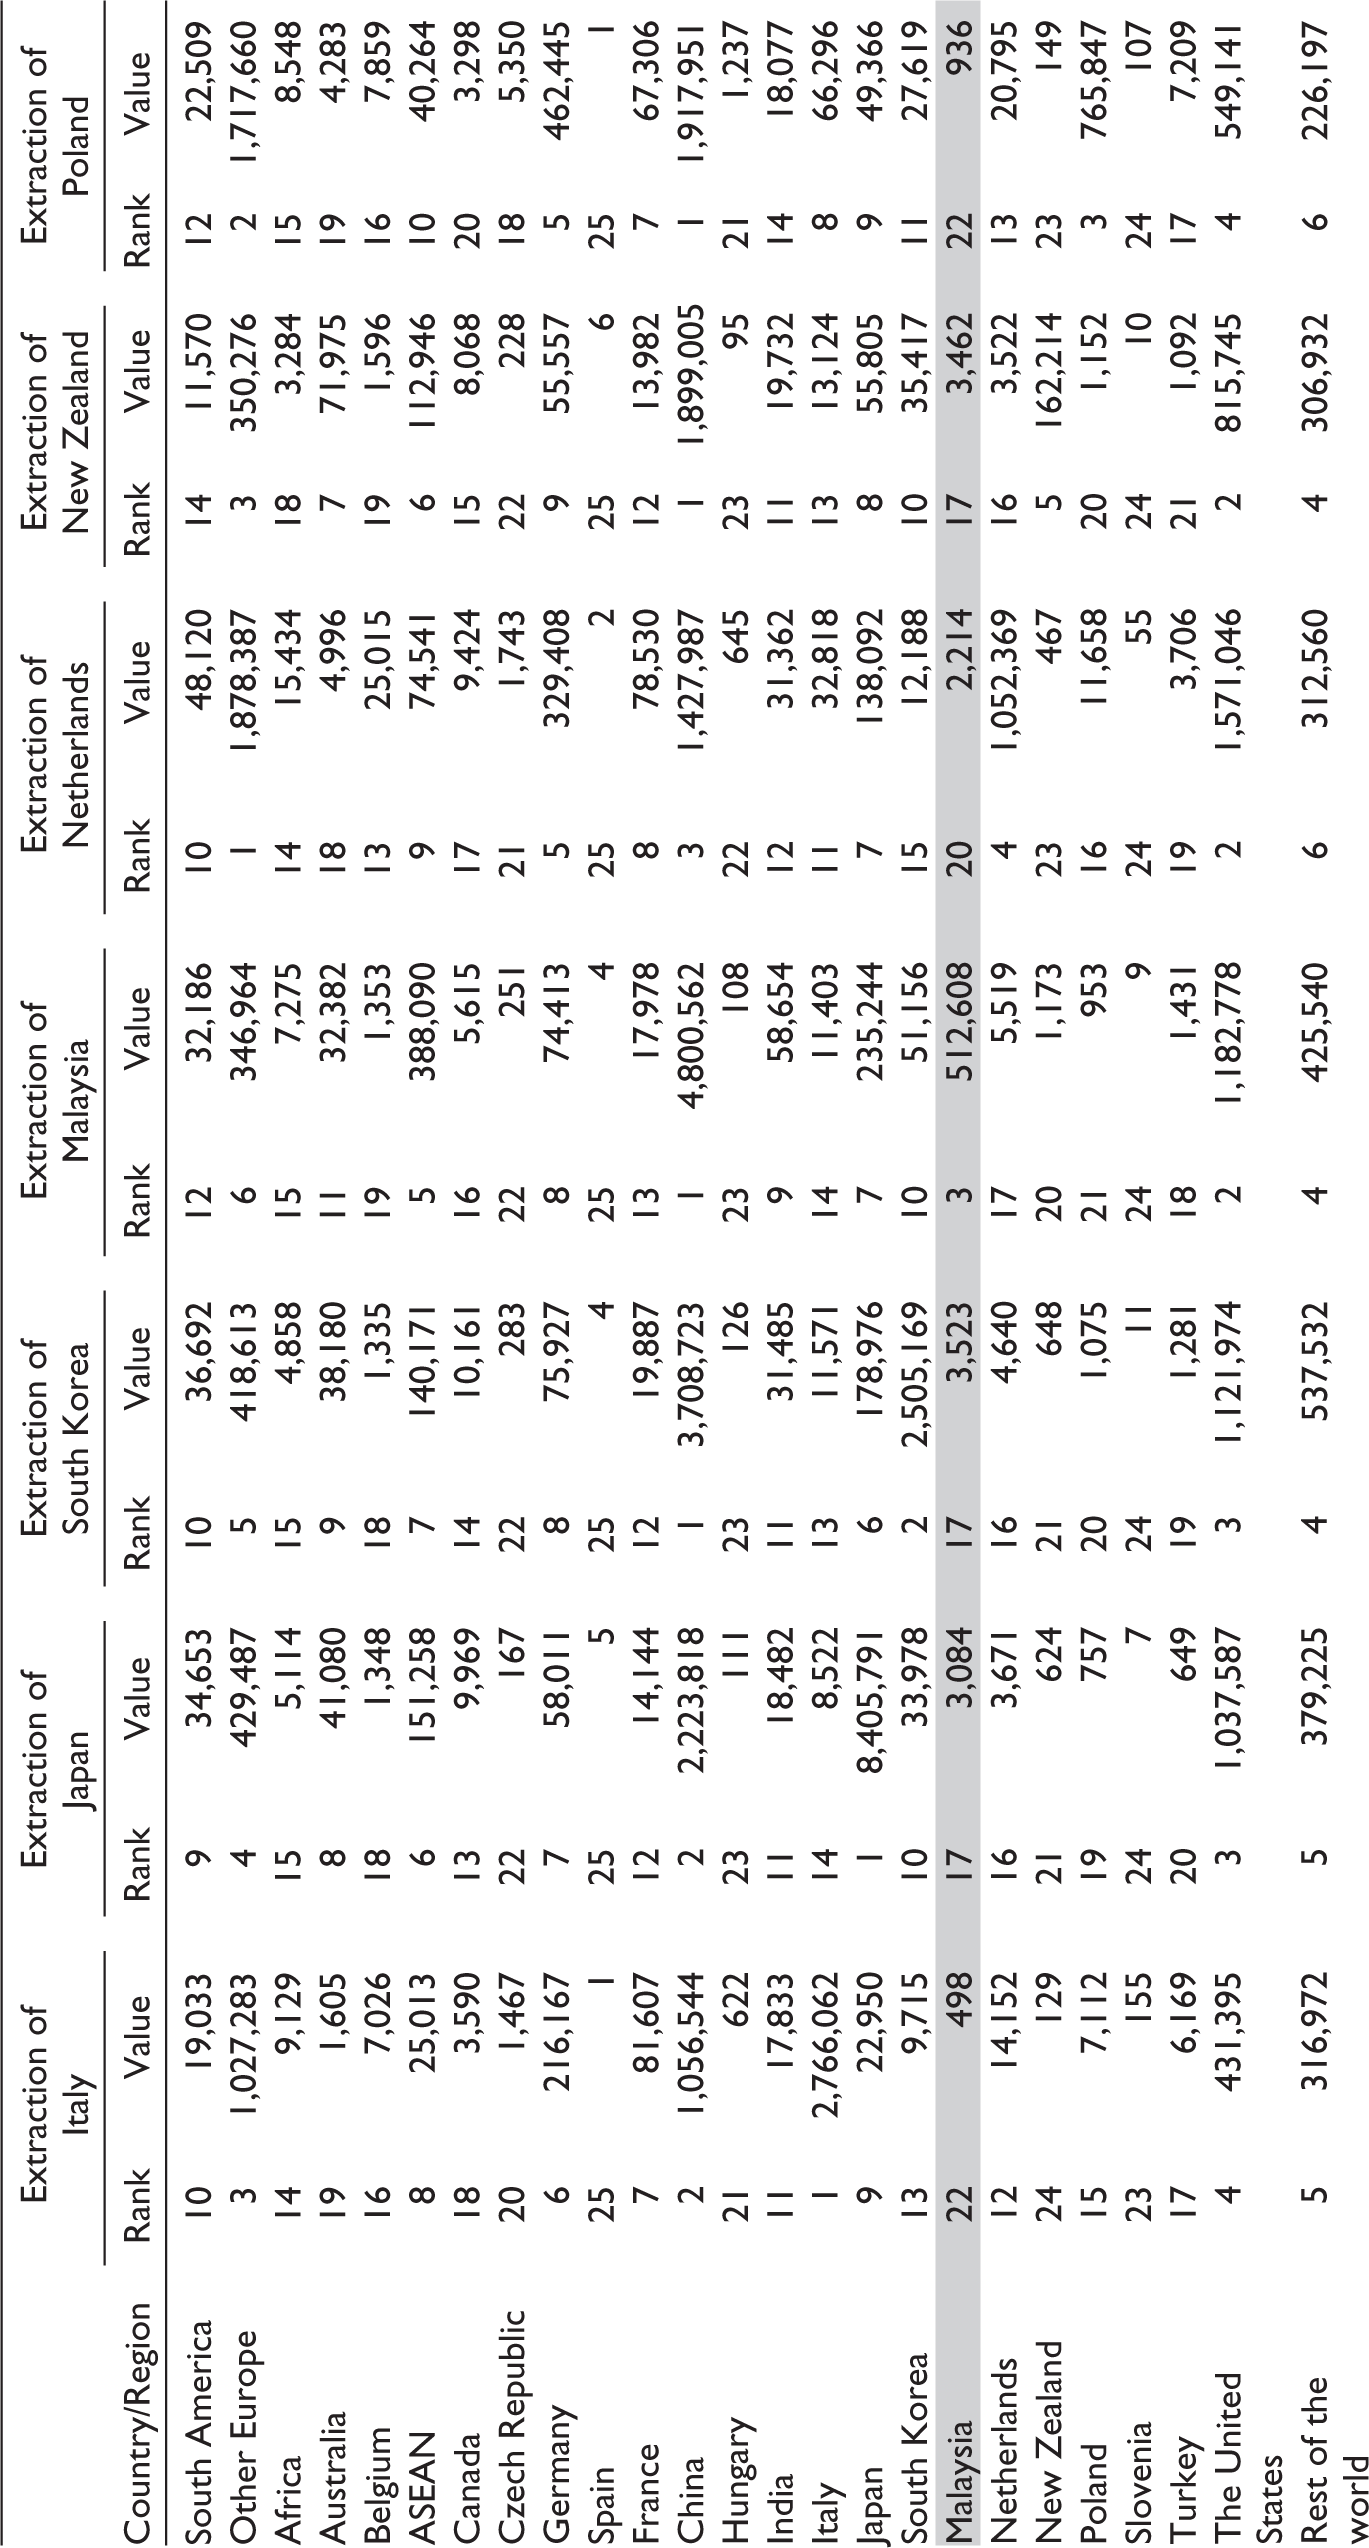
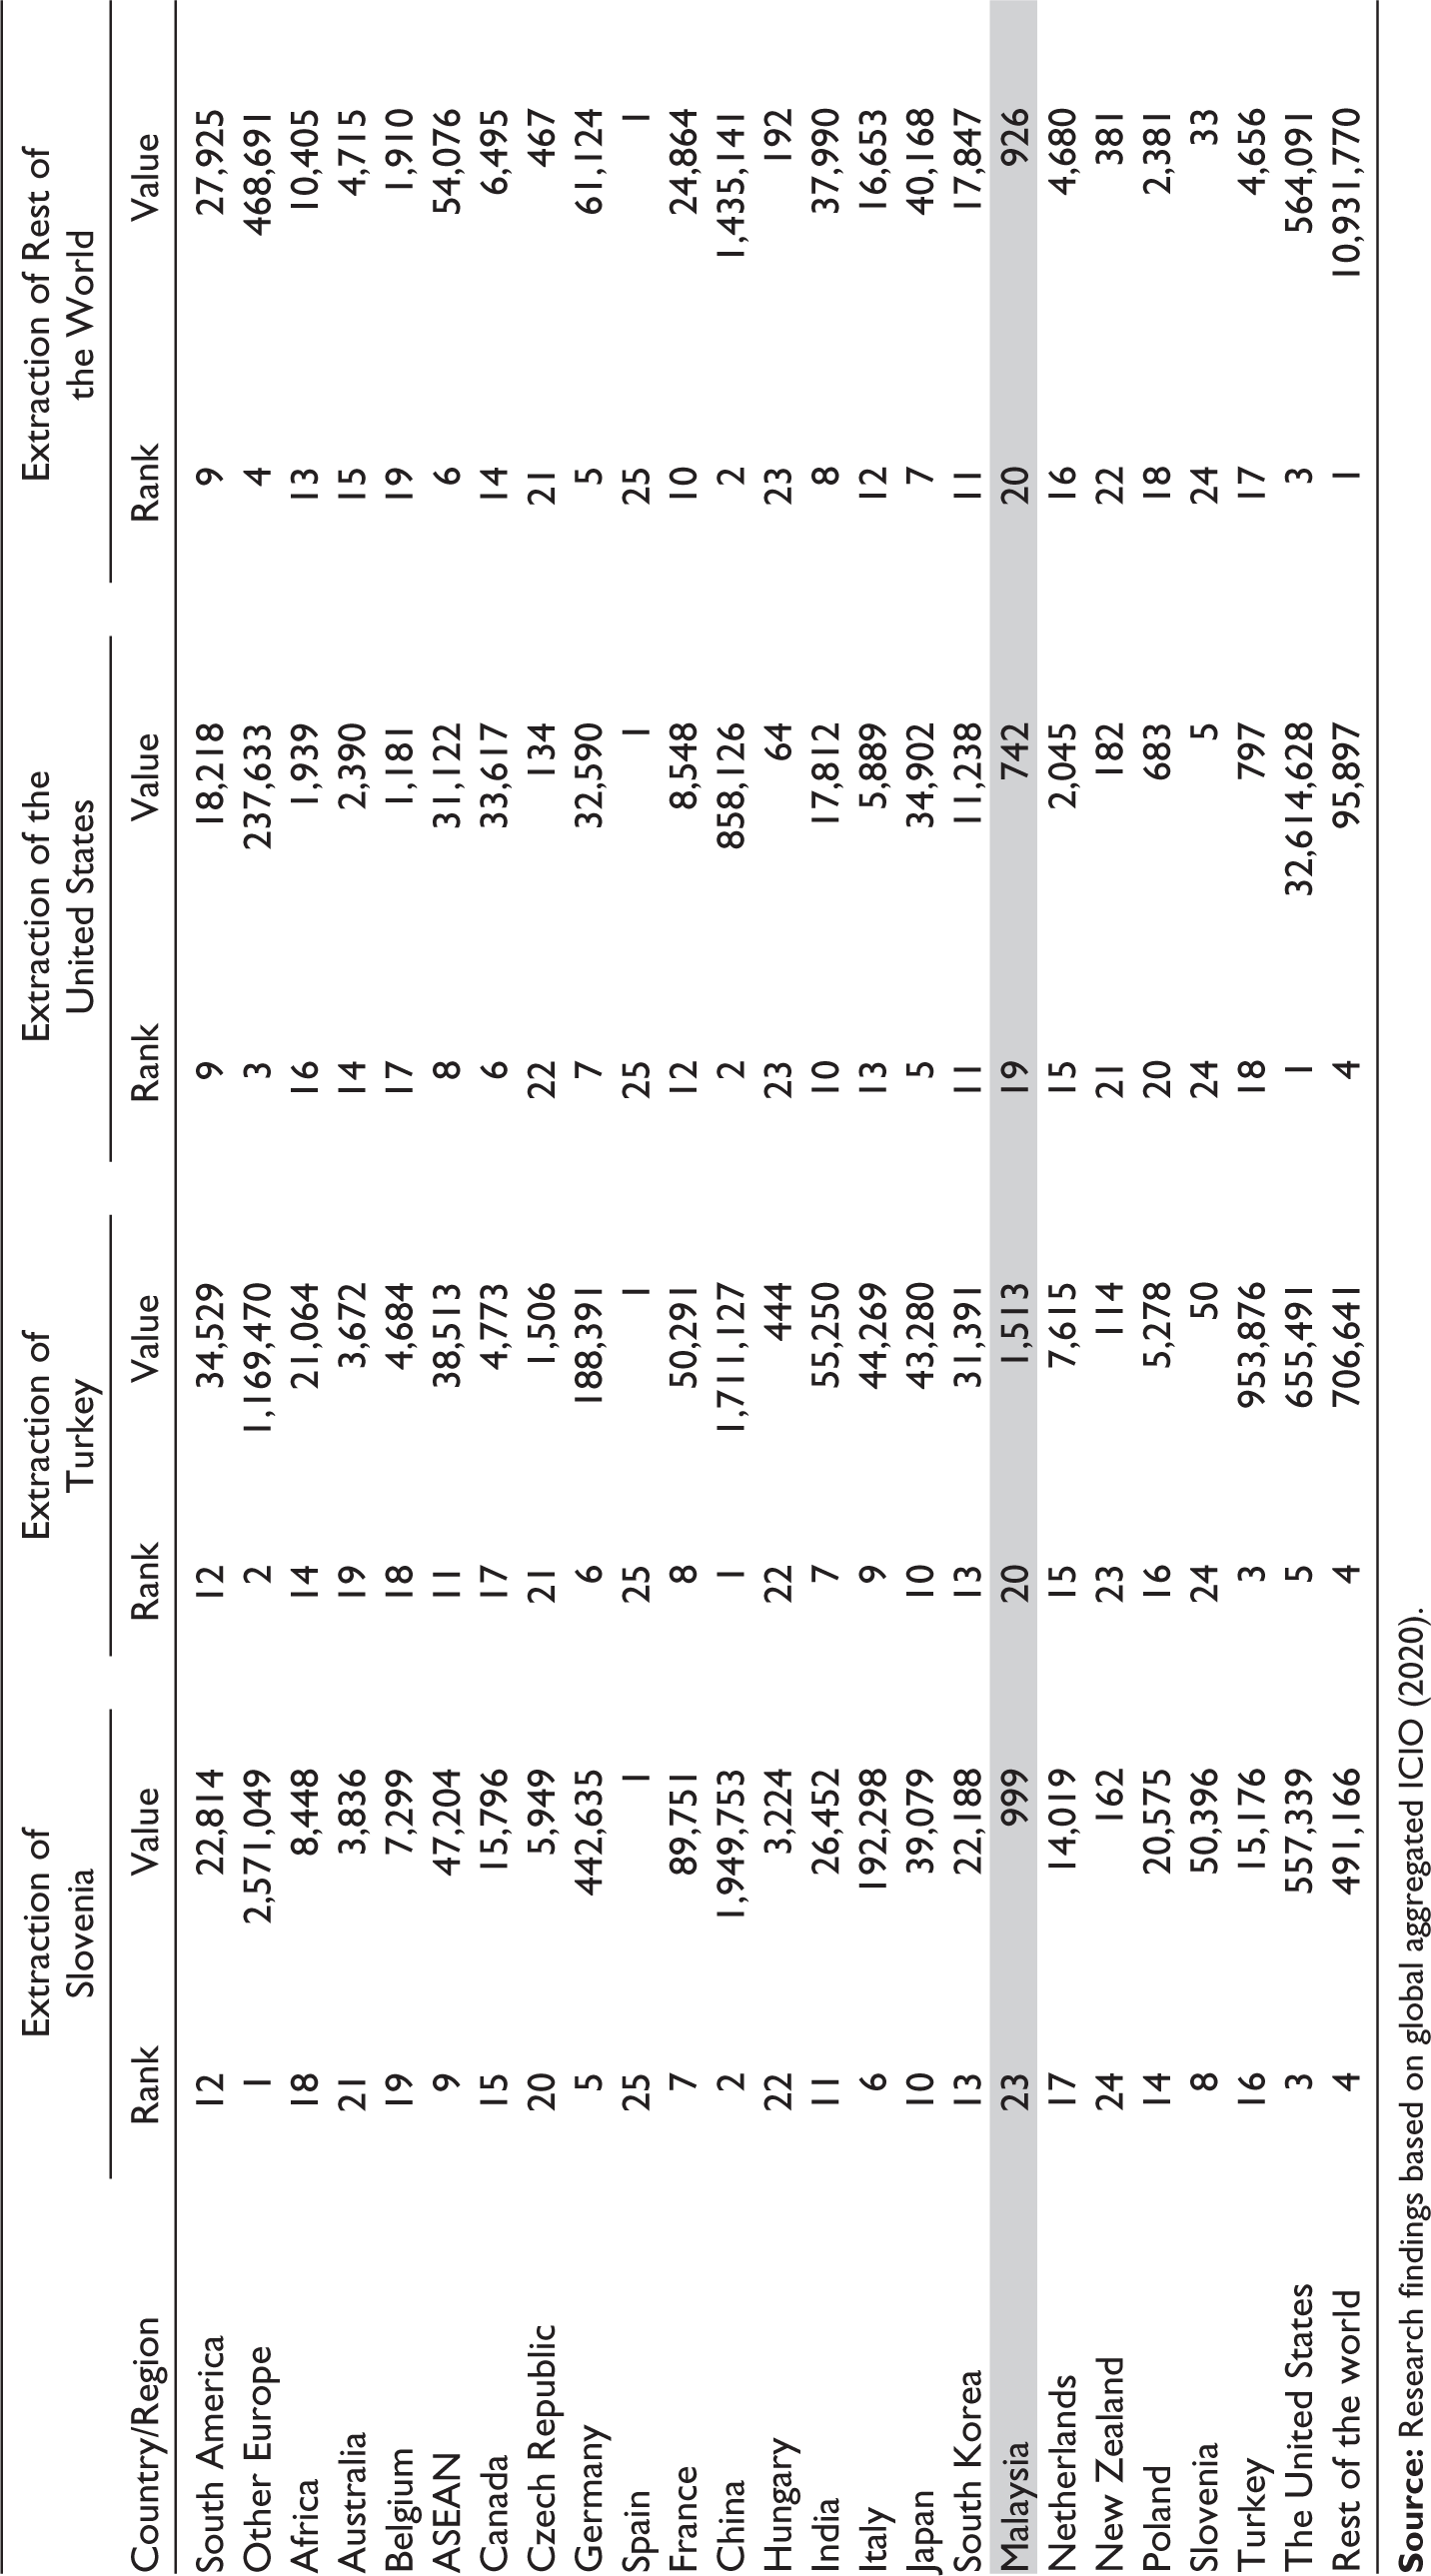
Reduction in Trade Partners’ Output of Malaysia After Global Extraction (Results by Country/Region, in Million USD).
| Country/Region | Extraction of South America | Extraction of Other Europe | Extraction of Africa | Extraction of Australia | Extraction of Belgium | Extraction of ASEAN | Extraction of Canada | ||||||||
| Rank | Value | Rank | Rank | Rank | Value | Rank | Value | Rank | Value | Rank | Value | Rank | Value | ||
| South America | 1 | 4,488,745 | 2 | 13,314 | 11 | 25,130 | 11 | 16,680 | 12 | 28,485 | 10 | 28,701 | 9 | 37,632 | |
| Other Europe | 16 | 394,968 | 12 | 13,587,625 | 5 | 488,229 | 4 | 232,347 | 1 | 2,115,508 | 4 | 412,462 | 4 | 434,822 | |
| Africa | 12 | 4,793 | 13 | 5,245 | 1 | 1,921,365 | 18 | 2,720 | 16 | 10,358 | 17 | 5,870 | 14 | 5,294 | |
| Australia | 7 | 4,788 | 11 | 2,975 | 17 | 4,488 | 2 | 2,172,472 | 18 | 4,852 | 11 | 20,780 | 15 | 4,803 | |
| Belgium | 14 | 1,545 | 7 | 6,376 | 18 | 3,168 | 20 | 761 | 4 | 592,622 | 18 | 1,547 | 18 | 1,763 | |
| ASEAN | 21 | 56,013 | 20 | 38,172 | 9 | 48,661 | 6 | 106,886 | 11 | 50,443 | 2 | 3,934,591 | 8 | 49,553 | |
| Canada | 24 | 15,530 | 9 | 7,622 | 16 | 4,736 | 14 | 4,356 | 15 | 12,129 | 16 | 5,876 | 3 | 2,027,426 | |
| Czech Republic | 20 | 425 | 23 | 1,660 | 21 | 504 | 23 | 162 | 20 | 2,730 | 22 | 241 | 22 | 276 | |
| Germany | 8 | 92,680 | 19 | 207,542 | 6 | 82,208 | 8 | 37,703 | 6 | 335,732 | 9 | 57,876 | 6 | 73,804 | |
| Spain | 25 | 420 | 5 | 1 | 25 | 1 | 22 | 334 | 25 | 1 | 25 | 3 | 25 | 2 | |
| France | 11 | 21,972 | 8 | 51,456 | 7 | 50,291 | 12 | 10,713 | 7 | 241,353 | 12 | 19,754 | 12 | 20,044 | |
| China | 4 | 3,112,363 | 1 | 1,083,136 | 2 | 1,666,527 | 1 | 2,181,561 | 3 | 863,666 | 1 | 4,418,863 | 2 | 2,239,093 | |
| Hungary | 3 | 198 | 24 | 616 | 23 | 178 | 24 | 67 | 22 | 757 | 23 | 100 | 23 | 138 | |
| India | 22 | 30,362 | 25 | 20,134 | 8 | 49,647 | 9 | 22,638 | 13 | 28,442 | 8 | 63,076 | 10 | 26,992 | |
| Italy | 2 | 17,830 | 4 | 34,331 | 12 | 23,620 | 13 | 9,630 | 10 | 53,989 | 13 | 9,444 | 13 | 16,905 | |
| Japan | 13 | 71,863 | 15 | 47,782 | 10 | 34,654 | 7 | 54,430 | 9 | 60,654 | 6 | 217,454 | 7 | 69,233 | |
| South Korea | 6 | 32,075 | 22 | 11,004 | 13 | 12,892 | 10 | 17,967 | 17 | 9,490 | 7 | 87,070 | 11 | 23,521 | |
| Malaysia | 9 | 2,803 | 14 | 630 | 20 | 975 | 16 | 3,194 | 21 | 873 | 14 | 8,153 | 20 | 1,005 | |
| Netherlands | 10 | 9,079 | 6 | 18,313 | 15 | 6,257 | 15 | 3,490 | 8 | 88,248 | 15 | 6,179 | 16 | 4,624 | |
| New Zealand | 18 | 406 | 18 | 226 | 22 | 396 | 17 | 3,152 | 23 | 348 | 21 | 769 | 21 | 408 | |
| Poland | 23 | 1,441 | 10 | 8,397 | 19 | 2,657 | 19 | 897 | 14 | 12,233 | 20 | 1,067 | 17 | 1,807 | |
| Slovenia | 5 | 11 | 3 | 76 | 24 | 19 | 25 | 6 | 24 | 67 | 24 | 10 | 24 | 13 | |
| Turkey | 17 | 1,692 | 21 | 4,466 | 14 | 7,983 | 21 | 756 | 19 | 4,784 | 19 | 1,204 | 19 | 1,736 | |
| The United States | 15 | 3,034,280 | 17 | 926,596 | 3 | 559,904 | 3 | 677,516 | 2 | 1,299,721 | 3 | 878,294 | 1 | 5,008,121 | |
| Rest of the world | 19 | 211,112 | 16 | 181,303 | 4 | 544,986 | 5 | 116,672 | 5 | 358,951 | 5 | 375,175 | 5 | 147,855 | |
| Country/Region | Extraction of Czech Republic | Extraction of Germany | Extraction of Spain | Extraction of France | Extraction of China | Extraction of Hungary | Extraction of India | ||||||||
| Rank | Value | Rank | Value | Rank | Value | Rank | Value | Rank | Value | Rank | Value | Rank | Value | ||
| South America | 15 | 11,313 | 12 | 16,158 | 8 | 150,940 | 14 | 12,742 | 9 | 31,926 | 16 | 12,467 | 10 | 24,468 | |
| Other Europe | 2 | 1,540,541 | 2 | 1,205,631 | 2 | 3,326,540 | 3 | 1,041,463 | 4 | 173,590 | 2 | 2,601,546 | 5 | 336,098 | |
| Africa | 17 | 7,508 | 15 | 7,152 | 11 | 86,486 | 13 | 13,500 | 15 | 2,716 | 19 | 6,447 | 11 | 18,514 | |
| Australia | 20 | 3,625 | 20 | 3,112 | 19 | 11,243 | 19 | 2,515 | 10 | 18,497 | 21 | 3,964 | 13 | 12,191 | |
| Belgium | 16 | 7,621 | 16 | 7,113 | 17 | 18,022 | 12 | 16,259 | 18 | 549 | 17 | 11,206 | 19 | 1,964 | |
| ASEAN | 10 | 52,634 | 9 | 36,992 | 9 | 111,005 | 9 | 30,464 | 6 | 64,211 | 10 | 69,345 | 6 | 113,437 | |
| Canada | 19 | 4,337 | 17 | 5,413 | 18 | 17,015 | 17 | 8,202 | 14 | 3,138 | 20 | 4,999 | 15 | 5,168 | |
| Czech Republic | 5 | 291,138 | 19 | 3,278 | 20 | 5,212 | 20 | 1,511 | 22 | 139 | 15 | 12,677 | 22 | 162 | |
| Germany | 3 | 605,600 | 1 | 5,522,084 | 5 | 736,452 | 5 | 267,985 | 7 | 35,037 | 3 | 871,244 | 8 | 48,183 | |
| Spain | 25 | 1 | 25 | 1 | 21 | 4,349 | 25 | 1 | 25 | 3 | 25 | 1 | 25 | 2 | |
| France | 8 | 67,750 | 6 | 60,900 | 6 | 404,832 | 1 | 3,478,322 | 12 | 8,909 | 7 | 114,010 | 12 | 14,792 | |
| China | 1 | 3,663,074 | 3 | 1,139,187 | 1 | 4,904,453 | 2 | 1,058,070 | 1 | 34,940,669 | 1 | 2,992,726 | 2 | 1,800,838 | |
| Hungary | 22 | 2,463 | 21 | 1,029 | 23 | 1,981 | 22 | 459 | 23 | 62 | 6 | 117,844 | 23 | 66 | |
| India | 14 | 17,739 | 11 | 18,582 | 12 | 72,777 | 11 | 19,102 | 11 | 9,039 | 14 | 21,458 | 1 | 3,697,229 | |
| Italy | 9 | 62,367 | 8 | 38,842 | 7 | 201,690 | 7 | 64,504 | 13 | 4,871 | 8 | 98,876 | 14 | 9,107 | |
| Japan | 7 | 68,574 | 7 | 42,577 | 10 | 100,802 | 8 | 31,475 | 5 | 78,238 | 9 | 76,172 | 7 | 55,656 | |
| South Korea | 12 | 35,563 | 14 | 10,215 | 14 | 37,156 | 16 | 8,311 | 8 | 33,982 | 11 | 65,070 | 9 | 30,433 | |
| Malaysia | 21 | 2,495 | 22 | 845 | <22 | 2,912 | 21 | 643 | 16 | 2,089 | 22 | 2,457 | 17 | 2,731 | |
| Netherlands | 13 | 20,407 | 10 | 21,594 | 13 | 49,414 | 10 | 23,971 | 17 | 1,527 | 13 | 35,612 | 16 | 3,659 | |
| New Zealand | 24 | 147 | 23 | 154 | 24 | 690 | 23 | 130 | 21 | 405 | 24 | 132 | 21 | 383 | |
| Poland | 11 | 46,567 | 13 | 13,905 | 15 | 22,929 | 15 | 8,345 | 19 | 547 | 12 | 41,225 | 20 | 1,104 | |
| Slovenia | 23 | 181 | 24 | 93 | 25 | 149 | 24 | 54 | 24 | 4 | 23 | 637 | 24 | 15 | |
| Turkey | 18 | 6,380 | 18 | 3,714 | 16 | 21,469 | 18 | 3,596 | 20 | 497 | 18 | 10,127 | 18 | 2,130 | |
| The United States | 4 | 603,115 | 4 | 651,237 | 3 | 2,197,740 | 4 | 699,727 | 2 | 298,430 | 4 | 845,480 | 4 | 643,503 | |
| Rest of the world | 6 | 189,737 | 5 | 204,070 | 4 | 1,715,659 | 6 | 202,198 | 3 | 239,418 | 5 | 283,475 | 3 | 938,519 | |
| Country/Region | Extraction of Italy | Extraction of Japan | Extraction of South Korea | Extraction of Malaysia | Extraction of Netherlands | Extraction of New Zealand | Extraction of Poland | ||||||||
| Rank | Value | Rank | Value | Rank | Value | Rank | Value | Rank | Value | Rank | Value | Rank | Value | ||
| South America | 10 | 19,033 | 9 | 34,653 | 10 | 36,692 | 12 | 32,186 | 10 | 48,120 | 14 | 11,570 | 12 | 22,509 | |
| Other Europe | 3 | 1,027,283 | 4 | 429,487 | 5 | 418,613 | 6 | 346,964 | 1 | 1,878,387 | 3 | 350,276 | 2 | 1,717,660 | |
| Africa | 14 | 9,129 | 15 | 5,114 | 15 | 4,858 | 15 | 7,275 | 14 | 15,434 | 18 | 3,284 | 15 | 8,548 | |
| Australia | 19 | 1,605 | 8 | 41,080 | 9 | 38,180 | 11 | 32,382 | 18 | 4,996 | 7 | 71,975 | 19 | 4,283 | |
| Belgium | 16 | 7,026 | 18 | 1,348 | 18 | 1,335 | 19 | 1,353 | 13 | 25,015 | 19 | 1,596 | 16 | 7,859 | |
| ASEAN | 8 | 25,013 | 6 | 151,258 | 7 | 140,171 | 5 | 388,090 | 9 | 74,541 | 6 | 112,946 | 10 | 40,264 | |
| Canada | 18 | 3,590 | 13 | 9,969 | 14 | 10,161 | 16 | 5,615 | 17 | 9,424 | 15 | 8,068 | 20 | 3,298 | |
| Czech Republic | 20 | 1,467 | 22 | 167 | 22 | 283 | 22 | 251 | 21 | 1,743 | 22 | 228 | 18 | 5,350 | |
| Germany | 6 | 216,167 | 7 | 58,011 | 8 | 75,927 | 8 | 74,413 | 5 | 329,408 | 9 | 55,557 | 5 | 462,445 | |
| Spain | 25 | 1 | 25 | 5 | 25 | 4 | 25 | 4 | 25 | 2 | 25 | 6 | 25 | 1 | |
| France | 7 | 81,607 | 12 | 14,144 | 12 | 19,887 | 13 | 17,978 | 8 | 78,530 | 12 | 13,982 | 7 | 67,306 | |
| China | 2 | 1,056,544 | 2 | 2,223,818 | 1 | 3,708,723 | 1 | 4,800,562 | 3 | 1,427,987 | 1 | 1,899,005 | 1 | 1,917,951 | |
| Hungary | 21 | 622 | 23 | 111 | 23 | 126 | 23 | 108 | 22 | 645 | 23 | 95 | 21 | 1,237 | |
| India | 11 | 17,833 | 11 | 18,482 | 11 | 31,485 | 9 | 58,654 | 12 | 31,362 | 11 | 19,732 | 14 | 18,077 | |
| Italy | 1 | 2,766,062 | 14 | 8,522 | 13 | 11,571 | 14 | 11,403 | 11 | 32,818 | 13 | 13,124 | 8 | 66,296 | |
| Japan | 9 | 22,950 | 1 | 8,405,791 | 6 | 178,976 | 7 | 235,244 | 7 | 138,092 | 8 | 55,805 | 9 | 49,366 | |
| South Korea | 13 | 9,715 | 10 | 33,978 | 2 | 2,505,169 | 10 | 51,156 | 15 | 12,188 | 10 | 35,417 | 11 | 27,619 | |
| Malaysia | 22 | 498 | 17 | 3,084 | 17 | 3,523 | 3 | 512,608 | 20 | 2,214 | 17 | 3,462 | 22 | 936 | |
| Netherlands | 12 | 14,152 | 16 | 3,671 | 16 | 4,640 | 17 | 5,519 | 4 | 1,052,369 | 16 | 3,522 | 13 | 20,795 | |
| New Zealand | 24 | 129 | 21 | 624 | 21 | 648 | 20 | 1,173 | 23 | 467 | 5 | 162,214 | 23 | 149 | |
| Poland | 15 | 7,112 | 19 | 757 | 20 | 1,075 | 21 | 953 | 16 | 11,658 | 20 | 1,152 | 3 | 765,847 | |
| Slovenia | 23 | 155 | 24 | 7 | 24 | 11 | 24 | 9 | 24 | 55 | 24 | 10 | 24 | 107 | |
| Turkey | 17 | 6,169 | 20 | 649 | 19 | 1,281 | 18 | 1,431 | 19 | 3,706 | 21 | 1,092 | 17 | 7,209 | |
| The United States | 4 | 431,395 | 3 | 1,037,587 | 3 | 1,121,974 | 2 | 1,182,778 | 2 | 1,571,046 | 2 | 815,745 | 4 | 549,141 | |
| Rest of the world | 5 | 316,972 | 5 | 379,225 | 4 | 537,532 | 4 | 425,540 | 6 | 312,560 | 4 | 306,932 | 6 | 226,197 | |
| Country/Region | Extraction of Slovenia | Extraction of Turkey | Extraction of the United States | Extraction of Rest of the World | |||||||||||
| Rank | Value | Rank | Value | Rank | Value | Rank | Value | ||||||||
| South America | 12 | 22,814 | 12 | 34,529 | 9 | 18,218 | 9 | 27,925 | |||||||
| Other Europe | 1 | 2,571,049 | 2 | 1,169,470 | 3 | 237,633 | 4 | 468,691 | |||||||
| Africa | 18 | 8,448 | 14 | 21,064 | 16 | 1,939 | 13 | 10,405 | |||||||
| Australia | 21 | 3,836 | 19 | 3,672 | 14 | 2,390 | 15 | 4,715 | |||||||
| Belgium | 19 | 7,299 | 18 | 4,684 | 17 | 1,181 | 19 | 1,910 | |||||||
| ASEAN | 9 | 47,204 | 11 | 38,513 | 8 | 31,122 | 6 | 54,076 | |||||||
| Canada | 15 | 15,796 | 17 | 4,773 | 6 | 33,617 | 14 | 6,495 | |||||||
| Czech Republic | 20 | 5,949 | 21 | 1,506 | 22 | 134 | 21 | 467 | |||||||
| Germany | 5 | 442,635 | 6 | 188,391 | 7 | 32,590 | 5 | 61,124 | |||||||
| Spain | 25 | 1 | 25 | 1 | 25 | 1 | 25 | 1 | |||||||
| France | 7 | 89,751 | 8 | 50,291 | 12 | 8,548 | 10 | 24,864 | |||||||
| China | 2 | 1,949,753 | 1 | 1,711,127 | 2 | 858,126 | 2 | 1,435,141 | |||||||
| Hungary | 22 | 3,224 | 22 | 444 | 23 | 64 | 23 | 192 | |||||||
| India | 11 | 26,452 | 7 | 55,250 | 10 | 17,812 | 8 | 37,990 | |||||||
| Italy | 6 | 192,298 | 9 | 44,269 | 13 | 5,889 | 12 | 16,653 | |||||||
| Japan | 10 | 39,079 | 10 | 43,280 | 5 | 34,902 | 7 | 40,168 | |||||||
| South Korea | 13 | 22,188 | 13 | 31,391 | 11 | 11,238 | 11 | 17,847 | |||||||
| Malaysia | 23 | 999 | 20 | 1,513 | 19 | 742 | 20 | 926 | |||||||
| Netherlands | 17 | 14,019 | 15 | 7,615 | 15 | 2,045 | 16 | 4,680 | |||||||
| New Zealand | 24 | 162 | 23 | 114 | 21 | 182 | 22 | 381 | |||||||
| Poland | 14 | 20,575 | 16 | 5,278 | 20 | 683 | 18 | 2,381 | |||||||
| Slovenia | 8 | 50,396 | 24 | 50 | 24 | 5 | 24 | 33 | |||||||
| Turkey | 16 | 15,176 | 3 | 953,876 | 18 | 797 | 17 | 4,656 | |||||||
| The United States | 3 | 557,339 | 5 | 655,491 | 1 | 32,614,628 | 3 | 564,091 | |||||||
| Rest of the world | 4 | 491,166 | 4 | 706,641 | 4 | 95,897 | 1 | 10,931,770 | |||||||
Appendix C
library(readxl)
data ← read_excel(“path_to_your_file.xlsx”)
colnames (data) ← c(“Country”, “APL”, “Economic_Impact”, “Country_Size”, “ITII”)
data$OriginalOrder ← seq_len(nrow(data))
num_simulations ← 1000
rank_matrix ← matrix(NA, nrow = nrow(data), ncol = num_simulations)
set.seed(123)
for (sim in 1:num_simulations) {
weights ← runif(3)
weights ← weights / sum(weights)
ITII ← data$APL * weights[1] +
data$Economic_Impact * weights[2] +
data$ Country_Size* weights[3]
rank_matrix[, sim] ← rank(-ITII)
}
average_ranks ← rowMeans(rank_matrix)
results ← data.frame(Country = data$Country, AverageRank = average_ranks, OriginalOrder = data$OriginalOrder)
results$FinalRank ← rank(results$AverageRank, ties.method = “min”)
results ← results[results$FinalRank <= 25, ]
results ← results[order(results$OriginalOrder), ]
library(extrafont)
extrafont::font_import(prompt = FALSE)
loadfonts(device = “win”)
library(ggplot2)
ggplot(results, aes(x = reorder(Country, OriginalOrder), y = AverageRank)) +
geom_bar(stat = “identity”, fill = “lightcoral”, color = “black”, width = 0.6) +
geom_text(aes(label = FinalRank),
vjust = -0.5, color = “black”, size = 5) +
theme_minimal(base_family = “Times New Roman”) +
labs(
x = “Countries”,
y = “Average Rank” ) +
theme(
axis.text.x = element_text(angle = 90, hjust = 1, face = “bold”, size = 12),
axis.title.x = element_text(face = “bold”, size = 14),
axis.title.y = element_text(face = “bold”, size = 14) )
Appendix D
library(readxl)
data ← read_excel(“path_to_your_file.xlsx”)
colnames (data) ← c(“Country”, “APL”, “Economic_Impact”, “Country_Size”, “ITII”)
data$OriginalOrder ← seq_len(nrow(data))
num_simulations ← 1000
rank_matrix ← matrix(NA, nrow = nrow(data), ncol = num_simulations)
set.seed(123)
for (sim in 1:num_simulations) {
weights ← runif(3)
weights ← weights / sum(weights)
ITII ← data$APL * weights[1] +
data$Economic_Impact * weights[2] +
data$ Country_Size* weights[3]
sensitivity_data$MinComposite[i] ← min(composite_values)
sensitivity_data$MaxComposite[i] ← max(composite_values)
}
sensitivity_data$Range ←
sensitivity_data$MaxComposite - sensitivity_data$MinComposite
sensitivity_data ← sensitivity_data[order(sensitivity_data$Range, decreasing = TRUE), ]
ggplot(sensitivity_data, aes(x = reorder(Country, Range), ymin = MinComposite, ymax = MaxComposite)) +
geom_linerange(color = “blue”, size = 2.5) +
coord_flip() +
theme_minimal(base_family = “Times New Roman”) +
labs(
x = “Countries”,
y = “Intercountry Trade Impact Index (ITII)”) +
theme(
axis.text.x = element_text(face = “bold”, size = 12),
axis.text.y = element_text(face = “bold”, size = 12),
axis.title.x = element_text(face = “bold”, size = 14),
axis.title.y = element_text(face = “bold”, size = 14),
plot.margin = margin(10, 10, 10, 50) ) +
scale_y_continuous(expand = expansion(mult = c(0.1, 0.1)))