
Abstract
The Naglieri Nonverbal Ability Test, Second Edition (NNAT2), is used widely to screen students for possible inclusion in talent development programs. The NNAT2 claims to provide a more culturally neutral evaluation of general ability than tests such as Form 6 of the Cognitive Abilities Test (CogAT6), which has Verbal and Quantitative batteries in addition to a Nonverbal battery. This study compared the performance of 5,833 second graders who took the CogAT6 and 4,038 kindergartners, first graders, and second graders who took the NNAT2 between 2005 and 2011 as part of a grade-wide screening for a gifted program. Comparison between minorities and Whites on the CogAT6 and the NNAT2 found slightly larger gaps on the CogAT6 Composite for Hispanics and English-Language Learners (ELL) but the same gap for Black students. Considered alone, the Nonverbal battery of CogAT6 produced smaller gaps than the NNAT2 for Blacks, Hispanics, Asians, and ELL students. Fisher’s exact tests showed no significant differences between the CogAT6 Composite and the NNAT2 in subgroup identification rates at hypothetical cuts for gifted identification (top 20%, 10%, or 5%), except for Asian and ELL students. The CogAT6 Nonverbal score appeared to identify as many or more high-ability students from underrepresented groups as the NNAT2. Wechsler Intelligence Scale for Children, Fourth Edition, follow-up on the top 5% showed greater predictive validity for the CogAT6 Composite. These results suggest that gifted programs should not assume that using a figural screening test such as the NNAT2, without other adjustments to selection protocol, will address minority underrepresentation.
The continued underrepresentation of Black, Hispanic, and English-Language Learner (ELL) students in gifted programs is recognized as an important problem by theorists and practitioners in the field (e.g., Callahan, 2005; Donovan & Cross, 2002; Ford, 1998; U.S. Department of Education, 1993). Borland (2004), for one, argues that, because of chronic underrepresentation of certain groups, gifted programs may actually “widen the gap between society’s have’s and have-not’s” (p. 6). Borland maintains that, although gifted education is by no means the primary cause of achievement differences between demographic groups, it is morally and politically imperative that administrators do what they can to address minority underrepresentation in gifted programs.
In recognition of this issue, the National Association for Gifted Children (NAGC; 2010b) recommends that “students with identified needs represent diverse backgrounds and reflect the total student population of the district” and—to that end—supports “non-biased and equitable” identification strategies, including the use of nonverbal tests (Standard 2.3). Some have cautioned that nonverbal tests do not measure entirely the same constructs as the tests they are meant to supplement or replace and that they may contain unique forms of bias (Anastasi & Urbina, 1997; Lohman, 2005b; Lohman & Gambrell, 2012). Others, however, have argued that nonverbal tests are relatively free of test bias against children from non-English speaking homes, culturally diverse backgrounds, or with limited opportunity to learn and that they are better measures of ability for any child. Naglieri (2010), for example, argued that ability tests with verbal or quantitative content are inappropriate for measuring general ability because they are heavily loaded with achievement factors. Naglieri, Brulles, and Landsdowne (2008) deemed nonverbal measures more equitable for all children and argued that “a nonverbal measure of ability can overcome the injustice of under-representation of minorities in gifted programs” (p. 10).
The Naglieri Nonverbal Ability Test, Second Edition (NNAT2; Naglieri, 2008a), has been advertised by its publisher as “a culturally neutral evaluation of students’ nonverbal reasoning and general problem-solving ability, regardless of the individual student’s primary language, education, culture or socioeconomic background” (Pearson, 2012). In an analysis of the standardization data for the first edition of the NNAT (Naglieri, 1997), Naglieri and Ford (2003) found that White, Black, and Hispanic children had similar mean scores and were similarly likely to meet common percentile cuts for participation in gifted programming (see also Naglieri & Ronning, 2000). Carman and Taylor (2010), however, found that low socioeconomic status students from underrepresented minority groups scored 14 Naglieri Ability Index score (NAI) points lower on the NNAT than nonminority students from middle-class families. Like Villarreal (2005), Carman and Taylor cautioned that the NNAT be used only in conjunction with other measures of ability. Naglieri and Ford’s (2003) findings were also questioned on statistical and methodological grounds by Lohman (2005a). A response from Naglieri and Ford (2005) included a call for similar empirical investigations of race and ethnic differences on the Cognitive Abilities Test, Form 6 (CogAT6; Lohman & Hagen, 2001b). The present study responds to Naglieri and Ford’s request by analyzing archival data sets from one gifted program’s use of the NNAT2 and the CogAT6 in grade-wide screenings.
The Present Study
The Midwestern school district (approximately 18,000 students) studied used grade-wide screenings with a group ability test as one major means of identifying students who might benefit from gifted services. Students who met district cut scores on the group ability test were referred for further evaluation, which typically included administration of the Wechsler Intelligence Scale for Children, Fourth Edition (WISC-IV; Wechsler, 2003a)—perhaps the most commonly used test in identification for gifted-talented services (NAGC, 2010a).
In the fall of 2010, the district switched from using the CogAT6 to the NNAT2 for its grade-wide screenings in hopes that the NNAT2 might yield a more diverse pool for further evaluation and, ultimately, a more diverse group of students in the district’s gifted programs. This study used district screening results from both instruments to explore three questions of interest to the district and to the larger conversation about nonverbal testing as a tool for addressing minority underrepresentation in gifted education.
Research Question 1: On which of the two screening tests were mean scores and variances most similar among subgroups?
Research Question 2: Which screening test best moderated minority underrepresentation at hypothetical gifted program cut scores (top 20%, 10%, and 5%)?
Research Question 3: Which screening test best predicted high performance on the WISC-IV?
Additional Exploration: Because the CogAT6 Nonverbal battery is similar to the NNAT2, CogAT6 Nonverbal Standard Age Scores (NSAS) were included for comparison where possible in the analysis.
Method
Sample
Data were drawn from district testing records that included 5,833 students who took the CogAT6 in second grade in the 2005-2006 to the 2009-2010 school years, and 4,035 students who took the NNAT2 in kindergarten, first grade, and second grade during the 2010-2011 school year. Because these were grade-wide screenings, the sample included four complete grade cohorts for the CogAT6 and three complete grade cohorts for the NNAT2. With the exception of a higher representation of ELL students in the NNAT2 group (6.2% as opposed to 3.4%), demographic characteristics were nearly identical between the two groups (approximately 51% male, 64% White, 20.5% Black, 5% Asian or Pacific Islander, 5% Hispanic, 5.5% multiracial, and 1% American Indian or Alaska Native).
Although the full sample was relevant to the first two research questions, only a subset of the sample was used for evaluation of our question pertaining to WISC-IV predictivity. District policy for the most part limited WISC-IV testing to students with high screening test scores; therefore, correlations including all students identified by the screening test could not be calculated. Instead, investigation of the third question focused on the top 5% of scorers for each screening test.
Measures
District databases provided gender and ethnicity as well as ELL status at the time of screening. Although of interest to the authors, socioeconomic status information in the form of free and reduced lunch status was withheld by the district due to its interpretation of privacy law.
CogAT6
The CogAT6 is a multidimensional group ability test and consists of three batteries measuring verbal, quantitative, and nonverbal reasoning (Lohman & Hagen, 2001a). At second grade (Level 2), there are 48 items on each battery, and two item types per battery. No reading is required at this level. On the Verbal and Quantitative batteries, children listen to questions read by the test administrator and choose their answers from a set of pictures. On the Nonverbal Battery, the test administrator simply paces children though the 44 nonverbal items. The CogAT6 yields a standard age score (SAS) for each battery (VSAS, QSAS, and NSAS), three partial composite standard age scores (VQSAS, VNSAS, and QNSAS), and a full composite standard age score (Verbal, Quantitative, and Nonverbal standard age score [VQNSAS])—all with a mean of 100 and a standard deviation of 16 (Lohman & Hagen, 2002).
Reliabilities for the three batteries using the Kuder-Richardson Formula 20 (KR20) are reported in the research handbook for CogAT6 (Lohman & Hagen, 2002). These ranged from .86 to .92 in the Primary Battery (grades K-2). The KR20 reliability for VQNSAS for these grades was reported as .96, which corresponds to a standard error of measurement of 3.2 SAS points. The handbook also reported test–retest reliability as .92 when different forms of the test were administered 2 weeks apart. Correlations between the overall composite score and scores on other tests include .69 with the Woodcock-Johnson III (Lohman, 2003b; Woodcock, McGrew, & Mather, 2001), .79 with the WISC, Third Edition (Lohman, 2003a; Wechsler, 1991), and .86 with the Iowa Tests of Basic Skills (Hoover, Hieronymous, Frisbie, & Dunbar, 1994; Lohman & Hagen, 2002).
NNAT2
The NNAT2 is a shorter, unidimensional group-administered ability test that uses 48 figure matrix items at all levels (Naglieri, 2008a). The NNAT2 yields the NAI, which has a mean of 100 and a standard deviation of 16 (Naglieri, 2008b). The district used the online version.
The NNAT2 technical manual (Naglieri, 2008b) reported that KR20 reliability coefficients for the test levels used in the present study ranged from .84 to .92. The standard error of measurement at these levels ranged from 4.79 to 6.36. Test–retest reliability ranged from .75 to .78. Validity was examined through correlation with the Otis-Lennon School Ability Test, Eighth Edition (OLSAT-8; Otis & Lennon, 2003) and the Stanford Achievement Tests, Tenth Edition (Stanford 10; Pearson, 2003). Pearson r with OLSAT-8 at second grade was .53 for the Verbal section, .68 for the Nonverbal section, and .69 for the Composite. For kindergarten through second grade, correlations with Stanford 10 Reading ranged from .61 to .70 and with Stanford 10 Math ranged from .62 to .70. At first grade, a comparison of ELL student scores with matched control groups showed a difference of 3.57 NAI points for non-Spanish speaking ELL students and .93 NAI points for Spanish-speaking ELL students.
WISC-IV
The WISC-IV is an individual ability test with subtests yielding index scores for Verbal Comprehension (VCI), Perceptual Reasoning (PRI), Working Memory (WMI), and Processing Speed (PSI; Wechsler, 2003a). The first two batteries together yield a General Ability Index (GAI), and all four batteries in combination yield a Full-Scale IQ (FSIQ). These index scores have a mean of 100 and a standard deviation of 15 (Wechsler, 2003b).
Internal consistency estimates reported by the technical manual (Wechsler, 2003b) include .94 for VCI, .92 for PRI, .92 for WMI, .88 for PSI, and .97 for FSIQ. Rowe, Kingsley, and Thompson (2010) studied the correlation of GAI and FSIQ with the reading and math composites from the Wechsler Individual Achievement Test, Second Edition (WIAT-II; Psychological Corporation, 2001) among gifted referrals. They found GAI among these higher ability students to correlate with WIAT-II Reading at .50 and WIAT-II Math at .43. Correlations were higher with FSIQ (Reading, .59 and Math, .47).
Several analyses have been cited by NAGC (2010a) supporting use of GAI over FSIQ in identification, especially in cases where subscores are highly discrepant. During part of the study period, the district only administered the VCI and PRI subtests of the WISC-IV. Our analysis, therefore, is confined to VCI, PRI, and GAI.
Statistical Analyses
The shape of the score distribution on each screening test was analyzed in terms of mean, standard deviation, skewness, and kurtosis. Skewness and kurtosis were tested for significance at p < .05. Differences between subgroup means on each screening test were tested for significance at p < .05 and p < .001 with independent samples t tests. The lower and upper limits of the 95% confidence interval were also reported. We used PS (version 3.0) to determine that the sample size necessary to detect a real difference of 5 points at a power level greater than .80 was approximately 135 for the smaller group (Dupont & Plummer, 1997). Accordingly, the Native American and Pacific Islander groups were left out of analyses due to sample size. Comparisons between Asian and non-Asian ELL students were included, despite a less than ideal sample size, because observed differences were strikingly large. Along with each mean comparison, we also tested for differences between subgroup variances using Levene’s test. Mean comparisons with significant variance differences used a separate variance t test algorithm for significance testing.
Next, differences in the proportion of each subgroup scoring in the top 20%, 10%, and 5% on CogAT6 versus NNAT2 were tested for significance using Fisher’s exact test. The size of the effect is indexed using the natural log of the odds ratio (LOR; subgroup odds of selection on CogAT6/ subgroup odds of selection on NNAT2). Rosenthal (1996) gave guidelines for interpretation of effect sizes in the odds ratio metric based on Cohen (1998). Suggested values for small, medium, and large effect sizes translate into LOR of .40, .90, and 1.5, respectively. The statistical power of these tests depends not only on assumptions about possible effect sizes but also on the exact proportions involved. The sample size necessary in the smaller (NNAT2) sample to detect a medium-sized effect increases from approximately 140 to 560 as the smaller proportion in the comparison decreases from 10% to 2%. Thus, statistical power should be sufficient to detect effects in the top 20% and 10% comparisons. For the top 5%, only comparisons in groups with relatively large samples and/or large proportions selected have adequate power, but results and tests for all groups were reported for descriptive purposes. To ensure that any possible differences were detected, we used an uncorrected alpha level of .05 despite the many comparisons. Although this decision increases the chances of detecting a difference where none exists, it minimizes the possibility of missing real differences. A more stringent alpha level could be viewed as a means of masking real differences between the tests.
Exploration of relationships between each screening test and WISC-IV performance was complicated by district testing policy and data collection. WISC-IVs usually were given to students scoring above 125 on VQNSAS when CogAT6 was administered, or above an NAI score of 118 when the NNAT2 was administered, but exceptions and incomplete WISC-IV records were not unusual. To create a fair comparison between the screening tests as predictors, we compared the WISC-IV performance of only those students scoring in the top 5% on either screening test. This cut point is just above the district cut score on VQNSAS and well above the district cut score on NAI. If the pool of talent available in the district was stable across the studied time period and both tests were equally good at predicting WISC-IV performance, then we could expect no difference in observed scores after the selectivity was equalized.
Finally, to explore whether the inclusion of kindergarten and first grade NNAT2 scores may have influenced the comparison between screening tests, given that the CogAT6 sample was composed entirely of second graders, we presented grade-disaggregated results for the NNAT2. All statistical analyses were conducted in SPSS 20.
Results
Mean Scores and Variances
The first research question asked, “Which screening test generated mean scores and variances that were more similar between subgroups.” Table 1 shows mean scores and standard deviation by subgroup for NSAS, VQNSAS, and NAI. Although NSAS and VQNSAS scores were normally distributed, NAI scores showed significant negative skew (−.461) and positive kurtosis (+.380), p < .05. This means there were more NAI scores at the extremes of the distribution, and in particular more very low scores, than would be expected under normality. NAI score standard deviations at kindergarten and first grade were larger than the expected 16, which would exacerbate the tendency toward extreme scores. A similar pattern of deviation from the expected distribution was found for the first edition of NNAT (Lohman, Korb, & Lakin, 2008). Meanwhile, NSAS and VQNSAS standard deviations were slightly smaller than expected. Table 2 presents the differences between subgroup means using White students as a reference among ethnic groups.
Descriptive Statistics for Subgroups.

Note. CogAT6 = Cognitive Abilities Test–Form 6; NNAT2 = Naglieri Nonverbal Ability Test, Second Edition; NSAS = Nonverbal Standard Age Scores; VQNSAS = Verbal, Quantitative, and Nonverbal Standard Age Score; NAI = Naglieri Ability Index; ELL = English-language learner. The normative population mean and SD for all tests is 100 and 16, respectively.
Subgroup Score Differences.

Note. CogAT6 = Cognitive Abilities Test–Form 6; NNAT2 = Naglieri Nonverbal Ability Test, Second Edition; NSAS = Nonverbal Standard Age Scores; VQNSAS = Verbal, Quantitative, and Nonverbal Standard Age Score; NAI = Naglieri Ability Index; ELL = English-language learner; CI = confidence interval; UL = upper limit; LL = lower limit. Listed sample sizes are for the focal groups in each comparison.
Significant variance differences.
p < .05. **p < .001.
Mean scores were substantially higher on the CogAT6 than on the NNAT2—a difference of more than 6 points in most cases. This large overall mean difference is the reason we did not attempt any testing of mean differences across the screening tests. Little significant gender difference was noted for either test. Blacks had the lowest mean scores, scoring a full standard deviation below Whites on VQNSAS and NAI and three quarters of a standard deviation below Whites on NSAS (p < .001). However, Blacks did have larger score variability than Whites on the NAI (p = .005).
On all three measures, Hispanic and multiracial means fell between Black and White means, while Asians scored the highest. The difference between Asian and White means was 8.1 and 9.1 points, respectively, on NSAS and NAI (p < .001) but insignificant on VQNSAS (p > .05). Despite no mean advantage, Asians showed greater variance than Whites on VQNSAS (SD +1.7, p = .005).
ELL students scored 10.8 points lower than non-ELL students on VQNSAS (p < .001), but only 4.3 points lower on NAI (p < .001) and showed no significant difference on NSAS (p > .05). As would be expected, this indicates that the larger gap on VQNSAS is due to the Verbal and Quantitative batteries, which include spoken English language instructions at Grade 2. Further analysis showed sharp differences between Asian ELL and other, mostly Hispanic, ELL students. In fact, some of the largest mean score differences noted (13.0, 16.1, and 20.3, p < .001) favored Asian ELL over non-Asian ELL students. This suggests that any ELL advantage on NSAS or NAI was largely attributable to an overall Asian advantage on nonverbal measures. Due to the large gap between Asian and non-Asian ELL students, standard deviations were larger for the ELL than non-ELL sample on both NSAS (+3, p < .001) and NAI (+2.2, p = .002).
Identification Rates
The second research question asked which screening test yielded identification rates on likely cut scores most similar across subgroups. Table 3 details the percentage of each subgroup that fell within the top 20%, 10%, and 5% of sample scores for NSAS, VQNSAS, and NAI. If perfect proportionality among subgroups were to hold, each cell value would match the cut percent. For example, all of the cell values in the first section of the table (top 20%) would be 20.0.
Percentage of Students Within Subgroups Above Selected Score Levels and CogAT:NNAT Log Odds Ratio Effect Sizes.

Note. NNAT = Naglieri Nonverbal Ability Test, Second Edition; CogAT = Cognitive Abilities Test; NSAS = Nonverbal Standard Age Score; VQNSAS = Verbal, Quantitative, and Nonverbal Standard Age Score; NAI = Naglieri Ability Index; ELL = English-language learners.
Significant Fisher Exact test when compared with NAI percentage at p < .05.
Neither instrument identified proportionally at three hypothetical cut scores gifted programs might apply during identification for services. Fisher exact tests (p < .05) were used, though, to indicate subgroups for which one test held an advantage over another at each cut. The finding of larger variance for Black students on NAI did not translate into more high scores since the additional variability was caused by an excess of low scores. NAI identified proportionately more ELL and more Asian students at all three score levels. The effect size for ELL students was large, whereas the effect for Asian students was moderate. The only significant subgroup advantage on the CogAT6 over the NNAT2 was a very small effect for Whites on VQNSAS at the 10% cut only. As this advantage occurred at only one cut point, it may be simply the result of chance.
No significant differences were found at any cut between NAI and CogAT6 NSAS. In fact, NSAS identification rates for underrepresented groups were as high as or slightly higher than NAI identification rates. From this we can also infer that the significantly lower Asian selection advantage on VQNSAS compared with NAI stems from differences on the VSAS and QSAS batteries.
Relationship to WISC-IV
The third research question asked which screening test best predicted high performance on the WISC-IV. Table 4 compares WISC-IV performance between the top 5% of VQNSAS scorers and NNAT2 scorers in the sample, showing what score level on WISC-IV is predicted by a high score on the screening test. Results showed VQNSAS was a significantly better predictor of high VCI and high GAI, with the top 5% scoring 12 and 5.8 points higher, respectively, on VCI and GAI than the top 5% of NAI scorers. NAI appeared nominally better at predicting high PRI, but the difference was not significant.
WISC-IV Performance of Top 5%.
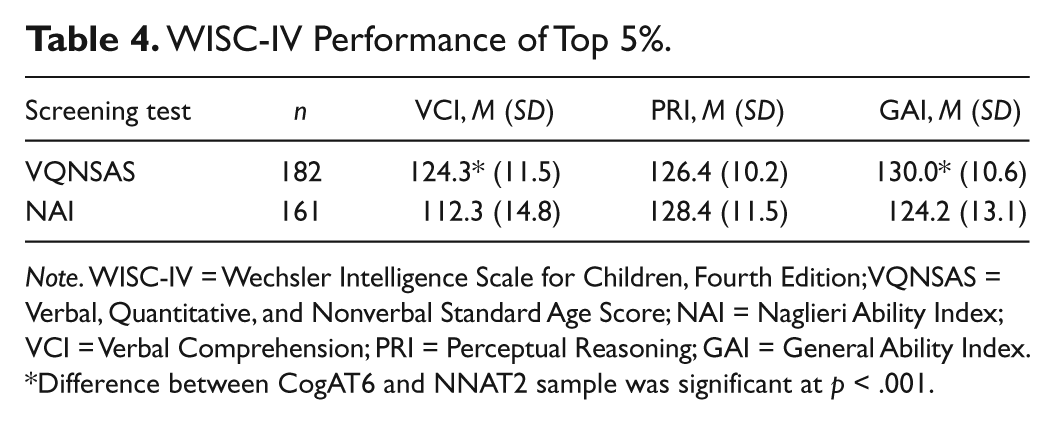
Note. WISC-IV = Wechsler Intelligence Scale for Children, Fourth Edition; VQNSAS = Verbal, Quantitative, and Nonverbal Standard Age Score; NAI = Naglieri Ability Index; VCI = Verbal Comprehension; PRI = Perceptual Reasoning; GAI = General Ability Index.
Difference between CogAT6 and NNAT2 sample was significant at p < .001.
Impact of Grade and Age Differences in Sample
Because the CogAT6 data used in this study came exclusively from second graders and the NNAT2 data included a mix of kindergarteners, first graders, and second graders, it was conceivable that age differences influenced the comparison of subgroup performance and WISC-IV performance between the two screening tests. To investigate this possibility, means, standard deviations, and WISC-IV results were disaggregated by grade, as shown in Table 5.
NNAT2 Descriptives and WISC-IV Scores of Top 5% by Grade.
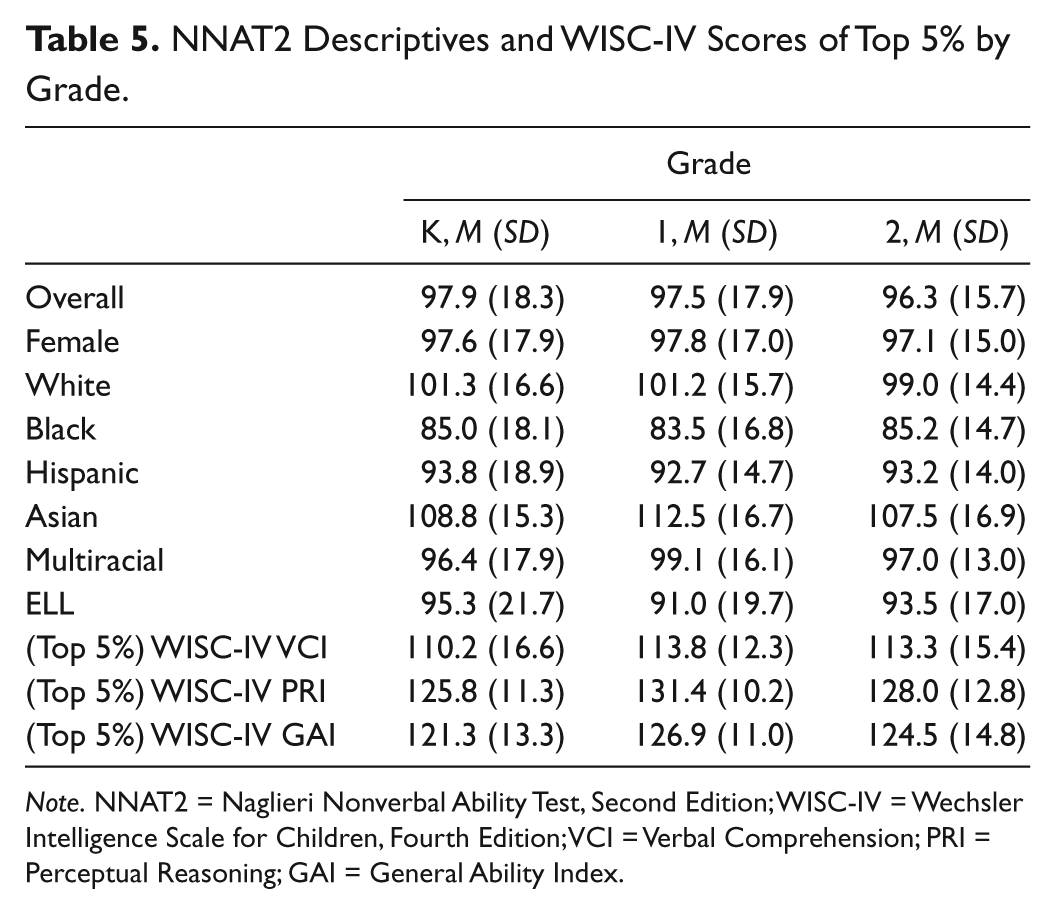
Note. NNAT2 = Naglieri Nonverbal Ability Test, Second Edition; WISC-IV = Wechsler Intelligence Scale for Children, Fourth Edition; VCI = Verbal Comprehension; PRI = Perceptual Reasoning; GAI = General Ability Index.
No evidence of substantial differences in NAI mean scores across grade levels was found, although variability decreased as grade level increased. This increased variability in kindergarten and first grade may have resulted in more high scores on NNAT2 than would have been found if the sample had been restricted to second graders. First grade PRI and GAI scores were significantly higher than kindergarten scores (p < .05). However, the trend does not continue into second grade, as these scores were not significantly different from either grade.
Discussion
The purpose of this study was to compare subgroup performance and WISC-IV prediction of the CogAT6 and the NNAT2 in the context of selection for gifted services. Our field data informs the debate about whether or not the NNAT2 is an effective tool for addressing the underrepresentation of minorities in gifted programming. In this study, none of the three screening measures (VQNSAS, NSAS, and NAI) yielded similar mean performance or identification rates across subgroups—meaning that performance gaps among subgroups persisted across instruments.
Within our sample, multiracial, Hispanic, and ELL students did perform less disparately on average from White students on the NNAT2 than they did on the CogAT6 VQNSAS, but this was not true for Black students. Furthermore, any narrowing of performance gaps did not translate into significantly higher rates of identification at likely selection cut scores—with the exception of ELL students. The advantage to ELL students on the NNAT2 may be attributable to an overall Asian advantage on nonverbal items. Asian ELL students outperformed non-Asian ELL students, and the overall Asian sample outperformed all other groups in both mean scores and identification rates—most significantly on the nonverbally oriented NSAS and NAI. Exceptional Asian and Asian-ELL performance may also be partly attributable to the fact that the Asian population in this district is affiliated disproportionately with a large research university and several medical institutions, and thus is a particularly talented Asian sample that has been attracted from other states and countries.
Of the three screening measures, VQNSAS yielded the lowest ELL means and identification rates relative to non-ELLs, which could suggest either a disadvantage on verbal items or difficulty with directions spoken in the English language. The CogAT6 Directions for Administration anticipate this and advise that
students who have just begun instruction in English are not likely to be able to answer many of the questions on the Verbal and Quantitative batteries. . . . However, these students can generally take the tests in the Nonverbal battery. (Lohman & Hagen, 2001b, p. 9)
In fact, our results suggested that the CogAT6 Nonverbal battery is similar to the NNAT2 in identifying students from underrepresented groups at hypothetical cut scores and was better than the NNAT2 at moderating the mean score disadvantage to Black, Hispanic, multiracial, and non-Asian ELL students.
Of the three screening measures, VQNSAS was the best predictor of high GAI, which may be taken as evidence that it is a better measure of general intelligence because of the broader range of item formats and reasoning abilities sampled. This conclusion, however, assumes that GAI is a “gold standard” measure; one could conclude alternatively that the CogAT6 Verbal and Quantitative batteries and the WISC-IV Verbal subtests simply share a heavy loading of achievement or language factors.
Limitations
Several limitations of this study stem from its dependence on data from one district’s gifted testing records. First, it would have been preferable for analysis if all students had taken the CogAT6, the NNAT2, and the WISC-IV. Instead, practical and financial considerations at the district level meant that each student took either the CogAT6 or the NNAT2 and only a small portion of these students took the WISC-IV. Second, due to sample size limitations, we compared results from slightly different grade levels and from test administrations that took place over the course of 5 years. This increased the possibility of unmeasured changes in the sampled population. Third, the fact that the NNAT2 was administered online may raise questions about a disadvantage for subgroups with less early childhood experience with computers (Huff & Sireci, 2001). Fourth, the latest form of the CogAT (CogAT7, Lohman, 2012a), which has been updated to improve ELL fairness, was not represented in this study (see also Lohman & Gambrell, 2012). Finally, the study is limited to one Midwestern district and may not be representative of other districts.
Two theoretical issues also limit the practical implications of the results. First, one cannot expect one test to perform in isolation as a reliable, valid, and equitable selection tool when matching gifted services to students (NAGC, 2010b, Standard 2.2.5). Dai (2010) confirmed that dependence on a single measure is common (p. 248), but likened it to “putting all of the eggs in one basket” (pp. 224-225). Using a group ability test as a screening test to inform who goes on for individual testing is a similarly flawed practice. Ideally, one would administer multiple measures to all students and find a fair way to interpret them in combination (Lohman, 2012b). Furthermore, improving minority representation in gifted programming need not require the development of a test on which all subgroups perform identically. The use of local and subgroup norms, for example, offer a defensible framework for identifying talent among underrepresented groups (Lohman, 2012b, p. 27). The utility of the NNAT2 in addressing underrepresentation is as much about how the test fits into a larger approach to identification as it is about how different groups perform on it.
The second theoretical limitation relates to WISC-IV predictivity. The fact that high performance on the CogAT6 was more predictive of high performance on the WISC-IV than was high performance on the NNAT2 could be interpreted either as evidence that the WISC-IV and the CogAT6 share the “achievement” loading that the NNAT2 seeks to avoid, or as evidence that the CogAT6 is a better measure of general ability than the NNAT2. This is ultimately a philosophical question about which abilities should be used to define academic giftedness, as well as a practical question of which abilities are most required by a particular gifted program.
Conclusion
This study raises doubts about the claims of at least one nonverbal test that it can better identify students from underrepresented groups for gifted services. Districts should not assume that one instrument will be a panacea and, instead, might consider using nonverbal ability tests as one tool in a wider approach to identifying and serving students in these groups.
Footnotes
Declaration of Conflicting Interests
The authors declared no potential conflicts of interest with respect to the research, authorship, and/or publication of this article.
Funding
The authors received no financial support for the research, authorship, and/or publication of this article.