
Abstract
What are the characteristics leading teachers to nominate gifted students in Spain? To answer this question, several demographic (i.e., gender, grade) and psychological (i.e., multiple intelligences, emotional intelligence, intellectual aptitude, and divergent thinking) characteristics of 563 secondary students nominated as gifted by their teachers were analyzed. Results showed a general gifted profile of the nominated students defined by higher scores in their naturalist and social intelligences, stress management, and verbal, mechanical, and spatial reasoning. Additional analysis indicated that students’ gender and grade also influenced teachers’ nominations of gifted students. Based on the associations among the demographic and psychological characteristics included in this study, nominated students could be classified in five specific gifted profiles, namely, moderately gifted students, social-emotionally gifted students, artistically gifted students, intellectually gifted students, and generally gifted students. Discussion of the limitations of the study, directions for future research, and educational implications of the study are provided.
Nowadays, there is general agreement in the educational and scientific community about the need to use multiple methods to evaluate the broad spectrum of giftedness (Baldwin, 2005; Frasier & Passow, 1994; Plucker, Callahan, & Tomchin, 1996; Prieto, 2011; Renzulli & Reis, 1997a, 1997b; VanTassel-Baska, Johnson, & Avery, 2002). Teacher nominations are frequently used in the identification of gifted students because teachers are in a unique position to observe students in a variety of situations and under different conditions and to interact with them in the school for long periods of time (Siegle, 2001). Teacher nomination of gifted children and adolescents typically involves two types of procedures: structured and unstructured (Davis, Rimm, & Siegle, 2011). Structured nominations are formal procedures that allow teachers to screen and identify gifted students using checklists and rating scales based on predetermined guidelines and student characteristics. Unstructured nominations are informal procedures that allow teachers to recommend gifted students for educational programs by answering open-ended questions intended to elicit their personal beliefs and conceptions of giftedness.
Overall, studies collectively suggest that teachers are able to identify talented students in their classrooms when they have a list of characteristics, sufficient time to observe children’s talents, and are trained to recognize advanced development (Borland, 1978; Chan, 2000; Gagné, 1994; Gear, 1978; Hunsaker, Finley, & Frank, 1997; Johnsen, 2004; Renzulli & Delcourt, 1986; Rohrer, 1995). Also, some studies have shown that teacher nominations can provide additional information beyond that offered by performance-based tests regarding variables such as leadership, creativity, and motivation (Chan, 2000; Hunsaker, 1994; Pierce et al., 2007). However, some researchers believe that rating scales can restrict teachers’ attention to a limited realm of predetermined traits and behaviors (e.g., Borland & Wright, 1994). Others suggest that some characteristics might influence teachers’ perception of giftedness when nominating students for gifted and talented programs, especially if no specific selection criteria are provided (Pierce et al., 2007; Siegle, 2001; Siegle, Moore, Mann, & Wilson, 2010; Siegle & Powell, 2004).
Demographic Characteristics Influencing Teachers’ Nominations
Researchers have demonstrated that gender has a significant influence on teachers’ nominations of giftedness in children and adolescents. First, several studies have provided evidence that female students are underrepresented in gifted programs. Lee (1999) noted that when teachers were invited to nominate young children for enrichment in mathematics and science, they overwhelmingly nominated males. Endepohls-Ulpe and Ruf (2005) found that teachers identified only a small number of gifted females when they were asked to describe a child they had taught. In a recent study, Bianco, Harris, Garrison-Wade, and Leech (2011) determined that teachers were much less willing to refer a female student than an identically described male student to gifted programs. Second, some studies suggest that teachers hold different beliefs about the areas of excellence for males and females. Gagné (1993) found that teachers considered females to be more able in socio-affective and artistic areas (especially music), while they viewed males as more talented in physical and technical tasks. Similarly, Lee (2002) noted that teachers viewed males as being more competent and interested in mathematics and science, and females were more successful in the arts and language.
Different studies also have demonstrated that students’ age may influence teacher nominations of gifted students. For example, Copenhaver and McIntyre (1992) found that primary teachers listed more often than secondary teachers the presence of an extensive vocabulary, independent characteristics, as well as negative behavioral characteristics of gifted students (e.g., boredom, rebelliousness, inattentiveness, and laziness). However, secondary teachers listed inquisitive characteristics more often than primary teachers. A possible reason for this circumstance could be that characteristics that might identify a child as gifted at a younger age may become less important to secondary teachers (Siegle et al., 2010). Also, the fact that primary teachers teach more than one subject and spend much more time in one class might allow them to recognize more characteristics that distinguish gifted children from their peers (Endepohls-Ulpe & Ruf, 2005).
Psychological Characteristics Influencing Teachers’ Nominations
There is empirical evidence that some psychological characteristics, such as intelligence, knowledge, creativity, and motivation, influence teacher nominations of gifted students. In general, teachers tend to define giftedness in terms of high intelligence, high cognitive thinking, high potential, and others factors related to the learning process such as good comprehension, good memory, and advanced vocabulary (Endepohls-Ulpe & Ruf, 2005; Kim, Shim, & Hull, 2009; Moon & Brighton, 2008). Moreover, some specific skills are more likely to be identified as characteristics of gifted by teachers than others. For example, teachers seem to recognize more easily reading strengths than advances in spelling and mathematics in young gifted students (Hodge & Kemp, 2006). Likewise Siegle et al. (2010) showed that voracious readers were more highly rated as gifted by their teachers than students who did well in mathematics.
Furthermore, social behavior and personality features seem to have a lower but still important influence on teacher nominations. Studies in this arena yield contradictory results. On the one hand, some researchers have shown that teachers perceive positive images of gifted children characterized by emotional maturity, willingness to help other students (Persson, 1998), leadership (Hunsaker, 1994; Siegle et al., 2010), responsibility, self-confidence, self-initiation (Chan, 2000), high sensitivity, and a tendency to react emotionally (Siegle et al., 2010). On the other hand, some studies have shown that teachers are more willing to imagine that gifted students had social and emotional issues, such as poor social skills, shyness (Moon & Brighton, 2008), boredom, rebellious, inattentiveness (Copenhaver & McIntyre, 1992), lack of discipline, and general deficits in social behavior (Endepohls-Ulpe & Ruf, 2005). In general, Davis et al. (2011) suggest that teachers tend “to favor those well-dressed, cooperative, nondisabled, and English speakers ‘teachers pleasers’ who do work neatly, on time, and with no smarting off” (p. 69).
The Present Study
The aim of this study was to analyze the characteristics leading teachers to nominate secondary students as gifted in Spain. Giftedness is a relatively recent topic in Spain. The study of giftedness in this country has been associated with the development of the field of intelligence (see Fernández-Ballesteros & Colom, 2004, for a review of the study of intelligence in Spain). Although the identification of gifted students in Spain is largely based on intelligence and aptitude tests, participation by teachers in this process is increasing. At this early stage of the process, it becomes essential to analyze the characteristics that teachers think make a child gifted to determine biases and misunderstandings that teachers may hold about giftedness.
Previous studies have analyzed the characteristics that teachers associate with giftedness in other countries. In some of these studies, teachers have been asked to provide a definition of giftedness to determine the characteristics most often mentioned (e.g., Copenhaver & McIntyre, 1992; Endepohls-Ulpe & Ruf, 2005; Kim et al., 2009). In others, teachers have been asked to indicate the extent to which some affirmations or statements describe giftedness so as to examine further the distribution of the responses (Moon & Brighton, 2008; Siegle & Powell, 2004; Siegle et al., 2010). Likewise, some researchers have asked teachers to identify gifted students who meet certain characteristics or criteria (Chan, 2000).
In the current study, secondary teachers were asked to nominate gifted students from their classroom without providing them any guidelines and predetermined characteristics. On the one hand, this procedure allowed us to collect a large sample of students nominated as gifted by their teachers without the influence of characteristics or criteria previously established. On the other hand, we then were able to analyze a set of demographic (i.e., gender, grade) and psychological (i.e., multiple intelligences [MI], emotional intelligence [EI], intellectual aptitudes [IA], divergent thinking [DT]) variables of those nominated to determine the characteristics leading teachers to identify a student as gifted.
According to MI theory, intelligence is the capacity to solve problems that are of value to a specific culture (Gardner, 1983). Gardner proposes that each individual has specific strengths and weaknesses that can be conceptualized as multiple intelligences (Gardner, 1993). MI theory recognizes eight intelligences, namely, verbal-linguistic, musical, logical-mathematical, naturalist, visual-spatial, bodily-kinesthetic, intrapersonal, and interpersonal (Gardner, 2006). Ramos-Ford and Gardner (1991) discussed the early use of MI in the study of giftedness. Since then, applications of MI theory in the field of giftedness have grown exponentially. For example, Chan (2006) examined perceived MI among male and female gifted students, showing that gifted girls rated higher their interpersonal intelligence while gifted boys rated higher their logical-mathematical intelligence. Also, the researcher studied the relationships between MI and relevant constructs in the field of giftedness. In one study, Chan (2007a) inferred different levels of leadership giftedness from specific multiple intelligences. In another study, Chan (2007c) revealed that self-perceived musical intelligence predicted musical aptitude in a sample of gifted students. Specifically, verbal-linguistic and intrapersonal intelligences were found to be significant predictors for global leadership giftedness; logical-mathematical intelligence was a significant predictor for leadership self-efficacy and goal orientation; and interpersonal intelligence was a significant predictor for leadership flexibility. Recently, he also described MI theory as a new perspective that helps specify the domains where high abilities are demonstrated (Chan, 2008). In addition, MI theory has been used as a framework for the identification of gifted and talented students in different countries (Hernández-Torrano, Ferrándiz, Ferrando, Prieto, & Fernández, in press; Kuo, Maker, Su, & Hu, 2010; Llor et al., 2012) and education of gifted and talented students (Callahan, Tomlinson, Moon, Tomchin, & Plucker, 1995; Maker, Nielson, & Rogers, 1994).
The EI roots are in social (Thorndike, 1920), intrapersonal, and interpersonal intelligences (Gardner, 1983), although Salovey and Mayer (1990) coined the term. Other definitions followed from their work. The most influential has been Goleman’s (1995), who is considered responsible for popularizing the construct. Recently, Bar-On (2006) proposed the term socioemotional intelligence and defined it as an “interrelated set of competences, abilities and emotional and social facilitators that determine how effectively we understand, express ourselves and others and relate to them, as well as how we deal with daily demands” (p. 14). EI theory has been recognized as a valuable construct for the study of the socioemotional competencies of gifted individuals (Bar-On, 2007; Bar-On & Maree, 2009), and a scientific framework for a rigorous study of the emotional and social characteristics of gifted students (Prieto & Ferrando, 2008). For example, EI has been related to important psychological variables in gifted students, such as leadership (Chan, 2007b) and social and academic success (Woitaszewski & Aalsma, 2004). In addition, studies based on the EI theory consistently show that gifted students do not experience socioemotional problems more often than their average abilities peers (Karimi & Besharat, 2010; Lee & Olszewski-Kubilius, 2006; Schwean, Saklofske, Widdifield-Konkin, Parker, & Kloosterman, 2006). However, there is evidence that differences in EI for gifted and nongifted students may occur depending on the instrument used to assess EI (Zeidner, Shani-Zinovich, Matthews, & Roberts, 2005).
Intellectual Aptitudes refer to the degree of readiness to learn and to perform well in a particular situation or domain (Corno et al., 2002). The National Association for Gifted Children includes IA in its definition of giftedness, indicating that the gifted are those who demonstrate outstanding levels of aptitude or competence in one or more domains (National Association for Gifted Children, 2012). Aptitude tests have been conventionally used for identifying academically talented students who would benefit from further services (e.g., VanTassel-Baska, 1986).
In the past few decades, scientists have begun to incorporate other variables in the study of giftedness beyond intelligence. Creativity is a good example: many authors today include creativity in their models of giftedness (e.g., Gagné, 1993; Marland, 1972; Renzulli, 1986; Sternberg, 2005). Creativity can be defined as a generation of new ideas or concepts, or new relationships between known ideas and concepts, which typically produce original and valuable solutions for a society. Creativity is a multidimensional construct and its assessment requires the combination of multiple methods (e.g., products, behaviors, performance, and preferences). Among them, divergent thinking (DT) tests have been the most frequently used instrument in the study of giftedness (see Kim, 2006). Research has shown that DT tests estimate the potential for creative thoughts and the creative performance in gifted children (Runco, 1986, 1993) and help increase the percentage of minority and culturally diverse students to educational programs (Kaufman, 2010).
To analyze the characteristics leading teachers to nominate secondary gifted students in Spain, we established the following research questions:
Research Question 1: What are the demographic (i.e., gender, grade) and psychological (i.e., multiple intelligences, emotional intelligence, intellectual aptitudes, divergent thinking) characteristics of secondary students nominated as gifted by their teachers?
Research Question 2: What is the impact of gender and grade on the profile among the nominated students?
Research Question 3: What is the relationship between secondary teachers’ perceptions of nominated students’ multiple intelligences and emotional intelligence and students’ achievement in intellectual aptitudes and divergent thinking tests?
Research Question 4: Can nominated students be classified into homogeneous groups corresponding to specific gifted profiles regarding multiple intelligences, emotional intelligence, intellectual aptitudes, and divergent thinking? Are these profiles different based on the nominated students’ gender and grade?
Method
Participants
The sample of students comprised 563 Spanish secondary students (300 males) aged between 12 and 16 years (M = 14.05, SD = 1.06) who were nominated as gifted by their teachers. Among them, 249 were seventh- and eighth-graders and 314 were ninth- and tenth-graders. Students’ socioeconomic status could not be obtained, although all schools represented a wide array of income levels.
Instruments
Teachers’ perceptions on students’ abilities tests
Multiple intelligences
The Screening Scale for the Evaluation of Multiple Intelligences–Teacher Form (SSEMI-TF; Llor et al., 2012) was used to assess teachers’ perceptions of students’ MI. The SSEMI-TF has been translated and adapted from Armstrong’s scales to assess MI (Armstrong, 1999), following the international standards promulgated by the International Test Commission (Hambleton, Merenda, & Spielberger, 2005). It is a 28-item rating scale in which teachers express their agreement about the characteristics and behaviors of their students on a 4-point scale ranging from 1 (never) to 4 (always), in terms of Gardner’s MI. It allows teachers to assess seven areas where students can show strengths or weakness: linguistic (ability to effectively manipulate language to express oneself when writing and speaking), logical-mathematical (ability to detect patterns, reason deductively, and think logically), naturalist (ability to identify and classify patterns in nature), spatial (ability to manipulate and create mental images to solve problems), musical (ability to recognize and compose musical pitches, tones, and rhythms), bodily-kinesthetic (ability to use one’s mental abilities to coordinate one’s own bodily movements), and social intelligences—intrapersonal and interpersonal intelligences from the original scale were combined (ability to understand and discern the feelings and intentions of oneself and others) (Almeida et al., 2010; Almeida et al., 2011). In this sample, Cronbach’s α coefficients for the MI scores were .68, .72, .76, .61, .74, .72, and .74, respectively.
Emotional intelligence
The Emotional Intelligence Inventory–Youth Version–Teachers’ Observer Form (EQ:i-YV-O; Bar-On & Parker, in press) was used to assess teachers’ perceptions about students’ EI. The EQ:i-YV-O is a 38-item inventory with a 4-point scale ranging from 1 (never) to 4 (always), which allows teachers to indicate the extent to which each item describes students’ EI, in terms of five socioemotional competencies: intrapersonal intelligence (ability to understand our emotions and communicate them to others), interpersonal intelligence (ability to understand and appreciate others’ emotions), stress management (ability to regulate and control our emotions), adaptability (flexibility and efficacy to solve conflicts), and mood (ability to keep a positive attitude in live). Cronbach’s α coefficients for the EI scores in this sample were .85, .80, .80, .93, and .90, respectively.
Students’ objective performance tests
Intellectual aptitudes
The Differential Aptitude Test–Level 1 (DAT-5; Bennet, Harold, & Wesman, 2000) was used to assess five IA: verbal (ability to find relationships between words), numerical (ability to understand numerical relationships and handle numerical concepts), abstract (ability to discover an implicit rule that relates a series of nonverbal designs), mechanical (ability to understand basic mechanical principles), and spatial reasoning (ability to imagine and rotate an object in three dimensions). The Kuder–Richardson coefficients for the scores on the six DAT-5 aptitudes in our sample were .89, .88, .91, .93, .94, and .90, respectively.
Divergent thinking
The Torrance Tests of Creative Thinking–Figural Version (TTCT) (Torrance, 1974) was used to assess DT in this study. The TTCT consists of three subtests to assess four DT dimensions: fluency (number of meaningful responses given), flexibility (number of changes of response category), originality (number of statistically infrequent responses), and elaboration (number of items to embellish the ideas). We estimated the interrater reliability between two raters using a two-way random intraclass correlation model, following Shrout and Fleiss (1979). The intraclass correlation coefficients for the TTCT scores in our sample for fluency, flexibility, originality, and elaboration scores were ICC(3, 1) = .96, .89, .95, .55, respectively.
Procedure
An identification procedure was conducted, which proceeded in three phases. In the first phase, an invitation letter was sent to 52 schools across 15 school districts in the Region of Murcia (Spain). We invited secondary school teachers to participate in an identification process for 7th- to 10th-grade gifted students asking them to nominate students who would qualify to participate in an extracurricular program for gifted and talented students without providing them any guidelines and predetermined characteristics about the gifted students. Teachers were encouraged to nominate gifted students in their school within a timeline of no more 90 days. Altogether, 563 students were nominated as gifted by a number of the 443 teachers from the same schools as the students. Each teacher nominated between one and four students of the total sample of 563 participants. There is no record specifying which teacher nominated which student. In the second phase, the same teacher who nominated the student rated his/her MI and EI using the SSEMI-TF and the EQ:i-YV-O, respectively. Teachers’ ratings of students MI and EI required approximately 30 days. In the third phase, the 563 nominated students were invited to complete two performance-based tests based on IA (i.e., DAT-5) and DT (i.e., TTCT) in small groups or individually at their schools. Students completed the performance-based instruments in two sessions of 45 minutes each. The assessment of students’ IA and DT took approximately 90 days.
Data Analyses
Descriptive analyses provided preliminary information about demographic (i.e., gender, grade) and psychological characteristics of the students (i.e., MI, EI, IA, and DT). Two-way analyses of variance were conducted to analyze the impact of gender and grade on the psychological characteristics of the nominated students included in this study. The fixed factors were gender and grade. The dependent variables were the raw scores of the 21 subtests of teachers’ perception on students’ MI and EI and students’ objective performance in the IA and DT tests. A Saphiro–Wilk test was conducted to analyze distribution normality, and Levene’s test for equality of error variance was performed to assess homogeneity of variance between groups. Additionally, correlation analyses were carried out to analyze the relationships between teachers’ perceptions on MI and EI, and students’ later performance on IA and DT tests. Finally, a hierarchical cluster analysis using Ward’s agglomerative method and Euclidean distance as dissimilarity measure and a Kruskal–Wallis test provided a description about gifted profiles based on the demographic and psychological characteristics of the nominated students.
Results
Descriptive Analyses
Table 1 includes the means and standard deviations on the key variables of this study. Results showed that teachers rated naturalist and social intelligences higher than other intelligences, but they gave lower ratings to students’ artistic intelligences (i.e., musical and bodily-kinesthetic intelligences). An analysis of EI scores indicated that teachers rated students’ stress management ability the highest and intrapersonal intelligence the lowest. Regarding IA, it was evident that nominated students scored higher in verbal, mechanical, and spatial reasoning than numerical and abstract reasoning. Finally, analyses in DT indicated that nominated students obtained higher scores in originality than flexibility. Table 2 presents the means and standard deviations on the key variables broken down by gender and grade level.
Descriptive Statistics for Multiple Intelligences, Emotional Intelligence, Intellectual Aptitudes, and Divergent Thinking.
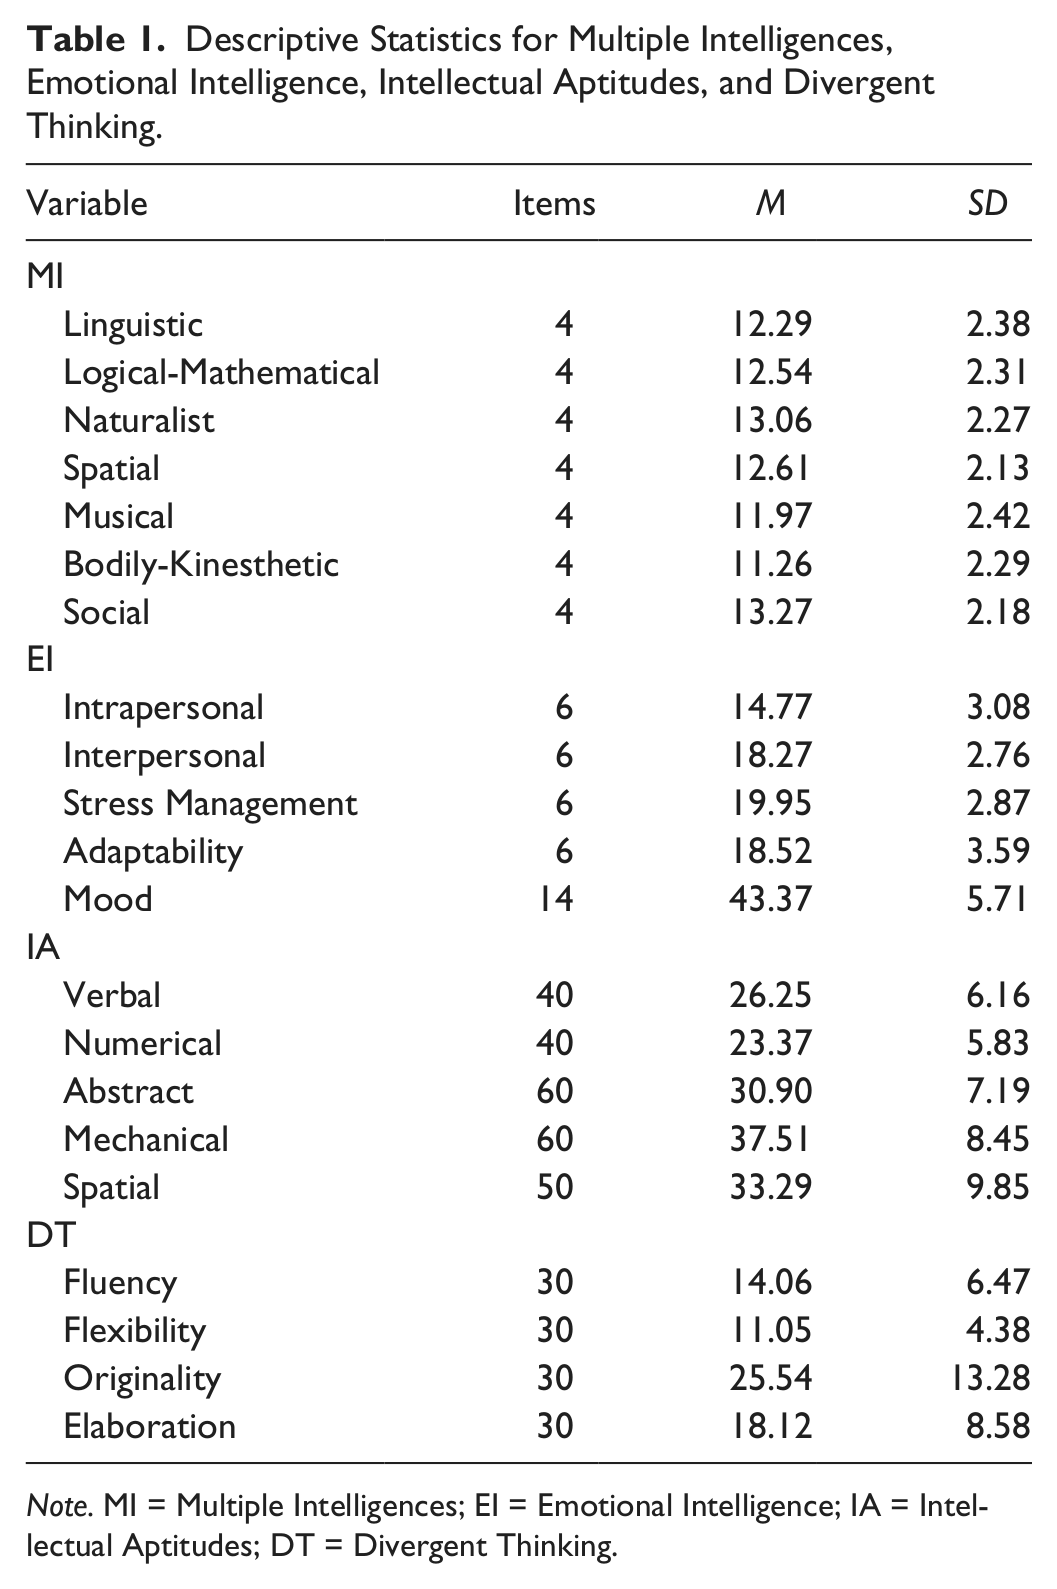
Note. MI = Multiple Intelligences; EI = Emotional Intelligence; IA = Intellectual Aptitudes; DT = Divergent Thinking.
Descriptive Statistics for Multiple Intelligences, Emotional Intelligence, Intellectual Aptitudes, and Divergent Thinking Broken Out by Gender and Grade Level.
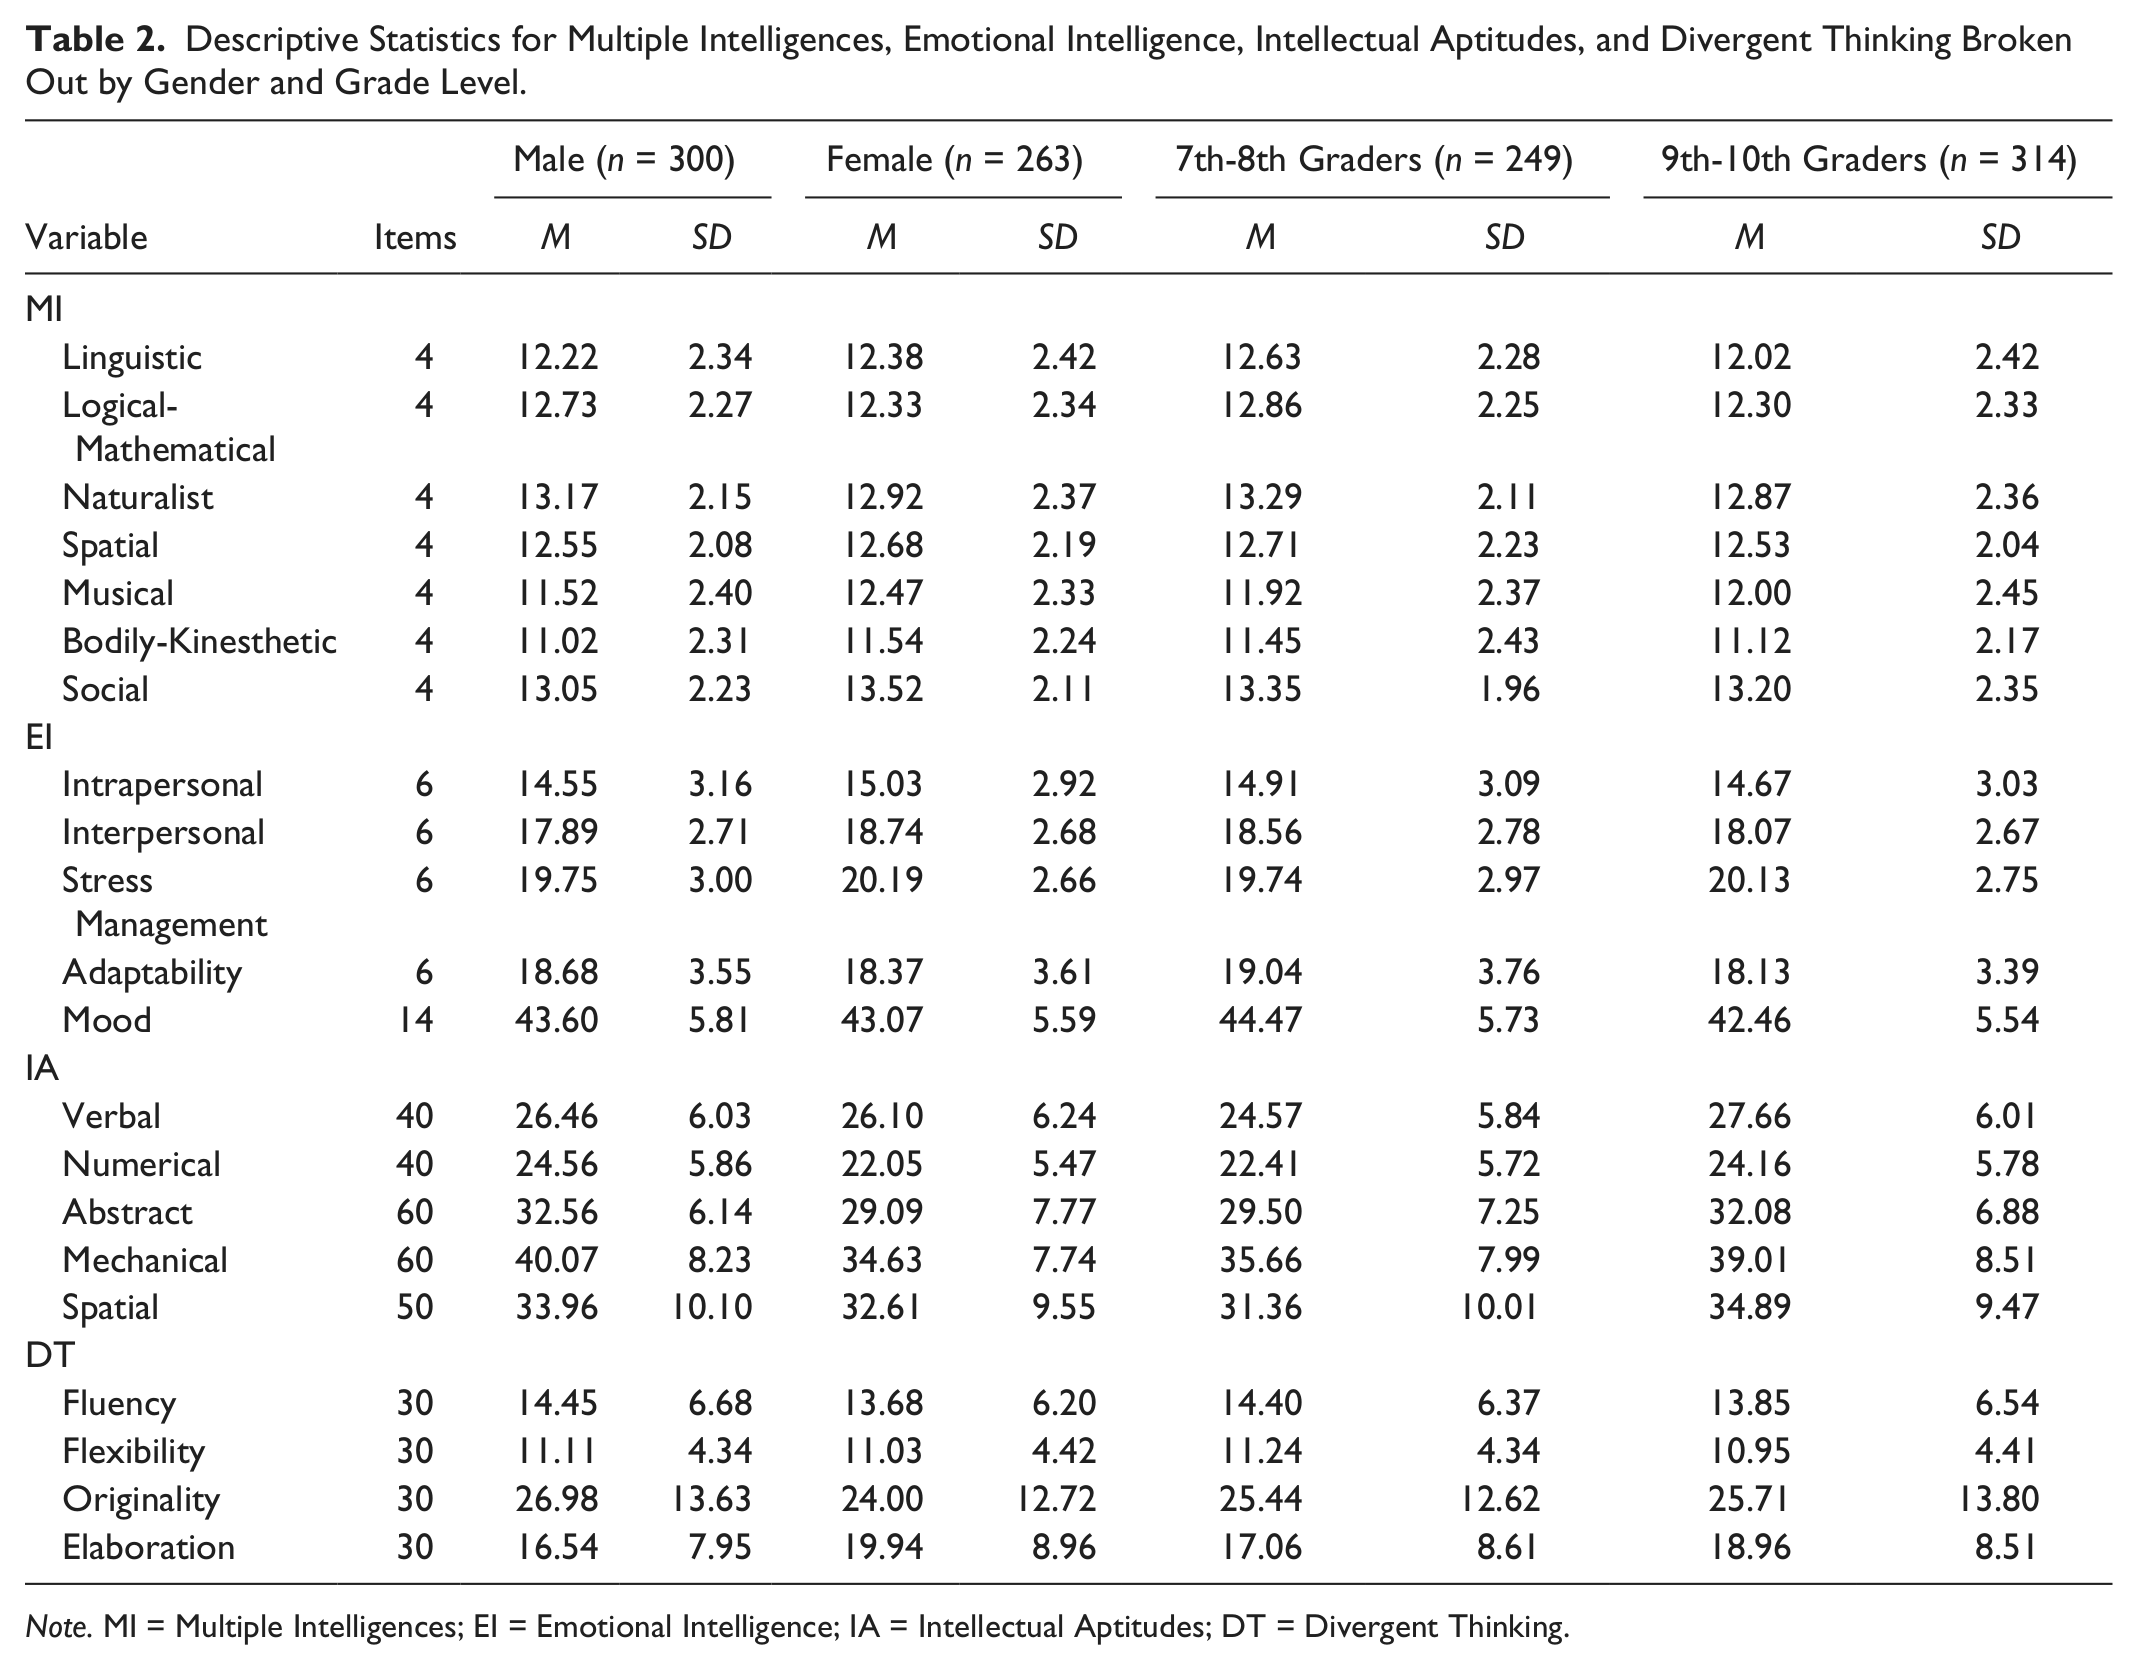
Note. MI = Multiple Intelligences; EI = Emotional Intelligence; IA = Intellectual Aptitudes; DT = Divergent Thinking.
Inferential Analyses
Two-way analyses of variance (ANOVA) were conducted to examine the effects of gender and grade on the psychological variables included in this study. The fixed factors were gender and grade. The dependent variables were the raw scores of the 21 subtests of teachers’ perception of students’ MI and EI and students’ objective performance in the IA and DT tests. A Shapiro–Wilk test indicated that all the dependent variables were normally distributed for the groups formed by the combination of the gender and grade level. There was homogeneity of variance between groups as assessed by Levene’s test for equality of error variances.
Gender and grade differences on teachers’ perceptions of students’ MI and EI
Regarding teachers’ ratings on student MI, results showed that there was a small but statistically significant interaction effect of gender and grade on the visual intelligence subscale score, F(1, 562) = 5.18, p = .023, η2 = .009. Univariate analyses showed that teachers rated girls statistically significantly higher than boys on spatial intelligence at seventh and eighth grades (p = .024), but there was no significant difference in spatial intelligence on ninth- and tenth-graders (p = .378). No statistically significant interaction effects of gender and grade were found on the rest of the MI subscale scores. However, there were significant main effects of gender on musical, F(1, 562) = 23.32, p < .001, η2 = .040; bodily-kinesthetic, F(1, 562) = 9.14, p = .003, η2 = .016; and social intelligences subscale scores, F(1, 562) = 7.67, p = .006, η2 = .014. Teachers rated girls as slightly higher than boys on musical, bodily-kinesthetic, and social intelligences. Moreover, the results of the two-way ANOVAs revealed that there was a significant main effect of grade on linguistic, F(1, 562) = 9.78, p = .002, η2 = .017; logical-mathematical, F(1, 562) = 8.19, p = .004, η2 = .014; and naturalist intelligences, F(1, 562) = 4.86, p = .028, η2 = .009. Surprisingly, teachers scored younger students (7th- and 8th-graders) as slightly higher than older students (9h- and 10th-graders) on linguistic, logical-mathematical, and naturalistic intelligences.
With regard to teachers’ perceptions of students’ EI, the two-way ANOVAs showed a significant interaction between the effects of gender and grade on the adaptability subscale, F(1, 562) = 7.18, p = .008, η2 = .013. Simple main effects analysis showed that teachers rated girls at 7th and 8th grades significantly higher than girls at 9th and 10th grades in adaptability (p < .001), but there were no significantly differences in adaptability between boys 7th to 8th grades and 9th to 10th grades (p = .704). No statistically significant interaction effects of gender and grade were found on the rest of the EI subscale scores. However, a statistically significant main effect on gender was found in two EI variables: intrapersonal, F(1, 562) = 4.47, p = .035, η2 = .008; and interpersonal intelligences, F(1, 562) = 17.30, p < .001, η2 = .030. An examination of the means indicated that teachers rated girls higher than boys in both variables. A significant main effect on grade also was found in mood, F(1, 562) = 18.00, p < .001, η2 = .031, with teachers reporting higher levels of mood in younger nominated students than in older nominated students.
Gender and grade differences on students’ performance on the IA and DT tests
The results of the two-way ANOVAs for comparing gender and grades on students’ objective IA performance indicated that there were no significant interaction effects on any of the IA dependent variables. Results also revealed significant main effects for grade for all IA dependent variables: verbal, F(1, 562) = 37.80, p < .001, η2 = .063; numerical, F(1, 562) = 16.22, p < .001, η2 = .028; abstract, F(1, 562) = 24.01, p < .001, η2 = .041; mechanical, F(1, 562) = 32.18, p < .001, η2 = .054; and spatial, F(1, 562) = 19.07, p < .001, η2 = .033. Nominated older students obtained higher scores on all the IA subscales. Significant main effects for gender also were found for numeric, F(1, 562) = 29.52, p < .001, η2 = .050; abstract, F(1, 562) = 39.18, p < .001, η2 = .066; and mechanical reasoning, F(1, 562) = 72.13, p < .001, η2 = .144, with nominated boys scoring higher than nominated girls at both seventh to eighth and ninth to tenth grades on the three variables.
With regard to students’ performance in the DT test, univariate analysis indicated no significant interaction effect of gender and grade on any of the DT dependent variables. A significant main effect for gender was found for originality, F(1, 562) = 6.93, p = .009, η2 = .012, and for elaboration, F(1, 562) = 21.50, p < .001, η2 = .037. Specifically, nominated boys offered significantly more original ideas while girls provided significantly more elaborative ideas in the DT test. In addition, a significant main effect for grade was observed for elaboration, F(1, 562) = 4.66, p = .031, η2 = .008, with older students incorporating significantly more details to their ideas than younger students.
Correlation Analyses
Correlation analyses were performed to analyze the relationships between the key variables of the study using standardized scores because of the different structure of the test subscales of the instruments (see Table 3). Cohen’s (1988) guidelines were used to interpret the strength of the relationships in the correlation analyses.
Correlation Matrix of Multiple Intelligences, Emotional Intelligence, Intellectual Aptitudes and Divergent Thinking.

Note. MI = Multiple Intelligences; EI = Emotional Intelligence; IA = Intellectual Aptitudes; DT = Divergent Thinking.
p < .05. **p < .01. ***p < .001.
On the one hand, the analysis of the correlation matrix evidenced four blocks of significant correlations, which corresponded to the instrument subscales correlating with each other. First, all correlations among MI were significant (r = .38 to r = .71, p < .001). Second, low to moderate correlations were achieved among all EI dimensions (r = .17, p < .01, to r = .46, p < .001), except for stress management. Third, results showed that all IA related to each other moderately (r = .38 to r = .58, p < .001). Fourth, fluency, flexibility, and originality dimensions were highly correlated with each other (r = .83 to r = .93, p < .001). However, elaboration was only weakly but still statistically significant related to the rest of the DT dimensions (r = .21 to r = .24, p < .01).
On the other hand, the instruments showed no or relatively low correlations with each other. First, teachers’ perceptions of students’ MI showed low correlations with the objective test of students’ IA. Only teachers’ evaluations of students’ linguistic, logical-mathematical, and naturalist intelligences were related to students’ performance on verbal and numerical subtests (r = .13 to r = .22, p < .01). Similarly, correlations between teachers’ perceptions of students’ EI and students’ performance in the IA test were found to be low. Second, results indicated no relationship between teachers’ perceptions of students’ MI and EI and students’ performance on DT. Third, the subscales of the two teachers’ perception instruments (i.e., MI and EI) showed statistically significant correlations with each other. Interpersonal intelligence, adaptability, and mood were low-to-moderate related to all MI (r = .17 to r = .44, p < .01); and social intelligence was significantly related to all EI subscales (r = .16, p < .01, to r = .48, p < .001). Finally, the measures of objective students’ performance on IA and DT showed low relationships to each other. Only students’ numerical and mechanical aptitudes correlated with fluency, flexibility, and originality (r = .11 to r = .18, p < .01).
Cluster Analysis
A hierarchical cluster was conducted using Ward’s agglomerative method and Euclidean distance as dissimilarity measure to determine whether students could be classified into homogeneous groups corresponding to gifted profiles according to teachers’ perceptions of MI and EI and students’ performance on IA and DT tests. To be able to validate the final cluster solution, the total sample of 563 was randomly split into three groups. The cluster analysis was performed on 183 randomly selected cases and then validated on the remaining two subsamples of 190 cases. Because of the different structure of the test subscales, instruments’ standardized composite scores were used in this analysis.
By monitoring the change of cluster agglomeration coefficients and examining the dendogram, five distinct subgroups were found to provide the most parsimonious classification of the data (Hair, Anderson, Tatham, & Black, 1998). Means and standard deviations of the five clusters of nominated students are provided in Table 4 and illustrated graphically in Figure 1. To confirm the differences in these clusters, a Kruskal–Wallis test was conducted. Significant differences were evident across the five clusters at all MI, EI, IA, and DT subscales: χ2(4) = 17.91-82.76, Asymp p < .001; except for DT elaboration: χ2(4) = 5.52, Asymp p = .238. Then, the elaboration DT subscale was ignored in the interpretation of the clusters.
Clustering Variable Mean Values From the Hierarchical Cluster Analysis of Z-Score for the Randomly Selected Subsample (n = 183).

Note. MI = Multiple Intelligences; EI = Emotional Intelligence; IA = Intellectual Aptitudes; DT = Divergent Thinking.
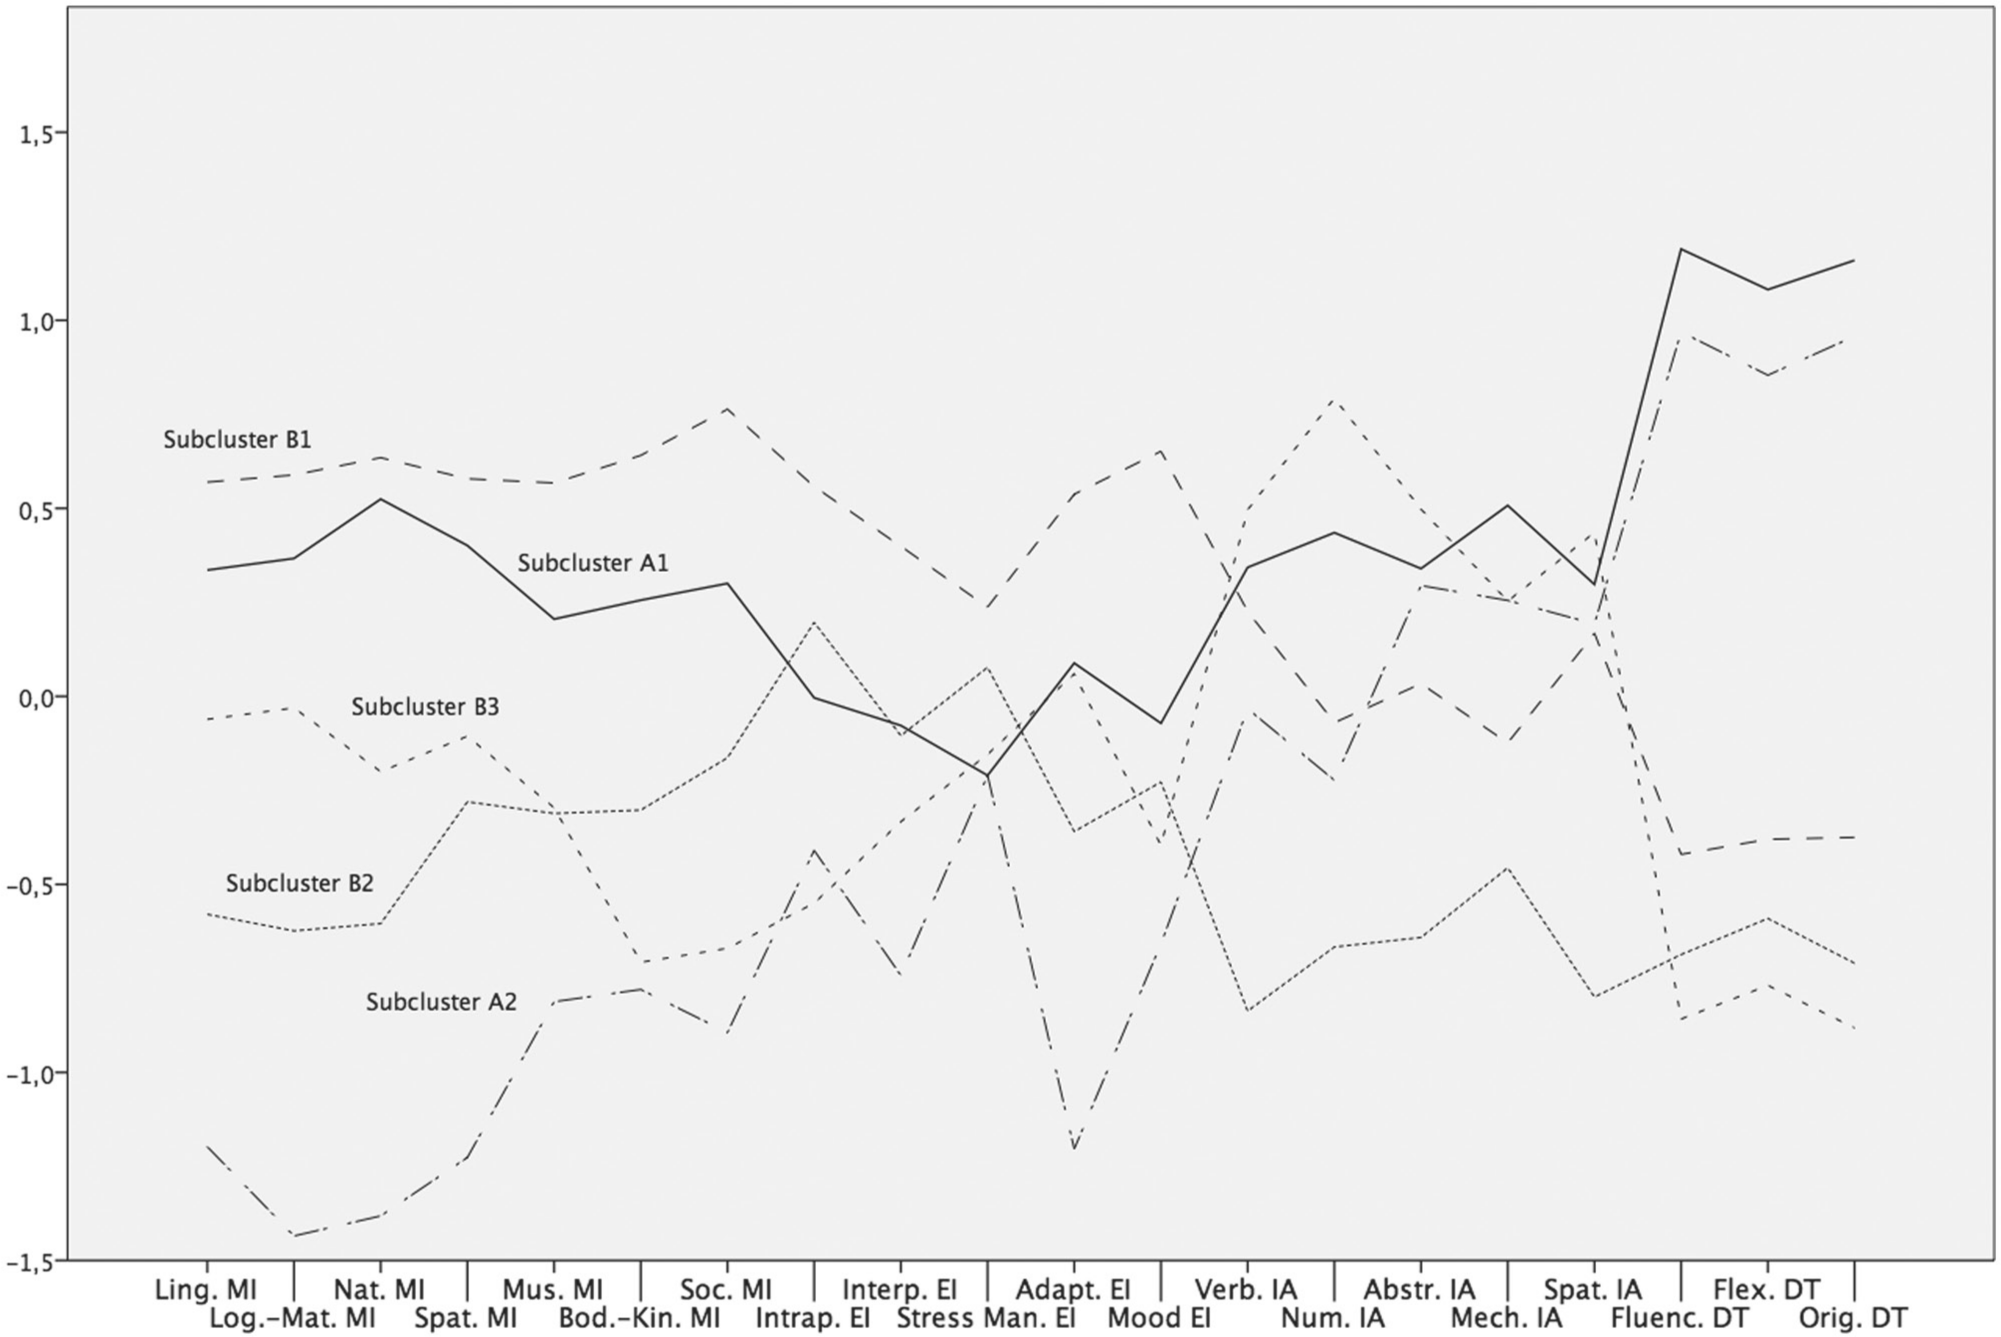
Graphical representation of the clustering variables means.
A closer analysis and interpretation of Table 4 and Figure 1 suggested that the five clusters could fell into two main clusters, those scoring above the sample means on the DT scales and those scoring below the sample means on the DT scales.
The high DT cluster (Cluster A) could be further divided into two subclusters:
A first subcluster (A1) with students scoring at or above the sample means on all other variables. This subcluster included 38 (20.76% of the total sample) nominated students.
A second subcluster (A2) scored at (for IA) or below the sample means on all other variables. Of special note were the Adaptability (EI) and the “intellectual” MI variables, which were 1 SD or more below the sample means. This subcluster included a total of 22 (12.02% of the total sample) nominated students.
The low DT cluster (Cluster B) could be further divided into three subclusters:
A first subcluster (B1) scored above the mean for MI and EI and at the sample mean for IA. This may indicate a bias toward high scores on the two teacher rating scales. This subcluster included 56 (30.6% of the total sample) nominated students.
A second subcluster (B2) with students scoring lower than the students in Subcluster B1 on all variables and when compared with the other four subclusters. In a sense, Subclusters B1 and B2 could be the upper and lower ends of one subcluster (i.e., the variable profile is similar). This subcluster included 43 (23.50% of the total sample) nominated students.
A third subcluster (B3) scored lower than Subcluster B1 on all variables except for IA and the “intellectual” MI variables, which were higher. This subcluster seemed to reflect a lack of correspondence between teachers’ perceptions and objective measures of intellectual performance and included 24 (13.11% of the total sample) nominated students.
Gender and grade differences among the five clusters
A chi-square analysis was conducted to see if significant differences in the number of male and female members existed within the five subclusters. The overall chi-square of the five subclusters was not significant, χ2(4, N = 183) = 3.863, p = .425. Additionally, a chi-square analysis was conducted to see if significant differences in the number of younger and older nominated students existed within the five subclusters. The overall chi-square of the five subclusters was not significant, χ2(4, N = 183) = 4.158, p = .385. Results then indicated that differences among subclusters in the number nominated students were not statistically significant for either gender or grade.
Discussion
This study explored the characteristics leading teachers to nominate gifted students in Spain. To ensure a large coverage of multiple variables where giftedness could be shown, we analyzed several demographic and psychological characteristics of a sample of secondary students in Spain who were nominated as gifted by their teachers.
General Gifted Profile of Nominated Students
The results indicated that nominated students had a general profile characterized by higher scores in verbal, mechanical, and spatial reasoning, as well as in naturalist intelligence; and lower scores in numerical and abstract reasoning and in artistic abilities (i.e., musical and bodily-kinesthetic). These results suggested that Spanish teachers tend to relate giftedness with high scores in the field of intelligence and factors related to academic learning rather than variables in the field of the arts, as has been reported elsewhere (Endepohls-Ulpe & Ruf, 2005; Kim et al., 2009; Moon & Brighton, 2008). In the academic field, the results also indicated that teachers nominated more frequently students who demonstrated mastery in the verbal area than in the numerical area, as has been shown in other studies (e.g., Hodge & Kemp, 2006; Siegle et al., 2010). In addition, teachers indicated that students excelled in their social intelligence. Thus, features such as emotional management, ability to relate to others, and optimism appear to be very valued by teachers when considering a student as gifted. This supported the idea that secondary teachers in Spain tend to nominate students with positive behaviors rather than students with disruptive behaviors, as has been noted elsewhere (e.g., Davis et al., 2011; Fernández et al., 2011; Hernández et al., 2011; Siegle et al., 2010).
Impact of Gender and Grade in the Nomination of Gifted Students
Scientific literature indicates that teachers tend to nominate as gifted boys more frequently than girls (Bianco et al., 2011; Endepohls-Ulpe & Ruf, 2005; Lee, 1999). Our study confirmed this trend, with teachers nominating 7% more boys than girls. In addition, results showed that gifted profiles were different depending on the gender of the participants. On the one hand, teachers rated nominated girls higher in musical, bodily-kinesthetic, social, interpersonal, and intrapersonal intelligences. Also, nominated girls were rated higher than boys in spatial intelligence at seventh and eighth grades. Additionally, nominated girls scored higher than boys in elaboration. These results indicated that teachers believe that gifted girls were more competent in the socio-affective and artistic areas, in line with previous research in this area (e.g., Gagné, 1993; Lee, 2002). On the other hand, nominated boys scored higher in numerical, abstract, mechanical reasoning, and originality, also confirming the stereotype of boys being more able in the areas under the science, technology, engineering, and mathematics framework (Gagné, 1993; Lee, 2002).
Despite the small difference in the grade of the participants, the results showed some variances between younger and older students. Unexpectedly, teachers rated younger students with higher scores in the academic areas (i.e., linguistic, logical-mathematical, and naturalist intelligences), but older participants obtained higher scores in all IA when they were assessed by a performance-based test. A plausible explanation for this has been given by Siegle et al. (2010), who suggested that teachers of younger students are less demanding than teachers in more advanced levels when identifying students’ outstanding abilities.
Relationships Between Teachers’ Perceptions of Students’ Intelligences and Students’ Performance on Objective Tests
In general, the relationship between teachers’ perceptions of students’ strengths on MI and EI and students’ objective performance IA and DT test was found to be low. Four plausible reasons may explain the absence of correlation among the MI, IA, and DT tests. First, these instruments assess different constructs. The IM test assesses students’ capacity to solve problems that are of value to a specific culture in different areas as perceived by their teachers (Gardner, 1983); the IA test evaluates the degree of readiness to learn and to perform well in a particular situation or domain (Corno et al., 2002); and DT involves production of ideas from given information with emphasis in variety and quantity of output (Guilford, 1968), which is different from MI. Second, the MI instrument addresses teachers’ perceptions of students’ abilities, while the IA and DT tests refers to students’ objective performance. Although some studies have demonstrated that teachers are reasonably accurate at estimating students’ overall, verbal, mathematical, and spatial abilities (e.g., Chamorro-Premuzic, Artcehe, Furnham, & Trichot, 2009), others have shown that teacher are not accurate in assessing students’ reading and mathematical functioning (Eckert, Dunn, Codding, Begeny, & Kleinmann, 2006). Additionally, there is evidence that teachers tend to dismiss creative potential when identifying gifted students at school (Getzels & Jackson, 1958; Torrance, 1962). Third, each instrument addresses different areas or domains. While the MI instrument includes a broad range of more traditional (i.e., linguistic, logical-mathematical, naturalistic) and less traditional academic areas (e.g., bodily-kinesthetic, musical, social), the IA test focuses only on cognitive areas. In fact, only MI and IA related to traditional academic areas, specifically between teachers’ perceptions of students’ linguistic and logical-mathematical intelligences and students’ performance on verbal and numerical aptitude subtests. Fourth, these instruments also are different in how they evaluate students’ strengths, with the MI instrument assessing students in a more practical and natural environment and the IA and DT tests using decontextualized and abstract tasks.
No relationships were found between teachers’ perceptions of students’ EI and students’ performance in the IA and DT test. This may be explained taking into account that, while some researchers have indicated that EI is set of emotion-related cognitive abilities (e.g., Mayer, Roberts, & Barsade, 2008), EI should be better understood as a construct that lies outside the taxonomy of human cognitive ability (Carroll, 1993; Petrides, 2011). Also, only a limited number of studies of DT have been directly undertaken in relation to EI to date, suggesting that both constructs are unrelated (Guastello, Guastello, & Hanson, 2004; Sánchez-Ruiz, Hernández-Torrano, Pérez-González, Batey, & Petrides, 2011).
Gifted Profiles of Nominated Students by Their Teachers
Two general gifted profiles based on the scores of the students nominated as gifted by their teachers were identified. The first general gifted profile (Cluster A) scored above the sample means on the DT scales and could be further divided into two subclusters.
Subcluster A1 was composed of students with high scores on all the variables included in this study, especially in the IA and DT scales. These results showed that teachers were able to identify a set of students with outstanding abilities in more than one area or domain, as it is recognized by most of the current definitions of giftedness (e.g., Gagné, 2000; Gardner, 1993; Renzulli, 1978; Sternberg, 1997). This subcluster was named the general gifted group.
Subcluster A2 obtained the highest scores in DT and demonstrated high ability in abstract, mechanical, and spatial reasoning compared with the rest of the groups. However, teachers rated students in this group very low on MI and EI. Teachers probably nominated the students in this group as gifted because of an outstanding performance in creative and “nonacademic” intellectual aptitudes (i.e., abstract, mechanical, and spatial). Also, the low scores in the affective-related variables, especially in adaptability, indicated that teachers saw the artist group as more impulsive, more anxious, with emotional vulnerability, propensity to experience negative feelings, and less able to control their emotions when compared with other groups, as it has been shown in other studies (Botella, Zenasni, & Lubart, 2011; Burch, Pavelis, Hemsley, & Corr, 2006; Feist, 1998; Sánchez-Ruiz et al., 2011). This subcluster was named the creative gifted group.
The second general gifted profile (Cluster B) scored below the sample means on the DT scales and could be further divided into three subclusters.
Subcluster B1 was defined by high teachers’ ratings on EI and IM, scores at the sample mean for IA, and low scores in the DT subtests. This subcluster was named the social-emotional gifted group. The term emotional giftedness has been previously used in the literature as the capacity to be aware of one’s own and other people’s feelings, to differentiate among feelings, deal realistically with life, and move normally through their developmental phases, including concepts like sense of justice, moral sensitivity, and forgiveness, among others (Dabrowski & Piechowski, 1977; Mayer, Perkins, Caruso, & Salovey, 2001; Piechowski, 1997; Roeper, 1982). Teachers nominated the students in this group as gifted probably because they perceived them as having a high ability to understand, express themselves and others and relate to them, as well as to deal with daily demands in a social context. An alternative explanation for this may be that teachers tend to nominate as gifted those students with most desirable behavioral characteristics at school. Then, students who are achievers and teachers pleasers, perceived as socially competent and cooperative, and effectively relate to teachers and peers, are positively appreciated by their teachers and may have more probabilities to be nominated as gifted by their teachers (Davis et al., 2011; Davis & Rimm, 1994). This also may explain why the largest number of students was included into this group (30.6%).
Subcluster B2 included students with average and low scores on all dimensions included in this study. This suggests that students in this group have outstanding abilities that have not been considered in this study but led teachers to nominate them as gifted. This subcluster was named the moderate gifted group.
Subcluster B3 performed well in aptitude tests and the “academic” MI variables, but obtained the lowest scores in the creative abilities. Also, their teachers rated them low in social-emotional intelligence. Presumably, this group does well in school and responds appropriately in academic contexts, but has some difficulties to generate original ideas, relate to them, or produce a creative product. The characteristics of this group are related to what Renzulli called schoolhouse giftedness (Renzulli, 1978). This term is used to define those students who are good lesson learners in traditional school achievement, excel in the school setting, and often score high on tests and get good grades. Schoolhouse giftedness is complementary to creative-productive giftedness, which includes a set of characteristics that favor the development of creative products targeted to a specific audience (Reis & Renzulli, 2011; Renzulli, 1978). This subcluster was named the academic gifted group.
No significant differences in the number of nominated students regarding students’ gender and grade were found among the five subcluster groups.
Limitations, Directions for Future Research, and Educational Implications
One limitation of this study is that teachers nominated students without access to any guidelines and predetermined characteristics about the gifted students. Results could be very different if teachers had a clear understanding of the characteristics that define giftedness. Future studies may analyze whether these results change after teachers receive a professional development module on gifted identification. Additionally, it is important to consider that two types of instruments were used on this study. On the one hand, two instruments refer to teachers’ perceptions of students’ abilities and interpretation of these results should not be confused with actual abilities. On the other hand, two instruments address real students’ performance and should be considered as students’ objective achievement. Also, caution should be exercised in the interpretation of the cluster analysis as this type of analysis imposes hierarchical structure on data, whether real or not.
In general, this research allowed us to establish some educational implications for future identification procedures of gifted students. First, it seems essential to clarify for teachers that males and females can be gifted in the same proportion. In this study, teachers’ nominations were biased by gender and grade stereotypes and misunderstandings, including nominations of a larger number of boys than girls, a tendency to nominate males with higher abilities in cognitive variables (e.g., verbal, numerical, and mechanical reasoning) and girls with higher abilities on artistic (e.g., bodily-kinesthetic, musical) and emotional dimensions, as well as perceiving younger students with higher abilities than older students while the later performed better in objective assessments than the former.
Second, this study demonstrated that students could be gifted in different areas. Traditional identification procedures based on a narrow range of cognitive and academic make it difficult to determine multiple types of giftedness. New identification procedures for gifted and talented students; inclusion of new instruments and assessment techniques beyond traditional IQ measures, such as rating scales, portfolios, and dynamic assessments; and consideration of both cognitive and noncognitive factors (i.e., creativity, motivation, leadership, interests) may be more effective in identifying students with multiple gifts and talents (see Pfeiffer, 2012, for a revision of the current perspectives on evaluation and assessment of gifted students).
Third, while teachers spend many hours with students at school, they are still limited to a particular area and a restricted to number of situations where students may manifest their talents. Including other sources of information (i.e., parents, peers, self, judges) in the identification process may provide valuable information about the abilities of the students in different areas and contexts that may be invisible to teachers’ perceptions. Furthermore, there are likely areas that were untapped by our assessment instruments that led to teachers’ nominating students as gifted. Future research should explore these additional traits.
Finally, and most important, the ultimate goal of gifted identification procedures must be viewed as a decision-making process to provide gifted students with the most appropriate educational opportunities based on their identified characteristics, which will help them reach their potential.
Footnotes
Acknowledgements
The first author wishes to thank Dr. E. Jean Gubbins for her brilliant insights.
Declaration of Conflicting Interests
The authors declared no potential conflicts of interest with respect to the research, authorship, and/or publication of this article.
Funding
The authors disclosed receipt of the following financial support for the research, authorship, and/or publication of this article: This work was supported by the Fundación Seneca, Agencia de Ciencia y Tecnología de la Región de Murcia (18563/PD/11; 11896/PHCS/09) and the Ministerio de Ciencia e Innovación, Gobierno de España (EDU2010-16370).