
Abstract
Current approaches to gifted identification suggest collecting multiple sources of evidence. Some gifted identification guidelines allow for the interchangeable use of performance and nonperformance identification methods. This multiple criteria approach lacks a strong overlap between the assessment tools; however, interchangeable use of the instruments (replacing one for another) entails high regularity. This meta-analytic review investigated the consistency of using performance and nonperformance identification methods by examining the influence of three moderators in two different study analyses. Study 1 focused on correlational and comparison studies by using Pearson r as the index of effect size within a three-level multilevel design. Study 2 was conducted with three diagnostic proportional metrics: efficiency, effectiveness/sensitivity, and specificity. Results from Study 1 indicated the overall correlation between the performance and nonperformance gifted identification methods was medium (r = .30). Teacher ratings yielded significantly higher consistency with performance measures than teacher or parent nomination and self-ratings. Study 2 showed that nonperformance methods are relatively strong in terms of specificity (70%) and effectiveness/sensitivity (59%) but not very efficient (39%). Analyses of four diagnostic quadrants indicated that performance and nonperformance gifted identification methods, when used alone, tend to identify different students who would not be identified otherwise despite some amount of convergence between the two. Our findings indicated that nonperformance and performance gifted identification methods cannot replace each other. They should be used concurrently rather than be used alone or consecutively.
Keywords
Identification of gifted and talented students has been one of the most controversial issues in the field (Heller, 2004; Kirschenbaum, 1983; Renzulli & Reis, 2004). Research on gifted identification often starts with basic questions such as the definition and conceptualization of giftedness (e.g., Renzulli, 1990; Renzulli & Reis, 2004; Sternberg, Ferrari, Clinkenbeard, & Grigorenko, 1996; Worrell & Erwin, 2011). Identification practices are operational responses to the crucial questions about the nature and education of giftedness. More important, identification procedures result in high-stakes decisions such as the inclusion and/or exclusion of students into specialized programs. Therefore, decisions and strategies of gifted identification must rely on empirical evidence.
Identification procedures have evolved from traditional approaches focused solely on intelligence quotient (IQ) or achievement tests to contemporary approaches involving a wide variety of instruments and strategies such as portfolios, teacher, parent, and self-ratings and nominations, and other authentic assessments used together or in combination (Alvino, McDonnel, & Richert, 1981; Brown et al., 2005; Coleman & Gallagher, 1995; Evans, 1996; Pfeiffer, 2003). The progressive move toward multiple sources of identification evidence mitigates some of the criticism against the traditional methods such as absence of an agreed-on cutoff score (Kirschenbaum, 1983) and concerns on the fairness of the standardized tests (Frasier, García, & Passow, 1995). This extension is also consistent with the definitions of giftedness that go beyond IQ (Marland, 1972; National Association for Gifted Children, 2009, 2013, 2015) and are inclusive of components of giftedness such as leadership (Haroutounian, 1995).
Broadly speaking, there are two major forms of gifted identification methods: performance and nonperformance. Early performance methods relies on the use of tests of intelligence (Martinson, 1974; Pegnato & Birch, 1959; Sternberg, 1986). While research has shown high IQ equaling giftedness to be a myth (J. H. Borland, 2009), IQ tests are among the most frequently used instruments for gifted identification (McClain & Pfeiffer, 2012; National Association for Gifted Children, 2015). As a result of more complex conceptualizations of giftedness such as The Three-ring Conception of Giftedness that includes creativity and motivation (Renzulli, 1978, 2011), tests of achievement, aptitude, and creativity have become part of the gifted identification criteria (Archambault et al., 1993; Council of State Directors of Programs for the Gifted, 1999; Georgia Department of Education, 2014; Hunsaker & Callahan, 1995; Torrance, 1984).
A typical characteristic of the performance approach to gifted identification is that respondents obtain a score from the assessments that is indicative of their performance on the required tasks without any involvement of teachers, parents, or others. There is little or no room for the judgments of scores besides the actual performance of the respondent. Opinions, observations, or anecdotal evidence by teachers or parents for or against students do not count toward students’ eligibility for identification. The only source of data is the students’ performance on the required tasks. Therefore, this approach can be called “performance-based identification methods” or “performance methods.”
In spite of their capacity to predict academic achievement and job performance (Neisser et al., 1996), the use of performance measures (e.g., IQ tests) as the only indicator of giftedness is problematic because expected behavioral outcomes such as achievement cannot only be attributed to IQ, which research as shown accounts for about 50% of the variability at best (Anderson & Keith, 1997). More important, such measures can limit the access to gifted education services when not accompanied by alternative approaches (VanTassel-Baska, Feng, & Evans, 2007).
The second category (i.e., nonperformance method) represents all other gifted identification approaches not involving any performance-based assessment. Examples of forms of assessment in this category are teacher rating scales, teacher and parent nominations, self-ratings, and peer-ratings. A common characteristic of the nonperformance method is that judgments, instead of test scores, are highly involved in the assessment. If an instrument (e.g., rating scale) is used, the scores are obtained through judgments of self, peers, parents, or teachers. This method falls under the “alternative assessment” (see Pfeiffer, 2015), but this category will be called “nonperformance methods.”
The 2014-2015 State of the States Report (National Association for Gifted Children, 2015) provided information about the current practices on identification strategies. Multiple criteria (Frasier, 1997; Friedman-Nimz, 2009; National Association for Gifted Children, 2015) was the most common identification model (19 states) and IQ tests were the most common instruments (19 states), along with the use of achievement data (19 states), and followed by nomination (12 states), various state-approved assessments (9 states), and portfolios (8 states). Multiple criteria not only lead to assessment beyond IQ testing but also allowed the inclusion of alternative assessments such as teacher and parent nominations and teacher rating scales (Pfeiffer, 2015).
The trends in identification toward nonperformance gifted identification methods led to the development of many rating scales (Jarosewich, Pfeiffer, & Morris, 2002) such as Gifted Rating Scales (GRS; Pfeiffer & Jarosewich, 2003), Renzulli-Hartmann Scale for Rating Behavioral Characteristics of Superior Students (Renzulli & Hartman, 1971), and Gifted and Talented Evaluation Scales (Gilliam & Jerman, 2015). The inclusion of these types of rating scales is built on the idea that teachers and parents can add meaningful information to the gifted identification process. Teacher recommendations have become a common practice for the identification of the gifted (Davis & Rimm, 2003). Gentry and Mann (2008) suggested that teachers could identify high-ability students who do not perform well on standardized tests because they observe their students in various areas over time rather than utilizing the snapshot perspective obtained from standardized tests. Rating scales and checklists provide additional information that may not be captured by the standardized tests (Chan, 2000; Hoge & Cudmore, 1986; Peterson, 1999; Pfeiffer & Blei, 2008). J. H. Borland and Wright (1994) underlined the importance of using alternative evidence such as observation, dynamic assessment, and the best performance rather than standardized performance tests especially for the identification of gifted students from economically disadvantaged and underrepresented groups.
However, alternative methods such as teacher and parent nomination and the use of ratings may be biased against gifted students with specific personality traits (Rohrer, 1995) and those who are culturally diverse (Kaufman & Harrison, 1986). In addition, some of the alternative methods (e.g., teacher or parent nomination) seem to suffer from a lack of scientific rigor (Pfeiffer & Blei, 2008) in that they categorize students as gifted candidates or not rely on teachers’ personal conceptualization of giftedness, which may be limited (Lee, 1999; Moon & Brighton, 2008; Neumeister, Adams, Pierce, Cassady, & Dixon, 2007). Furthermore, teachers could also favor students who conform to their values, expectations, rules, and instructions (George, 1979), have unusual interests (Siegle, 2001), love to read (Siegle, 2001; Siegle & Powell, 2004), or exhibit socially desirable behaviors (e.g., altruism) that are not necessarily a giftedness characteristic (Siegle, Moore, Mann, & Wilson, 2010). Teachers may also hold biases against girls (Bianco, Harris, Garrison-Wade, & Leech, 2011) and certain ethnic groups (Elhoweris, Mutua, Alsheikh, & Holloway, 2005) as the accuracy of the nominations tends to be lower for Hispanic and African American students and those students from low socioeconomic status (Alvidrez & Weinstein, 1999; Elhoweris, 2008; Masten & Plata, 2000; Masten, Plata, Wenglar, & Thedford, 1999; McBee, 2006, 2010). Overall, if teachers are not educated on gifted characteristics they may hold unrealistic expectations from gifted students (Pfeiffer, 2002).
The Current Study
Both performance and nonperformance gifted identification methods have their strengths and weaknesses and choosing one over another would be questionable in terms of identification outcomes (Pfeiffer & Blei, 2008; Worrell, 2003, 2009). The multiple criteria approach to gifted identification is more pluralist and more inclusive of diverse abilities and backgrounds (Ford & Grantham, 2003; Richert, 1987; Tannenbaum, 2003). The concurrent use of various instruments or methods is consistent with the multiple criteria approach if the different assessments have a weak or moderate correlation (Bélanger & Gagné, 2006).
In some states, school districts, and countries, performance and nonperformance gifted education methods are used interchangeably. For example, alternative methods falling under the nonperformance method heading are used for gifted identification in some states as a substitute for standardized performance tests (e.g., Georgia Department of Education, 2014; Krisel & Brown, 1997; Tennessee Department of Education, 2010). The interchangeable use of the performance and nonperformance gifted identification methods assumes that they largely converge on the same identification outcomes. Is that really the case? Can performance and nonperformance gifted identification methods be used interchangeably? Can or should they replace one another? A very high correlation between the two methods or higher values of diagnostic accuracy (e.g., sensitivity, specificity, and efficiency) such as .70 or higher (Swets, 1988) can justify this practice.
The availability of multiple identification instruments poses a challenge to practitioners in choosing the optimum combination of instruments and strategies for the identification of the gifted. McBee, Peters, and Waterman (2014) tested the usefulness of different combinations of identification strategies and provided useful tips. However, a deliberate and research-based approach to determining the best gifted identification strategies would require a comprehensive review of the literature analyzed systematically. Previous literature reviews (e.g., Hoge & Cudmore, 1986) on gifted identification strategies are dated and lack a systematic analysis. The recent studies are qualitative in nature (e.g., Worrell & Erwin, 2011) and quantitative syntheses are highly needed. This is the first meta-analytic study comparing various gifted identification methods and the degree to which they overlap.
A crucial advantage of systematic reviews is the consideration of the impact of potential moderators. The eligible studies within this meta-analytic study included three major moderators: grade level of the students who have gone through the identification process (i.e., kindergarten, elementary, middle, and high school levels), type of nonperformance gifted identification methods (e.g., self-ratings, teacher ratings, teacher nomination, and parent nomination), and type of performance gifted identification methods (e.g., tests of intelligence, tests of aptitude and achievement, and tests of creativity). Other potential moderators such as gender, target group (dominant vs. cultural or economically diverse groups), and type of performance test (verbal vs. nonverbal) were not included within this meta-analysis due to lack of sufficient studies providing information on these variables.
Comparison of the grade levels is important because researchers often site difficulties in the identification of younger students (Fatouros, 1986; Johnson, 1983; Shaklee, 1992). We also compared the consistency with the performance methods when self-ratings, teacher nominations, and teacher ratings, and teacher nomination were used. This way, we would be able to know which of the nonperformance methods deserves more attention for the practitioners. Finally, consistency was compared for intelligence, achievement, and creativity tests. We expected consistency to be lower for creativity because teachers’ conceptions of creativity are questionable (Aljughaiman & Mowrer-Reynolds, 2005; Kampylis, Berki, & Saariluoma, 2009) and typical characteristics of the creative individuals can be seen as unacceptable in a classroom (see Westby & Dawson, 1995) and may overshadow the students’ strengths.
The current study investigated the consistency of performance and nonperformance identification methods of giftedness in two different studies. Study 1 focused on studies reporting correlation values as effect sizes to investigate the relationship between performance and nonperformance methods. Study 2 focused on studies that provided values of diagnostic accuracy between performance and nonperformance assessment methods in order to clarify if one method could be substituted for the other.
Method
Study Variables
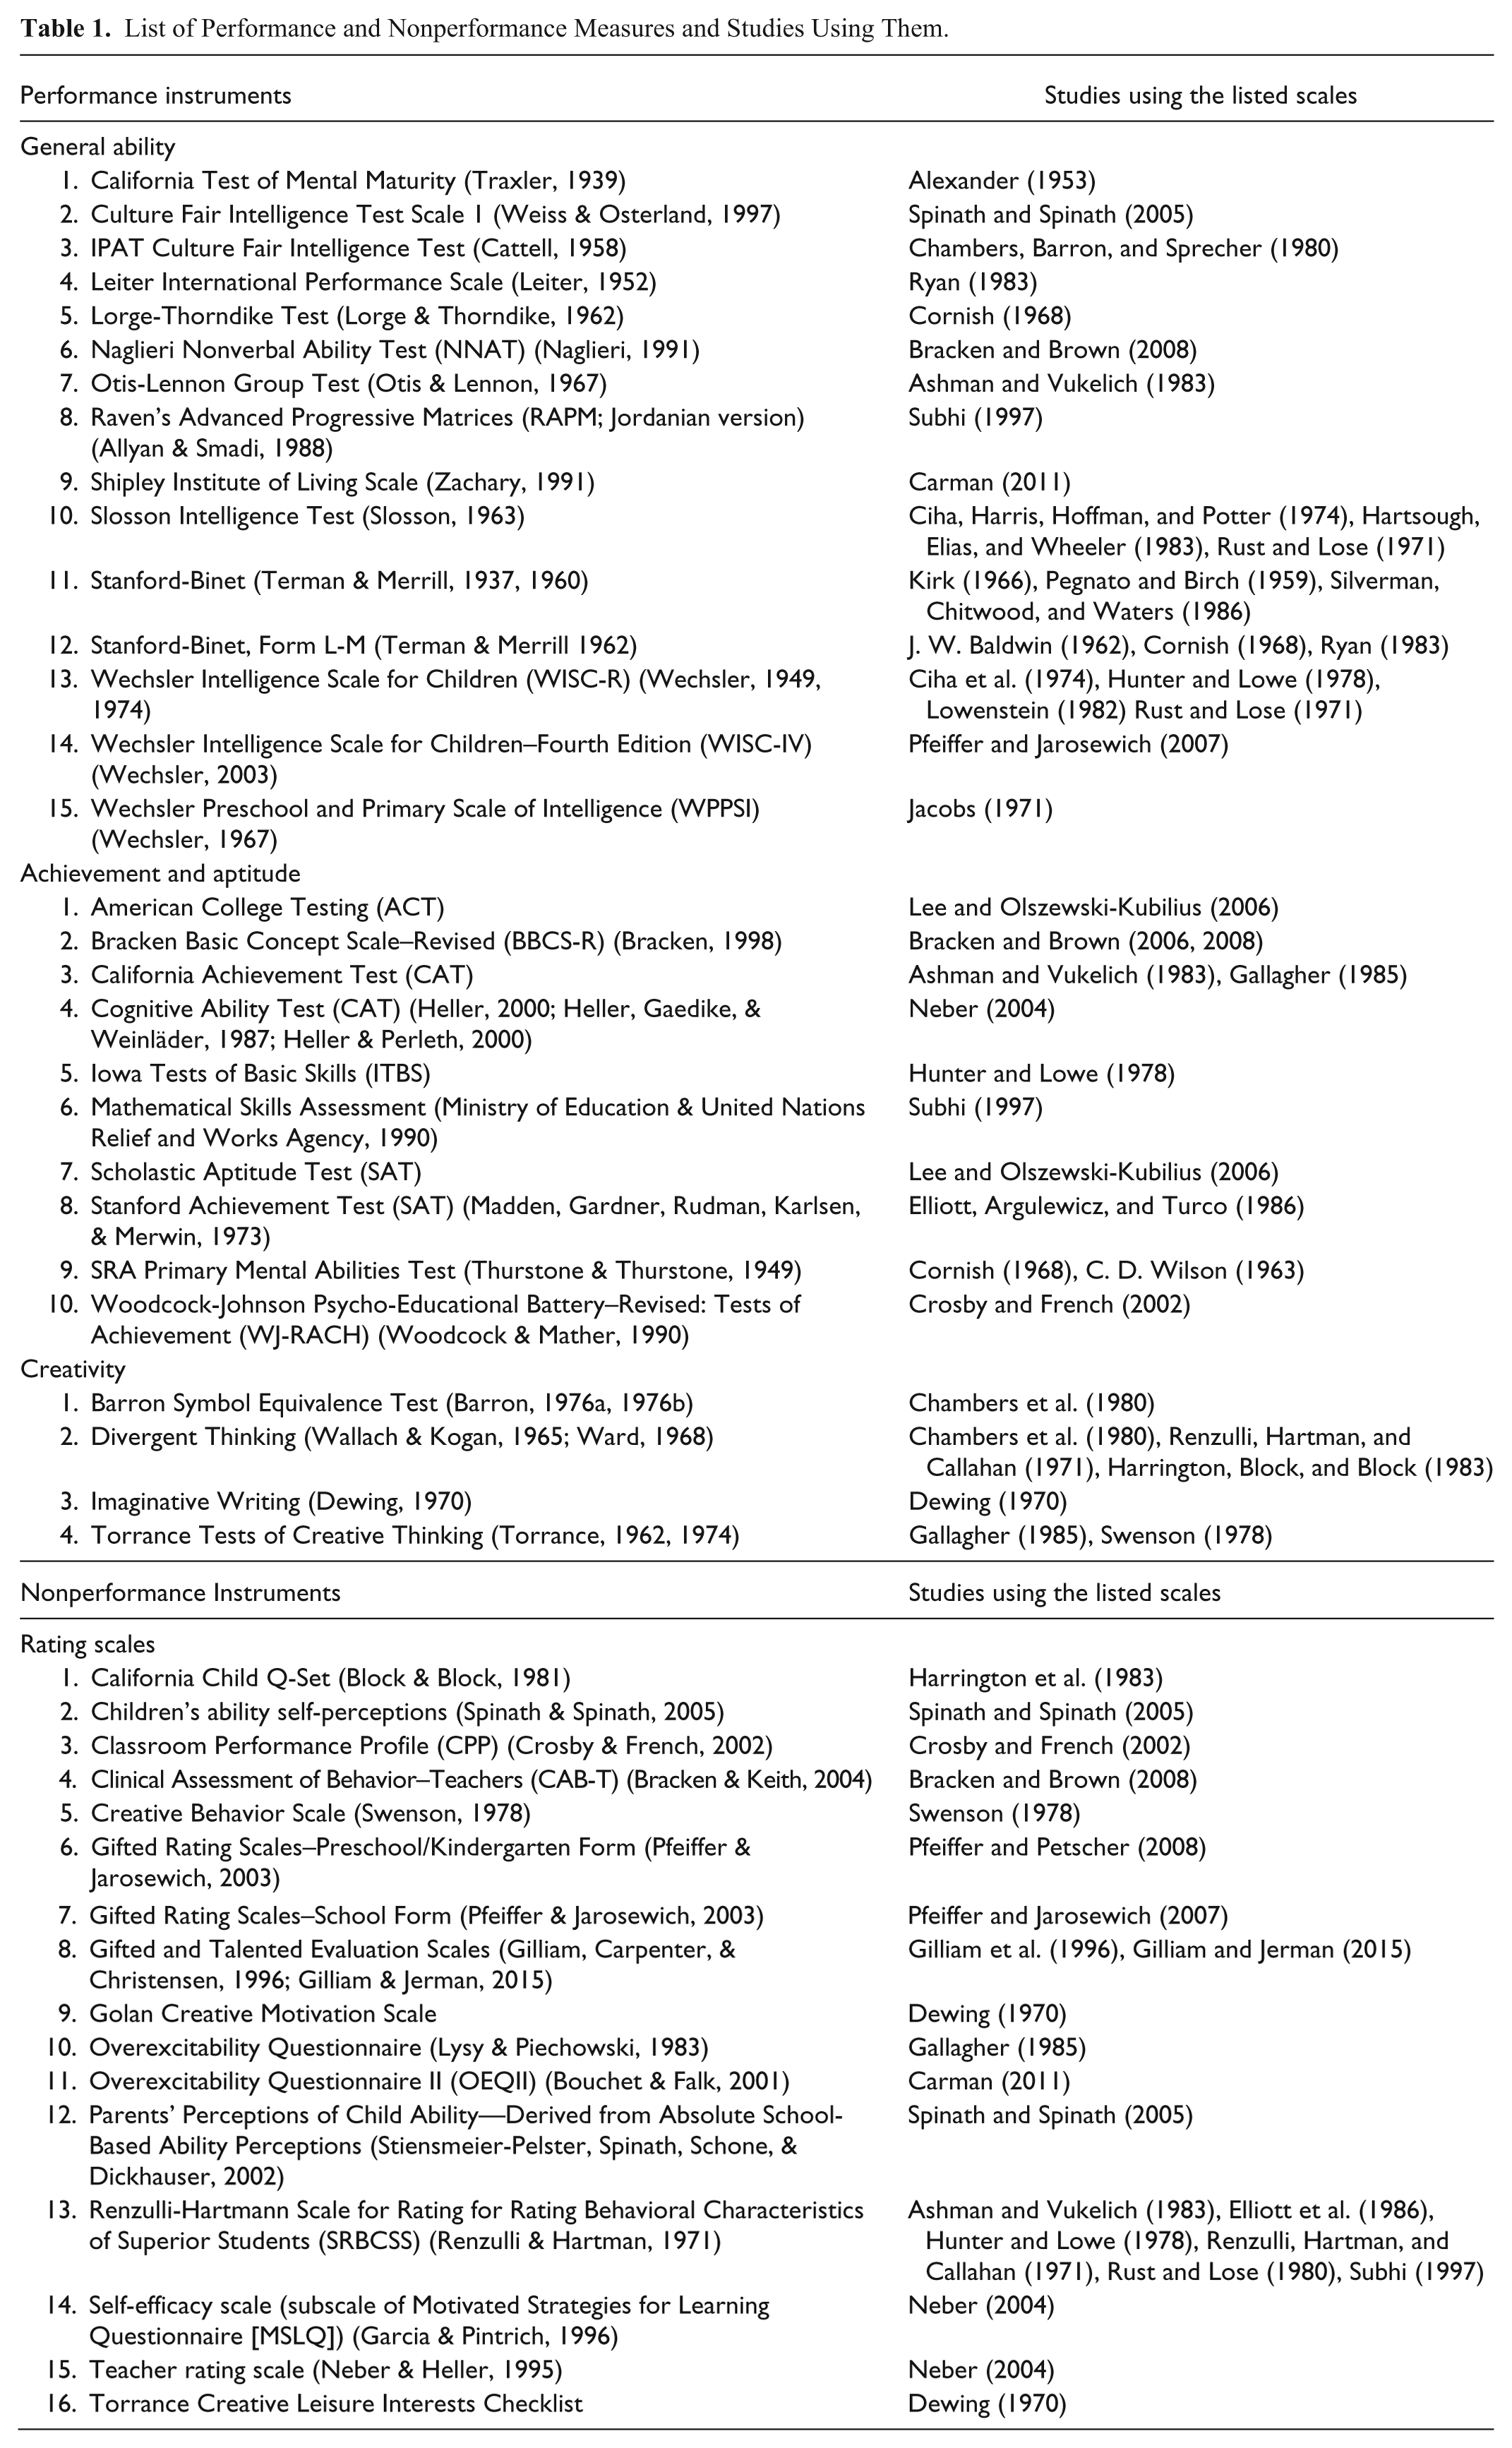
The current study examined the degree of consistency between performance and nonperformance methods that are typically used in gifted identification. The performance methods were comprised of tests of general ability and intelligence, tests of aptitude and achievement, and tests of creativity. The nonperformance methods consisted of rating scales, teacher and parent nominations, and self-nomination or self-reports. A list of instruments used in the study is provided in Table 1.
List of Performance and Nonperformance Measures and Studies Using Them.
Data Sources and Search Strategies
Combinations of several keywords were used to locate the articles such as “gifted identification,” “parent nomination,” “teacher nomination,” “teacher judgments,” “parent judgments,” “rating scales,” “performance measures,” “subjective methods,” and “objective methods.” The initial search was conducted through Academic Search Complete, EBSCOhost EJS, Psychological & Behavioral Sciences Collection, PsychARTICLES, and Google Scholar. A secondary search was conducted by a review of the references of the relevant articles located in the initial search. Last, the test manuals of the instruments used in gifted identification were reviewed.
Inclusion and Exclusion Criteria
Studies were included in this research if they met the following criteria:
Studies using only quantitative methods of analyses. Journal articles, thesis and dissertations, and test manuals were part of the search process.
Articles must include at least one type of performance and nonperformance method for the identification of the gifted.
The relationship between the two methods must be reported through necessary statistics that allow calculation of effect size (i.e., mean and standard deviation, Pearson r, t, and F values along with degrees of freedom) or one of the three diagnostic criteria of efficiency, effectiveness/sensitivity, and/or specificity.
Studies published in English after 1950.
After excluding the qualitative works from the pool of potential studies, each study was reviewed for eligibility based on the other criteria. Out of 83 quantitative studies, 32 studies did not have a research design that provided statistics between a performance and nonperformance method. Sixteen others failed to provide necessary statistics to obtain an index of effect size. The final data set included 35 studies. The articles used for this meta-analysis are marked with an asterisk in the reference list.
Data Coding
Thirty-five articles were coded by the first author through iterative process. First, a worksheet was developed by considering variables and moderators, which included grade level (i.e., kindergarten and elementary, middle school, elementary and middle school, and high school), type of nonperformance methods (i.e., self-report, teacher ratings, parental evaluation or rating, teacher nomination, and other), and type of performance methods (i.e., tests of intelligence or IQ, achievement, and creativity). After the completion of the initial coding, all levels of variables and moderators were coded numerically. Some categories were merged to obtain a larger sample size (number of effect sizes) and the final data set included the following categories for Study 1:
Grade level: Younger students (kindergarten and elementary) and older students (middle school and above)
Type of nonperformance methods: Self-reports, teacher rating scales, and all other methods
Type of performance methods: Tests of intelligence or IQ, achievement or aptitude, and creativity
Study 2 had further limitations in terms of the number of effect sizes of the moderator categories. Thus, efficiency and sensitivity/effectiveness analyses were conducted with the variables of grade level and type of nonperformance methods. Specificity analyses had no moderators.
Rater Reliability
Reliability of the coding process was assessed by examining the coding of the data set. First and second authors independently coded a randomly selected section (25%) of the final set of studies. An agreement index was calculated between codings of the two authors and disagreements in coding were resolved through investigation of the original values reported in the article. A two-way (effects and raters) intraclass correlation coefficient (ICC) for absolute agreement was .92.
The Calculation of Effect Sizes
The studies reported different type of statistics leading to various types of effect sizes. To increase the number of effect sizes included in the synthesis, we grouped effect sizes in two categories and analyzed them under two different studies (i.e., Study 1 and Study 2). The first category included studies reporting the values of Pearson r, t test, and Cohen’s d. Because of the nature of the research question (i.e., Are nonperformance and performance methods consistent?), t test and Cohen’s d were converted to Pearson r in Study 1 by following the procedures described by Lipsey and Wilson (2001; see Equations 1 and 2). This operation generated 166 effect sizes, which were analyzed in Study 1. Borenstein, Hedges, Higgins, and Rothstein (2009) suggested using a Fisher transformed correlation (zr) instead of Pearson correlation (r) because Pearson’s product–moment correlation (r) is not normally distributed. Thus, the Pearson correlation effect sizes were converted to Fisher’s zrs to combine the effect sizes properly in Study 1 (Hedges & Olkin, 1985; Rosenthal, 1994). After performing analyses with z-transformed correlation, these resulting Fisher-based correlations were back-transformed to Pearson correlations using an inverse Fisher transformation to make the interpretation easier (Lipsey & Wilson, 2001).
Transformation from Cohen’s d to r was made using following equation:
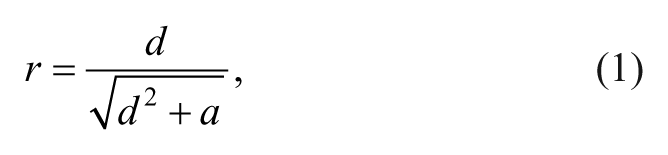
where a is a correction factor which is calculated as
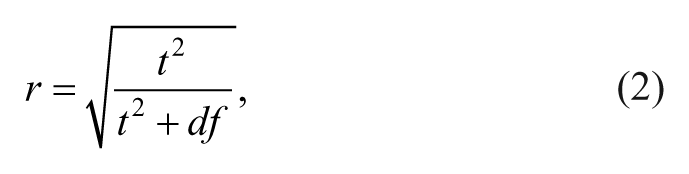
where df represents degrees of freedom.
The articles used in Study 2 reported diagnostic statistics as proportions. The studies reported four diagnostic statistics: effectiveness, efficiency, sensitivity, and specificity. The formula for these four statistics is provided in Figure 1. Effectiveness and sensitivity were calculated via the same formula and refers to the proportion of true positives to the sum of true positives and false negatives. In the context of this study, effectiveness and sensitivity reflect the percentage of accurately identified gifted students to the total number of all gifted students (those who were and were not identified as gifted). Efficiency refers to the proportion of all true positives to the sum of true and false positives. For this study, it is the percentage of accurately identified gifted students to the total number of all students who were nominated or considered gifted. Specificity refers to the proportion of true negatives to the sum of true negatives and false positives. In this study, it is the percentage of nongifted students who were neither nominated for gifted nor considered gifted to the total number of all nongifted students. Effectiveness and sensitivity are the same, so only three different proportional indices were used in the analyses.
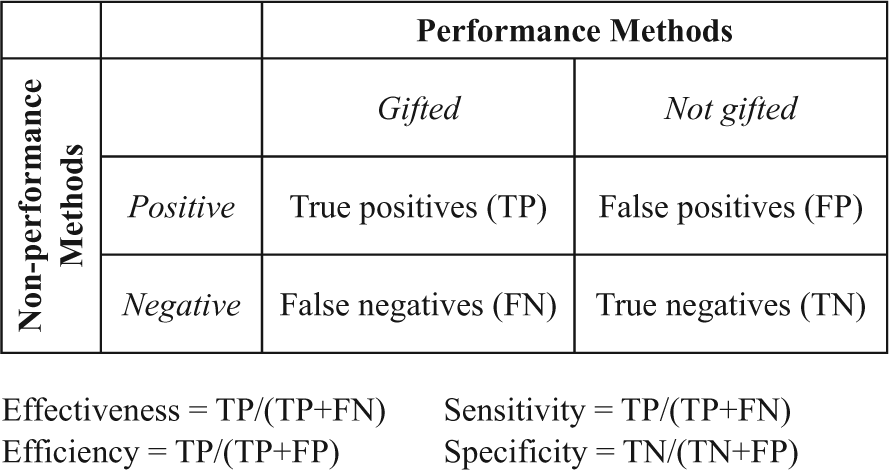
Diagnostic accuracy applied to gifted identification.
We applied the diagnostic accuracy framework to the field of gifted identification where nonperformance methods are compared with performance-based methods. It should also be noted that there was no single cutoff score for the performance methods used in gifted identification (Kirschenbaum, 1983). Use of performance methods as criteria, of course, does not mean that they are the best method for the gifted identification. The main reason for using performance-based methods as a criterion for gifted identification is its historical priority to other methods although these methods are widely used currently. Furthermore, alternative nonperformance methods are sometimes presented as alternatives to performance methods for gifted identification.
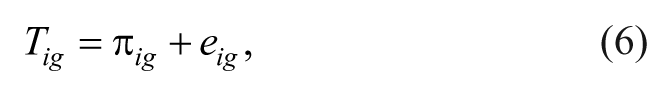
Three different data sets were prepared: (a) effectiveness/sensitivity, (b) efficiency, and (c) specificity in Study 2 because the three proportional values represent three distinct approached to diagnostic statistics. Lipsey and Wilson (2001) indicated that proportions are a form or metric of effect sizes. Therefore, three separate meta-analyses were performed in Study 2 following the appropriate procedures for meta-analysis described by Lipsey and Wilson (2001). According to Lipsey and Wilson (2001), meta-analysis of research findings with proportions can be accomplished either using proportions directly or using their logit transformation. They recommended using the logit method if the variation around the mean proportion is important. Based on this recommendation, we used the logit method in Study 2. The following calculations were used to obtain logit effect size (ESl), standard error (SEl), and variance weight (wl):
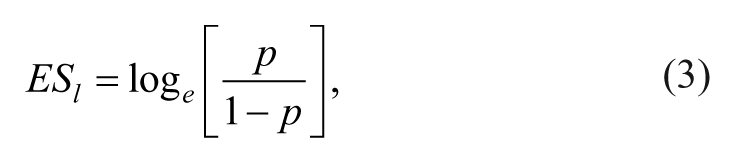
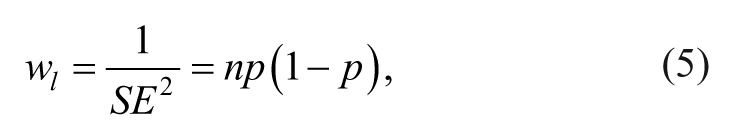
where n is the total number of the subjects and p is the proportion of subjects in the category of interest (efficiency, sensitivity/effectiveness, and specificity).
The Assessment of Potential Publication Bias
A number of statistical procedures have been proposed for assessment of publication bias in meta-analyses (Begg & Mazumdar, 1994; Duval & Tweedie, 2000; Egger, Smith, Schneider, & Minder, 1997; Light & Pillemer, 1984; Rosenthal, 1979; Rothstein, Sutton, & Borenstein, 2005). A funnel plot (Light & Pillemer, 1984) was created and examined visually to see if there was a possible publication bias effect in the current data sets. A funnel-shaped distribution of a scatterplot between treatment effect and size of study indicates a lack of publication bias. In addition to visual examination of the funnel plot, the test proposed by Egger et al. (1997) was used to test for funnel plot asymmetry. Egger’s regression test was used to examine the small-study effect in this meta-analysis. In addition, Begg’s rank correlation method (Begg & Mazumdar, 1994) was also used to test for funnel-plot asymmetry.
Statistical Analyses
Meta-analytic studies can be conducted using fixed or random effects models based on heterogeneity in the data. Thus, the heterogeneity of the effect sizes should be determined before conducting meta-analysis. Independency of the effect sizes is another issue that should be examined before meta-analyses. Dependent effect sizes may be observed when some studies contain multiple effect sizes. As this was the case, traditional meta-analysis approaches were not appropriate. Alternative approaches such as multilevel meta-analysis were suggested as a solution to the problem of dependency (Cheung, 2014; Hox, 2002; Konstantopoulos, 2011; Scammacca, Roberts, & Stuebing, 2014; Stevens & Taylor, 2009; Van den Noortgate, López-López, Marín-Martínez, & Sánchez-Meca, 2013). These approaches were proposed to handle various kinds of dependency including dependence over studies, dependence due to use of multiple treatment groups with a control group in the same study, and dependence due to multiple effect sizes within the same study. A three-level multilevel meta-analysis was applied due to the use of multiple effect sizes from the same study in our meta-analytic data.
We followed procedures described by Van den Noortgate, López-López, Marín-Martínez, and Sánchez-Meca (2014) to handle dependency among the effect sizes. In this meta-analysis, the first level involves a within-effect size model, the second level a between effect size within-publication model, and the third level a between-publication model. The data are summarized in Table 2. The parameterization of the three-level model follows (see also Konstantopoulos, 2011).
Descriptive Statistics Descriptive Statistics of Transformed Effect Sizes (ES).

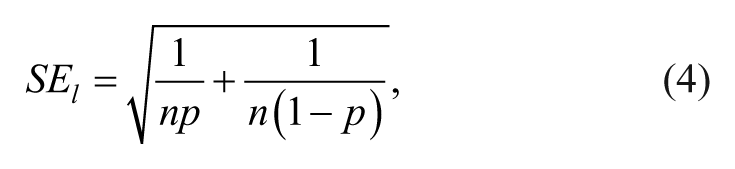
First level (i.e., within-effect size) can be represented with Equation 6, in which Tig is independently and normally distributed with the mean of π ig and variance of υ i , which is assumed to be known (Hox, 2002),
In the second level (the between-effect size within-publication model) the unknown effect-size parameter π varies around a Level 3 unit g mean, namely,
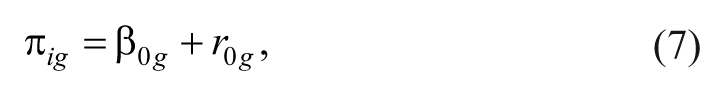
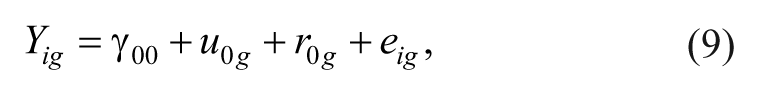
where g = 1, . . . , n represents the Level 3 units (e.g., publications). Finally, at the third level the Level 3 unit means vary around an overall mean γ00,
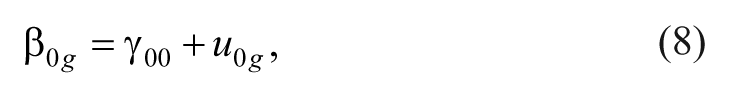
where u0g is normally distributed with a mean of zero and between publication variance. The three-level model can be represented in the single following model (this single model equation was also presented in Van den Noortgate et al., 2014)
when there is any additional predictor, the model can be extended adding estimates for each covariate as follows:
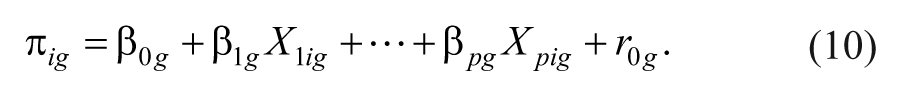
When p predictors are included at the second level, the model is

where
The Homogeneity Test
We calculated Cochran’s heterogeneity statistic (Q) to estimate the homogeneity of the effect size distribution used in the traditional meta-analysis. As Cheung (2014) suggested, this test can also be used for multilevel meta-analysis studies. The Q test is simply a weighted sum of squared differences between the individual study effects and the pooled effect across studies. The Q test was distributed as a chi-square statistic with N − 1 (N: number of studies) degrees of freedom. A significant Q test indicates the presence of heterogeneity, in which the variability among effect sizes stems from between-study errors in addition to sampling error (Lipsey & Wilson, 2001). In addition, we also calculated the I2 statistic (Higgins, Thompson, Deeks, & Altman, 2003), which quantifies the degree of heterogeneity in meta-analysis. The I2 percentage ranges from 0 (no heterogeneity) to 100 (high-level heterogeneity; Higgins et al., 2003). In this study, an I2 percentage was calculated using the values of Q statistics and the degrees of freedom as described in Higgins et al.’s (2003) work. I2 is simply calculated by dividing the difference between Q statistics and the df by the Q statistics itself. The obtained number is multiplied by 100 to be expressed in percentages.
Results
Study 1
Before proceeding to the main analyses, we examined the publication bias using the funnel plot (see Figure 2). The funnel plot was created with a scatterplot showing estimated treatment effects in individual studies against standard error of estimated treatment effects. As shown in Figure 2, the funnel is not visually symmetric. Slight deviations from funnel-shaped distribution can be observed in the upper part of the plot. We also fitted a regression model to investigate the small-study effects seen in this study (Rothstein et al., 2005). An Egger test was also performed to test for funnel plot asymmetry, t(164) = 3.49, p = .001. The funnel plot appears asymmetric, and there is evidence of publication bias using the Egger test but not using the Begg’s rank correlation method (p = .808).
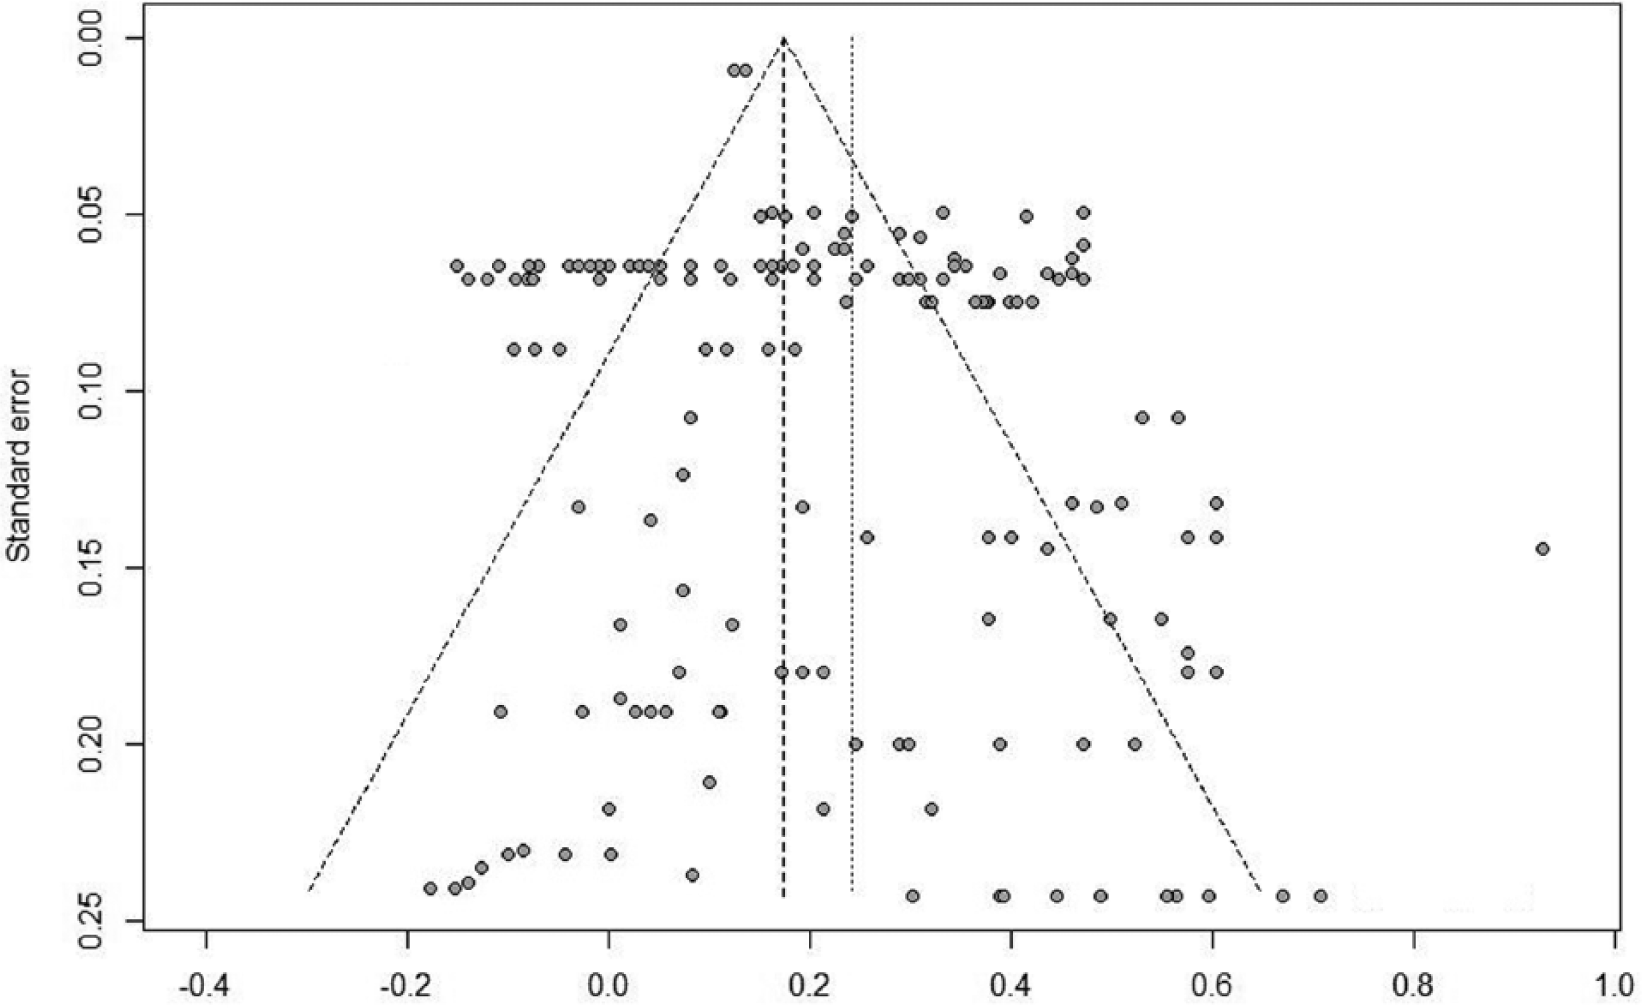
Funnel plot of standard error by Fisher’s z.
A total of 166 effect sizes (Pearson correlations: rs) from 19 published studies were available for the analyses. Figure 3 shows a stem-and-leaf plot of the resulting 166 effect sizes (rs) with two decimal places. As can be seen in Figure 3, the smallest effect size was r = −.39, the largest was r = .73. The descriptive statistics for mean effect size values of each publication are summarized in Table 2.
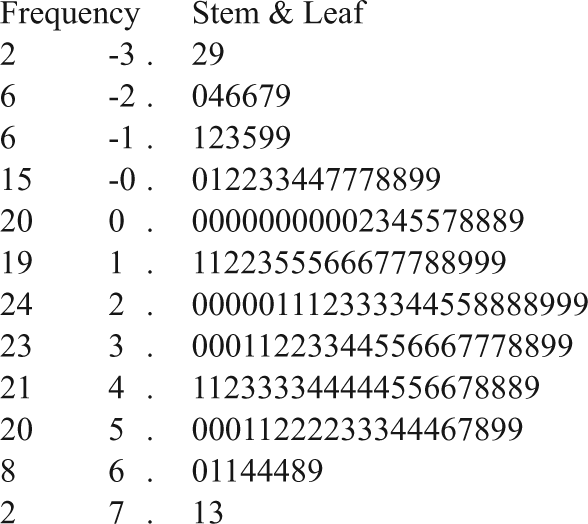
Stem-and-leaf plot of all effect sizes (rs).
Homogeneity Test
According to MEAN ES analyses (using SPSS MEAN ES macro created by D. Wilson, 2001), the homogeneity-of-variance statistic (Q test) was 1,863.38 with 165 degrees of freedom. The Q test, which was found to be significant (p < .001), indicated the variance of the effect size was not homogeneous and larger than the effect of the standard error only. In addition, an I2 percentage was calculated as 94.61, which also indicated a high-level of heterogeneity in this meta-analysis. Thus, we continued with a model that accounts for this heterogeneity (i.e., random effects model).
Multilevel Model Building
The multiple effect sizes used in the above results can be considered dependent because there were multiple effect sizes obtained from some of the studies. We used multilevel meta-analysis (Hox, 2002; Van den Noortgate et al., 2013) to handle the dependence in this study. All of the multilevel models were estimated with restricted maximum likelihood (REML) using the proc SAS command. Results of the unconditional model were used to estimate an overall mean as a random effect, and the variances at the second and third levels. Preliminary analyses with the Level 1 Variance Known model (Bryk & Raudenbush, 1992) that had no predictors showed that the mean correlation was .302 (95% confidence interval [CI] = [.26, .35], p < .0001). This is a moderate correlation according to Cohen (1988). Second- and third-level variances were .033 (95% CI [.020, .046]) and .029 (95% CI [.029, .040]) respectively, and found to be significant (p < .05). Significant Level 2 and Level 3 variances indicated that the effect sizes varied across publications.
Following the multilevel research tradition, we continued with a three-level random-effects model. When three predictors were included in the unconditional model (i.e., main model) the overall effect size estimate was .159 (95% CI [.143, .174), which was significant (p < .001). The results of the three-level main model indicated that only one of the moderators (i.e., type of nonperformance methods) explained a significant amount variation in effect sizes (see Table 3). Correlation values were significantly higher (β = .31, SE = .05, p < .001) between performance measures and teacher ratings (r = .35, 95% CI [.31, .38]) than with the other forms of nonperformance methods of identification (r = −.01, 95% CI [−.08, .05]) such as teacher or parent nomination and parent ratings. Correlations with self-reports were also smaller (r = .12, 95% CI [.05, .18]) than those with teacher ratings and self-reports, but this difference was not significant (β = .01, SE = .08, p < .87). Mean effect size values for each category are provided in Table 4.
Parameter Estimates for Main Model.

Note: Grade Level 0 = younger students (kindergarten-elementary); Grade Level 1 = older students (middle or above); Nonperformance Type 0 = self-reports; Nonperformance Type 1 = teacher rating scales; Performance Type 0 = intelligence/general ability; Performance Type 1 = achievement/aptitude.
p < .001.
Descriptive Statistics for the Moderator Categories.

Note. ES = effect size; CI = confidence interval. dfs = k − 1.
p < .001.
Two other moderators (i.e., type of performance methods and grade level) were not significant although the mean effect size values of different categories were seemingly varied. For example, correlations with nonperformance methods were higher with achievement and aptitude tests (r = .30, 95% CI [.25, .36]) than intelligence or general ability tests (r = .23, 95% CI [.18, .29]) and creativity tests (r = .19, 95% CI [.10, .27]). Likewise, correlation values were higher among younger students (i.e., kindergarten-elementary; r = .29, 95% CI [.24, .33]) than older students (middle school or higher; r = .16, 95% CI [.12, .20]).
Study 2
Proportional effect sizes from diagnostic statistics were provided from 16 studies that reported 42 efficiency, 73 sensitivity/effectiveness, and 33 specificity values as proportions. We performed three different sets of multilevel meta-analyses with REML estimation using the proc SAS command because these were distinct qualities. Finally, descriptive statistics for the different levels of moderators were also provided.
As mentioned above, a funnel plot was created and examined for publication bias for each individual proportion metric (see Figure 4) before proceeding to the meta-analysis of the proportions. The Egger test (Egger et al., 1997) and Begg’s rank correlation (Begg & Mazumdar, 1994) method were also applied as in Study 1 (see Figure 4 for the three funnel plots). We also fitted a regression model to investigate the small-study effects seen in each of the data sets through the Egger tests. The Egger tests were also performed to test for funnel plot asymmetry. Based on the Egger test results, efficiency funnel plot was found to be asymmetric, t(40) = −4.40, p < .001, while the effectiveness-sensitivity funnel plot, t(71) = −1.00, p = .32, and the specificity funnel plot, t(31) = 1.85, p = .07, were statistically symmetric. In addition, all of the funnel plots were found to be symmetric based on the Begg rank correlation method.

Funnel plots for Study 2 (standard error by logit transformation values).
As suggested by Lipsey and Wilson (2001), analyses were performed with logit transformed values (see Equation 3) and then the mean values were back transformed to proportions in the text for ease of interpretation. The results of the three-level models were presented without transformation (as logit values) as the main purpose was to observe the moderators within the model.
Efficiency
A total of 42 effect sizes from 11 published studies were available for the analyses. Homogeneity statistics indicated the data set was heterogeneous, QT(41) = 3318.23, p < .01, I2 = 98.8%. Thus, we conducted a random effects model using the logit method for the efficiency proportions. As mentioned above, there were originally three moderators in this study. Two moderators (i.e., grade level and nonperformance method) had a sufficient number of effect sizes for efficiency and the third moderator had only one category, which is tests of intelligence, so these two moderators were dummy coded and entered into the random effects regression model.
To take dependency in account, we continued with a multilevel model. First, an unconditional multilevel meta-analysis was conducted with no predictors. The unconditional model results yielded a mean effect size value of 0.39 (95% CI = [0.24, 0.55], p = .21). Second- and third-level variances were 1.14 (p = .03) and 0.21 (p = .001), respectively. The results of the main three-level meta-analysis are presented in Table 5. The three-level model indicated that grade level (β = −0.23, SE = 0.51, p = .65) and nonperformance methods (β = −0.33, SE= 0.24, p = .17) were not significant.
Main Models for Effectiveness/Sensitivity and Efficiency.
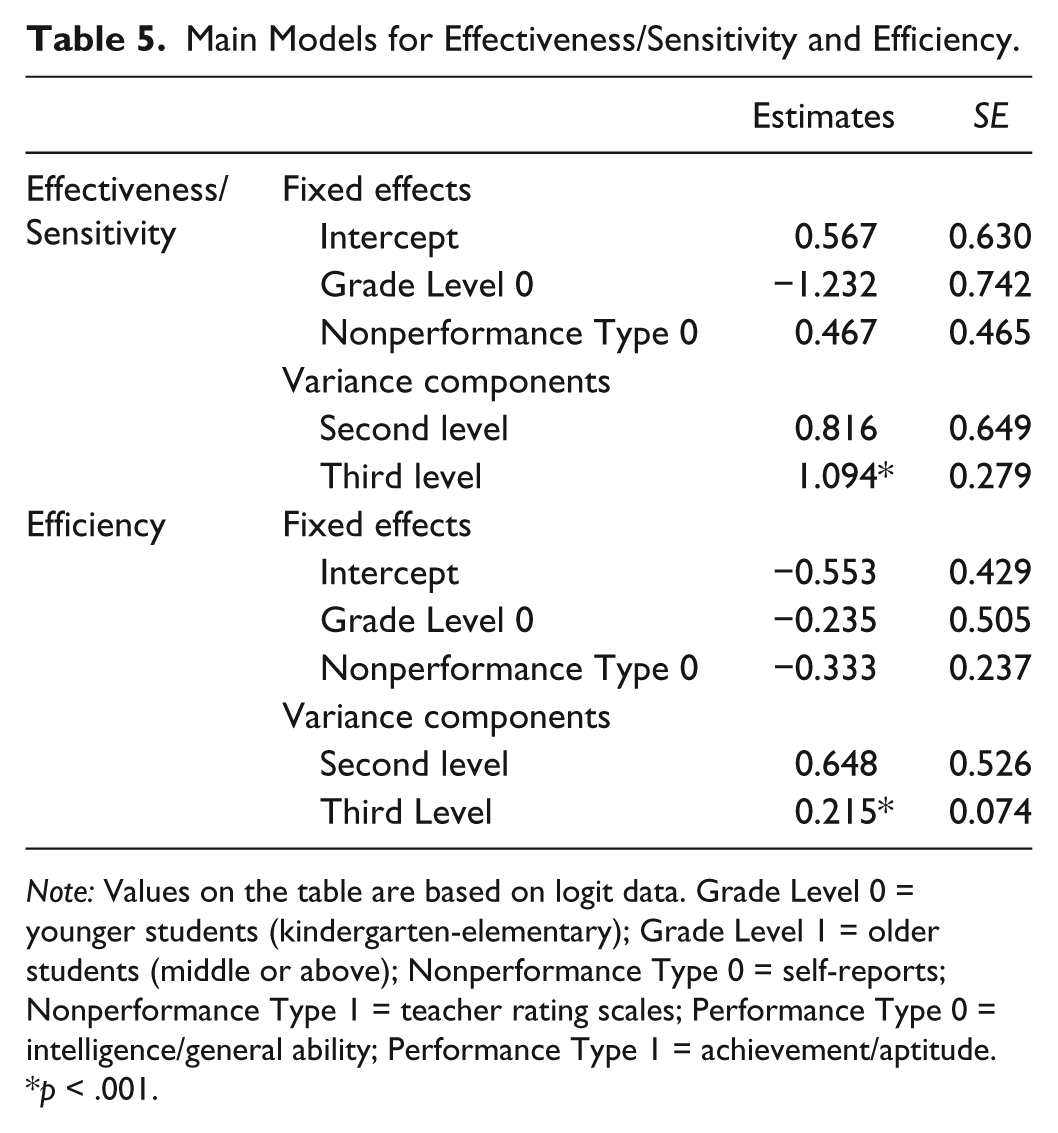
Note: Values on the table are based on logit data. Grade Level 0 = younger students (kindergarten-elementary); Grade Level 1 = older students (middle or above); Nonperformance Type 0 = self-reports; Nonperformance Type 1 = teacher rating scales; Performance Type 0 = intelligence/general ability; Performance Type 1 = achievement/aptitude.
p < .001.
The mean proportion values (i.e.,
Mean Effect Size Values for Efficiency, Effectiveness/Sensitivity, and Specificity Based on Random Effects Model.
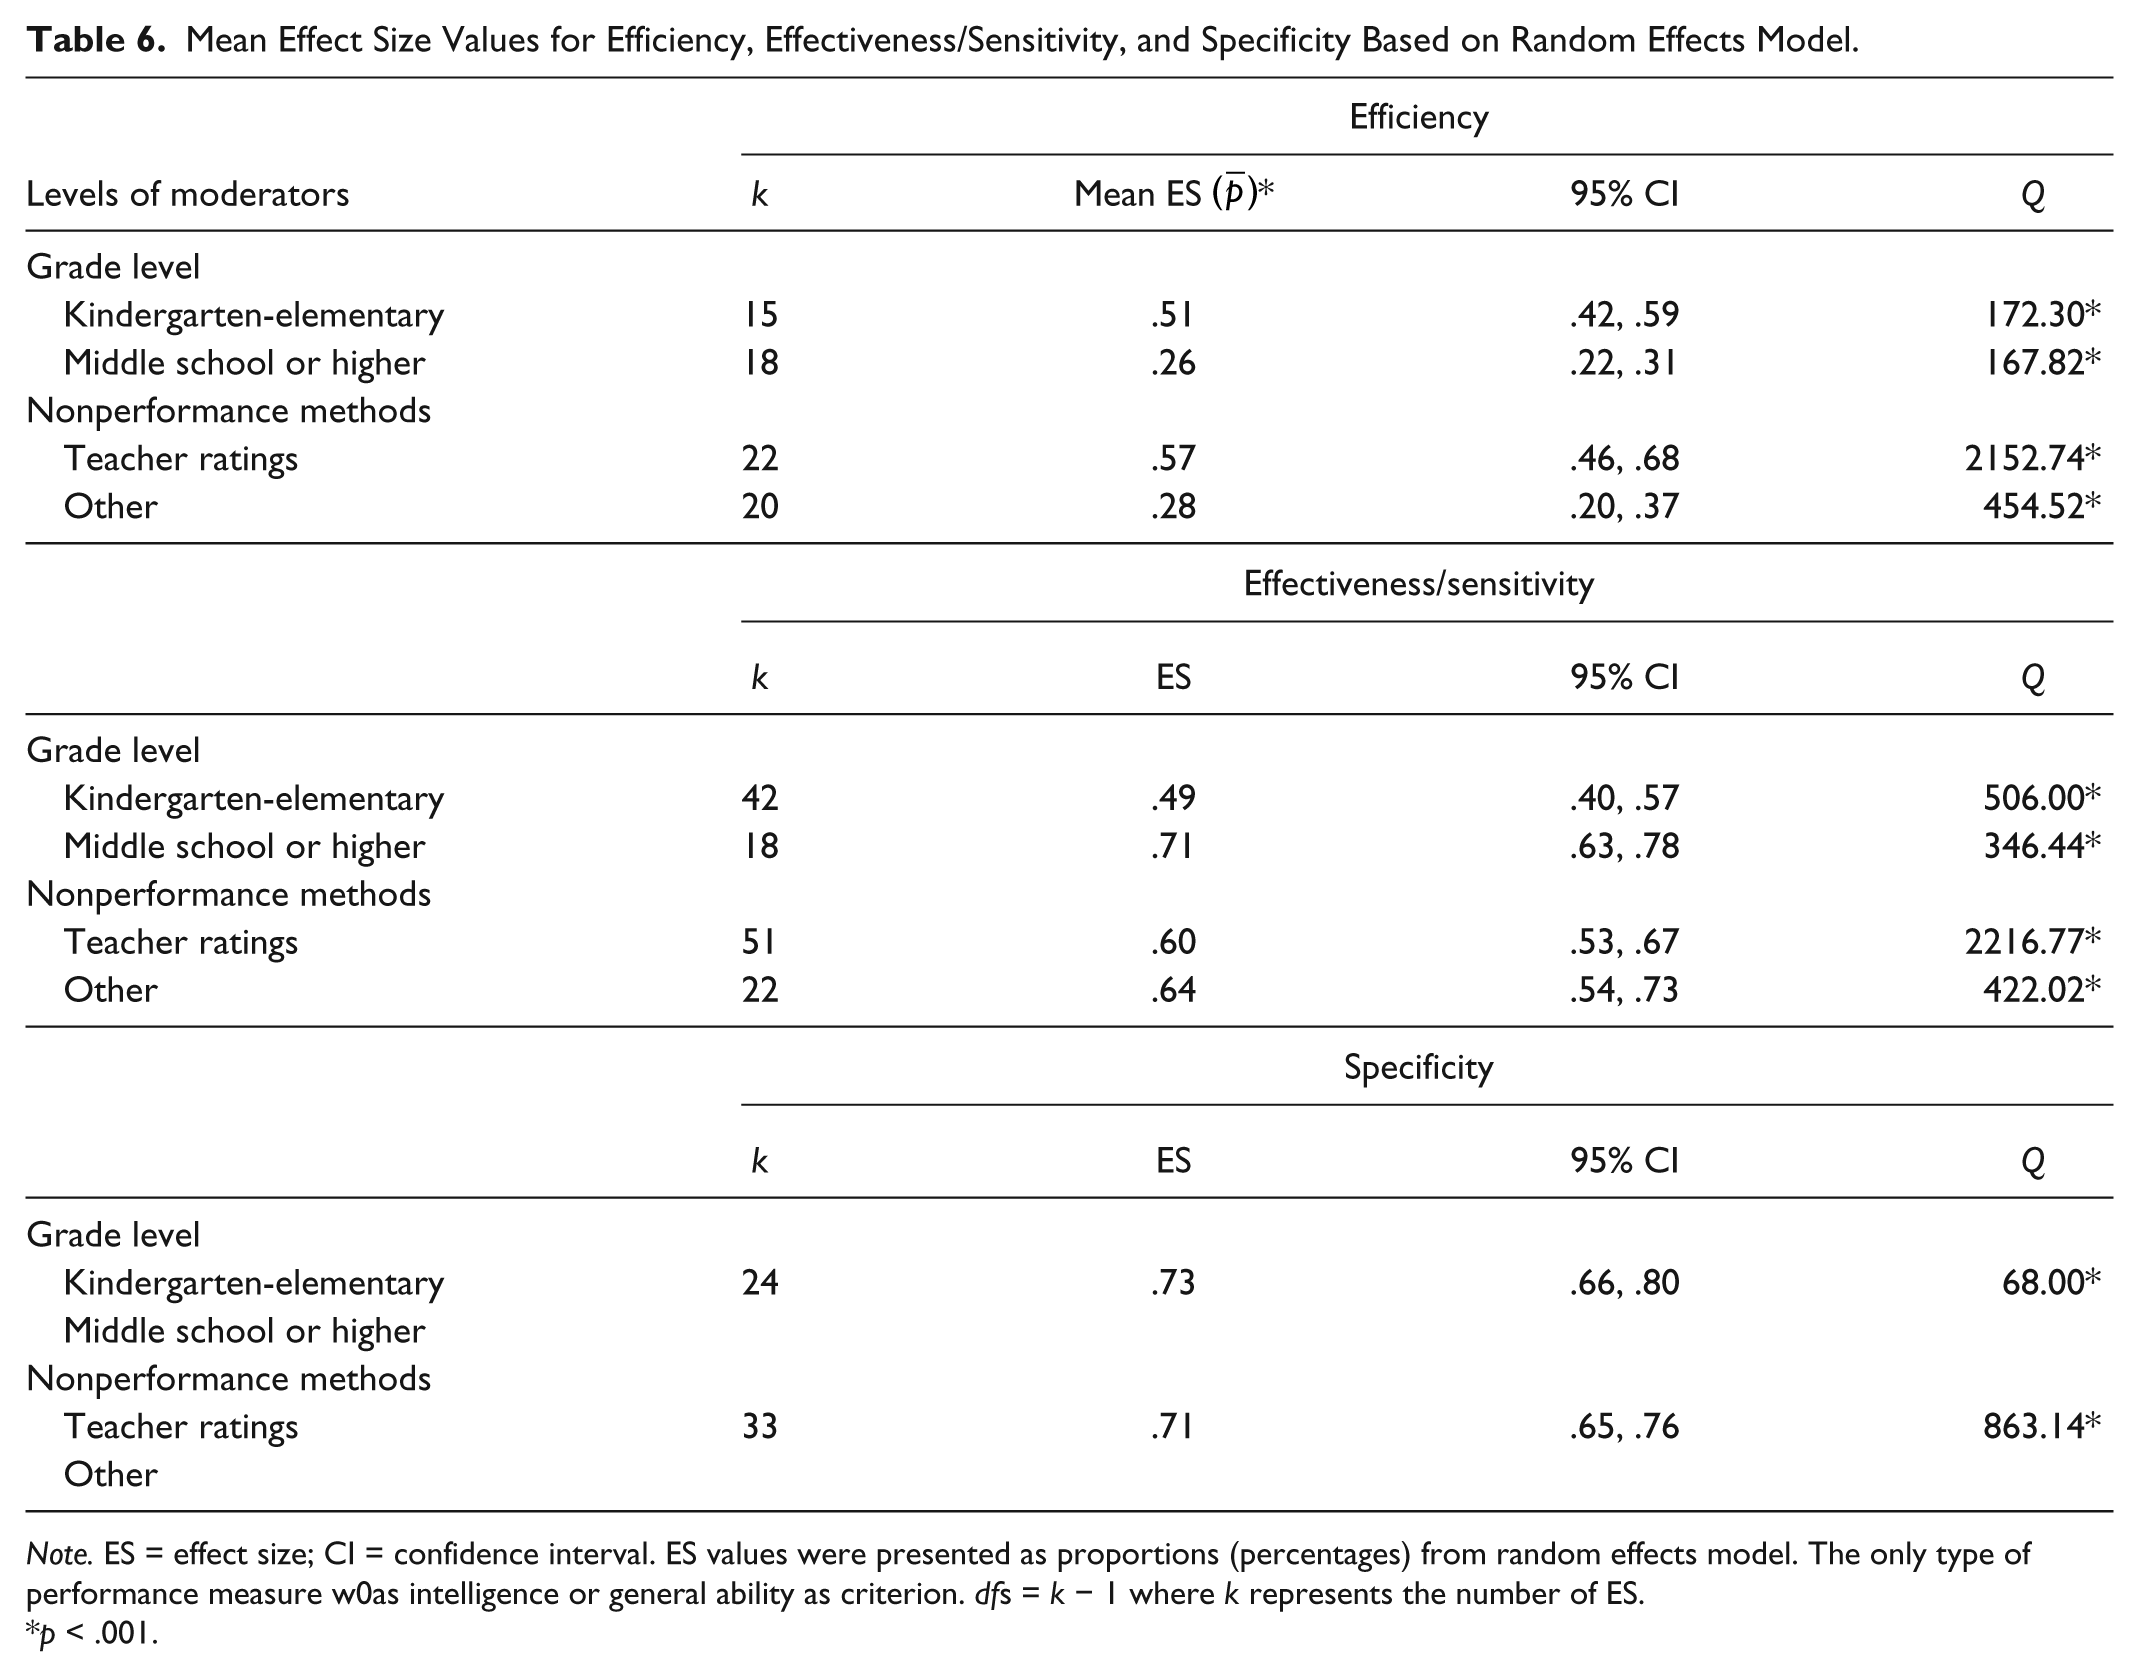
Note. ES = effect size; CI = confidence interval. ES values were presented as proportions (percentages) from random effects model. The only type of performance measure w0as intelligence or general ability as criterion. dfs = k − 1 where k represents the number of ES.
p < .001.
Sensitivity/Effectiveness
A total of 73 effect sizes from 15 published studies were available for the analyses. Homogeneity statistics indicated the data set was heterogeneous, QT(41) = 2642.60, p < .01, I2 = 97.3%. Thus, we conducted a random effects model using the logit method for efficiency proportions. Again, because two moderators (i.e., grade level and nonperformance method) had sufficient numbers of effect sizes for efficiency and the third had only one category (i.e., tests of intelligence or general ability), they were dummy coded and entered into the random effects regression model.
Again, an unconditional multilevel meta-analysis was conducted with no predictors. The unconditional model results yielded a mean effect size value of 0.59 (95% CI = 0.42; 0.74, p = .33). Second- and third-level variances were 1.19 (p = .04) and 1.21 (p < .001), respectively. The results of main three-level meta-analysis are presented in Table 5. Similar to the results in efficiency analyses, grade level (β = −1.23, SE = 0.69, p < .11) and nonperformance methods (β = .47, SE = 0.44, p = .29) were not significant.
Based on mean proportion values (i.e.,
Specificity
A total of 33 effect sizes from three published studies were available for the analyses. Homogeneity statistics indicated the data set was heterogeneous, QT(41) = 863.14, p < .01, I2 = 96.3%. We only conducted an unconditional multilevel meta-analysis for the specificity data set because none of the moderators had a sufficient sample and the data set consisted of proportion values obtained from the studies that employed tests of intelligence as the performance method, teacher rating scales as the nonperformance method, and elementary-kindergarten students. The unconditional model results yielded a mean effect size value of .70 (95% CI = [.59, .80], p = .11). Second- and third-level variances were 0.13 (p < .28) and 0.46 (p = .007), respectively.
Discussion
Our analyses from two different studies provided interesting and, to some degree, overlapping results about the consistency between the nonperformance and performance methods of gifted identification. Analyses with Pearson r as the effect size in Study 1 indicate there is a moderate relationship (r = .30) between the two methods based on Cohen’s (1988) criteria on the magnitude of effect sizes. On the other hand, heterogeneity of the effect sizes required an analysis of the moderators, allowing for the observation of the influence of the grade level, type of nonperformance method, and type of performance method. This analysis has revealed the conditions under which consistency between the nonperformance and performance methods are remarkably higher or lower than the overall mean effect size.
Analyses of the moderators indicate the consistency between the nonperformance and performance methods tends to be higher when teacher ratings are used as a method of nonperformance identification versus other methods such as self-reports and parent or teacher nominations. This finding is not surprising. Teachers observe and interact with students frequently and on a regular basis, which put them in a special position in terms of the recognition of the skills and abilities that help students with academic excellence and outperforming on the performance tests (J. Borland, 1978; Bracken & Brown, 2006; Jarosewich, Pfeiffer, & Morris, 2002). Therefore, our results support the previous findings indicating the usefulness of teacher ratings even in the identification of those who are gifted beyond stereotypical conceptions (Achenbach, 1997; Rohrer, 1995).
Previous findings favoring parents’ over teachers’ ratings (e.g., Ciha et al., 1974; Jacobs, 1971) are not supported by our results when performance measures are used as the basis of comparison. The lower correlations with nominations could be related to a narrow conceptualization of giftedness (Bishofberger, 2012; Brighton, Moon, Jarvis, & Hockett, 2007) accompanied by lack of a structure for the nomination process that is overcome with the teacher rating scales. Concerns around the scientific rigor of the nomination process (Moon & Brighton, 2008; Neumeister et al., 2007) are worthy of attention with our findings. However, inclusion of these methods can still provide valuable information when the goal is to assess the aspects of giftedness not measured through performance measures. This approach would also be consistent with the suggestion to be inclusive in identification practices (Tannenbaum, 2003). A better approach would be to train teachers about gifted characteristics and effective identification (Bégin & Gagné, 1994; McCoach & Siegle, 2007). The way nomination is used in gifted identification may also need to be reconsidered. Erwin and Worrell (2012) argued that teachers should be asked to nominate students who do “the best academic work” because they have the opportunity to observe and track students’ academic work and performance on a continuing basis. This suggestion can be useful because it does not require involving teacher conceptualizations of giftedness in the nomination process.
Based on our findings in this study, gifted identification seems to be more uncertain for parents and students rather than teachers when performance measures are the criteria. Hunsaker, Finley, and Frank (1997) found teacher nominations could be useful for gifted identification when appropriate instruments (i.e., rating scales) are provided to the teachers. With a medium correlation, teacher ratings should be used with the intent of supporting the identification process as additional data instead of replacing a performance gifted identification methods. Teacher ratings, in that sense, would be useful as additional evidence rather than as the single point of evidence for a final decision regarding identification (Haroutounian, 1995; Jarosewich, Pfeiffer, & Morris, 2002; Pfeiffer, 2002).
Some researchers (e.g., Gear, 1976; Sattler, 1982) criticized teacher judgments for lacking accuracy in the identification process. Although a medium correlation seems to give some credit to Gear’s (1976) conclusion, teachers seem to be more consistent with the performance related identification methods when they use rating scales. But, which rating scale should be used? The selection of the teacher rating scales is a critical decision as they vary in the way they measure giftedness. Besides general psychometric qualities of the instruments (e.g., reliability and validity), this decision should be made on the basis of the way giftedness is defined in the local school system because states typically define giftedness differently (National Association for Gifted Children, 2015). Teacher rating scales that are consistent with the components included in the state gifted definition would be more useful. Another major issue of consideration is related to the goal of identification and programs to be offered. Identification methods should take into consideration the curriculum and the programming for gifted programs (Feldhusen, Asher, & Hoover, 1984; VanTassel-Baska, 2006). Therefore, selection of the teacher rating scales should be guided by the program goals.
Given that teacher ratings scales are more consistent with performance measures and higher correlations among various measures increase the accuracy of identification (McBee et al., 2014), the selection of the instruments that have the highest correlation with other instruments is more defensible unless a special emphasis is given to areas such as leadership, communication, or athletic ability, which are not typically measured in traditional performance measures. Instruments with higher correlations and reliability could assist performance measures better in identifying the gifted students. As Jarosewich, Pfeiffer, and Morris (2002) did in their review, the current empirical evidence regarding these criteria should be compared to make an informed decision.
It is also important to note that teachers are not a uniform group and certain teacher characteristics such as experience can influence their conceptions of giftedness (Megay-Nespoli, 2001). Endepohls-Ulpe and Ruf (2006) found that experienced teachers have much more precise notions of giftedness than inexperienced teachers in the cognitive arena, which can influence their nominations, and therefore, using a rating scale can guide them to look for more specific criteria.
The students’ age group was not significant, which indicates the identification practices are not influenced by students’ age or grade level. While correlations are higher among younger students (r = .29) than the older students (r = .16) there was not a significant difference. Contrary to the expectation that correlation values would diminish because younger students are difficult to identify (Fatouros, 1986; Johnson, 1983; Roedell, 1989), teacher ratings and nomination procedures seem to be able to similarly match the performance test results, especially for students of younger age. This finding may be explained by the amount of time a teacher spends with younger students and the evaluations benefit from the longer periods of observation.
The type of performance methods are also not significant. The expectation that consistency could be lower with tests of creativity because of some undesirable characteristics of creative students (Bachtold, 1974; Dawson, 1997; Scott, 1999; Torrance, 1963; Westby & Dawson, 1995) is not supported although it does have a lower correlation (r = .19) than tests of intelligence (r = .23) and tests of achievement and aptitude (r = .30).
Results from Study 2 are based on the proportional values (percentages) reported as the values of efficiency, effectiveness/sensitivity, and specificity. When the mean proportions are calculated for these three indicators, specificity is remarkably higher (70%) than sensitivity/effectiveness (59%) and efficiency (39%). In other words, nonperformance methods perform better at identifying the nongifted students (true negatives) accurately based on the performance methods. The mean sensitivity/effectiveness value indicate that among those who are gifted based on performance methods, 59% are identified as gifted based on nonperformance methods. In other words, 41% of the gifted students identified by the performance measures are not identified by the nonperformance methods. This percentage is slightly smaller than what McBee et al. (2014) reported in their simulation study estimating the sensitivity value within the range of 61% and 76%. McBee et al. also noted that the identification system in the state of Georgia might be producing more false negatives (unidentified gifted students) than false positives (nongifted students who were identified as gifted).
Efficiency values indicate that among those who are identified or nominated as gifted, only 39% were also identified as gifted based on the performance methods. In other words, nonperformance methods extend the pool of gifted candidates, but if a nonperformance method precedes a performance method and a final decision is made based on the performance method, the nonperformance methods will not help to diversify the pool. Although the effect size values are heterogeneous, moderators did not explain the variation.
These findings provide strong evidence for the usefulness of multiple criteria for gifted identification. Nonperformance methods seem to be extremely helpful in identifying nongifted students at the expense of nongifted students (30% false positives) that would actually be considered gifted when nonperformance methods are used as the only gifted identification source. Moreover, when nonperformance methods are used as the only identification method, they seem to be too liberal and not very efficient. The ratio of the false positives (61%) exceeded the ratio of true positives (39%).
Based on these results, multiple sources of data including both nonperformance and performance methods should ideally be collected and evaluated simultaneously (Ford, 1998; Siegle et al., 2010) rather than collecting and evaluating them consecutively (see Heller, 2004; Pfeiffer, 2002). When nonperformance methods are used as the only criteria, half of the potentially gifted students may be overlooked based on performance tests. Lohman and Gambrell (2012) cautioned that testing only those who were nominated by teachers could lead to dismissing gifted students who do not fit in with teachers’ conceptions of giftedness. Chester (2003) indicated that simply lumping together various measures and scores together does not guarantee a successful outcome. Therefore, the way these multiple sources of identification methods (performance and nonperformance) are combined is quite critical.
McBee et al. (2014) compared three different approaches with combining multiple evidence. The conjunctive or “and” rule requires meeting the cutoff scores across all criteria, the disjunctive/complementary or “or” rule requires exceeding at least one of the cutoff scores, and the compensatory or “mean” rule uses the mean values from multiple assessments. The authors suggested using the “or” rule for larger programs such as enrichment, in which misidentification is less likely to be observed. This method is expected to be more diverse and inclusive of low-income, minority students. As far as small programs with more precise programming, McBee et al. proposed using the “and” method because this method is more selective and minimizes the chances of failure. Overall, the authors favored the “mean” rule because of this method’s capability of balancing the false positives of the “or” rule and false negatives of the “and” rule. This suggestion seems to be consistent with our findings because performance and nonperformance methods tend to identify different types of students although they do converge on some students; and they are also moderately related rather than strongly related.
As indicated in our findings, what should be done when performance and nonperformance test do not fully converge? Lohman and Lakin (2007) proposed a system for balancing and integrating these two different sources of evidence (i.e., performance and nonperformance) using two tests (e.g., CogAT and Renzulli-Hartmann Scale for Rating Behavioral Characteristics of Superior Students) as an example. They suggested that students in Category 1, who had exceptionally high scores on both, are first to be accepted to these programs. Category II students are those who received exceptional scores on the CogAT but not as highly rated by teachers. They suggested monitoring the progress of these students because there may be an unwillingness not to eliminate these students from programming on the basis of teacher ratings. Category III represents students who got very high teacher ratings in spite of lower, but still high scores on CogAT. These students would be included in school-wide enrichment programs. Category IV consists of students who had high, not exceptional scores on the CogAT but are not rated highly by their teachers. These students would receive special services for the gifted only if they rank highly within their own underprivileged group. Lohman and Gambrell (2012) recommend using local norms more often and endorsed the proposition that teacher ratings should be used to be more inclusive and to provide opportunity rather than as exclusion criteria. Such guidelines are important because ability profiles of gifted students are more discrepant than average students (Lohman, Gambrell, & Lakin, 2008).
Another relevant finding in the McBee et al. (2014) study was the changes in false positives or incorrect identification (i.e., identification of the students that are not truly gifted) and false negatives (i.e., failure to identify truly gifted students) as a result of the reliability of the instruments and correlations among them. Their simulation study indicated that probability of false positives and false negatives increase as reliability and correlations decrease.
Some of the current practices of identification do not seem to align with the conclusions and suggestions in this study. For example, the State of New York started using both a performance measure (i.e., OLSAT) and nonperformance scale (i.e., GRS), but then they replaced GRS with Bracken School Readiness Assessment (BSRA; Bracken, 2002) leaning more toward performance assessment approach. The Atlanta Public school system adopted the GRS just as a screening tool to determine qualification for automatic testing rather than using it concurrently with performance-based measures. Such practices are likely to continue because school districts tend to be slow in adopting alternative identification strategies (McClain & Pfeiffer, 2012; Reis & Renzulli, 2009).
There are limitations of the current meta-analysis. In spite of the voluminous research and controversy on the identification of the gifted students from minority and diverse groups (e.g., A. Y. Baldwin, 2005; Ford & Grantham, 2003; Lohman, 2005a; McBee, 2010; Naglieri & Ford, 2005), our data set did not include a satisfactory number of those studies and effect sizes to use in the analyses because they did not meet the inclusion criteria. Some other critical issues of identification such as comparison of gender (J. Borland, 1978; Siegle, 2001) as well as verbal and nonverbal tests (Lohman, 2005b) could also be explored in later studies when more research is conducted in the future. On a separate note, we did not present performance methods as the “truth” although it is a common terminology in diagnostic tests (Renzulli & Delcourt, 1986). Our purpose was rather to observe the magnitude of overlap and discrepancy across different methods.
One of the most frequently stated concerns about gifted identification is that some gifted students may be omitted (J. H. Borland & Wright, 2000; Worrell, 2003). Our findings indicate the use of nonperformance or performance methods alone would result in the identification of the different type of students with some overlap with the performance methods. Contrary to expectations, nonperformance methods do not include all students that would be identified as gifted by the performance methods. In other words, both nonperformance and performance methods seem to exclude some students who would be considered gifted according to the other method. Therefore, when both are used, performance and nonperformance methods should be collected and evaluated concurrently rather than successively.
Footnotes
Declaration of Conflicting Interests
The author(s) declared no potential conflicts of interest with respect to the research, authorship, and/or publication of this article.
Funding
The author(s) received no financial support for the research, authorship, and/or publication of this article.