
Abstract
Students who are gifted and have a learning disability (GLD) may not be identified, in part because of disagreement regarding appropriate identification criteria. In this study, suggested GLD identification criteria were applied to a nationally representative sample of school-age students to determine the number and characteristics of students identified by each set of GLD criteria. Many but not all students identified as potentially GLD had relative weaknesses in lower order processing abilities and achievement, as hypothesized for this population. Students also exhibited academic strengths, which suggests dual differentiation would be appropriate. Commonly used intraindividual discrepancy criteria identified most potentially gifted students as potentially learning disabled; therefore, these are not valid stand-alone criteria to identify learning disabilities in gifted youth. Results suggest it may be best to combine alternative gifted criteria, an intraindividual LD criterion, and examination of absolute deficits in processing and achievement. Additional implications for research and practice are discussed.
A growing body of research concerns twice-exceptional students and particularly those who are gifted and have a learning disability (GLD). A child who is GLD has advanced intellectual gifts that coexist with a specific learning disability that interferes with an aspect of academic achievement. Although no organization collects twice-exceptionality prevalence data, it is estimated that more than 360,000 twice-exceptional children attend school in the United States (National Education Association, 2006). GLD students may experience better outcomes if they are identified as twice exceptional and receive dually differentiated curriculum to support their gifts and disabilities simultaneously (Al-Hroub, 2010; Assouline, Nicpon, & Huber, 2006; Baum & Novak, 2010; Coleman, 2005; National Association for Gifted Children, 2013; Nielsen & Higgins, 2005; Weinfeld, Barnes-Robinson, Jeweler, & Shevitz, 2005). Unfortunately, GLD students may be identified late in their academic careers or may even remain unidentified (Ferri, Gregg, & Heggoy, 1997; National Association for Gifted Children, 2013; Reis, Baum, & Burke, 2014; Silverman, 1989), in part because there is no clear consensus about the best way to screen for or identify GLD status (Assouline & Whiteman, 2011; Gilman et al., 2013). Because of disagreements about appropriate operational definitions for giftedness, learning disabilities, and GLD status, varied identification criteria have been used or suggested in the literature, with considerable ongoing debate (e.g., Assouline, Foley Nicpon, & Whiteman, 2010; Lovett, 2011; Lovett & Lewandowski, 2006).
Disagreement about GLD identification criteria is concerning because the criteria used for screening and identification have enormous implications for the field. In educational practice, identification is the critical first step to provide GLD students with the services and instruction they need. From a theoretical point of view, identification criteria affect prevalence estimates and conceptions of GLD students’ characteristics, abilities, and needs by defining which students do and do not qualify as GLD. Furthermore, research about the GLD population has been primarily qualitative, and the expansion of empirical investigation is a top priority (Foley Nicpon, Allmon, Sieck, & Stinson, 2011), but the lack of standardized identification criteria complicates the recruitment of appropriate samples and limits the generalizability of empirical results.
Although several different GLD identification criteria have been used or suggested in the literature, there is little research on the practical implications of the different criteria. In the current study, various suggested identification criteria were applied to school-age students in the nationally representative Woodcock-Johnson III standardization sample and descriptive analyses were used to examine the effects of combinations of these criteria on estimated prevalence rates and population characteristics for GLD students.
The Need for Improved Identification
For several decades, debate about the proper identification of GLD students has centered on four hypothetical groups: (1) students identified as GLD, (2) students identified as gifted who have subtle and unidentified learning disabilities, (3) students identified as learning disabled who have unrecognized gifts, and (4) unidentified students whose gifts and disabilities are both unrecognized because their performance appears average for their age or grade level (Baum, 1990), a phenomenon known as the masking effect because the disability and gift are believed to mask one another. This masking concept can be controversial (Lovett & Lewandowski, 2006), in part because it is difficult to operationalize measures that would identify these students. Some researchers believe many GLD students are unidentified and belong in one of the latter three categories (Baum, 1990; Brody & Mills, 1997; Foley Nicpon et al., 2011; Nielsen, 2002; Reis et al., 2014). Therefore, one priority for the field is to improve the identification of GLD students who might otherwise be unidentified and underserved.
Proper identification of GLD students is considered critical to such students’ well-being because these students may be at risk for negative educational experiences and negative motivational, psychological, and academic outcomes (Assouline et al., 2010; Besnoy et al., 2015; Dole, 2000; Reis, Neu, & McGuire, 1997; Vespi & Yewchuk, 1992; Waldron, Saphire, & Rosenblum, 1987). Students who are GLD may develop a low self-concept, become discouraged easily, have attention difficulties at home and school, and experience difficulty adapting to changes in the educational environment (Assouline et al., 2010; Brody & Mills, 1997). These students often exhibit perfectionist tendencies typical of high-ability children and may experience frustration about the discrepancy between their intellectual ability and relatively poor academic performance (Brody & Mills, 1997; King, 2005).
Although many articles about the GLD population are written from an advocacy perspective or discuss supports for this group (e.g., Baum & Novak, 2010; Coleman, 2005; King, 2005), the lack of a standardized identification process undermines schools’ ability to recognize these students and develop supports specific to their needs (Brody & Mills, 1997; Foley Nicpon et al., 2011; Nielsen, 2002; Reis et al., 2014). Disagreements about identification also hinder empirical advancements in the field. Researchers often use different criteria to identify GLD participants (Foley Nicpon et al., 2011; Lovett & Sparks, 2013), which means that research findings about population characteristics or helpful intervention strategies may not generalize to GLD students identified with different criteria. It seems likely, then, that agreement about GLD identification criteria would support intervention efforts and basic research related to the GLD population. Therefore, one goal of the current research is to explore the utility and validity of various GLD identification criteria for screening and research purposes.
Identification of Giftedness
Part of the difficulty with GLD identification stems from debate over the best way to operationalize giftedness in practice and research. Best practices for psychological and school-based assessment of giftedness require the use of multiple indicators, and most states with gifted identification policies require schools to use multiple criteria that may include measures of achievement as well as cognitive ability (National Association for Gifted Children & The Council of State Directors of Programs for the Gifted, 2015). The use of single-score giftedness indicators is more common in research, however, and may also be appropriate for school-based screening purposes when applied to large groups of students. Historically, the traditional standard for gifted identification in research settings has been a cutoff score of 130 on a full-scale intelligence measure, which represents the top 2% of the population (McCoach, Kehle, Bray, & Siegle, 2001).
There is no consensus regarding the optimal cutoff to identify giftedness with a single indicator score, however, and twice-exceptionality advocates have criticized the use of a high IQ summary score such as 130 (e.g., Nielsen, 2002). Students with learning disabilities exhibit deficits in processing speed, short-term memory, working memory, or other basic psychological processes (Hale et al., 2010; Schiff, Kaufman, & Kaufman, 1981; Silverman, 1989; Waldron & Saphire, 1990), which may depress overall cognitive performance (Assouline et al., 2010; Ferri et al., 1997; Foley-Nicpon, Assouline, & Colangelo, 2013). Therefore, researchers have suggested it may be more appropriate to use a lower summary score cutoff such as 120 (Silverman, 1989) or to use a different composite score, such as the General Ability Index, Verbal Comprehension Index, or Perceptual Reasoning Index from the Wechsler scales, which provide measures of conceptual abilities that are less influenced by processing speed and working memory (e.g., Assouline et al., 2010; see Kalbfleisch, 2014 for a summary). Because auditory processing abilities (e.g., phonological awareness) and some aspects of long-term memory and retrieval (e.g., rapid automatized naming) are often impaired in individuals with reading disabilities (Snowling, 2013; Vellutino, Fletcher, Snowling, & Scanlon, 2004), including GLD populations (Craggs, Sanchez, Kibby, Gilger, & Hynd, 2006; Silverman, 1989; van Viersen, de Bree, Kroesbergen, Slot & de Jong, 2015; Waldron & Saphire, 1990), summary intelligence scores that include measures of these abilities may also underestimate the overall cognitive ability of GLD students. In sum, even though some consider standardized IQ assessments the gold standard in gifted identification for research purposes (Lovett & Lewandowski, 2006), summary scores from these assessments may not be a valid representation of the cognitive gifts of GLD students with diverse cognitive strengths and weaknesses.
Identification of a Learning Disability
The identification of GLD students is also affected by disagreements regarding the definition of a learning disability (LD). In schools, the concept of an LD has long been associated with below-grade-level academic performance (Hale et al., 2010; Lovett & Lewandowski, 2006). For example, federal and state definitions require that students either fail to make “adequate progress” or perform below grade-level expectations before they can be identified as having an LD. These interindividual definitions require normative impairment—impaired performance compared with a normative group of peers—usually indicated by a standardized achievement score 1 standard deviation or more below the mean.
In contrast to this focus on normative impairment, experts on twice-exceptionality and learning disabilities argue that proper identification of GLD students requires an intraindividual approach (Assouline et al., 2010; Brody & Mills, 1997; Foley Nicpon et al., 2011; Gilman et al., 2013; Hale et al., 2010; McCoach et al., 2001; Nielsen, 2002). In an intraindividual framework, academic weaknesses are conceptualized in relative instead of absolute terms. For example, grade-level performance by a gifted child may indicate the presence of an LD if the child performs more poorly than expected based on his or her cognitive abilities or academic talents in other areas. It is unclear what magnitude of a discrepancy indicates a significant weakness, however. In previous research with LD populations, different discrepancy values identified different numbers of students and different individual students as LD (Proctor & Prevatt, 2003; Sparks & Lovett, 2009). These authors called for more research that compares discrepancies of different sizes as well as other LD identification models.
Although this study focuses on normative impairment and intraindividual discrepancy models for GLD identification, these models are situated within a larger LD identification framework. More functional models of specific learning disabilities focus on core processing deficits that impair academic progress. Dyslexia, for example, is marked by deficits in phonological awareness, orthographic coding, or rapid naming abilities which impair students’ ability to connect sounds to letters in the accurate and rapid manner required for fluent reading (Vellutino et al., 2004). Specific learning disabilities in mathematics are associated with poor retrieval abilities for remembering math facts, poor visuospatial representations of number sets, and processing speed and working memory deficits that undermine accurate problem solving (Geary, Hamson, & Hoard, 2000; Geary & Hoard, 2001; Geary, Hoard, Byrd-Craven, Nugent, & Numtee, 2007). This core-deficit functional model of LD is empirically based and is often consistent with findings from research informed by the well-validated Cattell–Horn–Carroll (CHC) theory of intelligence (Schneider & McGrew, 2012). CHC theory posits a higher order model of intelligence with a first-order general intelligence factor (g) and second-order broad ability factors that represent more specific areas of cognitive ability such as fluid reasoning, crystallized knowledge, processing speed, and others. A large body of CHC-informed research has illustrated which broad cognitive abilities (e.g., auditory processing, processing speed) affect performance in reading, math, and writing (Flanagan, Ortiz, & Alfonso, 2013; McGrew & Wendling, 2010), and these relationships help inform LD identification. The intraindividual discrepancy model and core-deficit model are rarely combined in research or practice. It may be appropriate to combine the models to identify GLD students, though, because these students are believed to have core cognitive deficits related to their LD and to exhibit academic deficits that are often relative instead of absolute (e.g., Assouline et al., 2010; Hale et al., 2010; Lovett & Sparks, 2013). The current study focuses primarily on an ability-achievement discrepancy model because GLD researchers have often identified gifted students as potentially GLD if the difference between the student’s gifted-level cognitive score and an achievement score exceeds a certain value, usually between 1 and 1.75 standard deviations (Lovett & Sparks, 2013).
A discrepancy model could potentially also be used to screen for GLD status in schools. In schools, LDs are typically identified within a response to intervention (RTI) framework with tiered systems of assessment and support. In the first tier, all students receive high-quality education and complete universal screening assessments. Students who perform poorly on screeners or who do not learn at the expected pace receive more intensive instruction in Tier 2 and Tier 3 interventions. Typically, only after students fail to respond to Tier 3 interventions are they referred for evaluation to determine whether an LD is interfering with their ability to learn. Recent research findings suggest that a discrepancy model may help screen for GLD students within an RTI framework (McCallum et al., 2013; Yssel, Adams, Clarke, & Jones, 2014). Therefore, the current study will examine the implications of applying ability-achievement discrepancy criteria to a large group of students, as might be done in a school-based RTI process.
Identification Criteria and the Hypothesized Groups of GLD Students
When the three hypothesized groups of unidentified twice-exceptional children (Baum, 1990) are considered in light of the above debates about identification criteria, several possibilities emerge to improve the identification of students who are GLD. Students in the first hypothesized group are identified as gifted and have an unidentified LD because their academic performance is not low enough to classify as normatively impaired. The use of an intraindividual LD identification framework may help identify these students who perform worse than expected based on their cognitive ability and who may benefit from LD-specific supports even though their academic performance in their area of disability is at or near grade level. Students in the second hypothesized group are identified as LD but have unidentified intellectual gifts, perhaps because the cognitive weaknesses associated with their LD led to an underestimation of their overall cognitive ability in formal or informal assessment. These students may be identified as GLD if gifted identification criteria were expanded to include the use of a lower summary IQ score or different composite scores. These students may also benefit from advanced academic programs. Finally, students in the third hypothesized group are not identified as either gifted or LD, theoretically due to a masking effect in which their LD depresses overall cognitive performance and their intellectual reasoning strengths compensate for their deficits when they complete academic tasks (Bell, Taylor, McCallum, Coles, & Hays, 2015; Berninger & Abbott, 2013; hannah & Shore, 2008; Hernandez Finch, Speirs Neumeister, Burney, & Cook, 2014; Silverman, 1989; van Viersen, Kroesbergen, Slot, & de Bree, 2014). However, a screening system based on more flexible gifted criteria and an intraindividual discrepancy model of LD may identify these students as needing further assessment and services.
Purpose of the Study
Despite theoretical arguments in favor of alternative gifted criteria and intraindividual LD criteria to identify GLD youth, there has been no empirical research on the practical ramifications of the various identification criteria debated in the literature. It is critical to evaluate the practical effects of identification criteria to determine whether they perform as expected or in a reasonable manner (e.g., McBee, Peters, & Waterman, 2013). The current study was designed to address this gap. Because GLD prevalence is an open question in the literature (Foley Nicpon et al., 2011; Lovett & Lewandowski, 2006; Nielsen, 2002), combinations of the suggested GLD identification criteria were applied to a nationally representative sample of school-age children and adolescents to determine how many students are identified as potentially GLD using each set of criteria. Second, the cognitive and academic performance of each group of identified students was examined to further evaluate the validity of the criteria. From a theoretical perspective, students must show evidence of cognitive gifts and academic impairment to be considered GLD. Additionally, GLD students may excel at academic subjects that are less affected by their LD (McCallum et al., 2013; Steeves, 1983) and may require appropriately challenging academic programming in addition to LD-specific supports.
To fulfill the above goals, this study addressed four research questions.
Method
Participants
Data for this study came from school-age participants (K-12) in the standardization sample of the Woodcock-Johnson III Tests of Cognitive Abilities (WJ III COG; Woodcock, McGrew, & Mather, 2001b) and Tests of Achievement (WJ III ACH; Woodcock, McGrew, & Mather, 2001a), which were co-normed. The data set consisted of 4,783 students randomly selected from stratified samples designed to be representative of the population of the United States in 2000, in terms of census region, community size, sex, race, Hispanic ethnicity, and type of school (Schrank, McGrew, & Woodcock, 2001). A fourth edition of the Woodcock-Johnson (WJ IV) was released in 2014. Although some subtests were changed or added in the new edition, the score structure and constructs measured by the WJ IV are similar to those of the WJ III (McGrew, LaForte, & Schrank, 2014).
Measures
The WJ III COG and ACH provide age-standardized measures of cognitive abilities and academic achievement. Standardized scores have a mean of 100 and a standard deviation (SD) of 15. The developers calculated reliability indices using split-half, test–retest, and Rasch analyses for different types of tasks, and reliability estimates ranged from 0.81 to 0.94 for the subtests used in these analyses. The technical manual provides detailed information supporting the strong content, construct, and concurrent validity of the WJ III tests, which are informed by CHC theory. Factor analyses have shown that WJ III tests measure the CHC factors and show theoretically sound relationships between cognitive abilities and academic domains (Schrank et al., 2001). The WJ III was selected for this study because of the large co-normed sample and because its score structure allows for a detailed analysis of students’ cognitive strengths and weaknesses.
Score descriptive ranges provided in the WJ III manual are as follows: Very Low (69 and below), Low (70-79), Low Average (80-89), Average (90-110), High Average (111-120), Superior (121-130), and Very Superior (131 and above). These ranges were used in this study with several important exceptions. In the GLD literature, a standard score of 130 is the highest cutoff used and is typically considered indicative of superlative performance. A standard score of 120 is typically characterized as Superior and advocates argue it represents giftedness. Therefore, to align this study with the GLD literature as a whole, scores of 120-129 were considered Superior, and scores of 130 or higher were considered Very Superior. Similarly, a standard score 1 SD or more below the mean (in this case, a standard score of 85 or below) is typically considered indicative of normative impairment (Lovett & Lewandowski, 2006), so this definition was used in this study in addition to the WJ III descriptive ranges.
Cognitive Ability
The WJ III COG provides measures of multiple cognitive abilities. The General Intellectual Ability (GIA) score is a summary score that represents general intelligence (g) and is similar to a full-scale IQ score on other cognitive ability assessments, such as the Wechsler scales. The standard GIA score is based on 11 subtests that assess multiple aspects of cognitive ability. The WJ III COG also provides cluster scores for each of seven broad cognitive abilities identified by CHC theory: crystallized knowledge (Gc), fluid reasoning (Gf), visual-spatial thinking (Gv), long-term retrieval (Glr), auditory processing (Ga), processing speed (Gs), and short-term memory (Gsm). Because researchers have often used index scores from the Wechsler scales to identify GLD students (Lovett & Sparks, 2013), WJ III cluster scores similar to these Wechsler indices were selected. The WJ III crystallized knowledge (Gc) score is similar to the Wechsler Verbal Comprehension Index (VCI), and the WJ III fluid reasoning (Gf) and visual-spatial thinking (Gv) scores are similar to the Wechsler Perceptual Reasoning Index. The fifth version of the Wechsler scales (WISC-V) has no Perceptual Reasoning Index and instead has separate index scores for visual-spatial abilities and fluid reasoning abilities, which makes the score structure of the WISC-V more similar to the WJ scores used in this study.
Academic Achievement
The WJ III ACH was co-normed with the WJ III COG and provides multiple measures of academic achievement. The Total Achievement score is an overall measure of performance in reading, mathematics, and writing. Cluster scores measure achievement in specific areas, and each cluster is composed of two or three subtests. Performance on these clusters is often used to determine whether a student demonstrates an academic impairment that may be indicative of an LD (Flanagan et al., 2013). The Basic Reading Skills cluster measures skills in phonics, decoding, and sight reading. The Reading Comprehension cluster measures reading comprehension skills for isolated words and short passages. The Math Calculation Skills cluster measures basic mathematics skills, and the Math Reasoning cluster measures mathematical knowledge and quantitative reasoning. The Basic Writing Skills cluster measures spelling and editing skills. The Written Expression cluster measures skills for producing simple to complex sentences.
Identification Criteria and Group Formation
Potential giftedness was assessed with six criteria. The first is the traditional cutoff for gifted identification and the other five are alternative criteria similar to those used in previous research with GLD populations (see Lovett & Sparks, 2013 for a review; see Table 1 for correlations among the cognitive and achievement scores used for these criteria):
GIA standard score (SS) of 130 or higher;
GIA SS of 120 or higher;
Broad ability cluster SS of 130 or higher for crystallized knowledge (Gc), fluid reasoning (Gf), or visual-spatial thinking (Gv);
Broad ability cluster SS of 120 or higher for Gc, Gf, or Gv;
Total Achievement SS of 130 or higher; and
Total Achievement SS of 120 or higher.
Correlations Among Gifted Criteria and Achievement Variables.

Note. GIA = general intellectual ability; Gc = comprehension-knowledge; Gf = fluid reasoning; Gv = visual-spatial thinking. All correlations are significant at p < .01.
Additionally, four different criteria were used to identify students as potentially LD. The first criterion represents a normative definition of impairment, and the others are based on an intraindividual framework.
Normatively impaired academic performance in at least one area, as indicated by a SS lower than 85 on any academic cluster score (Lovett & Lewandowski, 2006).
A difference of 1.5 SD (22.5 points) between the gifted criterion SS and any academic cluster SS. For example, a student who earned a GIA score of 130 and a Basic Reading Skills score of 107 would be labeled as potentially LD in basic reading by this criterion, because the difference between these scores (23) exceeds 1.5 SD.
Any observed academic cluster SS lower than expected based on the gifted criterion SS, with a significant discrepancy defined as 1.5 times the standard error of the estimate (SEe) or greater (McCallum et al., 2013). The SEe is a measure of the accuracy of predictions made by a regression line. In this case, SEe refers to the error expected when an academic cluster score is predicted using a specific cognitive score (SEe values are listed in Table 2). The SEe is analogous to the standard deviation of academic scores around the predicted value at any one point on the line. The standard errors of the estimates for each combination of cognitive predictor and academic outcome were calculated by the formula SEe = √(SDx [1 − r2]), in which SDx is the standard deviation of the gifted measure and r represents the correlation between the gifted measure and the academic cluster score (see McCallum et al., 2013). Unlike Criterion 2, this criterion accounts for the correlation between the gifted cognitive score and the academic score; scores that are more highly correlated require a smaller difference to be considered significantly different. For example, the GIA and Basic Reading Skills scores are highly correlated (r = .645; see Table 1), so students’ scores on the two measures are expected to be more similar than if the scores were uncorrelated. A student with a GIA score of 143 and a Basic Reading Skills score of 122 would be identified as potentially LD according to this criterion but not Criterion 2 because the absolute score difference is less than 22.5.
Same as Criterion 3, but with predicted academic cluster SSs instead of observed scores, to account for regression to the mean. Regression equations were used to predict each academic score using the relevant gifted criterion score; the resulting residuals between predicted and actual achievement scores were compared to the 1.5 SEe value.
SEe Values for Each Combination of Gifted Criterion and Achievement Score.
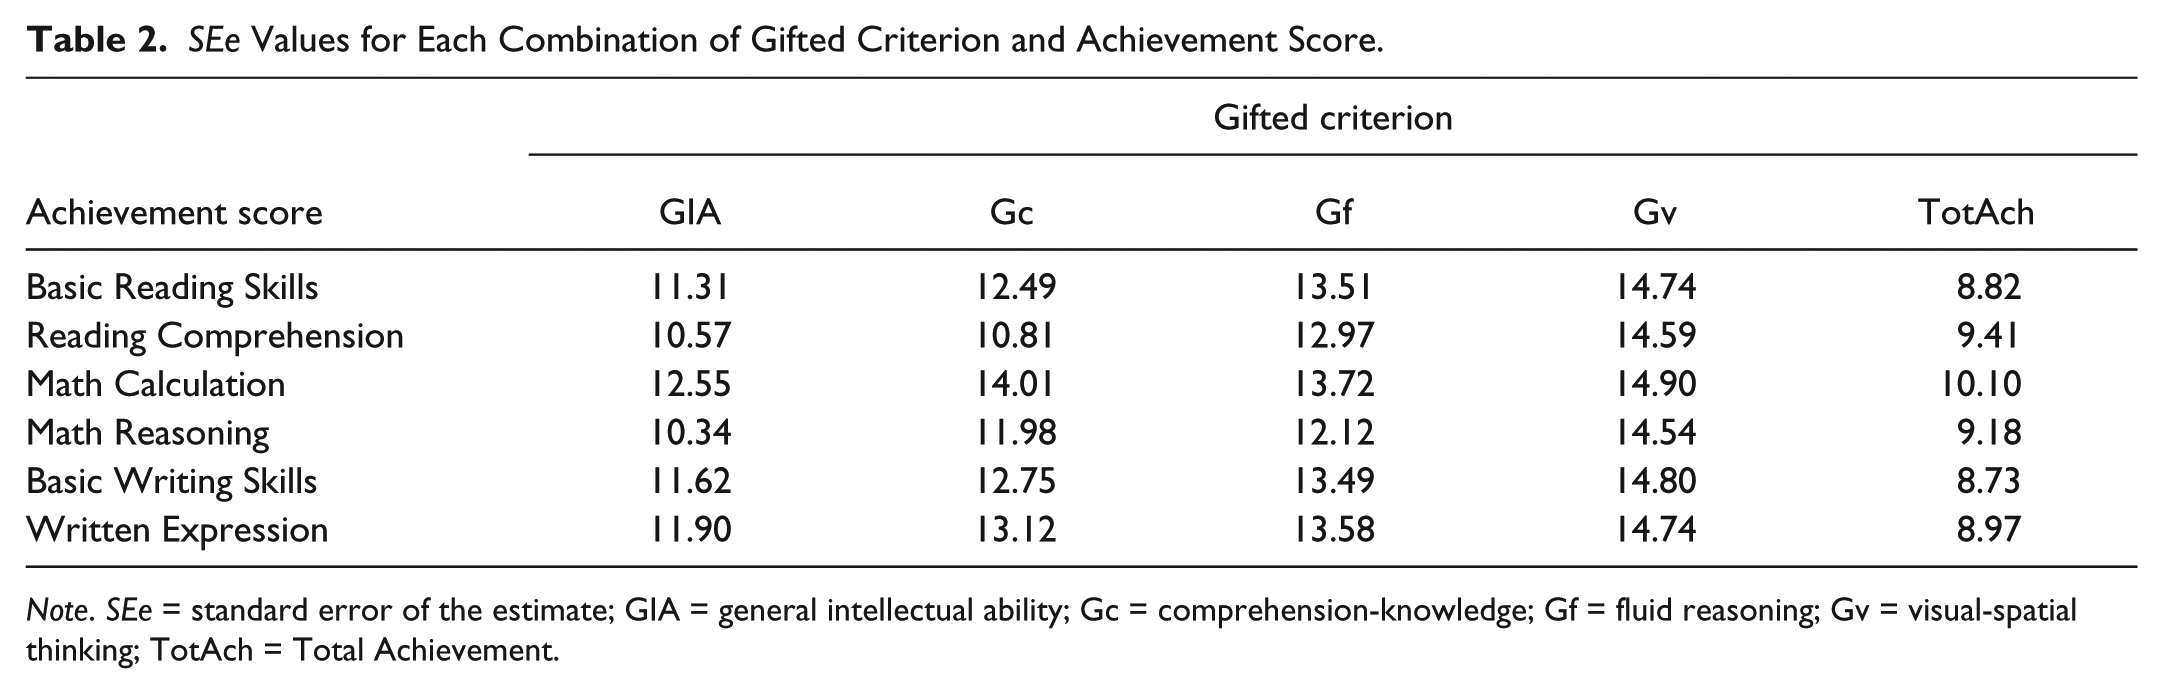
Note. SEe = standard error of the estimate; GIA = general intellectual ability; Gc = comprehension-knowledge; Gf = fluid reasoning; Gv = visual-spatial thinking; TotAch = Total Achievement.
The above criteria were used to form several groups of students for use in the remaining analyses. The GIA 130+ group consists of all students who earned a GIA score of 130 or higher, regardless of whether or not they met any of the LD criteria. This group was included to provide a potentially gifted comparison group against which to evaluate the groups of students identified as potentially GLD. The potentially GLD groups were formed with combinations of the above criteria and organized by the level of the gifted cutoff (130+ or 120+). Students were placed in each potentially GLD group if they met any of the gifted criteria at that cutoff and a specific LD criterion. These combinations resulted in 8 potentially GLD groups: 130+ normative impairment, 130+ 1.5 SD, 130+ 1.5 SEe observed, 130+ 1.5 SEe predicted, 120+ normative impairment, 120+ 1.5 SD, 120+ 1.5 SEe observed, and 120+ 1.5 SEe predicted. The normative impairment LD criterion was expected to identify students with poorer academic performance based on the nature of the criterion. The gifted criteria with 130 cutoffs were expected to identify fewer students, and students with stronger cognitive abilities and higher academic achievement than the gifted criteria with 120 cutoffs. Similarly, the LD criteria that required a larger discrepancy or that used predicted scores were expected to identify fewer students as potentially GLD (McCallum et al., 2013).
Results
Results are summarized below. Most interpretations are based on percentages rather than raw numbers of students because there were different rates of missing data for each analysis.
Gifted and GLD Identification Rates
Table 3 displays identification rate information for each gifted criterion and for the 130 and 120 cutoffs as a whole. Given the standardization of the data, gifted identification rates associated with single indicators at the 130 cutoff were all similar (2.1%-2.9%), as were the rates for the same indicators at the 120 level (8.9%-10.1%). In total, 10.8% of the sample met at least one of the 130+ gifted criteria, and 32.9% met at least one of the 120+ criteria. Because the cognitive variables used as gifted criteria are not perfectly correlated (see Table 1), the use of multiple criteria results in larger groups of students identified as potentially gifted.
Identification Rates for Standard and Alternative Gifted Criteria.
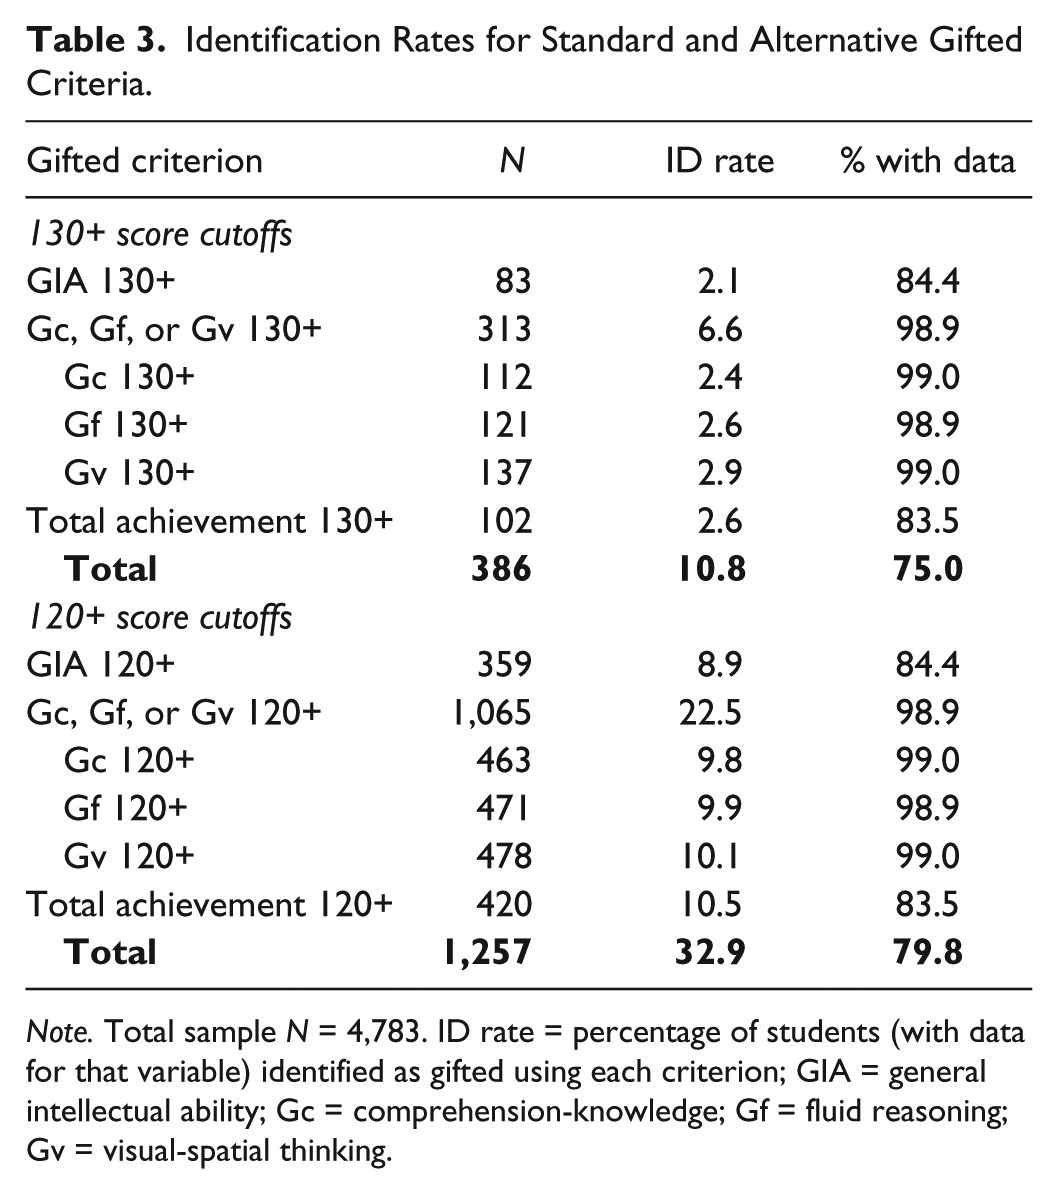
Note. Total sample N = 4,783. ID rate = percentage of students (with data for that variable) identified as gifted using each criterion; GIA = general intellectual ability; Gc = comprehension-knowledge; Gf = fluid reasoning; Gv = visual-spatial thinking.
Crosstabs were used to examine the frequency with which students were identified as potentially gifted, potentially LD, and both (potentially GLD) according to the criteria used in this study. These identification rates are displayed in Table 4. The criteria identified 28.1% of the sample (without missing data) as potentially gifted and 56.0% as potentially LD. LD identification rates were similar for students who were (55.5%) and were not (56.2%) identified as potentially gifted. In the total sample, 15.6% of students were identified as potentially GLD. All these identification rates are higher than estimated prevalence rates for giftedness, LD status, and GLD status.
Number of Students Identified as Potentially Gifted, Learning Disabled (LD), and Both.
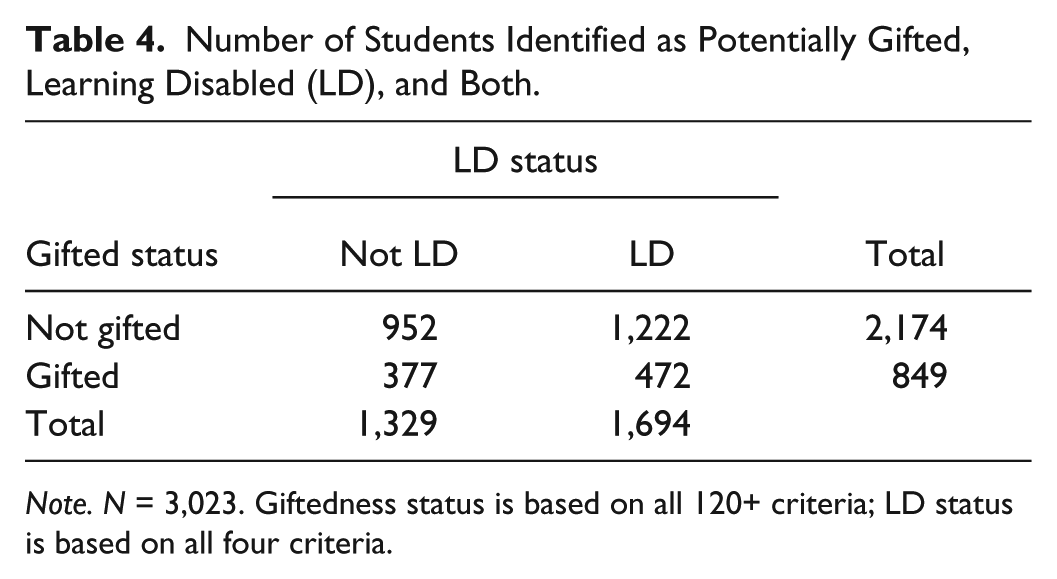
Note. N = 3,023. Giftedness status is based on all 120+ criteria; LD status is based on all four criteria.
To better illustrate the effects of specific combinations of GLD criteria, Table 5 indicates the percentage of students in each potentially gifted group who also met each LD criterion. No students in the GIA 130+ group and only 7% to 10% of other potentially gifted groups met the normative impairment LD criterion. Normative impairment was most common among students who met gifted criteria based on high visual-spatial thinking (Gv) scores and almost nonexistent (n = 1) among students who met gifted criteria based on high Total Achievement scores.
Percentage of Students in Each Potentially Gifted Group Who Met Each LD Criterion or No LD Criteria.
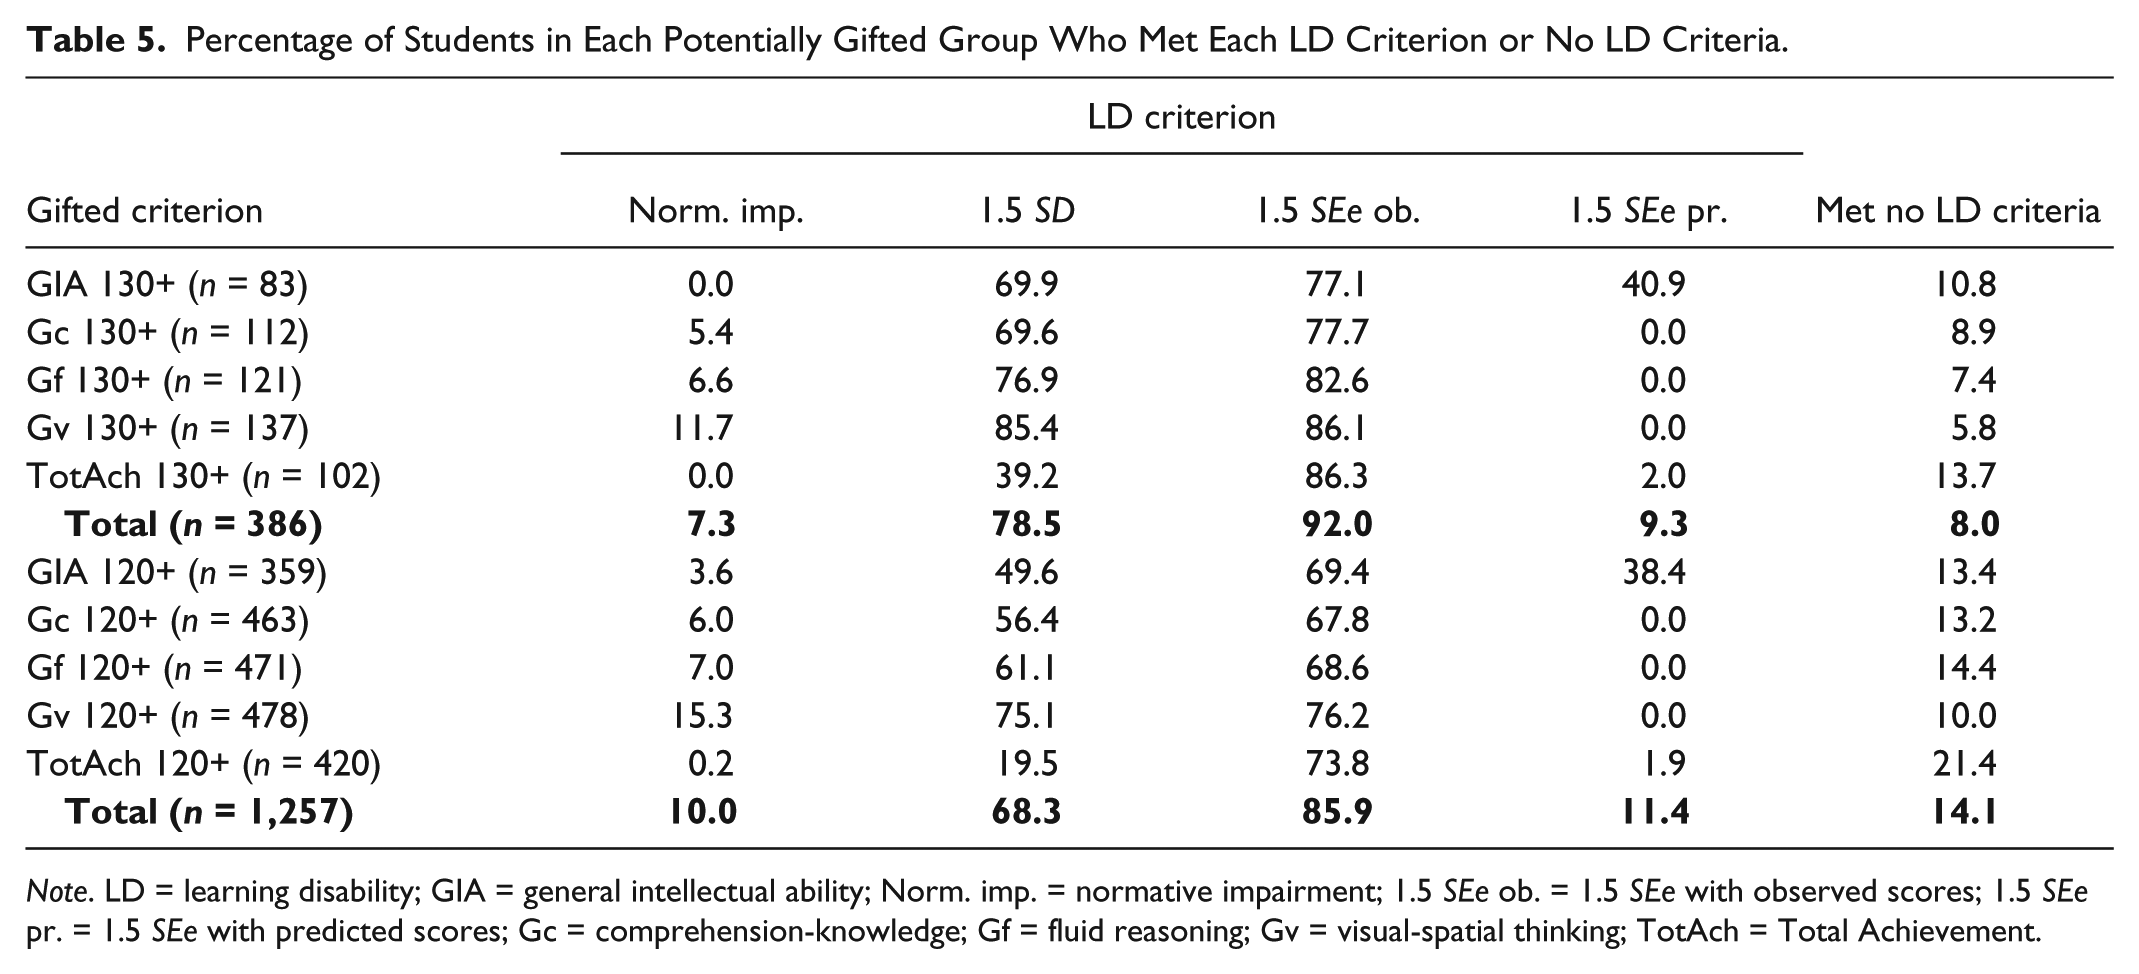
Note. LD = learning disability; GIA = general intellectual ability; Norm. imp. = normative impairment; 1.5 SEe ob. = 1.5 SEe with observed scores; 1.5 SEe pr. = 1.5 SEe with predicted scores; Gc = comprehension-knowledge; Gf = fluid reasoning; Gv = visual-spatial thinking; TotAch = Total Achievement.
The other LD criteria identified unexpectedly large proportions of the potentially gifted groups as potentially LD. Well over half of the students who met each gifted criterion (except the Total Achievement criteria) were also classified as LD by the 1.5 SD or 1.5 SEe observed-score discrepancy criteria (see Table 5). In fact, these two intraindividual LD criteria identified up to 92% of the potentially gifted students as potentially LD. Additionally, a large proportion of students with high GIA scores had an ability-achievement discrepancy that exceeded 1.5 SEe when using predicted scored. These results raise serious concerns about the validity of these discrepancy criteria for identification of LD in gifted youth.
Analyses were also conducted to determine whether the same students are identified as GLD according to the different LD criteria. Table 6 displays the percentage of overlap in group membership for groups with the same gifted criterion but different LD criteria. All the potentially gifted students with normative impairment also had significant intraindividual discrepancies between their gifted cognitive ability score and at least one area of achievement according to the 1.5 SD and 1.5 SEe criteria with observed scores, but none (130+) or few (120+) earned an academic score that was lower than predicted. The 1.5 SEe criteria with observed scores was the most liberal criterion and identified all students who were identified as potentially LD by the other LD criteria.
Percentage of Membership Overlap for GLD Groups.
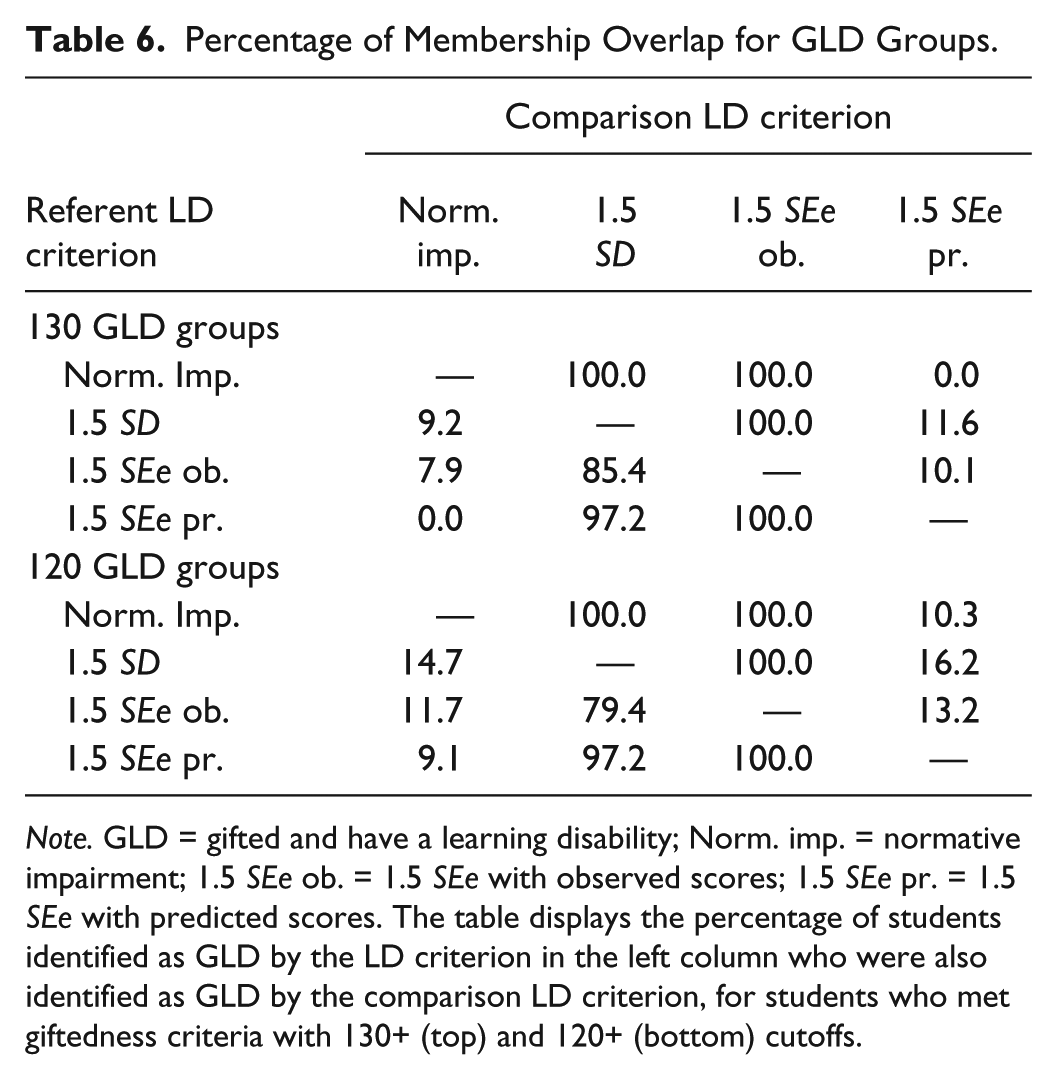
Note. GLD = gifted and have a learning disability; Norm. imp. = normative impairment; 1.5 SEe ob. = 1.5 SEe with observed scores; 1.5 SEe pr. = 1.5SEe with predicted scores. The table displays the percentage of students identified as GLD by the LD criterion in the left column who were also identified as GLD by the comparison LD criterion, for students who met giftedness criteria with 130+ (top) and 120+ (bottom) cutoffs.
Cognitive Abilities and Academic Achievement
To account for the substantial overlap between the GIA 130+ group and the potentially GLD groups (see Table 5), students with a GIA of 130 or above were removed from each GLD group for the remaining analyses. The resulting GLD groups represent students who would be added to the gifted population if the criteria were used to identify GLD students. Note that, as a result, the 130+ 1.5 SEe predicted group contained only two students, and results for this group should be interpreted with caution. Group sample sizes for each analysis are specified in the results tables.
Mean cognitive ability scores for students in the GIA 130+ group and the potentially GLD groups are displayed in Table 7; mean achievement scores are displayed in Table 8. These results are similar to those of a quantitative synthesis of GLD students’ ability and achievement characteristics across 46 studies (Lovett & Sparks, 2013). The mean cognitive scores in these samples are similar to the corresponding mean full-scale IQ (122.8), Verbal IQ (118.6), and Performance IQ scores (125.9) from the synthesis, though some potentially GLD groups in this sample have lower mean cognitive scores, particularly for the 120+ groups. Students’ weighted mean academic scores in the synthesis were in the Average range for reading (95.8) and writing (93.0) and in the High Average range for math (111.1); the potentially GLD groups in this study also mostly have mean scores in the Average and High Average range, with a few exceptions.
Means and Standard Deviations of Cognitive Ability Scores for Students in Each Group.
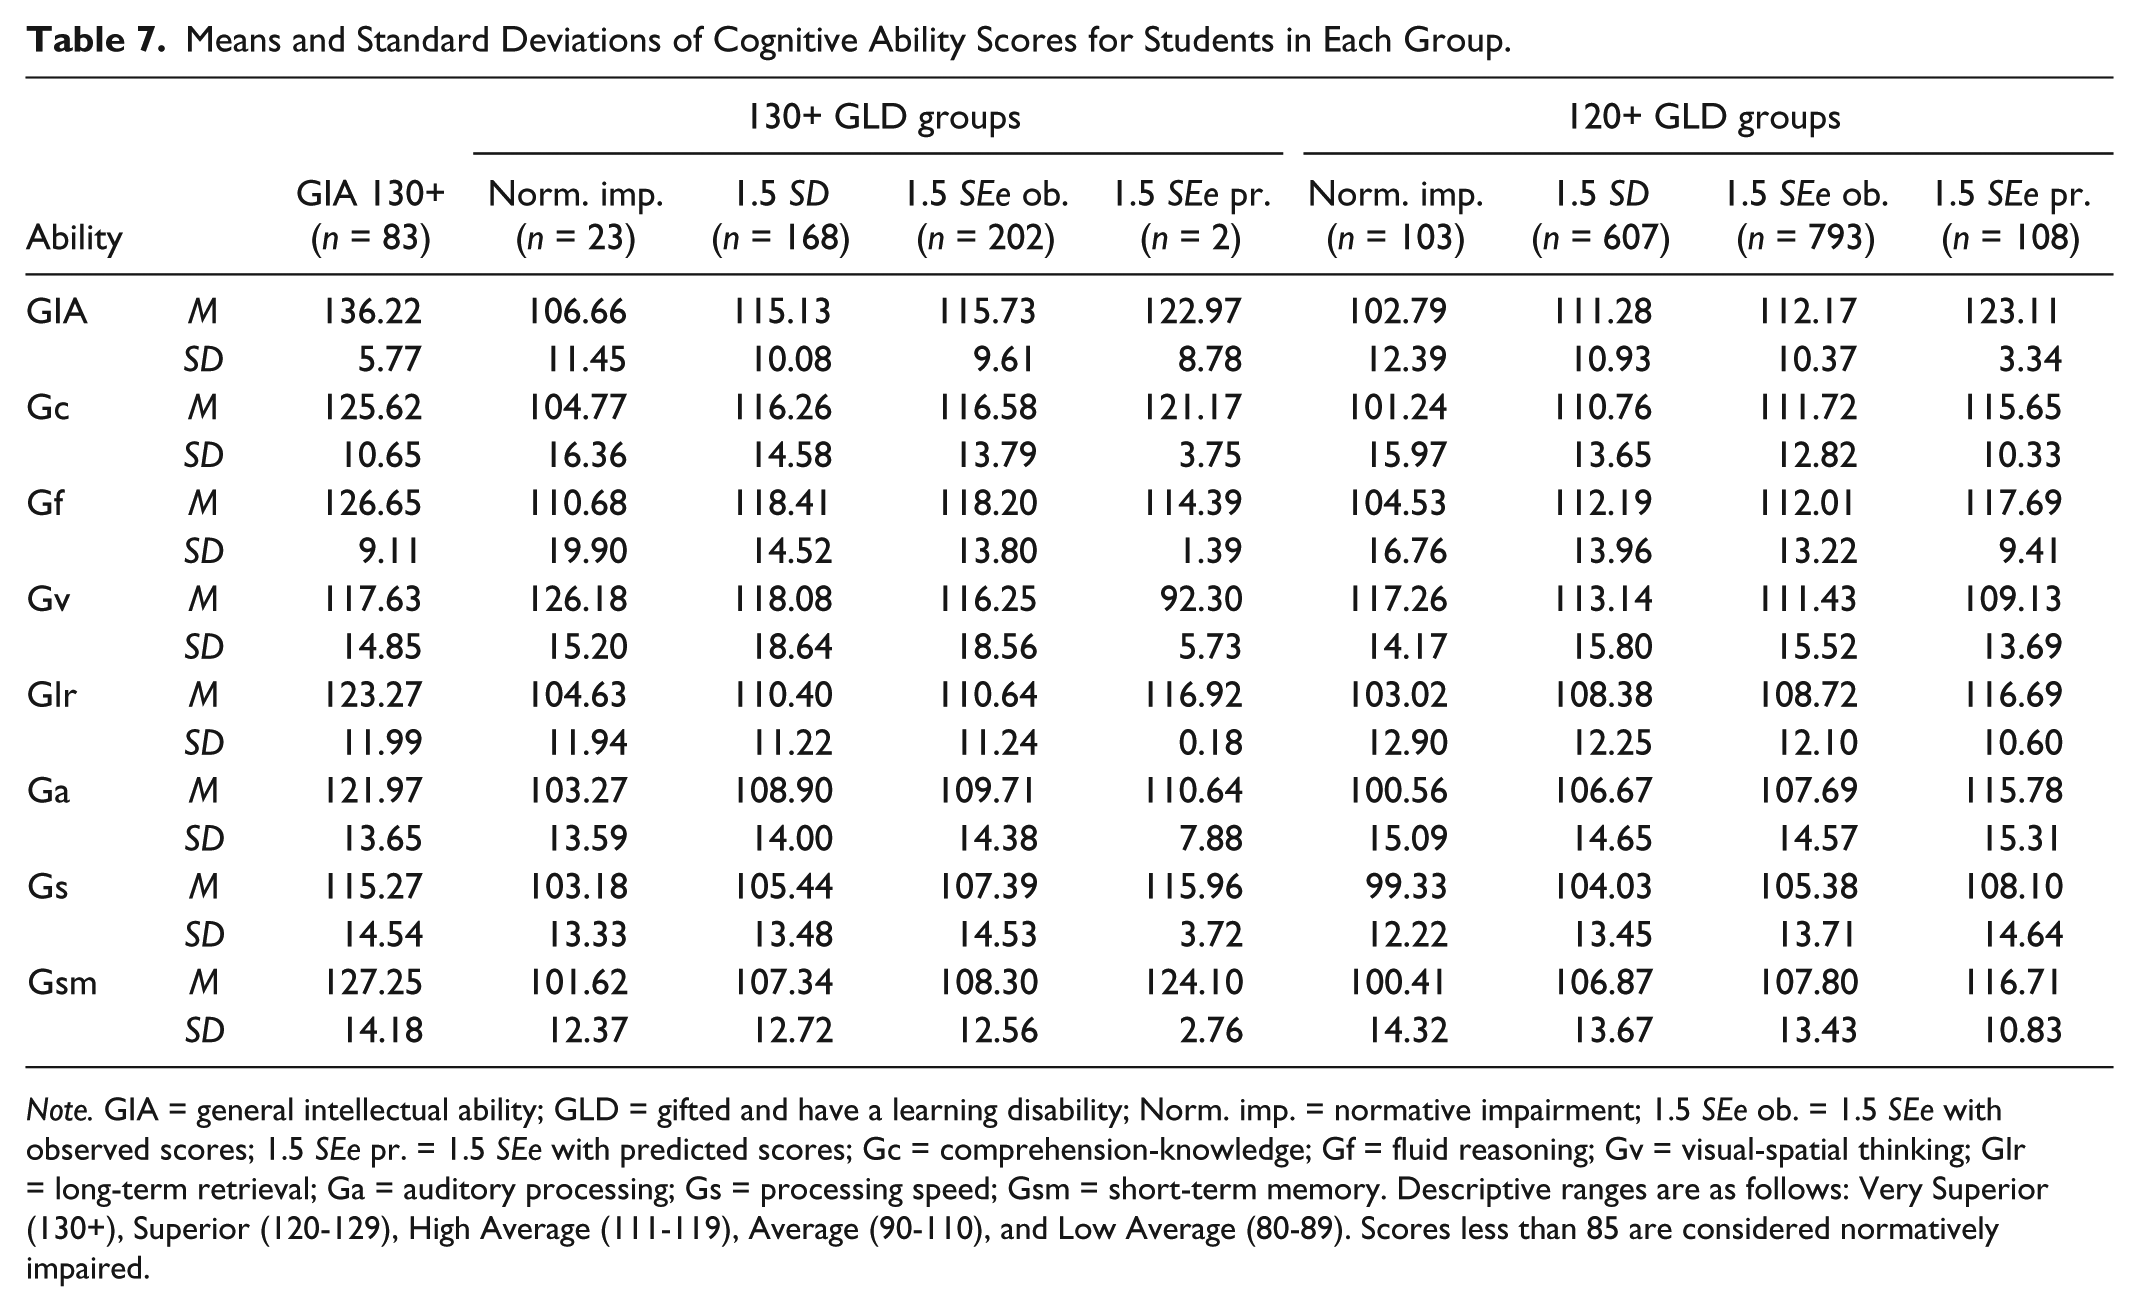
Note. GIA = general intellectual ability; GLD = gifted and have a learning disability; Norm. imp. = normative impairment; 1.5 SEe ob. = 1.5 SEe with observed scores; 1.5 SEe pr. = 1.5 SEe with predicted scores; Gc = comprehension-knowledge; Gf = fluid reasoning; Gv = visual-spatial thinking; Glr = long-term retrieval; Ga = auditory processing; Gs = processing speed; Gsm = short-term memory. Descriptive ranges are as follows: Very Superior (130+), Superior (120-129), High Average (111-119), Average (90-110), and Low Average (80-89). Scores less than 85 are considered normatively impaired.
Means and Standard Deviations of Academic Achievement Scores for Students in Each Group.

Note. GLD = gifted and have a learning disability; GIA = general intellectual ability; Norm. imp. = normative impairment; 1.5 SEe ob. = 1.5 SEe with observed scores; 1.5 SEe pr. = 1.5 SEe with predicted scores; TotAch = Total Achievement; BscRdg = Basic Reading Skills; RdgComp = Reading Comprehension; MathCalc = Math Calculation; MathReas = Math Reasoning; BscWrit = Basic Writing Skills; WritExp = Written Expression. Descriptive ranges are Very Superior (130+), Superior (120-129), High Average (111-119), Average (90-110), and Low Average (80-89). Scores less than 85 are considered normatively impaired.
Although informative, group mean scores do not illustrate the magnitude or frequency of individual weaknesses. Therefore, it was important to examine what percentage of students in each group earned below-average scores (<90) in each cognitive ability (Table 9) and academic area (Table 10), as expected for students with an LD. Additionally, Table 10 shows the percentage of students in each group who earned an above-average score in each academic area and who may therefore require advanced academic programming. Finally, because gifts and disabilities are identified at the individual level and not at the group level, it was important to examine strengths and weaknesses within individuals. Table 11 shows the percentage of students in each group and in the sample as a whole that demonstrated specific indicators of academic talent (at least one score at the Superior or Very Superior level) or LD-relevant deficits (at least one score indicating below-average academic performance, below-average cognitive processing, or normatively impaired cognitive processing). Below, the results from all these analyses are briefly summarized for each 130+ group and for the 120+ groups as a whole.
Percentage of Students in Each Group with a Below-Average Score for Each Cognitive Ability.
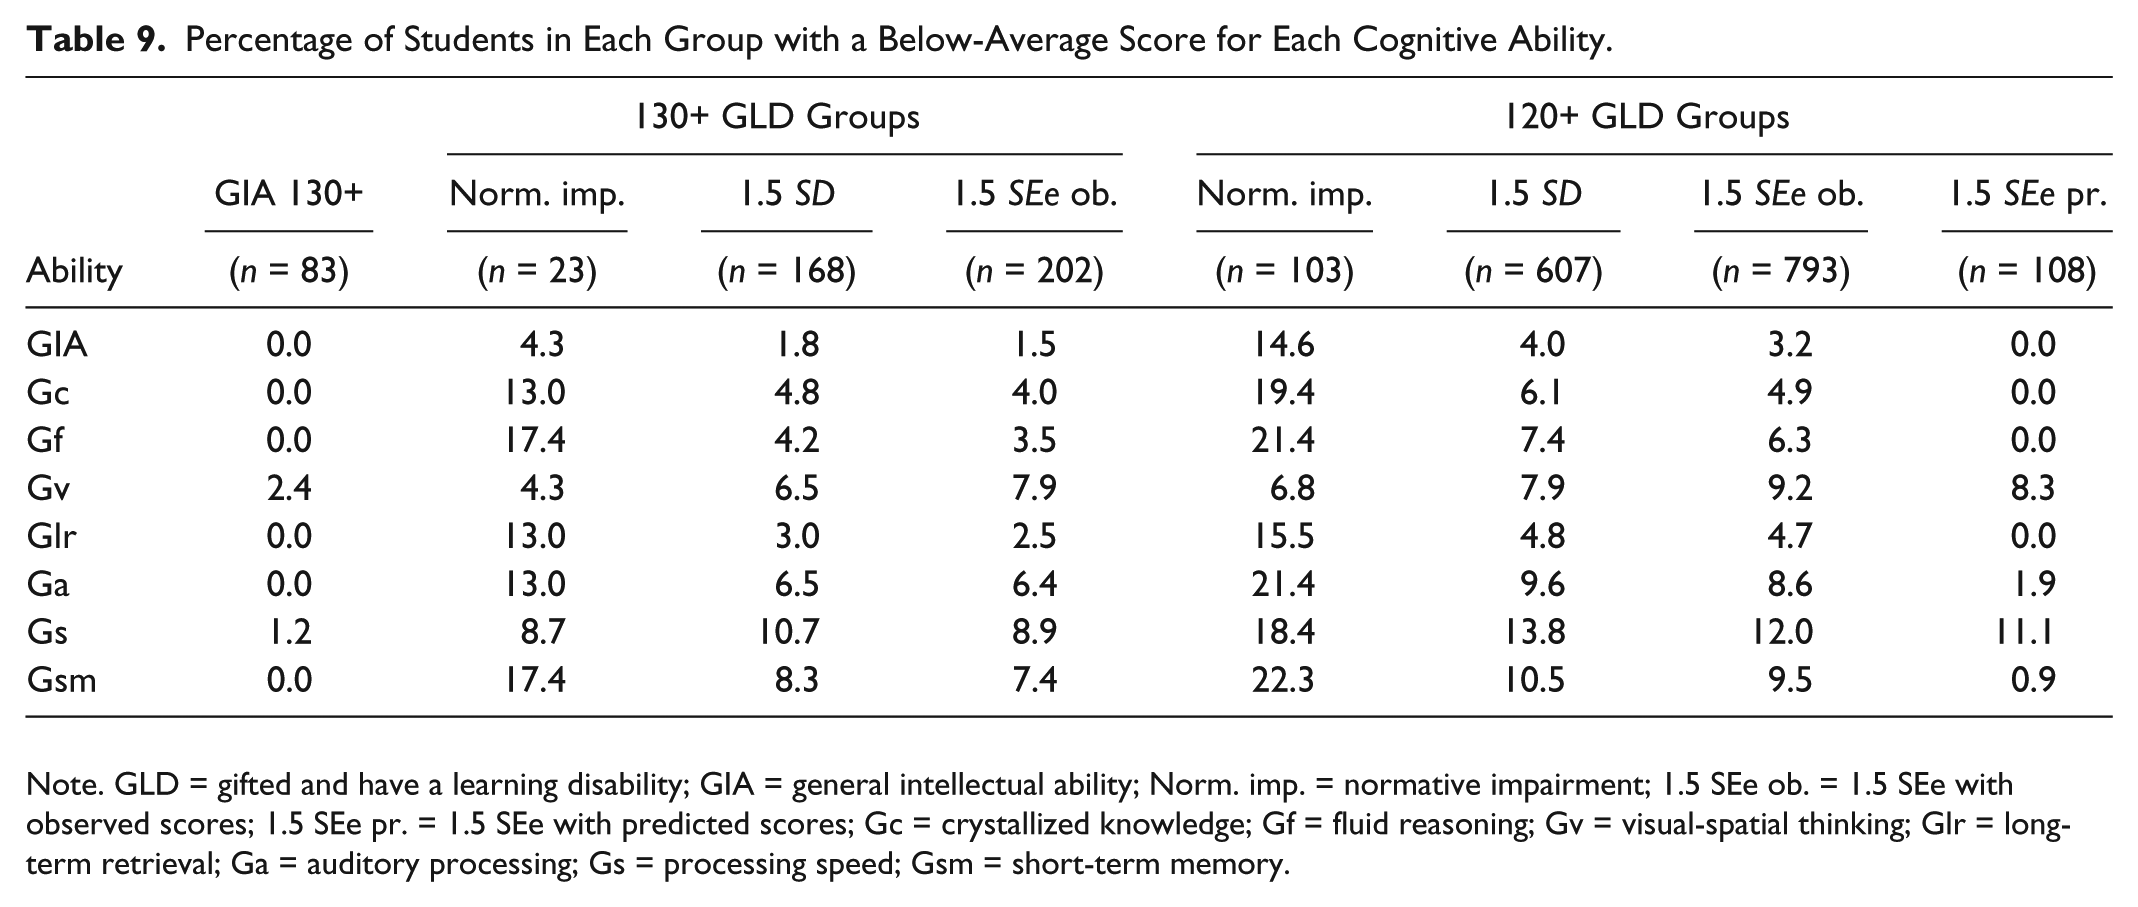
Note. GLD = gifted and have a learning disability; GIA = general intellectual ability; Norm. imp. = normative impairment; 1.5 SEe ob. = 1.5 SEe with observed scores; 1.5 SEe pr. = 1.5 SEe with predicted scores; Gc = crystallized knowledge; Gf = fluid reasoning; Gv = visual-spatial thinking; Glr = long-term retrieval; Ga = auditory processing; Gs = processing speed; Gsm = short-term memory.
Percentage of Students in Each Group Who Earned a Below- or Above-Average Score in Each Achievement Area.

Note. Norm. imp. = normative impairment; 1.5 SEe ob. = 1.5 SEe with observed scores; 1.5 SEe pr. = 1.5 SEe with predicted scores. GIA = General Intellectual Ability. Norm. imp. = Normative academic impairment. Ach. area = Achievement area. TotAch = Total Achievement; BscRdg = Basic Reading Skills; RdgCmp = Reading Comprehension; MathCalc = Math Calculation; MathReas = Math Reasoning; BscWrit = Basic Writing Skills; WritExp = Written Expression. The 130+1.5 SEe predicted group was not included because of its small size (n = 2).
Prevalence of Academic Talent Indicators and LD Indicators for the Total Sample and Each Group.
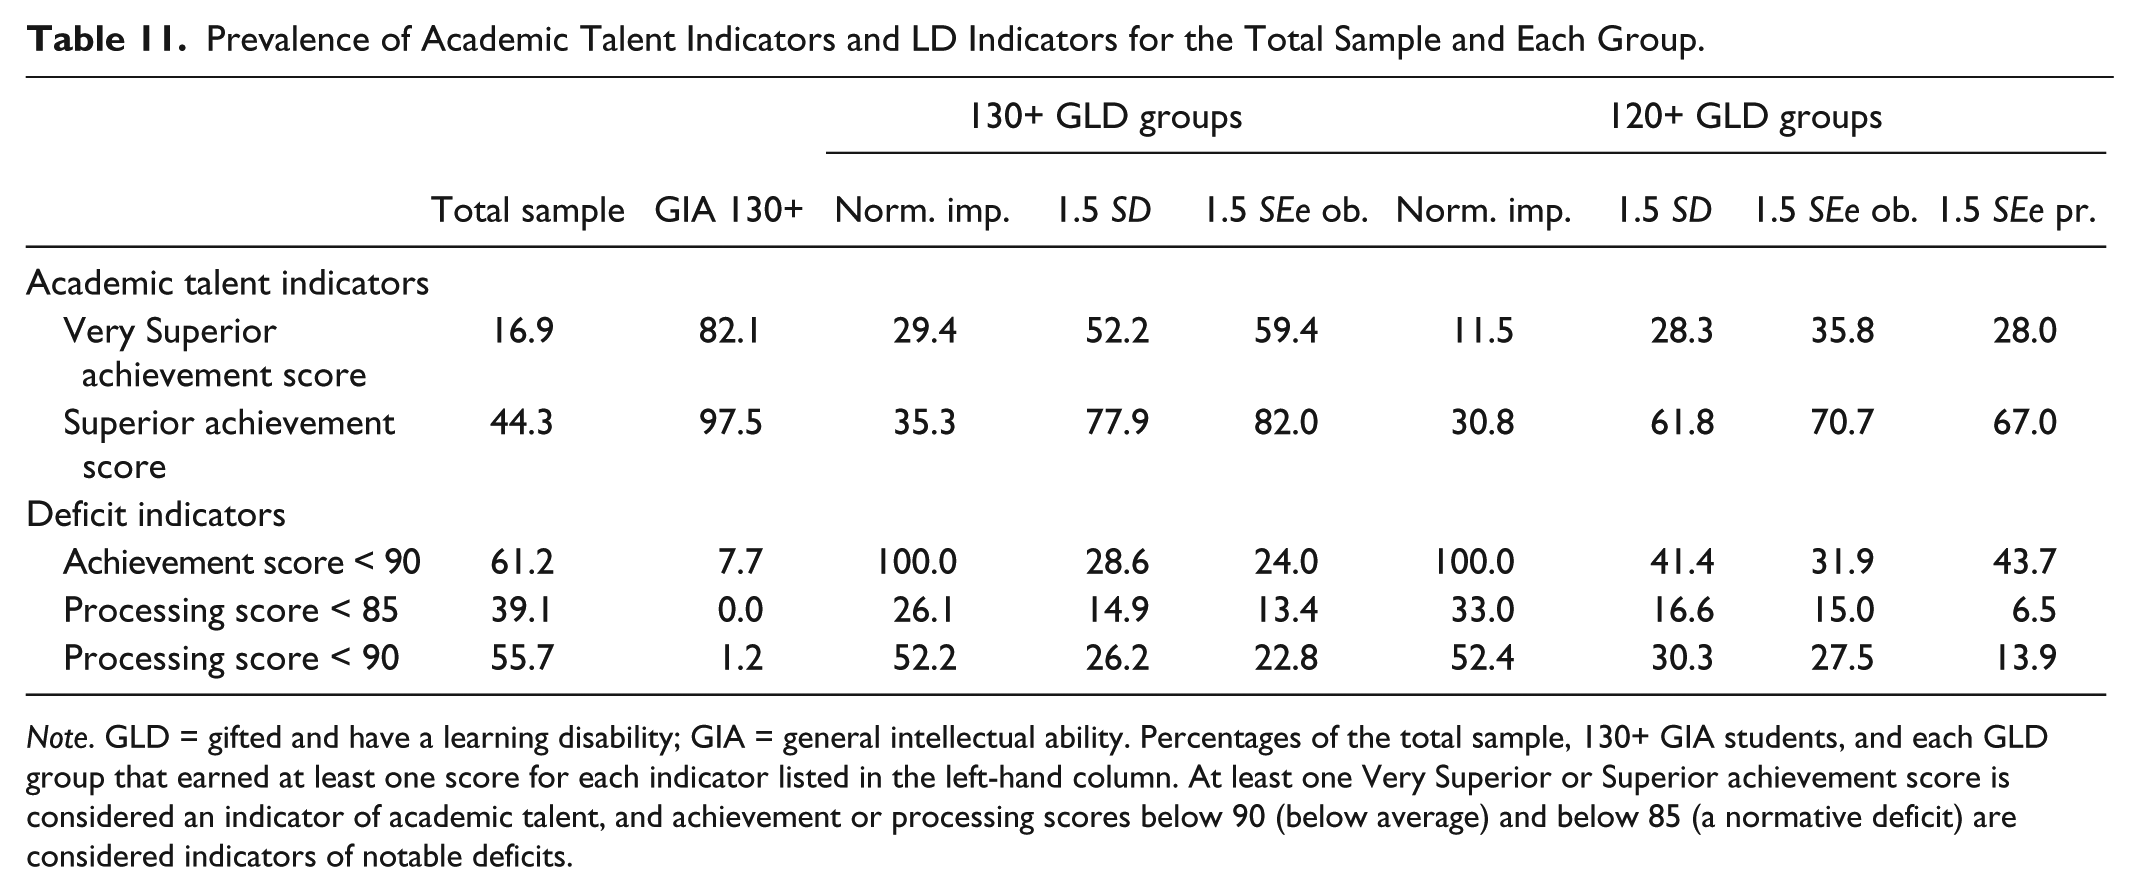
Note. GLD = gifted and have a learning disability; GIA = general intellectual ability. Percentages of the total sample, 130+ GIA students, and each GLD group that earned at least one score for each indicator listed in the left-hand column. At least one Very Superior or Superior achievement score is considered an indicator of academic talent, and achievement or processing scores below 90 (below average) and below 85 (a normative deficit) are considered indicators of notable deficits.
GIA 130+
The GIA 130+ group earned High Average or Superior mean scores on all the cognitive and academic measures (see Tables 6 and 7). Additionally, almost all students in this group earned at least one achievement score in the Superior (98%) or Very Superior (82%) range (see Table 11). Weaknesses in lower order cognitive processing skills and academic performance were rare: only 1% had any below-average score in a lower order processing skill, and the percentage of students who earned at least one below-average academic score (7.7%) was much lower than in the sample as a whole (61.2%).
130+ Normative Impairment
This group earned mean scores in the Average range for every cognitive ability except visual-spatial thinking (Gv), which was in the Superior range. The Average mean scores suggest within-group variability in cognitive performance given the fact that almost half of the students in this group earned a Gc or Gf score of 130 to qualify as potentially gifted. Compared to other 130+ potentially GLD groups, the 130+ normative impairment group had larger proportions of students with below-average cognitive skills in all areas except visual-spatial thinking (percentages ranged from 4% to 17% for each cognitive ability; see Table 9). Many of these students had at least one lower order cognitive processing score in the normatively impaired (26%) or below average range (52%; see Table 11).
On each achievement measure, more students earned below-average academic scores in each domain than in the other 130+ groups, though rates varied widely by domain (see Table 10). Additionally, only 5% to 30% of students in this group earned above-average scores in each domain. Although fewer of these students earned an achievement score in the Superior range (35%) than in the sample as a whole, more earned an achievement score in the Very Superior range (29%; Table 11); these seemingly contradictory results suggest high levels of specialized academic performance despite cognitive deficits and other areas of academic weakness.
130+ 1.5 SD and 1.5 SEe Observed
These two potentially GLD groups had almost identical patterns of mean cognitive and achievement scores, likely due to substantial overlap in membership. Most of the groups’ mean cognitive and achievement scores were lower than those of the GIA 130+ group but still within the High Average range. Rates of lower order cognitive processing deficits were higher than in the GIA 130+ group but lower than in the 130+ normative impairment group, except for higher rates of Gv and Gs deficits. Most students in these groups earned at least one academic score in the Superior or Very Superior range, but approximately one fourth also earned at least one below-average academic score; this is 3 times the rate in the GIA 130+ group (see Table 11). Thus, the students in these groups have clear academic strengths compared to the sample as a whole yet have relative academic weaknesses compared to potentially gifted peers.
130+ 1.5 SEe Predicted
The two students in this group earned Superior or High Average mean scores in all cognitive and achievement areas except visual-spatial thinking. As can be seen in Table 8, the mean scores for this group had large standard deviations for Reading Comprehension (36.27) and Math Calculation Skills (39.28). On Reading Comprehension, the students earned scores of 164 (Very Superior) and 113 (High Average). On Math Calculation Skills, the student with the Very Superior reading score earned a score in the Average range (109) and the other student earned a score of 165 (Very Superior). Despite these patterns of inconsistent academic performance, these students did not exhibit the expected weaknesses in lower order processing; therefore, these students’ academic difficulties may be related to factors other than an LD, such as low motivation or poor educational opportunities (McCoach et al., 2001; McCoach & Siegle, 2003).
120+ Potentially GLD Groups
The 120+ potentially GLD groups had lower mean levels of performance compared with their 130+ counterpart groups, and fewer students in each group showed academic strengths. However, the patterns (highs and lows) of mean cognitive ability scores and academic achievement scores were similar when compared to the 130+ counterpart groups. Additionally, the rates of cognitive weaknesses and academic weaknesses were similar to the rates in the 130+ counterpart groups (see Table 11). Overall, therefore, the 120+ GLD groups appeared notably less gifted and talented than the 130+ GLD groups but only slightly more impaired. A larger proportion of the 120+ GLD groups earned Very Superior and Superior achievement scores than in the sample as a whole, which indicates normative academic strengths, with the exception of the students in the 120+ normative impairment group, who earned Very Superior and Superior achievement scores at a lower rate than in the total sample.
Discussion
Researchers and practitioners are increasingly interested in students who are GLD, but disagreements about appropriate identification criteria undermine the ability to identify and serve these students. Although there has been considerable debate about which criteria are appropriate, this is the first empirical investigation to evaluate the validity and utility of the different identification criteria in a nationally representative sample. Below, each research question is addressed in order along with related implications for theory and practice. The section ends with a review of the limitations of this study and areas for future research.
Research Question 1: Identification Rates for Potential GLD Status
As in previous studies (see Sparks & Lovett, 2009), fewer potentially gifted students met the normative impairment LD criterion than any of the intraindividual LD criteria, and none of the students with a full-scale IQ score of 130 met the normative impairment LD criterion. If only this traditional LD criterion were used for GLD identification, the number of gifted students identified as LD would likely be highly restricted and potentially zero. Such a low identification rate would be troubling, given the evidence in this study that many students identified with alternative GLD criteria exhibit hallmarks of giftedness (e.g., superior reasoning abilities, high achievement) and LD status (e.g., cognitive and academic weaknesses).
Both observed-score discrepancy criteria classified unrealistically large portions of the potentially gifted students as LD. As expected, the 1.5 SEe observed-score discrepancy LD criterion identified the largest number of potentially gifted students as potentially LD; all the students identified by other LD criteria also met this criterion. The 1.5 SEe predicted-score discrepancy criterion was the most restrictive of the intraindividual discrepancy criteria but performed unevenly across the potentially gifted groups identified with different gifted criteria. For example, none of the students with Gc, Gf, or Gv scores of 120/130+ met this LD criterion, perhaps because the broad abilities are less strongly correlated with academic achievement than the GIA score, and thus larger absolute score differences are considered nonsignificant. In sum, all the LD criteria demonstrated flaws for GLD identification.
Because the sample for this study was nationally representative, identification rates were intended to evaluate whether each set of GLD criteria labeled a reasonable proportion of gifted students as LD and to provide preliminary estimates of true GLD prevalence rates. It was not possible to estimate reasonable population prevalence rates for GLD status, however, given the overidentification of LD status among each potentially gifted group (20%-86%). It appears that intraindividual ability-achievement discrepancies are relatively common in gifted youth, likely because regression to the mean contributes to ability-achievement discrepancies (Woodcock, 1984), particularly for individuals with high ability. Therefore, these results raise concerns about whether such discrepancies are a useful or valid marker of LD status for a high-ability population when used in isolation. Prevalence rates for giftedness, LD status, and GLD status are always arbitrary to some degree because the rates differ based on the criteria used for identification, but it is unlikely that half or two thirds of potentially gifted students have an LD. The overall prevalence rate of specific learning disabilities among United States students is estimated between 5% and 20% (Cortiella & Horowitz, 2014), and there is no reason to believe that students in the gifted population experience much higher rates of LD. Therefore, the intraindividual LD criteria used in this study would likely overidentify GLD status if used to screen for or identify GLD status in entire school populations. The use of a discrepancy model alone has been discredited for some time in the special education literature as insufficient to diagnose an LD (e.g., see Gresham & Vellutino, 2010; Hale et al., 2010; Kavale, 2001), and the results of this study suggest that a discrepancy model alone is also insufficient to diagnose LD in the gifted population.
Research Question 2: Evidence of Lower Order Processing Deficits
Weaknesses in lower order processing skills are a hallmark of LD status and were evident in all the potentially GLD groups at higher rates (7%-52%) than in the GIA 130+ group (1%). These results suggest that an intraindividual approach to LD screening validly identifies a number of students who have deficits in lower order cognitive abilities that may be related to an LD, which can undermine performance in multiple achievement domains (Flanagan et al., 2013; McGrew & Wendling, 2010). For example, processing speed and short-term memory affect most areas of academic achievement and were the most common area of weakness across all the potentially GLD groups. Additionally, deficits in auditory processing abilities affect the development of reading skills (see Vellutino et al., 2004), and deficits in long-term retrieval may affect basic reading skills and reading comprehension (Floyd, Meisinger, Gregg, & Keith, 2012; Hajovsky, Reynolds, Floyd, Turek, & Keith, 2014; McGrew, 1993; McGrew & Wendling, 2010), math achievement (Floyd, Evans, & McGrew, 2003; McGrew & Hessler, 1995), and basic writing skills (Floyd, McGrew, & Evans, 2008).
The potentially GLD students’ relative cognitive deficits not only affect achievement but also have implications for identification practices. The potentially GLD groups with higher rates of cognitive weaknesses had mean full-scale intelligence scores in the Average or High Average range despite the students’ Superior-level reasoning abilities; this pattern is consistent with a masking effect in which processing deficits depress students’ overall intelligence scores and hide their cognitive strengths (Assouline et al., 2010; Baum, 1990; Ferri et al., 1997; Foley-Nicpon et al., 2013). Therefore, these results support the validity of the use of alternative gifted criteria to identify students who have cognitive gifts but who do not meet traditional gifted cutoff scores on full-scale IQ measures because of their cognitive deficits.
The descriptive results of this study can also inform guidelines about what level of cognitive processing performance constitutes a weakness for an intellectually gifted student. The GIA 130+ group performed in the Superior range for short-term memory, long-term memory, and auditory processing, so an Average score in these areas could reasonably be considered a weakness and indicative of potential GLD status. In contrast, many students in the GIA 130+ group had processing speed scores in the Average range, and other studies have documented Average processing speed abilities among gifted youth (Buzinkai, 2013; Doobay, Foley-Nicpon, Ali, & Assouline, 2014; Rowe, Dandridge, Pawlush, Thompson, & Ferrier, 2014; Vecchio, 2013). Therefore, it may be more appropriate to consider only below-average processing speed scores as indicative of a cognitive weakness for students who are gifted.
Research Question 3: Evidence of Impaired Academic Achievement
Theoretically, it is critical that students identified as GLD by certain criteria show some evidence of academic impairment. Overall, the potentially GLD groups had lower mean academic performance than the GIA 130+ group and demonstrated specific academic weaknesses that distinguished them from their non-LD potentially gifted peers, even though most potentially GLD students did not meet the normative impairment criterion. This absence of norm-referenced academic impairment is consistent with the idea that GLD students may compensate for their learning deficits with their cognitive gifts (Ferrer, Shaywitz, Holahan, Marchione, & Shaywitz, 2010), which masks the existence of their deficits in achievement contexts (Berninger & Abbott, 2013; van Viersen et al., 2014). For example, gifted students with dyslexia perform better on reading and spelling tasks than average-IQ students with dyslexia, even though both groups have core LD-related deficits in cognitive skills such as verbal working memory (Berninger & Abbott, 2013), phonological awareness, and rapid naming (van Viersen et al., 2014). In practice, complete individual psychoeducational evaluations are necessary to determine which students with potential cognitive gifts and average academic performance have an unidentified LD for which they have been compensating (Assouline et al., 2010).
Research Question 4: Evidence of Academic Strengths
In every area of achievement tested, some students in each potentially GLD group earned above-average achievement scores. Within the reading and mathematics domains, all groups earned higher mean scores in the clusters that rely on higher order thinking and domain-specific problem solving (Reading Comprehension, Math Reasoning) compared with the clusters that measure more basic skills and speeded tasks (Basic Reading Skills, Math Calculation Skills; see Table 8). This pattern is consistent with the potentially gifted students’ cognitive strengths and weaknesses but may also reflect curricular suppression. Within the writing domain, some groups of potentially gifted students performed slightly better on Basic Writing Skills tasks than Written Expression tasks. There is little research on the ability-achievement relations for writing performance in general, so more research is needed to understand which cognitive abilities underlie different writing skills. Overall, most students in each potentially GLD group (except for the 120+ normative impairment group) earned at least one academic score in the Superior or Very Superior range despite academic weaknesses in other areas. Because students in the potentially GLD groups earned academic scores at both the upper and lower extremes of performance, they would likely benefit from dually differentiated curriculum that challenges them in their areas of academic strength and supports their areas of weakness.
Implications for Identification of GLD Students
Although the intraindividual GLD criteria evaluated in this study seriously overidentify LD status in potentially gifted youth when used alone, such intraindividual discrepancies may still have an important role in GLD identification. Experts recently outlined best practices in twice-exceptional identification and strongly advocated for the use of an intraindividual approach (e.g., the use of an ability-achievement discrepancy) to provide ethical and legally defensible assessment of gifted children (Gilman et al., 2013). These authors argued, As special education in the U.S. shifts its focus away from students exhibiting “unexpectedly” low performance to only those meeting below-grade-level, absolute performance criteria, equity issues arise. This new definition of disability, designed to avoid “waiting for a child to fail,” makes gifted students wait longer—perhaps indefinitely—to be recognized. (p. 12)
Therefore, it is critical that the field adjusts or adds to these popular discrepancy models to improve their accuracy when used with gifted youth.
In school-based practice, one option is to combine aspects of discrepancy-focused criteria and criteria based on absolute performance or ability. Although these approaches are often portrayed as opposing models of disability identification, the authors of a Learning Disabilities Association White Paper (Hale et al., 2010) advocated for an identification model that includes an examination of processing strengths and weaknesses (absolute performance) as well as relative achievement deficits (discrepancy approach) that are empirically linked to a processing weakness (core-deficit approach). The results of this study suggest that these models could be combined to more accurately identify students who are GLD (see Figure 1). For example, the discrepancies in this study are relatively simple to apply to a large database of student information and thus could be used for screening purposes (e.g., McCallum et al., 2013). To identify an appropriate number of students for follow-up, schools could use another screening criterion based on normative or absolute performance; they may require that the academic score responsible for the ability-achievement discrepancy is in the Average range or lower or that students exhibit some struggles in school. Although advocates for twice-exceptional students typically argue against the use of absolute performance criteria, they do so to protect twice-exceptional students from underidentification, whereas this suggestion is designed to protect gifted students with significant score discrepancies from inappropriate overidentification of LD status.
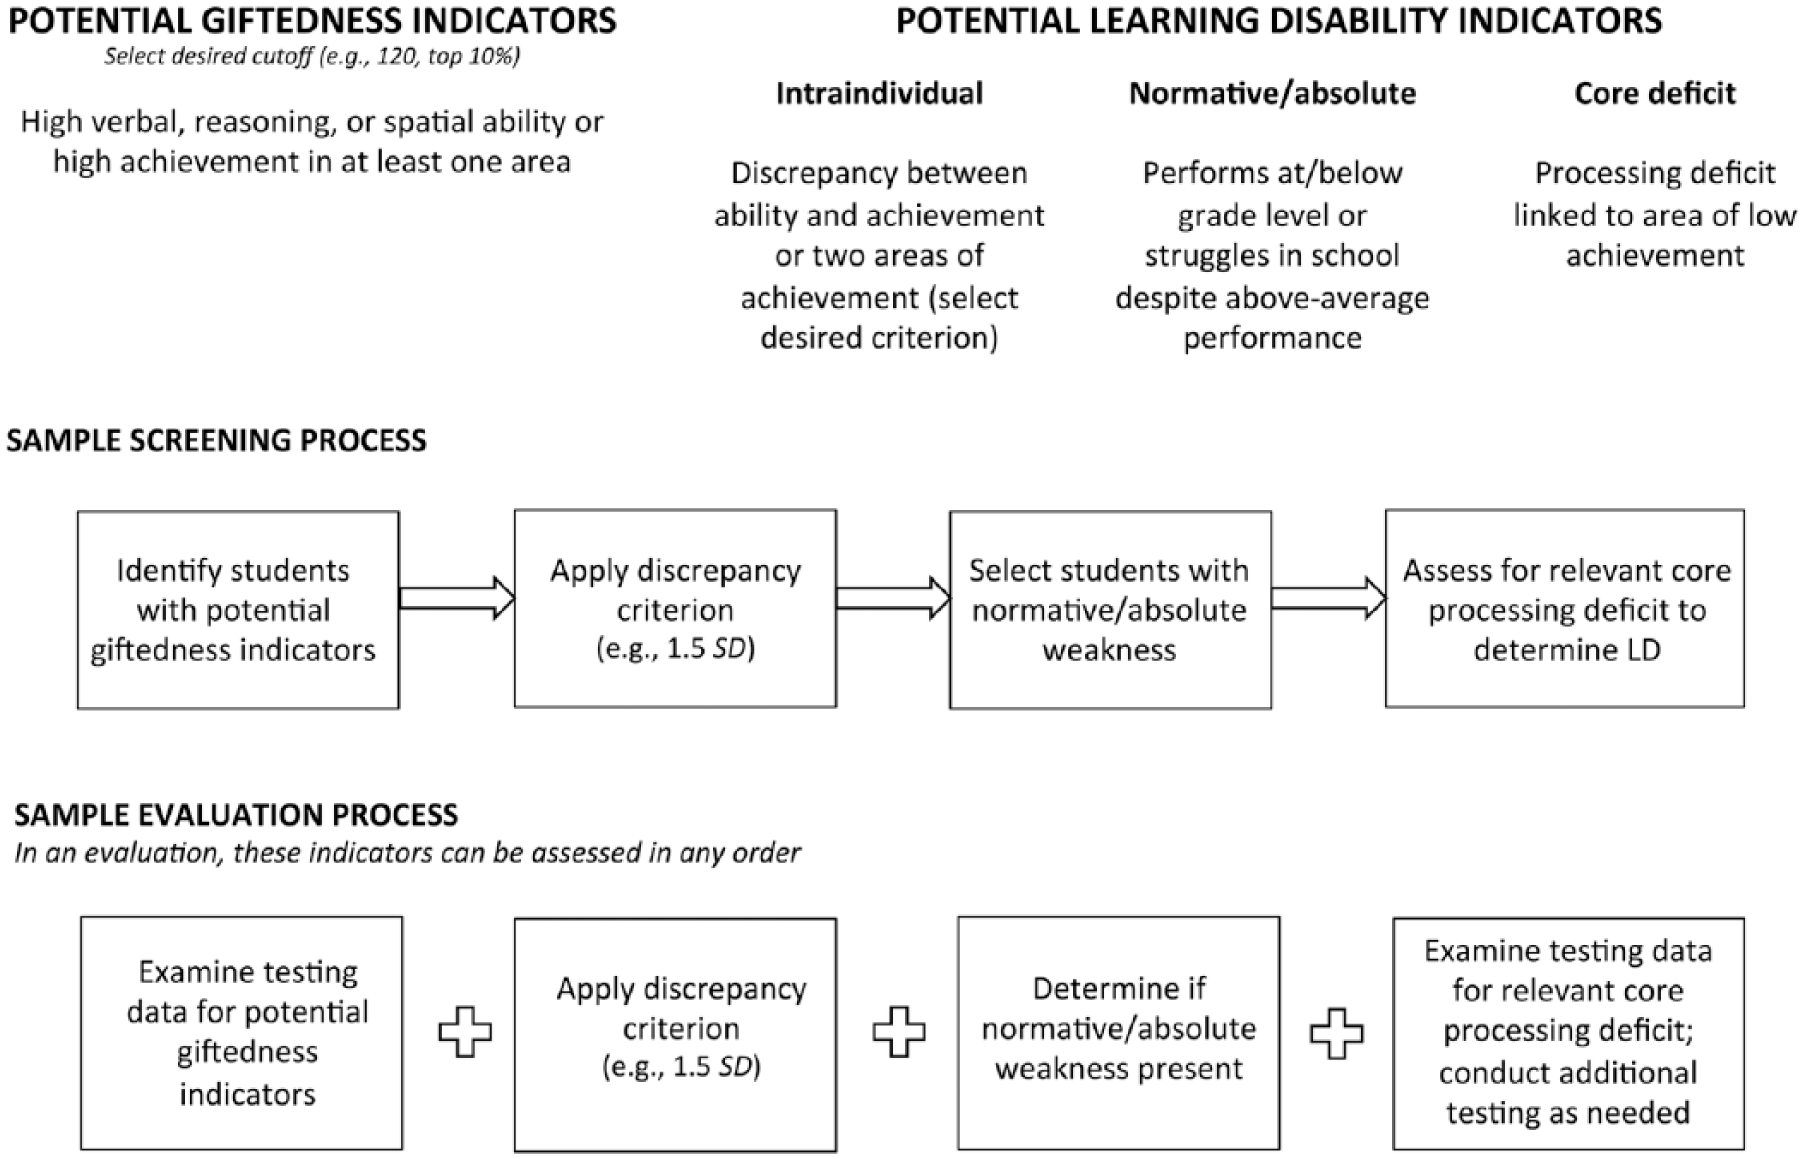
An overview of potential giftedness indicators and potential learning disability indicators to consider in order to improve identification of students who are gifted and have a learning disability (GLD) within the context of school-based screening or individual psychoeducational evaluations. Further research is needed to evaluate the feasibility and performance of the sample screening approach suggested here.
After screening, students who exhibit characteristics of potential giftedness and potential LD status could then receive a full psychoeducational evaluation (Foley Nicpon et al., 2011; Gilman et al., 2013) that would help determine eligibility or diagnosis and, if appropriate, inform an individualized education plan that targets the students’ gifts and disabilities (Assouline et al., 2010). A comprehensive evaluation would examine whether each student exhibits core processing deficits that are empirically linked to the student’s area of academic difficulty. Such practices would align with current best practices in LD diagnosis (e.g., Flanagan et al., 2013; Hale et al., 2010), reduce overidentification of GLD status during screening, and increase access to comprehensive evaluations for students who may be GLD. These same principles could be applied when interpreting individual test data within the context of an evaluation even if a school does not implement a broader screening process.
To address the limitations of the intraindividual approach in research, a simple adaptation would be to use a larger and less common intraindividual discrepancy to signal a significant difference—such as 2, 2.5, or 3 SD or SEe—that might identify gifted students with uncommon impairment. Research would be needed to determine the magnitude of score discrepancy that is uncommon for this population. Researchers could also combine intraindividual and absolute performance criteria as suggested above for schools. Many GLD researchers have already used this combination of criteria, either explicitly or implicitly. For example, most previous studies of GLD youth included participants who also met one of the additional criteria suggested above, according to the results of a synthesis of research on GLD students (Lovett & Sparks, 2013). Many previous studies of GLD youth drew samples from groups of students who were already identified as learning disabled, who had been referred for psychoeducational evaluations, or who had otherwise been noted to have difficulty in school.
Limitations and Future Research
A primary limitation of this research is that the conclusions are based on a single data set and may not be generalizable to other measures of intelligence and achievement. The WJ III is designed for individualized psychological assessment. In schools, it may be more feasible to screen for GLD status with group-administered cognitive tests or measures that are already integrated into regular practices, such as state standardized tests or curriculum-based measures used in RTI monitoring practices (see McCallum et al., 2013 for an example). Additionally, the data used for this study are based on national norms, and school districts may prefer to use local norms in their identification practices. A fourth edition of the WJ (WJ IV) was released in 2014 and was revised to reflect refinements in CHC theory since the release of the WJ III, although the WJ IV includes all the composite scores used in this study and many of the subtests remained the same or had minor revisions. Despite these limitations, the current study’s analyses still provide a useful empirical test of the overall performance of the alternative gifted criteria and various LD criteria within a large representative sample of children and adolescents.
The standardization sample used in this study also has benefits. The sample is nationally representative, which improves the generalizability of the results. The detailed cognitive and achievement information in the data set made it possible to identify students as potentially gifted or GLD with the use of standardized criteria, which may not be possible when researchers must rely on recruiting children who have been labeled gifted or GLD based on varied identification practices from diverse schools or private assessments. The detailed assessment information in the data set also allowed for a more thorough investigation of the cognitive abilities and academic performance of youth identified as potentially GLD than would be possible with other assessments.
The results and limitations of this study suggest several areas for future research. First, future research is needed to test the utility and validity of the GLD screening and identification framework proposed above for schools and researchers and to determine whether the intraindividual discrepancies in this research show similar flaws when applied to other forms of assessment or to different subpopulations. Future research should also evaluate the best way to use the scores of the WJ IV and WISC-V for GLD identification. For example, best practices in LD identification require that students’ academic weaknesses are empirically linked to their cognitive deficits, but most research on ability-achievement relations has been conducted with nationally representative samples. It is not known whether the WJ IV and WISC-V cognitive and achievement scores of gifted and GLD students show the same relations as those found in the overall population.
Second, more research is needed to clarify what role spatial ability should play in gifted identification, particularly within the context of comprehensive psychoeducational assessments. In this study, students who were classified as potentially gifted based on high visual-spatial thinking skills had poorer academic performance than students who met other gifted criteria. This result aligns with extensive research informed by CHC theory that has consistently shown that visual-spatial ability, as measured by modern cognitive tests, is largely unrelated to performance on standardized academic batteries (Flanagan et al., 2013; McGrew & Wendling, 2010). In contrast, longitudinal research from a talent-development framework has shown that spatial reasoning ability predicts success in STEM (Science,Technology, Engineering, and Math) fields, over and above the influence of students’ math ability, verbal ability, and interest in science and mathematics (Lubinski & Benbow, 2006; Wai, Lubinski, & Benbow, 2009; Webb, Lubinski, & Benbow, 2007). The measures used in talent development research may be more predictive because they focus on spatial and mechanical reasoning (Wai et al., 2009), while visual-spatial thinking tasks on the WJ III measure simpler skills, such as visual memory and visualization, the ability to apprehend visual shapes (Schrank et al., 2001). Additionally, the achievement batteries used in most ability-achievement research focus on reading, math, and writing and may fail to identify some students’ academic potential, particularly for STEM-relevant skills (Webb et al., 2007). More research is needed to reconcile the discrepancies between CHC-based research and the talent development literature and to improve the use of visual-spatial abilities in gifted and talented identification.
Conclusion
Unfortunately, none of the intraindividual discrepancy criteria evaluated in this study appear appropriate for GLD screening or identification when used as stand-alone criteria. Instead, the results suggest it may be more valid and useful to combine an intraindividual LD framework with absolute performance criteria and a functional model of LD in school-based RTI practices, psychoeducational assessments, and research contexts. Overall, the results of this study and the suggestions for improved practice highlight the need to conceptualize assessment as an integrated and individual-focused process that examines students’ diverse strengths and weaknesses simultaneously (Gilman et al., 2013), in comparison with procedures and models that imply giftedness and LD status are mutually exclusive (Gilger & Hynd, 2008) and which may therefore fail to identify potential giftedness in students with learning disabilities and vice versa (see Barnard-Brak, Johnsen, Hannig, & Wei, 2015; Nielsen, 2002).
Footnotes
Acknowledgements
The author wishes to thank the Woodcock-Muñoz Foundation for the use of the Woodcock-Johnson III standardization data.
Declaration of Conflicting Interests
The author(s) declared no potential conflicts of interest with respect to the research, authorship, and/or publication of this article.
Funding
The author(s) received no financial support for the research, authorship, and/or publication of this article.