




Abstract
The nonverbal battery of the Cognitive Abilities Test (CogAT) is one of the two most common nonverbal measures used in gifted identification, yet the relationships between demographic variables and CogAT7 performance has not yet been fully examined. Additionally, the effect of using the CogAT7 nonverbal battery on the identification of diverse demographic groups based on various norming, cutoff, and modifier plans has only just begun to be explored. In this study, we analyzed the CogAT7 nonverbal battery scores of kindergartners from a very large urban school district with a high minority, low socioeconomic status, and high English language learner population to determine the relationships between demographic variables and CogAT performance. The results suggest relationships between CogAT scores and multiple demographic variables, similar to other nonverbal instruments. We also examined the effects of various norming practices, including school-level and group-specific norming, on identification using the CogAT7 nonverbal battery.
Keywords
The underidentification of students for gifted and talented programs remains an ongoing issue in the gifted and talented field of research (Giessman, Gambrell, & Stebbins, 2013). Underrepresentation continues to occur among many demographic groups, including ethnic minorities, females, students with physical or learning disabilities, and students living in poverty (Kitano, 1990; St. Jean, 1996; Stormont, Stebbins, & Holliday, 2001; Worrell, 2015; Yoon & Gentry, 2009). Two possible major contributors to the identification gap between demographic groups are which tests are selected and how those tests are used in the gifted identification process.
Test selection can play a large role in determining who is and who is not identified (Tyler-Wood & Carri, 1991), as students from underrepresented groups tend to score lower on ability, achievement, and other cognitively based tests than their overrepresented peers (Plucker, Hardesty, & Burroughs, 2013). Peters and Engerrand (2016) found that, across various assessments, underrepresented minority students along with English language learner (ELL) students and those from low-income families all received lower observed scores than their majority peers. Although it is often warned against, in many cases an ability test is the only method used for identifying children (Callahan, Moon, & Oh, 2013; Carman, 2013). Since these assessments are the most common type used in identification (Callahan et al., 2013), it is unsurprising that districts still observe large demographic differences in identification.
In 1967, the International Association for the Evaluation of Educational Achievement recognized in order to be able to validly compare student achievement across nations there must be a way to take into account a student’s opportunity to learn the materials being tested. In the words of the President of the International Association for the Evaluation of Educational Achievement, One of the factors which may influence scores on an achievement examination is whether or not the students have had an opportunity to learn how to study a particular topic or learn to solve a particular type of problem presented by the test. (Husén, 1967, p. 162-163)
As Floden (2002) states, “The implication suggested is that if a student had not had the opportunity to learn material, testing the student on the material would be inappropriate . . .” (p. 237). The reasoning behind measuring opportunity to learn (OTL) would be to prevent the interpretation of lower test scores (due in part to low OTL) as indicating a lack of ability in the student (Floden, 2002).
Carroll (1963) originally conceptualized OTL simply as “the time allowed for learning,” but as our field’s understanding of OTL has expanded to include other factors that can have effects on students’ opportunity to learn beyond only a time measurement, the definition of OTL has expanded to include the degree to which students have had opportunities to actually encounter the needed content both inside and outside of school. Although much of the original discussions of OTL focused on its measurement in the classroom setting, researchers are now including the effects of students’ opportunities outside of the formal education system. The TIMSS (Trends in International Mathematics and Science Study) includes several questions in order to measure students’ OTL, one of which asks if the teachers think “students are likely to encounter this topic outside of school this year” (Floden, 2002, p. 242).
Differences in OTL which once appeared to be a result of schooling may in fact be more related to out-of-school learning opportunities, which can vary based on factors such as family background (income, parental education levels, social class, race/ethnicity, etc.; Floden, 2002). Historically, the systematic inequality of educational opportunity has not been limited to family income, but has also included differential opportunities based on race/ethnicity, language spoken, gender, and other variables. “The immediate evidence and external evidence agree in attributing more variation in student achievement to the family background than to school factors. The reason is not far to seek. It is that parents vary much more than schools” (Peaker, 1975, p. 22).
Opportunity to learn has been used in research since the early 1960s to account for that potential discrepancy in student scores caused by lack of opportunity (McDonnell, 1995). Floden (2002) has seen positive relationships between OTL and student achievement in over 30 years of international research and suggests that “OTL can be a powerful explanatory variable when looking at particular, fairly narrow comparisons” (p. 259). Peters and Engerrand (2016) suggest that differences in OTL are likely to be one of the primary explanations for the underrepresentation of certain demographic groups in gifted identification. When exploring apparent differences in achievement/ability scores between demographic groups, an exploration of the effects of opportunities to learn would be appropriate.
In an effort to address this underrepresentation in increasingly diverse public schools, figural reasoning and other types of nonverbal tests have become increasingly popular for gifted identification (Lohman & Gambrell, 2012). Although these instruments do not directly address students’ opportunity to learn, some researchers expect the use of such “culturally fair” instruments will ensure a more equitable selection of students from underrepresented groups (Naglieri & Ford, 2003) although research does not consistently support this expectation (Carman & Taylor, 2010; Giessman et al., 2013). The National Association for Gifted Children (NAGC) calls for the use of nonverbal tests (Standard 2.3.1) as part of their standards for student identification to ensure each student is assessed with “non-biased and equitable approaches” (NAGC, 2010, p. 2). The use of nonverbal and other tests advertised as particularly good for use with diverse populations appears to meet the needs of those, suggesting districts solve the identification gap through “using different tests” (Peters, Matthews, McBee, & McCoach, 2014).
Another commonly suggested solution for the underrepresentation problem is the use of multiple-step or matrix identification process (Lohman & Lakin, 2007; McBee, Peters, & Miller, 2016; Moon, 2013; NAGC, 2008). Multistep identification differs from matrix identification in several ways, but one is the most pertinent to our topic. In a multistep identification process, students progress through a series of different instruments and evaluations, with each step winnowing down the number of students who pass on to the following step. These processes typically only identify students as gifted who attain high scores on the final step. The use of a multistep process acts in a gatekeeping fashion where students must score highly on each evaluation to proceed. This can result in highly negative effects for student identification through missing students who should have been identified, even in only a two-step model (McBee et al., 2016). In contrast, a matrix identification process also requires multiple forms of evaluation which are all processed simultaneously. There are many models for matrix identification (e.g., Lohman & Lakin, 2007; Lohman & Renzulli, 2007; Moon, 2013), and in some of those models, students earn points based on their scores on each assessment which then combine to earn gifted identification for those students with combined scores above a certain threshold (Moon, 2013). In this way, students who score highly on some assessments but not others can still earn admittance based on their overall score rather than having one weak area halt their chances as would happen in a multistage model. According to NAGC’s (2015) State of the States, of the 33 states that required the use of specific criteria/methods to identify their gifted students, 19 of those states (58%) required a multiple-step or matrix process. Carman and Taylor (2010) explored the effect of using the Naglieri Nonverbal Ability Test (NNAT) as part of a multistep identification procedure and found the test identified children from low socioeconomic status families half as often as other children. It is therefore important to determine not only how the nonverbal test functions on its own but also how it interacts within an identification process to determine student selection (McBee, Peters, & Waterman, 2014).
A third solution, most recently discussed by Peters and Engerrand (2016), suggests districts spend less time searching for perfectly unbiased, culture-free tests and rather use the current tests differently. By using the current tests but applying a different norming group, districts are able to make more accurate comparisons. Researchers in the field encourage the use of local norming in gifted/talented identification as a way to more accurately compare students with others in the same grade within their district, especially when the district’s demographics do not closely reflect the national norming sample (Lohman, 2006; Lohman & Gambrell, 2012; Peters & Engerrand, 2016). As the norming group becomes more local, shifting from comparing students at the national level to comparing those within-district to comparing them within-school, the comparison group grows more and more similar to the students being compared in terms of opportunity to learn. As Peters and Gentry (2012, p. 128) state, “The context and achievement makeup of a given school could very easily be very different from the national normative sample of any given test or instrument.” In the participating district, where the demographics vary widely between schools, the use of increasingly more local norms should result in a more proportionate representation of students in identification. “Even within the same school district, the quality of ‘grade-level’ educational opportunities can vary dramatically” (Peters & Engerrand, 2016, p. 161). School-level norming works well primarily because students with similar family backgrounds (and therefore similar OTL) tend to live in close proximity to one another. As most school districts assign students to neighborhood schools based on where they live, this allows the school-level grouping to serve as a control for some previous lack of OTL.
Other ways to change the norming group to increase comparisons between students with similar OTL is to compare within demographic group (Peters & Engerrand, 2016; Peters & Gentry, 2012). Research has found strong relationships between many demographic variables, especially income (Wyner, Bridgeland, & Diiulio, 2009) and race/ethnicity (Martinez, 2017; Quinn, Cooc, McIntyre, & Gomez, 2016; Stout, Archie, Cross, & Carman, in press), and educational achievement. Comparing students with others within their demographic groups rather than across groups allows for a different accounting for opportunities to learn. The use of group-specific norms is also controversial and their use may result in legal ramifications for districts (Peters & Engerrand, 2016). The use of group-specific norms decreases the influence of OTL because individuals from the same demographic group are more likely to have had similar OTL than those across different demographic groups (Lohman & Lakin, 2007; Peters & Engerrand, 2016). Peters and Gentry (2012) found the use of group-specific norms based on income to increase representation of low-income students regardless of cut-score applied.
There are many examples of districts that use matrix-type identification systems and include some additional consideration for students who are traditionally underrepresented (e.g., Bui, Craig, & Imberman, 2014; Edina Public Schools, 2015; Hampton City Schools, 2014). Whether they call this “advocacy,” “obstacles,” “special consideration,” or use some other euphemistic terminology, these districts are adding points to their matrix-derived scores to account for students from certain demographics with less opportunity to learn. Oftentimes, the amount of these added points are not based on statistical analysis but are rather arbitrary, based on what “looked appropriate,” as related by a local gifted specialist. For districts that wish to continue this practice, it would be more appropriate (and defensible) to calculate modifiers based on their students’ actual performance on the instruments in the identification matrix. Districts could add these OTL modifiers to the students’ matrix-derived scores as an alternative way to account for different demographic groups’ opportunity to learn. The authors were unable to find any literature on the effects of the use of these score modifiers in gifted identification.
Two of the most commonly used nonverbal measures (in various versions) are the NNAT and the Cognitive Abilities Test (CogAT) nonverbal battery (Lohman, Korb, & Lakin, 2008). There have been many articles reviewing the qualities of the NNAT and NNAT2 (e.g., Carman & Taylor, 2010; Giessman et al., 2013; Lohman, 2005; Lohman et al., 2008) but fewer examining the CogAT7 (Warne, 2015). Both Naglieri and Ford (2003) and Carman and Taylor (2010) suggested researchers review the CogAT in a similar fashion to the NNAT. Both the NNAT and CogAT have also undergone revisions since they were last studied, so a new exploration of their qualities may be in order. The CogAT7 publishers also advertise an option that the NNAT does not provide, a local percentile rank (LPR). The use of LPR allows for districts to compare students with other students within the same district, students who have most likely had similar exposure to educational opportunities, rather than using a national norming sample whose members may have had different opportunities (Lohman & Foley Nicpon, 2012).
The overall purpose of this study is to examine the relationships between student demographic variables such as free/reduced-price lunch status, ethnicity, gender, ELL status, special education (SPED) status, and CogAT7 nonverbal battery performance standard age scores (SAS) and the effects those relationships may have in the identification process of the participating district. Our first question is: Are there relationships between selected demographic variables and CogAT7 nonverbal battery performance? Our second question is: Are there differences in the percentage of students belonging to different demographic groups who are identified as gifted via different norming, cutoff, and modifier plans with the CogAT7 nonverbal battery?
Method
Participants
Participants were 15,724 kindergarten students from a southern, urban public school district who were administered the CogAT7 nonverbal battery as part of state-mandated universal screening for giftedness. Participants were located at 173 elementary schools across the district. Even within the same district, these campuses vary greatly in demographic makeup; from schools with less than 2% economically disadvantaged students to schools with almost 100% economically disadvantaged students, schools with no English language learners to over 80% ELL. To explore the relationships between demographics and identification at the school level, we collected four school-level variables: percentage of students eligible for free/reduced price lunch (%FRPL), percentage of students classified as English language learners (%ELL), percentage of students who identify as non-White (%Minority), and percentage of students who meet or exceed the satisfactory standard score on the state standardized test (%STAAR). Ranges, means, and standard deviations for the school-level variables can be found in Table 1.
Descriptive Statistics for School-Level Variables (n = 173).

Note. ELL = English language learners; FRPL = free/reduced price lunch; STAAR = state standardized test.
As the participating district had previous experience with the NNAT, they elected to use only the nonverbal battery of the CogAT7 (as opposed to the full CogAT7 battery) in their weighted identification matrix in the hopes that the results would identify demographic groups at more proportional rates. Students ranged in age from 4.90 to 7.75 years of age (
Measures
Cognitive Abilities Test
The CogAT7 (Lohman, 2011a) is a group-administered, multibattery test across the three domains of Verbal, Quantitative, and Nonverbal ability for children in grades K-12. The nonverbal battery was the only section of the CogAT7 administered by the participating district as part of their multitest screening process. The CogAT7 is a “culture reduced” test that was designed to “substantially reduce but does not eliminate group differences” (Lohman, n.d). The nonverbal battery contains three subtests, Figure Matrices, Figure Classification, and Paper Folding, for a total of 38 items at the 5/6 (kindergarten) level (Lohman, 2012). The CogAT produces multiple score types, including SAS with a mean of 100 and a standard deviation of 16 and LPR. As the participating district’s demographics are markedly different from the CogAT7 norming sample across multiple demographic variables (ethnicity, ELL status, FRPL; Lohman & Gambrell, 2012), the district opted to receive LPR as well as SAS in their report. Split-half reliabilities for the CogAT7 are reported as .80 to .92 across the three batteries, with the lowest reliabilities reported for the kindergarten-level students (Warne, 2015). Although the researchers would have liked to have calculated the CogAT7 reliability for this study’s data, the level of data required to perform such an analysis was not available. Validity data in the form of concurrent validity studies and confirmatory factor analysis provide support for the use of the CogAT7 for gifted identification (Warne, 2015).
Design and Procedure
Once we obtained IRB approval from the stakeholders, we retrieved archival information on participants’ ethnicity, gender, FRPL status, ELL status, and SPED status from the district’s database. We also collected nonverbal battery CogAT7 SAS and LPR from the database for each participant. Participants’ school campus assignment was also collected. We used school assignment to collect information on the four school level variables (% FRPL, %ELL, %Minority, and %meeting state assessment standards) from the publicly available state educational records database (Texas Education Agency, 2015).
For the purposes of the quantitative data analysis, we dummy coded several of the demographic variables. For gender, we coded males as “0” and females as “1.” We coded ethnicity into multiple variables with the group of interest coded as “1” and the other groups coded as “0.” For FRPL status, we coded students receiving FRPL as “1” while non-FRPL students were coded as “0.” We coded students who were English language learners as “1” while those with standard English proficiency were coded as “0.” Finally, we coded students who had been diagnosed as needing special education services as “1” while those not requiring services were coded as “0.”
Data Analysis
To examine the relationships among student demographic variables and CogAT7 nonverbal battery performance we first ran a correlation matrix to examine the relationship between each demographic variable and CogAT7 nonverbal battery performance. Due to correlations among demographic variables, we conducted a multiway analysis of variance (ANOVA) to check for statistically significant interactions between the demographic variables before continuing with several multiple regressions to examine the relationship between each demographic variable and CogAT7 nonverbal battery performance while controlling for the effects of the demographic variables on each other. We used a two-step process, entering the other demographic variables into the regression in the first model and then adding the demographic variable of interest in the second model for each demographic variable. This allowed us to examine the relationship between the demographic variable of interest while controlling for the effects of the other demographic variables. Following the regressions, we used multiple hierarchical linear models (HLM) analyses to explore the effects of the use of school-level demographics. We conducted analyses of the data using two-level HLM in Mplus 7.4 (Muthén & Muthén, 2012; Raudenbush, Bryk, Cheong, Congdon, & du Toit, 2004). HLM was the appropriate method of analysis due to the students being nested within schools, which may result in some nonindependence of participants’ scores on the CogAT (McCoach & Adelson, 2010). We used full information maximum likelihood. First, we examined an unconditional HLM model to confirm variability in CogAT7 nonverbal battery score due to school. Then, we estimated a Level-1 model to assess the associations between student demographics (gender, other ethnic status, Asian ethnic status, Black ethnic status, Hispanic ethnic status, FRPL status, English language learner status, and special education status) and the outcome variable. We dummy coded all Level-1 predictors in the analyses. Finally, we estimated a Level-2 model to assess the associations between school demographic characteristics (percentage of students meeting or exceeding state assessment standards, percentage of racial/ethnic minority students, percentage of students who were English language learners, and percentage of FRPL students) and the outcome variable in addition to student demographics. All Level-2 predictors were grand mean centered. The equation for the Level-2 model was

We then used the CogAT7 results to calculate the different frequencies of those selected under various norming and cutoff plans. Using the unstandardized B weights from the multiple regressions allows for the calculation of OTL modifiers for this district, which then permits the exploration of the effects that using OTL modifier plans would have on identification rates of different student subpopulations in the district. We also explored the effects of various group-specific norming on identification in the district. The exploration of the effects of the various cutoff and norming plans should not be taken as a suggestion that districts should use any of these plans but rather as a quantitative exploration of their effects. Some of the norming and cutoff plans explored here may not be legal under current federal, state, or local laws/regulations. Their exploration in this article is not intended as an endorsement of the methods. After finding the frequencies of identified students across groups, we used chi-square goodness-of-fit to compare the observed frequencies to the district population in all categories.
Results
Means and standard deviations on the CogAT SAS for the student demographic variables are found in Table 2. We calculated effect sizes for the difference in raw score mean between groups using Cohen’s d. For ethnicity, we used White as the comparison group. We then examined the point–biserial correlations between FRPL, ethnicity, gender, ELL status, SPED status and CogAT7 nonverbal battery performance (SAS) to determine the strength of the relationships. After correcting for Type I error inflation by using Holm’s sequential Bonferroni method (Holm, 1979) among the 30 comparisons, 23 correlations were determined to be statistically significant. We found significant relationships to exist between all but one of the demographic variables and CogAT7 nonverbal battery performance. The correlation between Hispanic students and SAS was the only correlation that was not statistically significant. A correlation matrix displaying these results can be found in Table 3. Pearson correlations among school level characteristics (%STAAR, %Minority, %ELL, and %FRPL) and average school SAS score were also examined. Percentage of English language learners was not associated with percentage of students meeting academic proficiency, nor was it associated with average SAS score. All other school characteristics were associated with each other and average SAS score in the expected directions. The correlation matrix displaying these results can be found in Table 4.
Means and Standard Deviations for All Students on the CogAT SAS by Gender, Ethnicity, SES, ELL, and SPED.

Note. CogAT = Cognitive Abilities Test; SES = socioeconomic status; SAS = standard age scores; ELL = English language learner; SPED = special education.
Correlations Among Gender, Ethnicity, FRPL, ELL, SPED, and CogAT SAS.
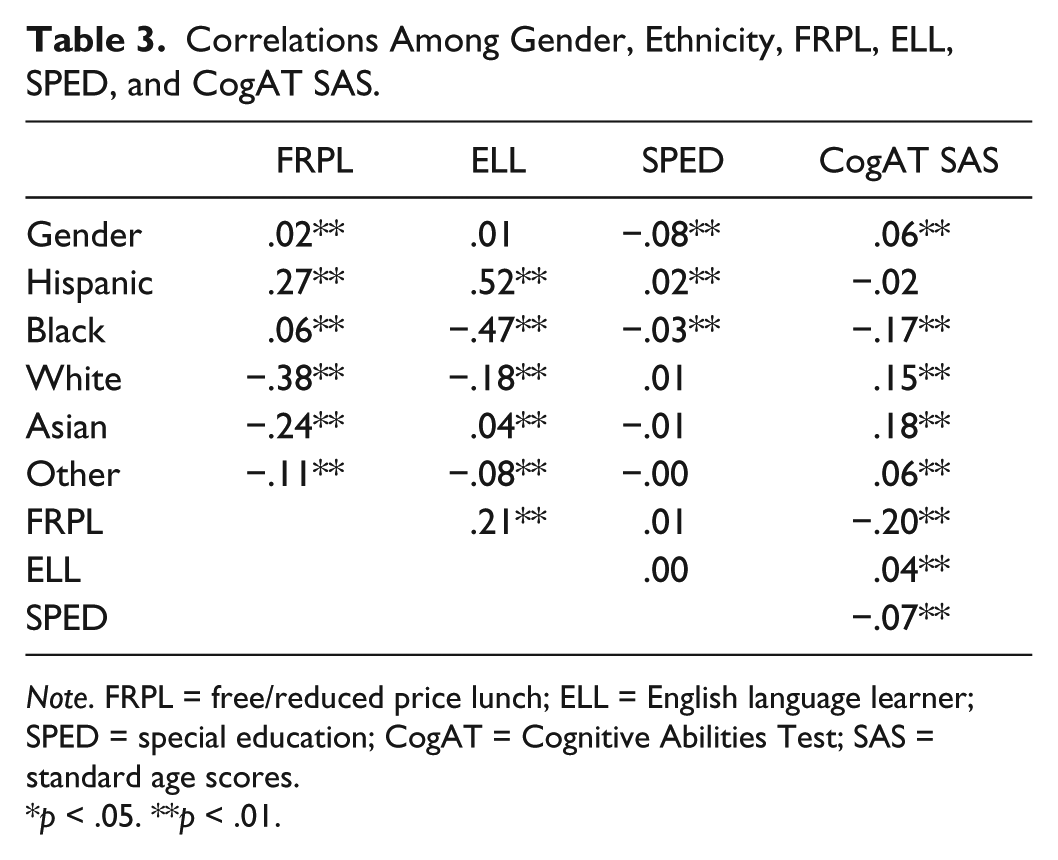
Note. FRPL = free/reduced price lunch; ELL = English language learner; SPED = special education; CogAT = Cognitive Abilities Test; SAS = standard age scores.
p < .05. **p < .01.
Correlations Among School Level Characteristics and Average School CogAT SAS.
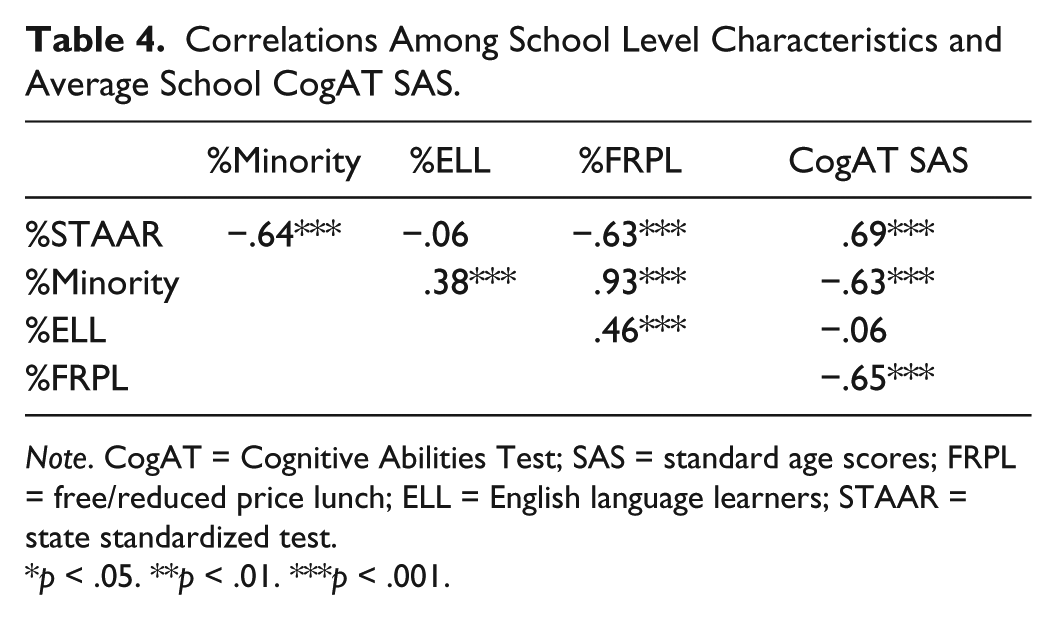
Note. CogAT = Cognitive Abilities Test; SAS = standard age scores; FRPL = free/reduced price lunch; ELL = English language learners; STAAR = state standardized test.
p < .05. **p < .01. ***p < .001.
Due to correlations among the demographic variables, a multiway ANOVA was conducted to examine the interactions between the demographic variables. After applying a Holm’s sequential Bonferroni (Holm, 1979) to correct for inflation of the familywise error rate (FWER) due to the multiplicity in exploratory multiway ANOVA (Cramer et al., 2014) none of the interactions between the demographic variables were found to be significant.
We also conducted several multiple regressions to examine the relationship between each demographic variable and CogAT7 nonverbal battery performance while controlling for the effects of the demographic variables on each other. All the results indicated a statistically significant effect for each demographic variable on CogAT7 nonverbal battery performance while controlling for the other demographic variables with the exception of the relationship between being White and SAS which was not statistically significant. Even though statistical significance was found for each demographic variable, the effect sizes were uniformly small. Table 5 shows the results of these regression analyses in CogAT7 SAS.
Summary of Regression Analyses for Variables Predicting Cognitive Abilities Test 7 Nonverbal Battery Standard Age Scores After Controlling for Other Demographic Variables (N = 15,724).
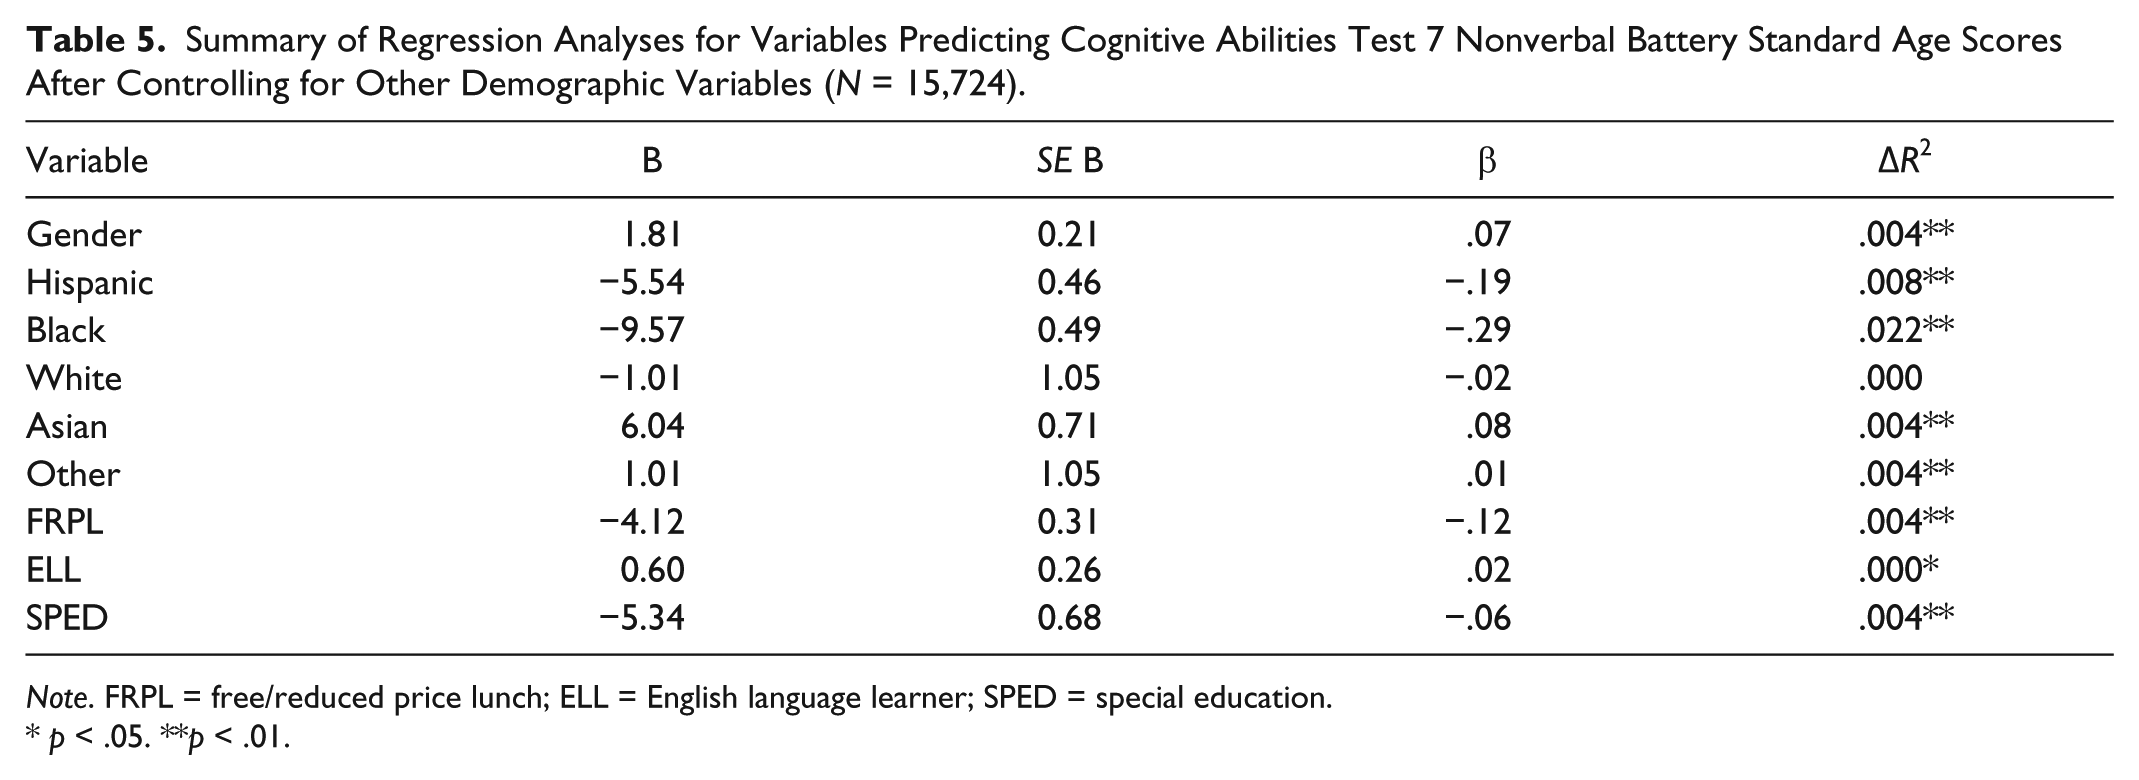
Note. FRPL = free/reduced price lunch; ELL = English language learner; SPED = special education.
p < .05. **p < .01.
Several of the demographic variables were correlated, leading to concern for multicollinearity issues in the regression analyses. However, because tolerances for the analyses (0.749-0.994) were above 0.1 (Menard, 1995) and the variance inflation factors (1.006-1.335) were below 10 (Neter, Wasserman, & Kutner, 1989), multicollinearity should not be an issue.
For the HLM analyses, the unconstrained model confirms that the variability in the outcome variable (CogAT SAS), by Level-2 group (school), was significantly different than zero, χ²(172) = 2355.69, p < .001 (Woltman, Feldstain, MacKay, & Rocchi, 2012). The intraclass correlation coefficient for the CogAT SAS was .12, which suggests 12% of the students’ variance in CogAT SAS occurred at the school level and 88% of the variance occurred within schools. For the Level-1 model, all the Level-1 dummy coded variables were statistically significant (p < .001) in the final estimation of fixed effects except for other ethnic status. In addition, the pseudo R2 for the Level-1 model indicates that 46% of the between school variance in CogAT SAS can be attributed to differences in student characteristics across schools. For the Level-2 model, only the percentage of students meeting or exceeding state assessment standards was associated with CogAT SAS. Specifically, schools with a higher percentage of students meeting state standards had higher CogAT SAS scores. The inclusion of school characteristics increased the amount of variance explained in CogAT SAS between schools to 67%. Results of the HLM analyses can be found in Table 6.
Summary of the Full Information Maximum Likelihood Parameter Estimates for the Two-Level Model of the Cognitive Abilities Test 7 Nonverbal Battery.
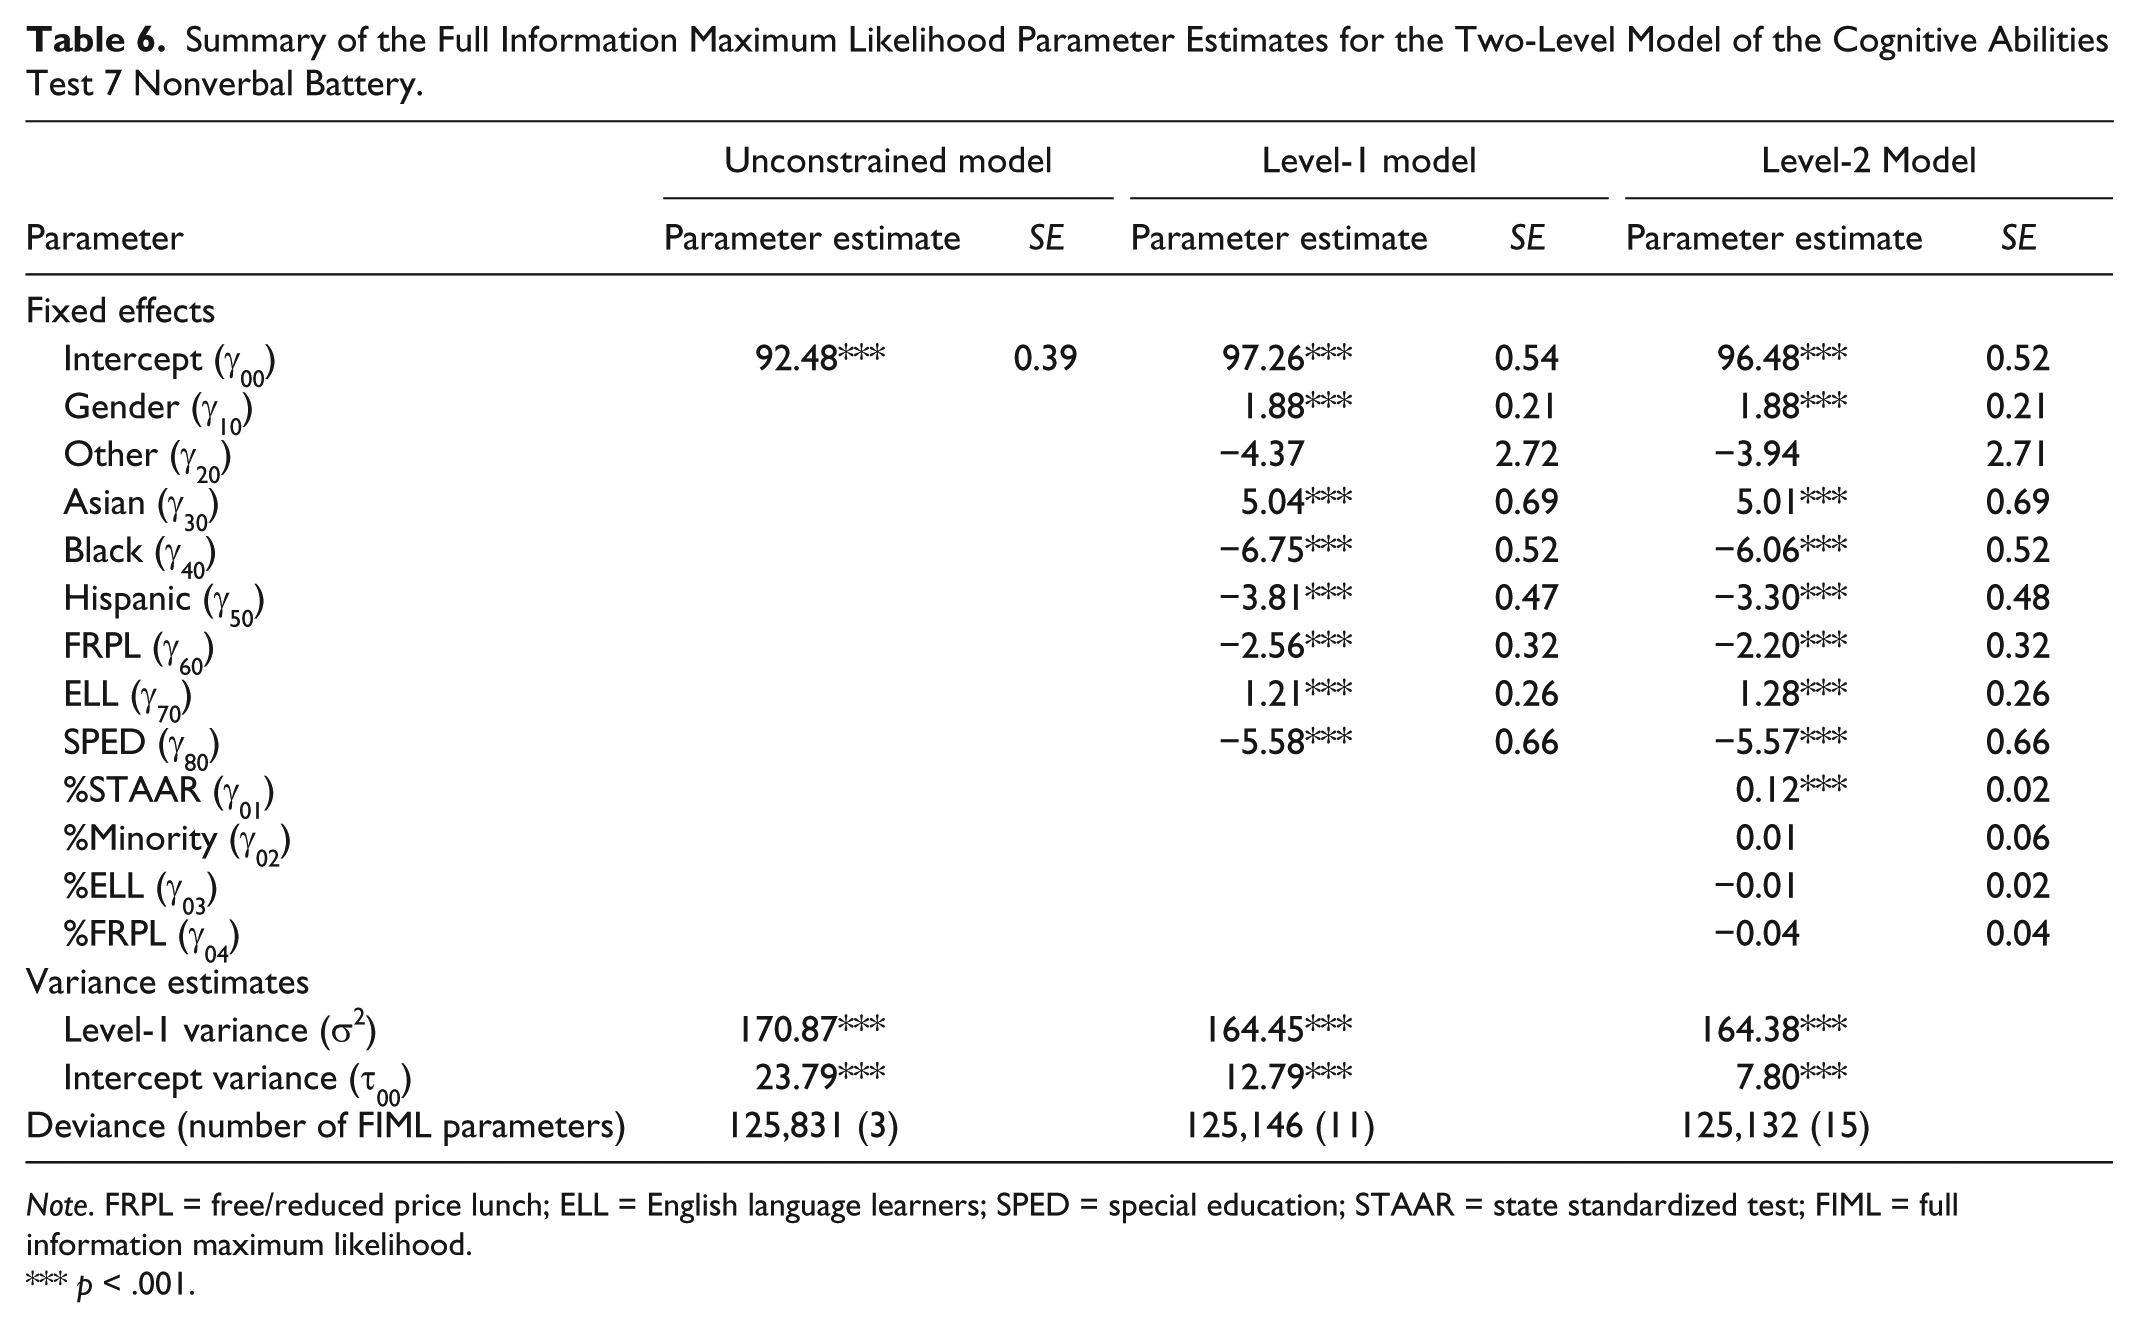
Note. FRPL = free/reduced price lunch; ELL = English language learners; SPED = special education; STAAR = state standardized test; FIML = full information maximum likelihood.
p < .001.
We created and compared multiple plans to explore the effects of CogAT7 nonverbal battery use under differing norming, cutoff, and score modifier conditions. These norming plans, which are potentially illegal in some areas, are drawn from commonly found norming, cutoff, and modifier practices used in gifted identification. We explored several different norming groups: national, district, school, and group-specific norming (Brown, 1994; Peters & Gentry, 2012) were all examined. We also applied cutoffs of either the top 5% or a score of 125 and above to the different norming groups. National-level norming used the SAS scores to generate the two cutoff points. District-level norming used the LPR provided by the CogAT7 publishers to generate the two cutoff points. School-level norming used the top 5% of scores within each school to determine who would be identified so that students were only compared with others in their own school rather than across the district. For this district, school-level top 5% SAS cutoff scores ranged from a low of 101 to a high of 140.
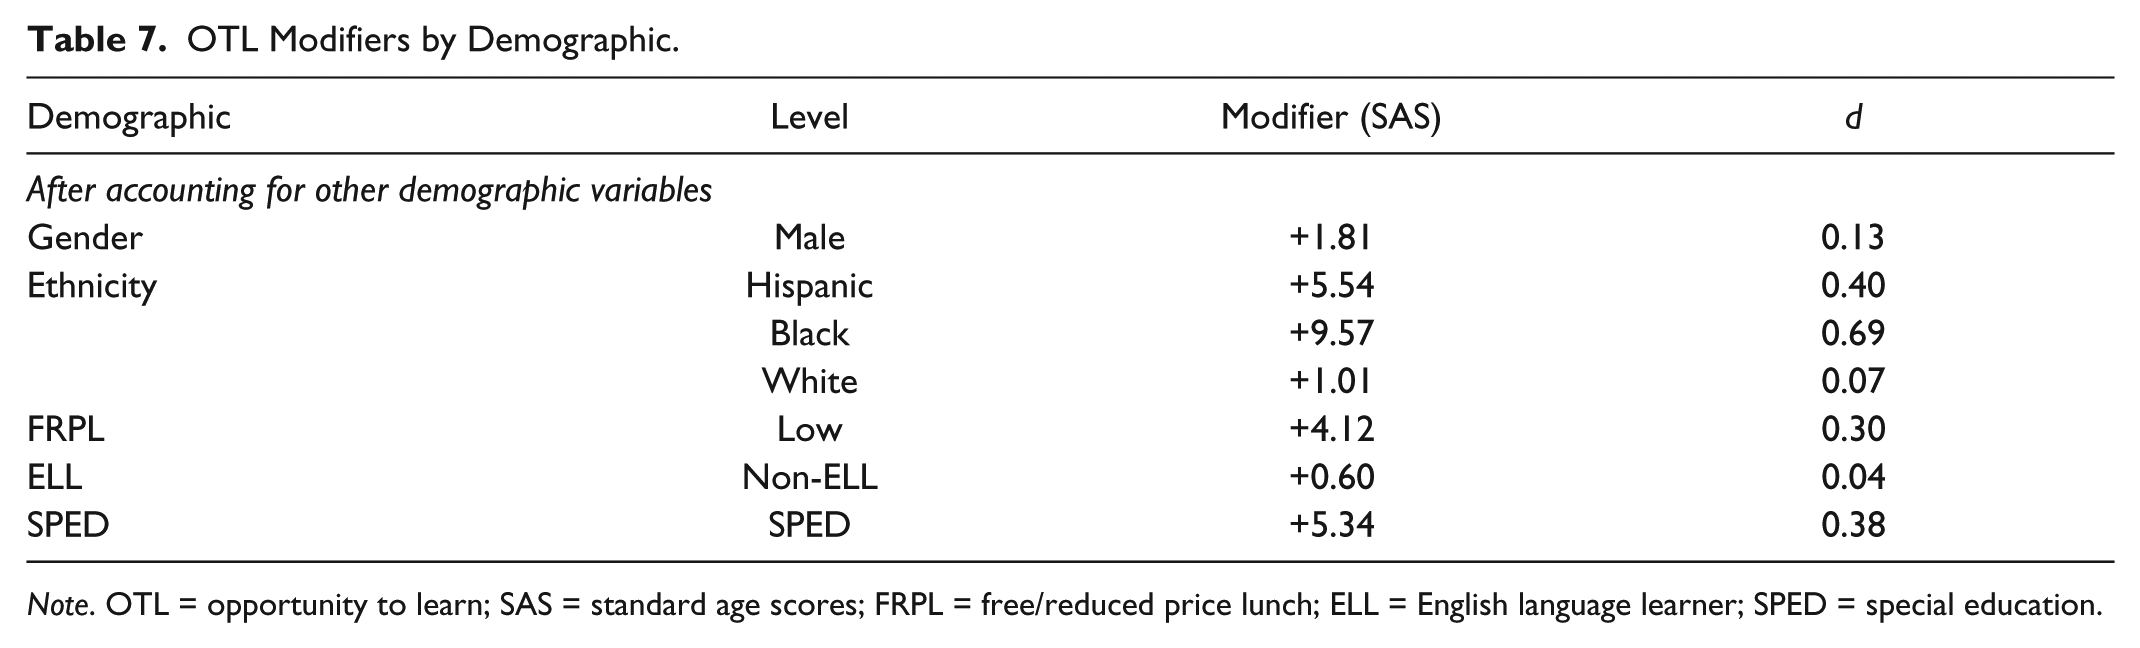
Additionally, as many districts include an additional points modifier for members of certain demographic groups in their identification practices, we calculated opportunity to learn modifier scores for each significant demographic variable. To determine the effects of the CogAT7’s score differential on these students’ selection for further screening, we added an OTL modifier to students’ scores based on the combination of each student’s demographic variables. We based this modifier on the differential calculated for each group by the B weight in the regression (Table 4). Table 7 lists the modifier score added to specific demographic groups to account for OTL. Table 8 shows the various norming, cutoff, and modifier combinations and their effects on identification in this population. After finding the frequencies of identification across various plans, we then used chi-square goodness-of-fit to compare the observed frequencies to the district demographics. After correcting for Type I error inflation by using Holm’s sequential Bonferroni (Holm, 1979), p values were calculated for each comparison, and effect size was measured using Cohen’s w (Cohen, 1977). The results of the chi-square analyses can be found in Table 9. Means and standard deviations for each selected subgroup under the various norming, cutoff, and modifier combinations can be found in Table 10.
OTL Modifiers by Demographic.
Note. OTL = opportunity to learn; SAS = standard age scores; FRPL = free/reduced price lunch; ELL = English language learner; SPED = special education.
Students Identified Under Various Norming, Cutoff, and Modifier Plans.

Note. LPR = local percentile rank; OTL = opportunity to learn; FRPL = free/reduced price lunch; ELL = English language learner; SPED = special education.
Goodness-of-Fit and Effect Size for Differences Between District Demographics and Various Norming, Cutoff, and Modifier Plans.
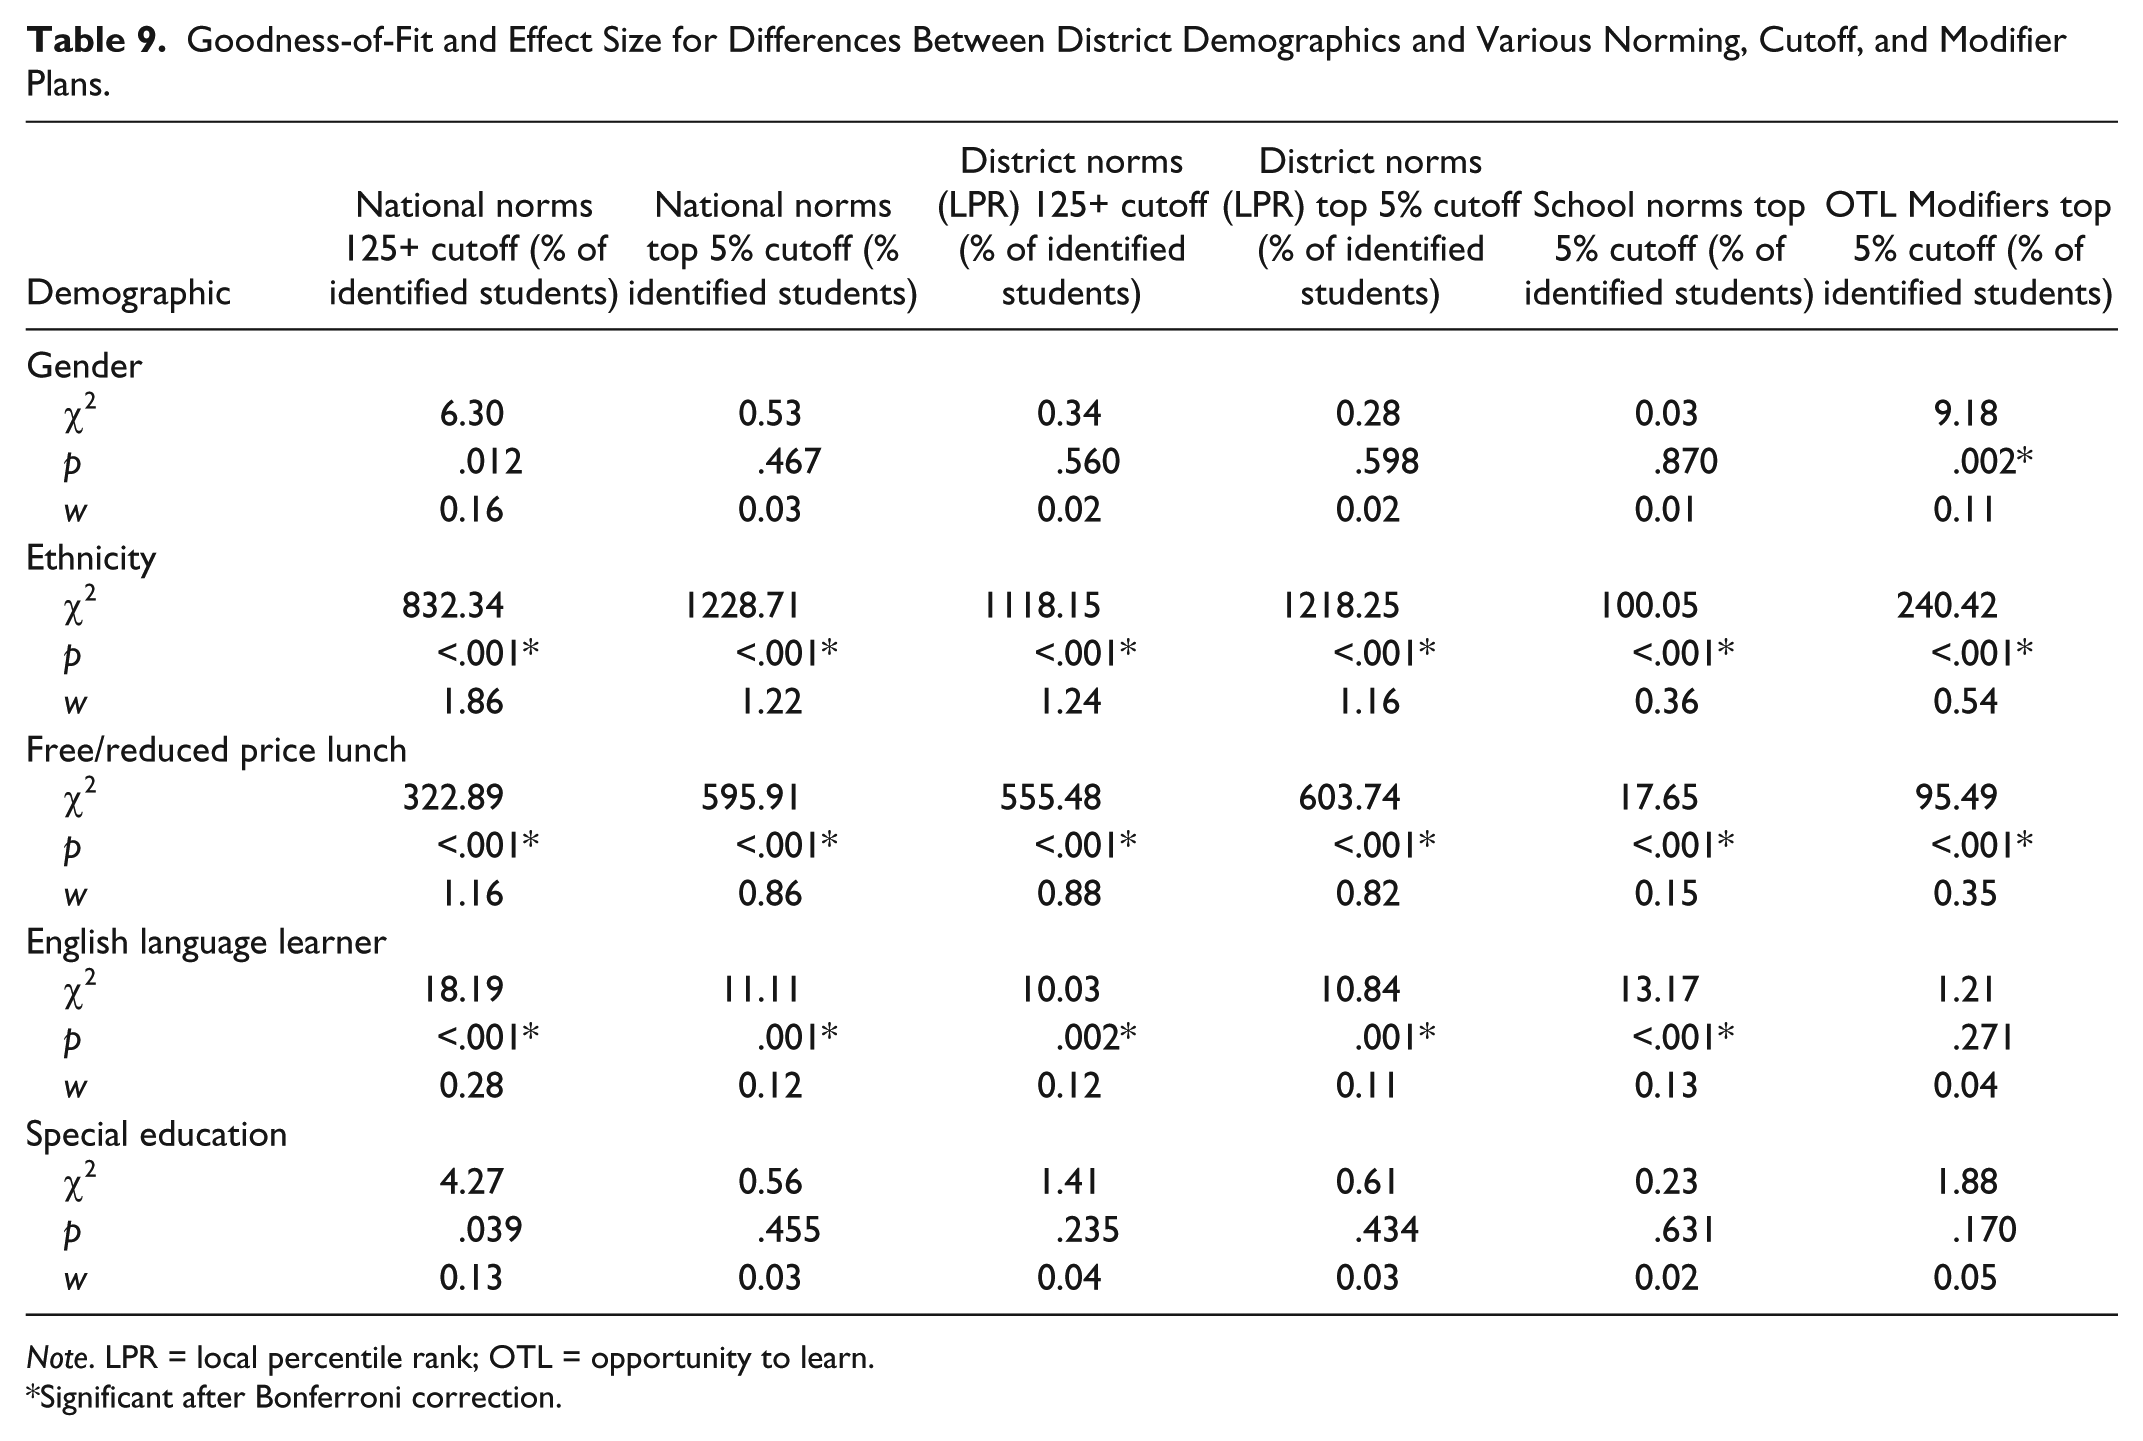
Note. LPR = local percentile rank; OTL = opportunity to learn.
Significant after Bonferroni correction.
CogAT7 Nonverbal Battery Scores (SAS) for Students Identified Under Various Norming, Cutoff, and Modifier Plans by Subgroup.
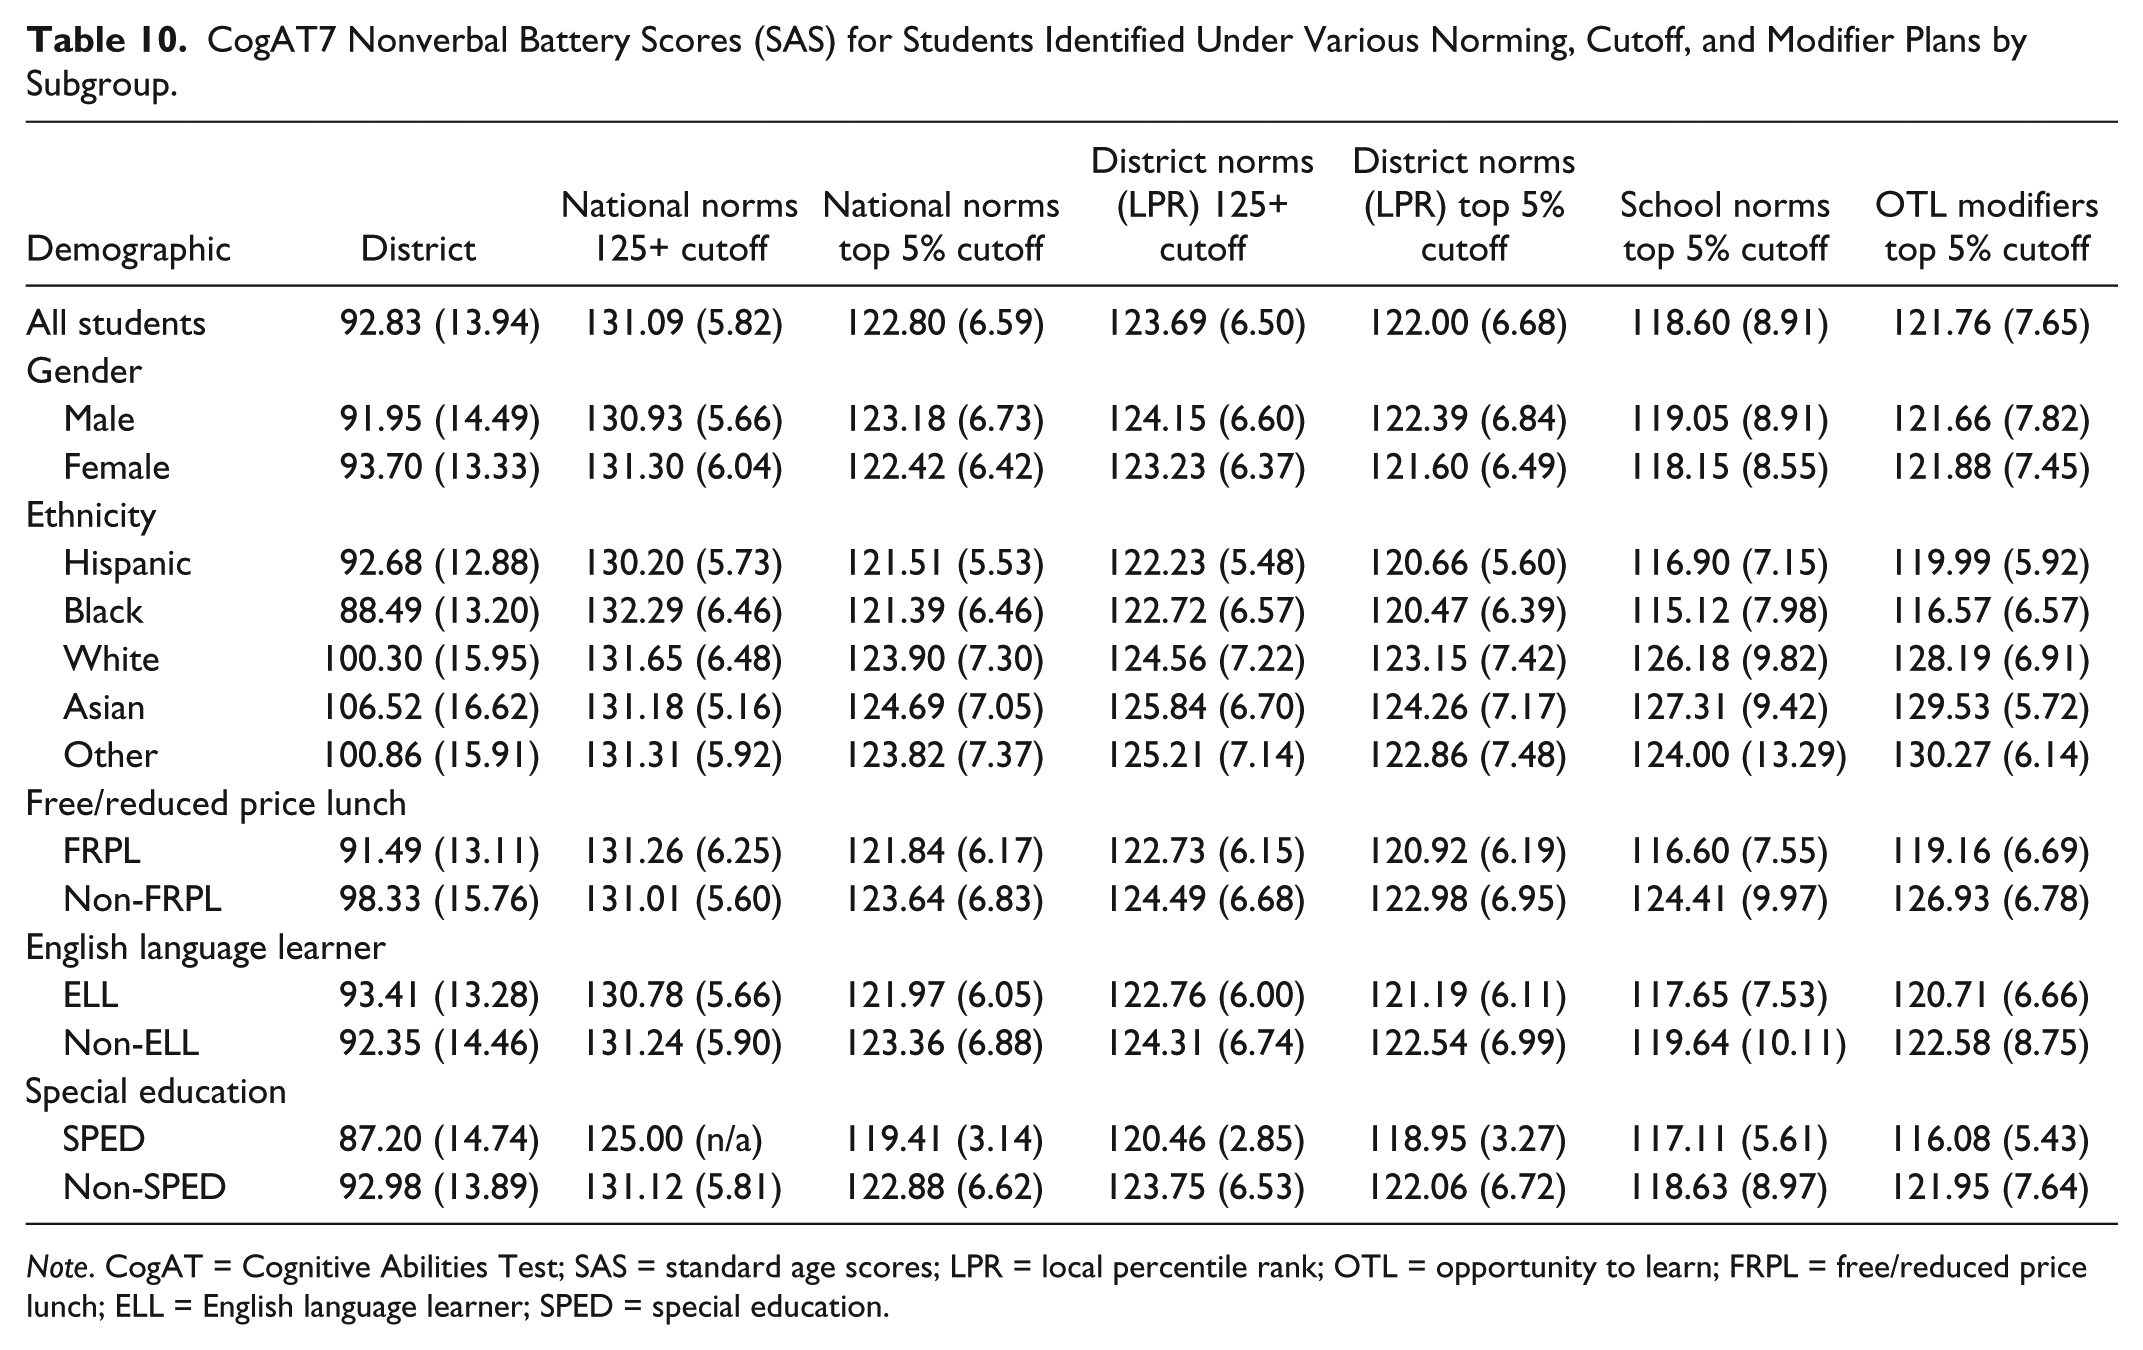
Note. CogAT = Cognitive Abilities Test; SAS = standard age scores; LPR = local percentile rank; OTL = opportunity to learn; FRPL = free/reduced price lunch; ELL = English language learner; SPED = special education.
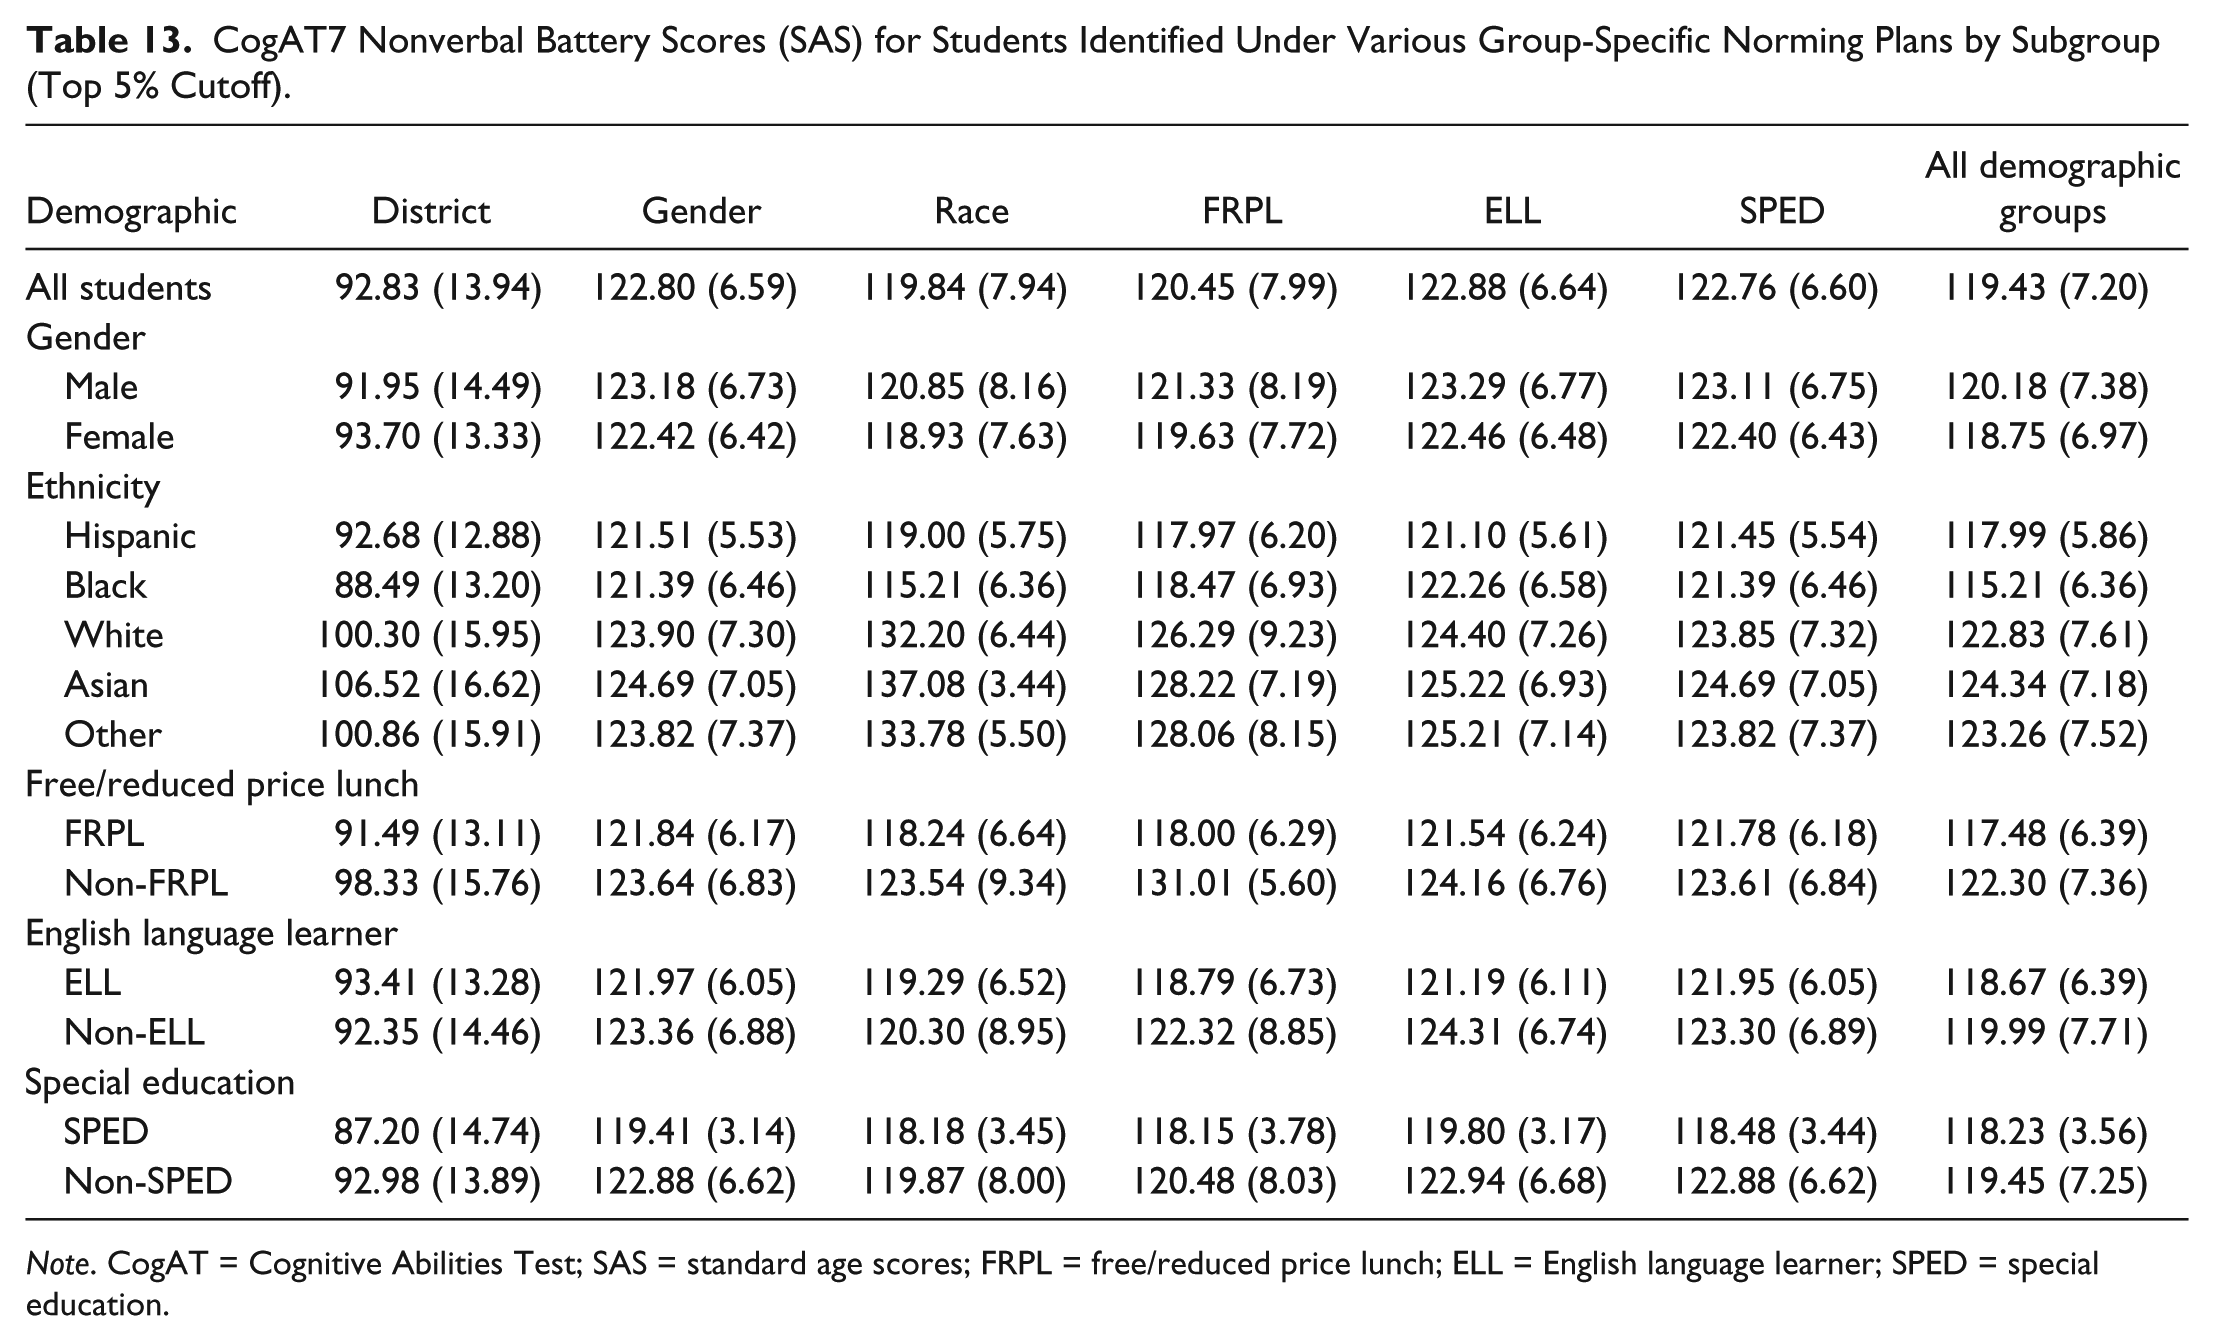
We also explored group-specific norming in multiple ways. Although most published research explores group-level norming through the use of FRPL or another income-based variable as a proxy for OTL (Matthews, 2007; Matthews & Kirsch, 2011; Peters & Gentry, 2012), other subgroups of interest can also be used (Lohman & Lakin, 2007; Peters & Gentry, 2012). Based on historical (and current) systematic inequalities of educational opportunity experienced by students in other subgroups such as special education status or race/ethnicity category, we elected to include those groups in the group-level norming analysis as well. Table 11 displays the effects of subgroup norming using a top 5% cutoff across each of the subgroups formed through the use of the demographic variables. For the ethnicity subgroup, we selected the top 5% of each ethnic/racial group in our study and combined them in that column. Finally, the last column shows the effects of combining all subgroup norms in identification by adding across all the previous subgroup norming selectees. After finding the frequencies of identification across various subgroups, we then used chi-square goodness-of-fit to compare the observed frequencies to the district demographics. After correcting for Type I error inflation by using Holm’s sequential Bonferroni (Holm, 1979), p values were calculated for each comparison, and effect size was measured using Cohen’s w (Cohen, 1977). The results of the chi-square analyses for the group-specific norming plans can be found in Table 12. Means and standard deviations for each selected subgroup under the various subgroup norming combinations can be found in Table 13.
Students Identified Under Various Group-Specific Norming Plans (Top 5% Cutoff).

Note. FRPL = free/reduced price lunch; ELL = English language learner; SPED = special education.
Goodness-of-Fit and Effect Size for Differences Between District Demographics and Various Group-Specific Norming Plans.
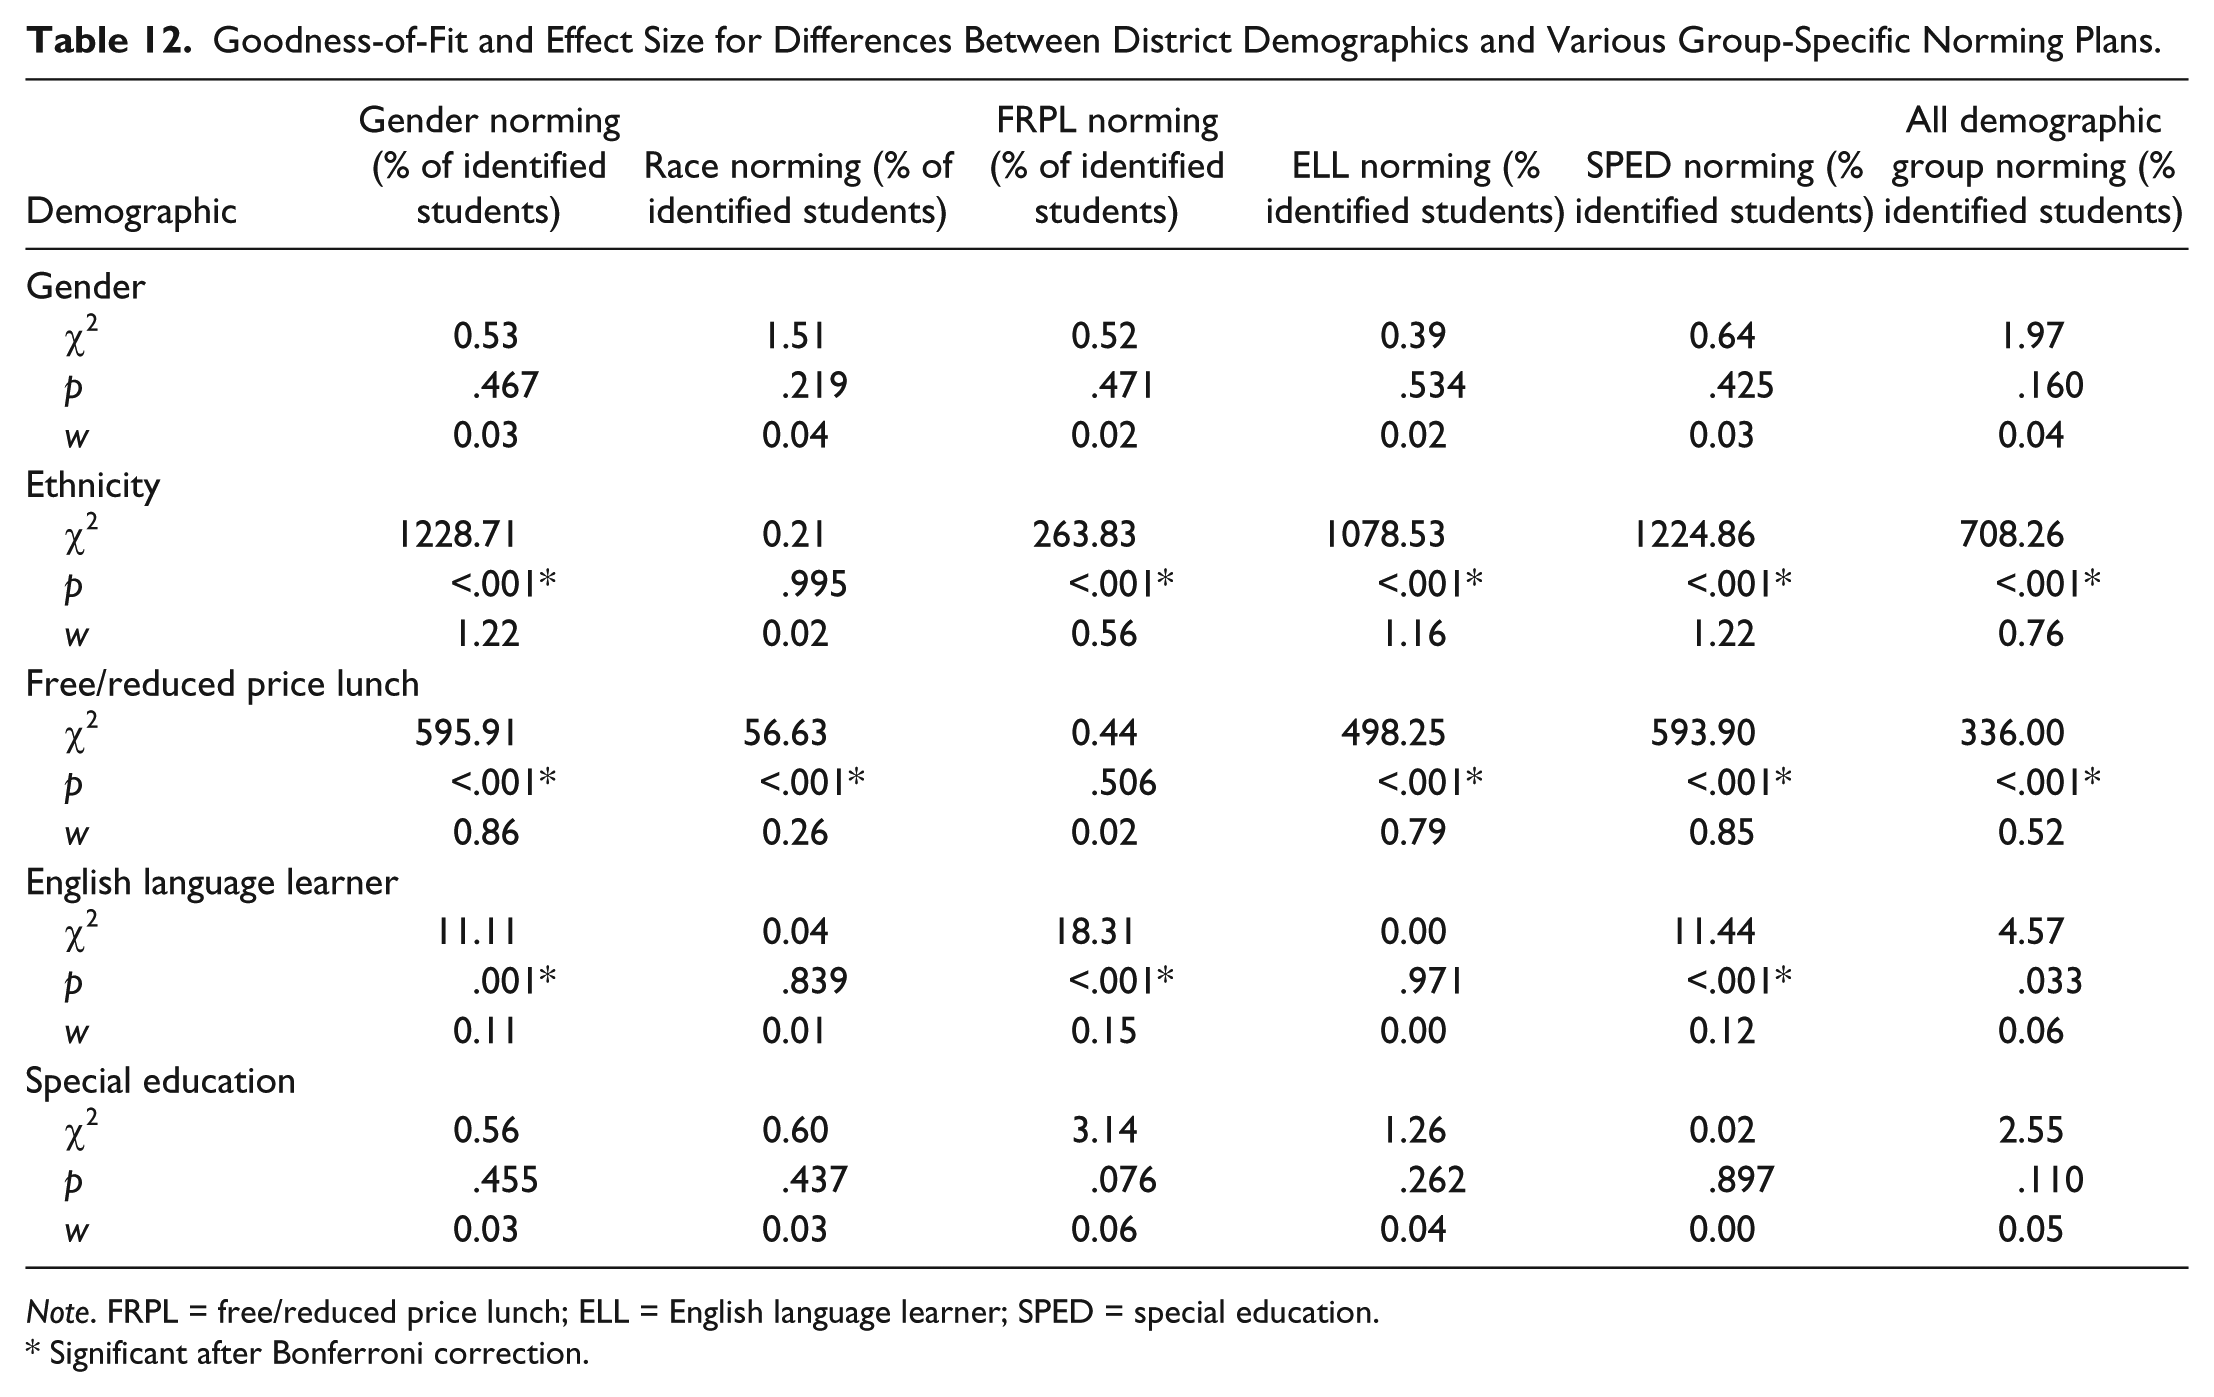
Note. FRPL = free/reduced price lunch; ELL = English language learner; SPED = special education.
Significant after Bonferroni correction.
CogAT7 Nonverbal Battery Scores (SAS) for Students Identified Under Various Group-Specific Norming Plans by Subgroup (Top 5% Cutoff).
Note. CogAT = Cognitive Abilities Test; SAS = standard age scores; FRPL = free/reduced price lunch; ELL = English language learner; SPED = special education.
Discussion
As with the NNAT, these analyses show the CogAT7 nonverbal battery results also display group differences. This research also explored the use of school-level demographic variables through HLM. Examination of the intraclass correlation coefficient to determine variability between schools indicated that a significant amount of variability in CogAT SAS was due to school membership. However, the amount of variability is relatively small (Hox, Moerbeek, & van der Schoot, 2010; McGraw & Wong, 1996), and only one of the school level characteristics was associated with the CogAT SAS in the current study. Given the strength and consistency of the associations between student level demographics and CogAT SAS, this small, though significant, school-level variability may be more reflective of different demographic breakdowns within the schools, which is accounted for in the models, rather than other systematic school differences. Also, it is typical for student-level variance to overpower school level variance in HLM models (e.g., Morgan, Farkas, Hillemeier, & Maczuga, 2016) so this result is not unusual.
The continued finding of demographic group differences on the CogAT is not surprising, given that Lohman himself said use of the CogAT should “substantially reduce but does not eliminate group differences” (Lohman, n.d., p. 27). Many districts elect to use nonverbal instruments in the mistaken belief that doing so will result in proportional identification across groups (Carman & Taylor, 2010; Peters & Engerrand, 2016). Instruments that display group differences (which includes all cognitive-related tests) should only be used as part of a G/T identification process with the understanding that users may not achieve the results they seek (proportional identification) solely through the use of a nonverbal instrument. In our results, we found the use of a nonverbal assessment did not eliminate group differences, which aligns with the results previously found in the literature. Rather than using the CogAT nonverbal battery as part of a “use different tests” mindset, our results indicate that districts should perhaps instead “use tests differently.” However, as most districts use some form of ability testing as part of their identification procedure (Carman, 2013), it is important to determine the effects of these group differences on the participating district’s selection results.
The participating district uses the CogAT nonverbal battery along with an achievement test, report card grades, and teacher recommendations as a part of an identification matrix used to identify gifted students. Scoring within specified ranges above 100 SAS earns a student from 5 to 30 points toward the total of 62 points required for the student’s entry into the G/T program.
To determine the effects of the group differences in CogAT7 nonverbal battery scores on the district’s identification, we created various norming, cutoff, and OTL modifiers. Some of the OTL modifiers were unsurprising based on the current literature: Black students scored 9.57 SAS below students of other races/ethnicities, students receiving FRPL scored 4.12 SAS below non-FRPL students, and students who are receiving SPED services scored 5.34 SAS below non-SPED students. Some of the OTL scores were less expected such as male participants scoring 1.81 SAS below females and students who were English language learners scoring 0.60 SAS above non-ELL students. We expected different results based on previous literature. Previous studies involving the CogAT and ELL students have found ELL students to score below non-ELL students on the CogAT nonverbal battery (Giessman et al., 2013; Lakin, 2012).
Because the participating district uses CogAT7 nonverbal battery scores as part of an identification matrix it is difficult to determine the exact effects on identification rates of various demographic groups that using different norming, cutoffs, or adding an OTL modifier would cause. In interpreting the results from Tables 9 and 12, please note that a statistically significant result and/or a result with a large effect size is not what we wish to find, as that indicates the percentage of identified students using the norming method, cutoff score, or modifier being analyzed was significantly different than the percentages observed in the population. In Table 9, all the selection methods used resulted in significantly different percentages identified than the population for both ethnicity and FRPL. This includes the option where specific OTL-based modifiers were added to student scores. Even with the additional points, students on FRPL and in other demographic groups still did not achieve equivalent percentages of identification. Similar results are found in Table 12, where we explored group-specific norms. Statistically speaking, none of the various identification methods resulted in proportional representation, although some methods performed better than others. Like many statistical analyses, the chi-square is sensitive to large sample size, which could certainly be making the identification appear less proportional across all the methods. Focusing on the effect sizes, which are less prone to sample size issues, we find a slightly different story emerging. In Table 9, the use of school-level norms appears to have the closest match generated with the district’s population. Of all the methods explored on that table, school-level norms have the weakest effect sizes produced across the five demographic categories. Similarly in Table 12, the use of group-specific norms based on race had the lowest overall effect sizes, closely followed by norms based on income. Had the district been identifying based on CogAT7 scores alone, using school-based norms or group-specific norms based on race or income would likely have the largest impact on the differences between groups identified and produce the most proportional results. Given that the race and income variables contained the biggest disparities in identification to begin with, we would expect using race- or income-based group norming to produce the biggest change. Again, please keep in mind that we examined these types of norms in an exploratory fashion and not as a suggestion for practice.
Limitations and Implications
This study had a few limitations which could affect the interpretation and generalizability of the results. Only one district participated in this exploration of the CogAT7. Although the district is quite diverse, many school districts are not, and as such these results may not apply to differently demographic districts. This district is also very large and provided many participants for the analysis. The use of such a large sample increases the chance of finding statistically significant results from our analyses.
The participating district uses universal screening, a strongly encouraged identification practice (Card & Giuliano, 2015) but engages in such screening in kindergarten. As stated earlier, the CogAT7 has its lowest reliability scores in the 5/6 (kindergarten) level exam. It is likely the differences in CogAT7 performance between demographic groups could have changed had the universal screening taken place in higher grades. Given the higher reliability of the instrument for older children, screening at an older age would produce more reliable scores, which should result in greater observed differences among groups.
In our study, we used multiple demographic variables to operationalize opportunity to learn. Using demographic variables provides a less exact measure of opportunity to learn than if we were able to directly measure OTL. Unfortunately, our field does not have an exact way to measure OTL at the individual level. Even if our field did have a valid individual-level measure of OTL, we suspect that its use would result in a reduction but not elimination of group differences in identification as there are additional explanations for differences in group performance beyond opportunity to learn.
Another limitation is that we are using OTL as an additive model, such that students earn modifier points for each affected demographic group they are a member of. For an initial exploration, an additive model is an easier model to use than a model that allows exploration of interactions among variables, but future explorations could examine whether an additive model is the most appropriate for measuring OTL.
We generated a wide range of cutoff scores when calculating the school-level norms based primarily on the demographic makeup and differing opportunity to learn of the various schools in the participating district. For this study we maintained strict cutoff scores generated by calculating the top 5% which resulted in some schools with large numbers of high-scoring students receiving cutoff scores higher than the usual 130 and some schools with few high-scoring students receiving lower cutoff scores, thereby not identifying some students who would normally qualify for services and identifying many other students who would not otherwise qualify for service due to low test scores. Peters and Gentry (2012) suggest addressing this non-identification of students with high scores through the use of a general cut score (identifying all students above a certain score) plus an additional set of cut scores matched to the various group-specific norms (identifying more underrepresented students in those demographics). Future research should examine the effects of this two-layer cut score model to determine its effects on identification.
In examining differences between individual subgroups on the various norming plans (Table 10), the lowest mean score for any subgroup was 115.12 (SD = 7.98) for Black students under a school-level norming plan and the highest mean score was 137.08 (SD = 3.44) for Asian students under the race group-specific norming plan. The biggest range in mean scores within a single norming plan is found in the race group-specific norming plan (115.21 [Black]–137.08 [Asian]) and the smallest range in mean scores is found in the national norms with a top 5% cutoff plan (119.41 [SPED]–124.69 [Asian]). The mean score for individuals selected with school-level norms was 118.60, with a standard deviation of 8.91. This was the lowest mean score generated among all the different norming, cutoff, and modifier options we explored. However, even having generated the lowest overall mean across all the norming plans, the school-level mean is over 1.5 standard deviations above the district’s mean score on the CogAT 7 nonverbal battery. These school-norming results suggest that although overall some high scoring students would not be identified, at each school the highest scoring students would be identified.
One goal of this investigation was to demonstrate some possibilities of outcomes as a result of norming, cutoff, and modifier decisions. Although we use actual demographic information from the participating district in these analyses, do not take the norming methods as reflective of actual practice within the district. Many of the norming plans examined here are for exploratory purposes only and the results should not be taken as advice to put any of these plans into place. In addition, many of the norming practices explored here may not be legal under various federal, state, or local laws/regulations. Districts interested in utilizing different norming and cutoff plans should seek legal advice before implementing such a system. The findings in this article do not constitute an endorsement of the use of such norming/cutoff plans in any given district. For a more extensive discussion of the legal ramifications of gifted identification please see Peters and Engerrand (2016).
As previous researchers have noted, the best identification system is one that is closely linked with the services that the identified students will receive (Lohman, 2009; McBee et al., 2016). The participating district offers many different services ranging from service in the neighborhood schools to magnets to after-school programs to special talent-based schools. There are many different services offered and the students can take advantage of these in many different ways. The district uses a broad identification matrix that is not specific to any one of its many programs.
This research only examined the effects of demographics on CogAT7 nonverbal battery performance. Although care was taken to explore the data in a method similar to earlier explorations of the NNAT, the results of this study are not directly comparable to previous NNAT or NNAT2 results due to large differences in participating district demographics. Future research should compare the performance between the NNAT2 and CogAT7 within the same population.
The participating district chose to use the CogAT7 nonverbal battery in the hopes that the results would identify students of different demographic groups proportionally. Similar to the findings of Carman and Taylor (2010) on the NNAT, the use of the CogAT7 nonverbal battery does not in itself reduce differences between demographic groups. Even in using a “culture-reduced” measure, Lohman (2011b, p. 7) has stated that nonverbal tests are “not a panacea that will suddenly achieve the goal of proportional representation of low socioeconomic status (SES) and minority students in talent development programs.” The participating district does not use the CogAT7 nonverbal battery alone or as a first step or gatekeeper in a multistep screening process, but rather as part of a multitest matrix. Even within such a matrix the demographic differences do result in unequal identification, especially for traditionally underrepresented students by race/ethnicity and FRPL. However, many districts still use ability assessments in a gatekeeping way (McBee et al., 2016; Moon, 2013; Peters & Gentry, 2012) and are thereby allowing demographic differences in ability test performance to even more greatly affect their identification results. Districts should be cautious in their use of nonverbal ability tests (or any cognitive-based tests) in such fashion, and should recognize that, no matter how the test is advertised, the use of a nonverbal test alone will not result in proportional identification.
In 2011, Lakin and Lohman explored the predictive accuracy of multiple types of reasoning tests and their relationship to classification errors. Classification errors occur when students who should have been identified are not (false negatives) and students who should not have been identified are identified (false positives). In essence, classification errors act like the Type I and Type II errors of gifted identification. Ideally, in any identification program, districts would want to reduce the numbers of students who are falsely excluded while at the same time not including students who should not be included. Lakin and Lohman (2011) determined that lowering the cut score for entry greatly increased the number of students who were correctly identified as gifted, thereby lowering the number of false negatives, while not significantly increasing the number of false positives. In a similar fashion, the use of school-level norms lowers the cut scores for entry by school, which should increase the number of students correctly identified while not greatly increasing the number of false positives. This should result in greater equity and diversity in a district’s identification without having large effects on its excellence.
The use of school-normed or group-normed cutoff scores to ensure equality of representation in gifted identification could have major effects on the performance and retention of students in gifted programs. Using school-normed or group-normed cutoff scores should result in an influx of students being identified as gifted who would otherwise not have been selected for participation in those programs. The inclusion of students to achieve greater equity, without proper planning, resources, and support systems, could result in a decrease in program performance. It is vitally important to ensure that schools using these norming methods are prepared for the differing educational needs that some of these students may bring to the gifted program that the district may not have needed to address previously. Students who the district would not have identified based on their scores affected by lack of opportunity to learn will bring those gaps in learning with them to their new programs. Gifted programs will need to prepare to address these gaps to increase student success and retention. One recommended way to address these needs is to engage in front loading (Warne, 2009). In front loading, students who would not normally be selected for gifted programming but who qualify through other means (such as differing cutoff scores) are given intensive coaching and support to improve their academic skills and achievement before being entered into regular gifted programming. This intense academic environment may serve to alleviate some of the lack of opportunity to learn these students have previously experienced, better preparing them to participate as full members of a gifted program. An increase in ELL students or students on FRPL will require additional resources to ensure that their needs are also being met while allowing for success in their gifted programming. It does not do a district or a student any good to be identified to ensure equity if the result is lower retention rates due to underprepared or undersupported students, faculty, and programs.
The lower cut scores for admission used among some groups, particularly in school-based norming, has been at times presented as a conflict in the balance between equity versus excellence. The authors believe “equity vs. excellence” presents a false dichotomy, where in order for one goal to be achieved the other must suffer. We believe that it is possible to achieve excellence with equity and that excellence without equity is not excellence at all. Given the knowledge within our field of the equity issues involved in using cognitive-based instruments for selection of students from various underprivileged groups, including those who have less exposure to the instrument, less exposure to the types of questions utilized, those who are food-insecure or homeless, and those for whom English is a second language, it is inappropriate and exclusionary to measure excellence through a single score on such instruments. As Lakin and Lohman (2011) stated, “Using a common set of norms for all students is defensible for inferences about talent only when students have had roughly similar opportunities to acquire the abilities measured by the test” (p. 22) Measuring only with these instruments and limiting promotion only to those who score above one certain point as excellence is not truly measuring excellence. Excellence is something greater than the score on a single instrument or measure, and those whose definition of excellence is limited in such a manner should make it clear that when they are discussing excellence they are using a very narrow operational definition of the term. If excellence, as Lakin and Lohman (2011) state, “demands that program administrators identify and provide appropriately challenging programs to develop the talents of students whose cognitive and academic development markedly exceeds that of their peers” (p. 595), then districts can meet the demands of excellence as well as ensure greater equity by being more accurate as to whom students’ peers are. Students who have the gifts, talents, grit, resilience, and the ability to rise above their peers of equal opportunities should be recognized, promoted, and assisted to achieve, not held back because of some arbitrary standard. Students who score at the top of their opportunity-based peer group are gifted as much as those who have all the advantages and score at the top of the nation. Leaving students with less opportunity behind in the service of a limited measure of excellence does a disservice to us all.
The use of school-level norms, subgroup-specific norms, or other modifiers to correct for the differential opportunities to learn that exists across major demographic groups has been endorsed by Peters and Engerrand (2016) as one way to reduce the inequity currently in gifted identification. Although the use of local norms has been suggested as a way to reduce disparities between groups that may have different educational advantages, the level of local norming may have a major impact on the results. There may also be legal implications to the use of such norming plans. Although the use of modifications to account for students’ differences in opportunities to learn will not fully correct for nor account for all the differences found in gifted identification, they will result in a reduction of the inherent inequities in our educational and social systems (Peters & Engerrand, 2016).
Footnotes
Acknowledgements
The authors would like to thank the editor and four reviewers for their tireless efforts and perceptive contributions to this article. This article has been much improved through their assistance.
Declaration of Conflicting Interests
The author(s) declared no potential conflicts of interest with respect to the research, authorship, and/or publication of this article.
Funding
The author(s) received no financial support for the research, authorship, and/or publication of this article.
