
Abstract
The disproportional representation of students from various demographic subgroups within identified gifted and talented populations has long frustrated policy makers, education advocates, researchers practitioners within the field, and those concerned with societal inequality in general. Despite the prevalence of articles in the media reporting on disproportional representation, little research has been conducted to track whether (a) the representation of these student subgroups, particularly students with limited English proficiency or students with disabilities, has changed over time or (b) states with and without policies differ in proportional representation of students identified with gifts and talents. For example, increasingly, gifted education advocates have pushed for mandates that all students be screened for gifted program eligibility as a way to combat disproportionality, despite little evidence that such methods influence proportionality. Therefore, this study sought to understand whether and how state and national gifted program demographics have changed over time and how proportionality is correlated with state mandates for gifted education identification or services. A preprint of this paper as well as additional figures are available at: https://osf.io/325m9/.
Literature Review
For the past 50 years, the field of gifted education has recognized and struggled to ameliorate underrepresentation of students from non-European backgrounds in gifted education programs. Specifically, African American, Latinx, and Native American youth have been underrepresented in gifted education services; whereas students from European American and some Asian backgrounds have been well represented. As most American K–12 students now identify with a demographic racial group other than European American, the discrepancy in gifted education services is a pressing matter (National Center for Education Statistics [NCES], 2017). Although perfect proportionality of all subgroups may be unrealistic given the larger state of inequality in the United States, progress (or lack thereof) is important to investigate. Disparities in the identification of students who have limited English proficiency (LEP) or who are served under the Individuals with Disabilities Education Act (IDEA) are also a growing problem due to these groups making up a rapidly-growing percentage of the American student population: currently 9.4% and 13% of American students, respectively (NCES, 2016a, 2016b).
Sources of Disproportional Underrepresentation
In a 2016 analysis, Peters and Engerrand classified the research base surrounding the causes of underrepresentation into two themes. The first theme presented the view that the assessments commonly used to make gifted identification decisions are inherently flawed or biased against certain groups, thereby resulting in disproportional underrepresentation. This argument is best exemplified by the popularity of “nontraditional” assessments such as nonverbal ability tests or structured observation protocols (such as the Teacher Observation of Potential in Students; Harradine, Coleman, & Winn, 2014). Under this view, proportional identification should be expected, and any observed underrepresentation is due to flawed identification tools. If this is a valid claim, then the call for “less-biased” assessments for identification makes sense.
Peters and Engerrand (2016) identified a second theme, suggesting that it is the ways in which students are identified, rather than with which particular assessments, that causes underrepresentation. For example, teacher recommendations as a tool might be an appropriate data source for student identification, but if such a recommendation is mandatory before any other data points are considered, then their use could actually exacerbate disproportionality. In 2016, Grissom and Redding published an analysis of the Early Childhood Longitudinal Study–Kindergarten cohort (ECLS-K), examining the factors contributing to disproportionality in gifted education. A major finding was that African American students were far more likely to be identified as gifted in reading if they had a teacher who was African American (6.2% vs. 2.1% probability), even after controlling for academic achievement, suggesting that achievement tests themselves were not the source of the problem. Instead, a teacher-related variable was at issue. The National Association for Gifted Children (NAGC) State of the States Report (2015) noted that teacher and parent referrals are a common gate through which students must pass before being further evaluated for gifted services. The result of this two-phase identification process is that some students who would meet the identification criteria are never considered because they never receive the initial referral.
A growing body of research points to the use of poorly designed two-phase identification systems as a contributor to underrepresentation (e.g., Hamilton et al., 2017; McBee, Peters, & Miller, 2016). Any time fewer than 100% of students are considered for gifted services (universal consideration), some process must be used to determine who is considered and who is not. That process is always imperfect. McBee et al. (2016) referred to this as a two-phase identification system in which a student must first pass through a screening phase to be formally considered in a confirmation phase. In gifted education, the most common form of the initial screening phase is the teacher or parental referral (NAGC, 2015). If students cannot access program eligibility procedures unless first being nominated by a teacher, then simply improving the quality of the formal consideration phase will never solve the problem, because many students who would be identified will never make it passed the screening phase. McBee et al. (2016) gave an example of a two-phase system wherein students must score at the 90th percentile on the Phase 1 assessment(s) to be given the Phase 2 assessment(s). Students must then score at the 90th percentile in Phase 2 to be identified. Even under high reliability assumptions (.95) with a strong correlation between the phases (.90), approximately 20% more students are missed due to the existence of the two-phase system because some students who would have done well in Phase 2 were blocked by Phase 1. If the two cut scores move to the 95th percentile, just under 30% of students are missed, with the harm to system sensitivity falling disproportionately on students who are from traditionally underrepresented populations.
Inequality
A factor that was not addressed as a cause of underrepresentation by Peters and Engerrand (2016), which also contributes to underrepresentation, is the large inequality of educational access and opportunity in the United States. When approaching the topic of equity in gifted education, it is often implied that something close to perfect proportionality should exist and that anything less results from flawed identification methods (e.g., biased tests or two-phase identification systems), rather than from disparities in educational opportunity. Put simply, this is not a reasonable assumption given the inequality in educational opportunity in the United States. Exposure to learning opportunities influences achievement (Lohman, 2005) and measured IQ (Ritchie & Tucker-Drob, 2018) and, in the United States, higher income families have greater access to high-quality educational opportunities. This is true in many countries but is especially problematic in the United States (Chmielewski & Reardon, 2016; Finn & Wright, 2015).
In an analysis of wealthy Organisation for Economic Co-operation and Development (OECD) nations, Chmielewski and Reardon (2016) found that the United States had the largest levels of “poverty/inequality,” as well as some of the largest income-related achievement gaps. The United States also had the lowest parental support index and the lowest social welfare policy index. What all this means is that broad inequality in the United States persists and is associated with large achievement differences (Reardon, 2011). Higher family income comes with greater access and opportunities during the preschool years, during the school day, and outside of formal education. Further exacerbating the effect of this inequality is that in 2015, 12% of European American children lived in poverty compared to 36% of African American children, 34% of Native American children, and 31% of Latinx children (Kids Count Data Center, n.d.), creating an intersection of race and poverty for students who have long been under identified in gifted education.
In a recent analysis of three states, Hamilton et al. (2017) found even after controlling for achievement scores, individual- and school-level free or reduced-price lunch status were negatively predictive of a student’s probability of being identified as gifted. Their results make clear that individual and institutional poverty are negatively associated with the probability of a student being identified as gifted. To be clear, poverty is not the only reason for racial/ethnic disproportionality in gifted populations but in the United States, being African American, Latinx, or Native American means one is far more likely to be poor and also face additional institutional barriers related to race/ethnicity. Thus, proportional representation in the absence of proactive efforts to mitigate the effects of poverty and racism on access is unlikely to occur.
Historical Disproportionality
In 2009, Yoon and Gentry published the most comprehensive analysis to date of how gifted education proportionality rates have changed over time. Their analyses included national trends from 1978 to 2006 and subgroup comparisons by state for 2002, 2004, and 2006. Their analyses relied on a representation index (RI) to present the degree to which a certain group of students is represented in the gifted population compared with the total student population. Computing an RI requires the percentage of students identified as gifted who come from a given demographic group as well as the percentage of students in an overall population from that same group.
For example, if a school’s identified population of students with gifts and talents is made up of 14% African American students but the school’s population is 28% African American, then the RI would be 0.50. An RI of 0.50 means that African American students are represented half as frequently in the gifted population as they are in the total population. An RI of 1.0 translates to proportional representation. Figure 1, reprinted from Yoon and Gentry (2009), shows the racial/ethnic history of RI from 1978 to 2006.
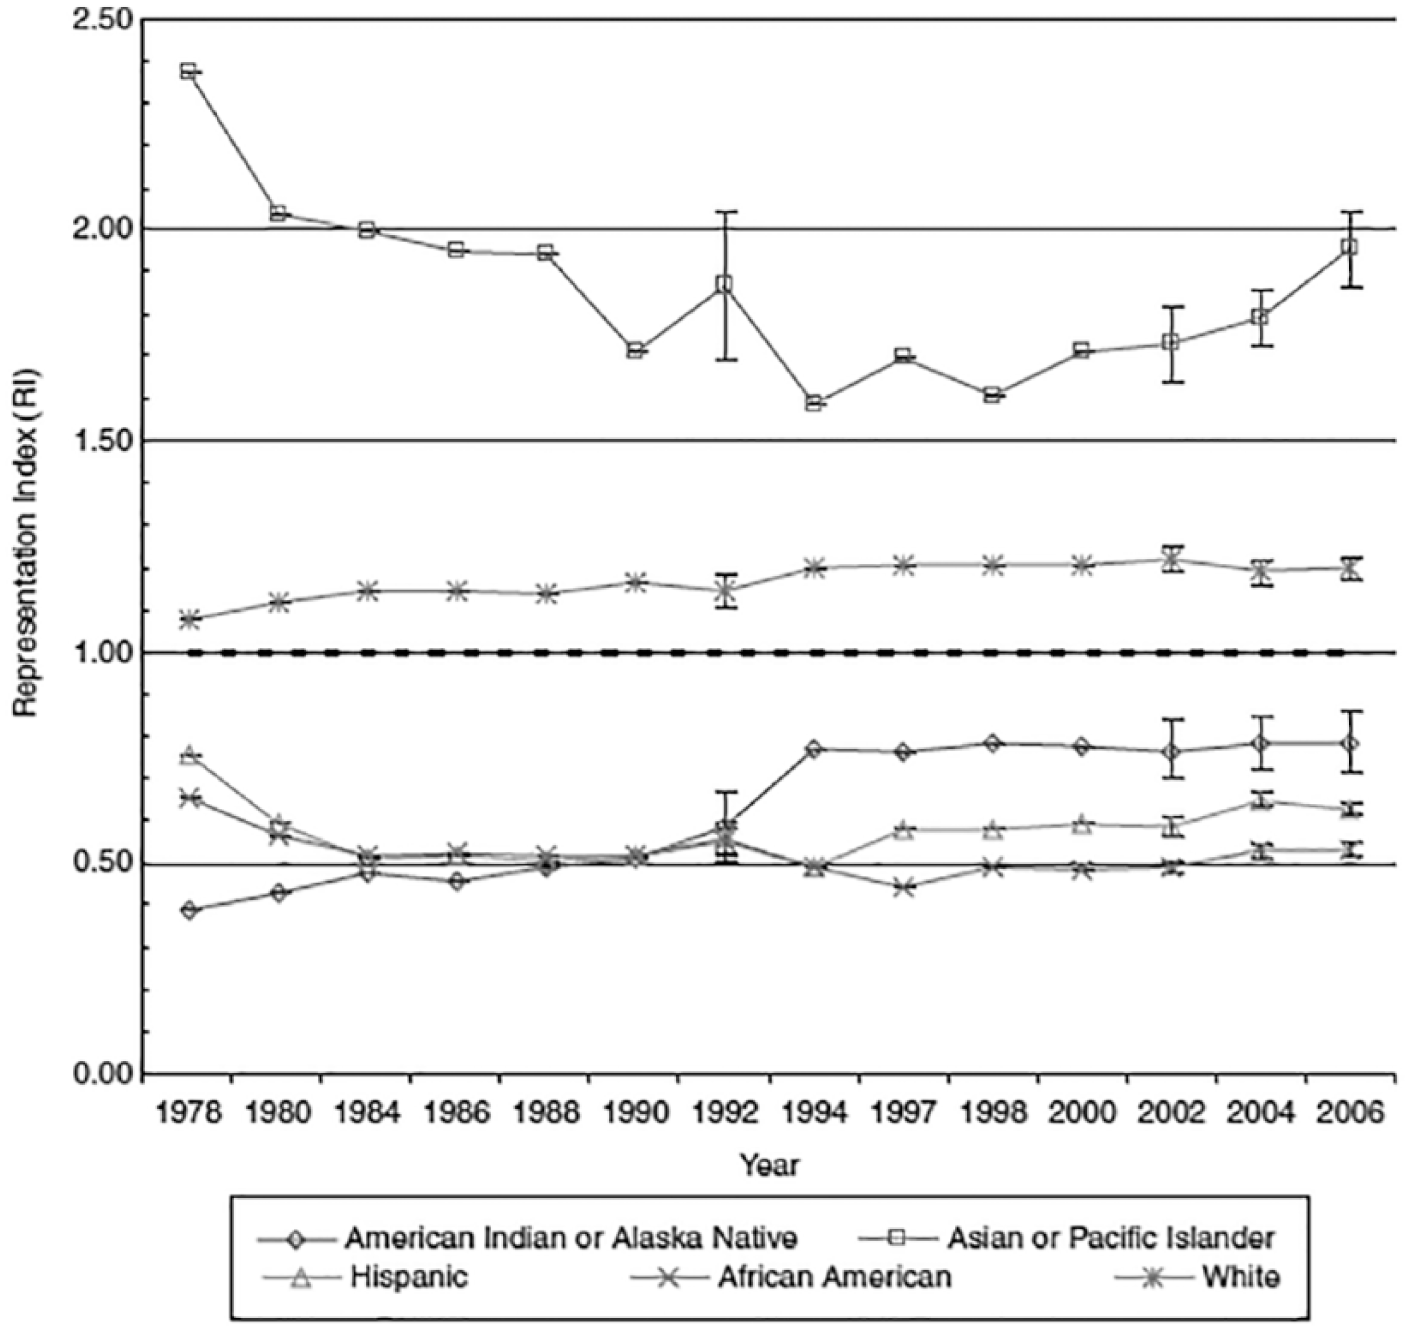
Representation index (RI) values 1978-2006. Reprinted, with permission, from Yoon and Gentry (2009).
As depicted by Figure 1, from 1978 to 2006, Asian American and European American students were well represented; whereas African American, Latinx, and Native American students were underrepresented. Although Yoon and Gentry (2009) did not include language (LEP) or disability groups (IDEA), a review of the Office of Civil Rights (OCR) data collection showed 2006 RIs of 0.23 RI for students who had LEP and 0.16 RI for students identified as served under IDEA.
Method
The purposes of our analyses were threefold (1) to update the knowledge base on the national and state gifted education representation rates by race/ethnicity and, for the first time, to do so for LEP and disability variables (2) to report state trends for these groups over the three most-recent data collections, and (3) to compare representation rates for those states that do and do not mandate gifted identification or gifted services.
To compute representation indices for student subgroups, we downloaded raw, public data files from the OCR website. These files include school-level variables on the number of students identified with gifts and talents broken down by sex, race/ethnicity, English proficiency (LEP), or whether or not the students were served under IDEA. The first step was to create a new variable representing total gifted enrollment at each school and in each state. To do this, the number of male and female students identified as gifted at each school was totaled, and those values were aggregated within each state. Next, we aggregated the total number of students from each of the seven racial/ethnic subgroups identified as gifted from each state. The total of each subgroup was divided by the total state gifted population to arrive at the numerator for each RI calculation. To calculate the denominator of each RI, subgroup student enrollment in each school was aggregated within each state. This was divided by the state’s total K–12 enrollment. The same process was followed for the 2013-2014 and 2015-2016 data collections. This is an imperfect method and an inherent limitation as it presumes that each student subgroup is equally distributed across each grade level. This is a limitation as, even if accurate, because the identification of students as gifted and talented does not take place across all grade levels (Siegle, McCoach, Gubbins, Long, & Hamilton, 2018). When presenting data from 2009 to 2010 and 2011 to 2012 OCR data collections, we relied on the “state and national estimates” provided by OCR, rather than recalculating these from the raw data.
As a follow-up to the RI descriptive analyses of the most recent national and state representation rates, we also evaluated the differences between subgroup RIs across the two most common state-level mandates that have been suggested as ways to mitigate disproportionality. To do so, we asked the following research questions:
To determine state-level policy related to gifted and talented education, we relied on a 2015 report by Plucker, Giancola, Healey, Arndt, and Wang (2015). Among the variables included in this report were whether or not each state mandated gifted identification or gifted education services in schools. A major caveat to such generalizations is that some states enforce their mandates with high fidelity, whereas others have mandates that are less strictly enforced. For example, one Midwestern state has a legal mandate for identification and services, but in the past 20 years, no districts have been penalized for noncompliance. Alternatively, a Western state provides funding for mandated identification but only releases that funding in response to a detailed plan for how it will be used. Lumping both states into a single category, “mandates identification,” does not capture these differences. To answer the two research questions, we computed average RIs for each subgroup based on whether or not the state mandated (1) identification of students with gifts and talents or (2) gifted education services in schools. Because of the large sample sizes involved in the OCR data set and because these represent census-level data, we report descriptive data (average RIs) without any inferential statistics (McBee & Field, 2017).
Results
One of the first descriptive findings was that in 2016, 42.4% of schools (n = 40,864) in the United States identified zero students as gifted, thereby implying students had no access to gifted services at those schools. This was the same in 2014 (42.4%; n = 40,532). The rate at which schools in each state reported identifying zero students varied widely. In 2016 in Georgia, only 13% of schools reported zero identified students with gifts and talents, whereas in Michigan, 93% of schools identified zero such students. It is probably not a coincidence that Georgia has a strong state mandate for gifted education services, whereas Michigan has none. Table 1 presents these data for each state with a notation for which states mandate student identification.
Percentage of Schools Reporting Gifted Students by State.
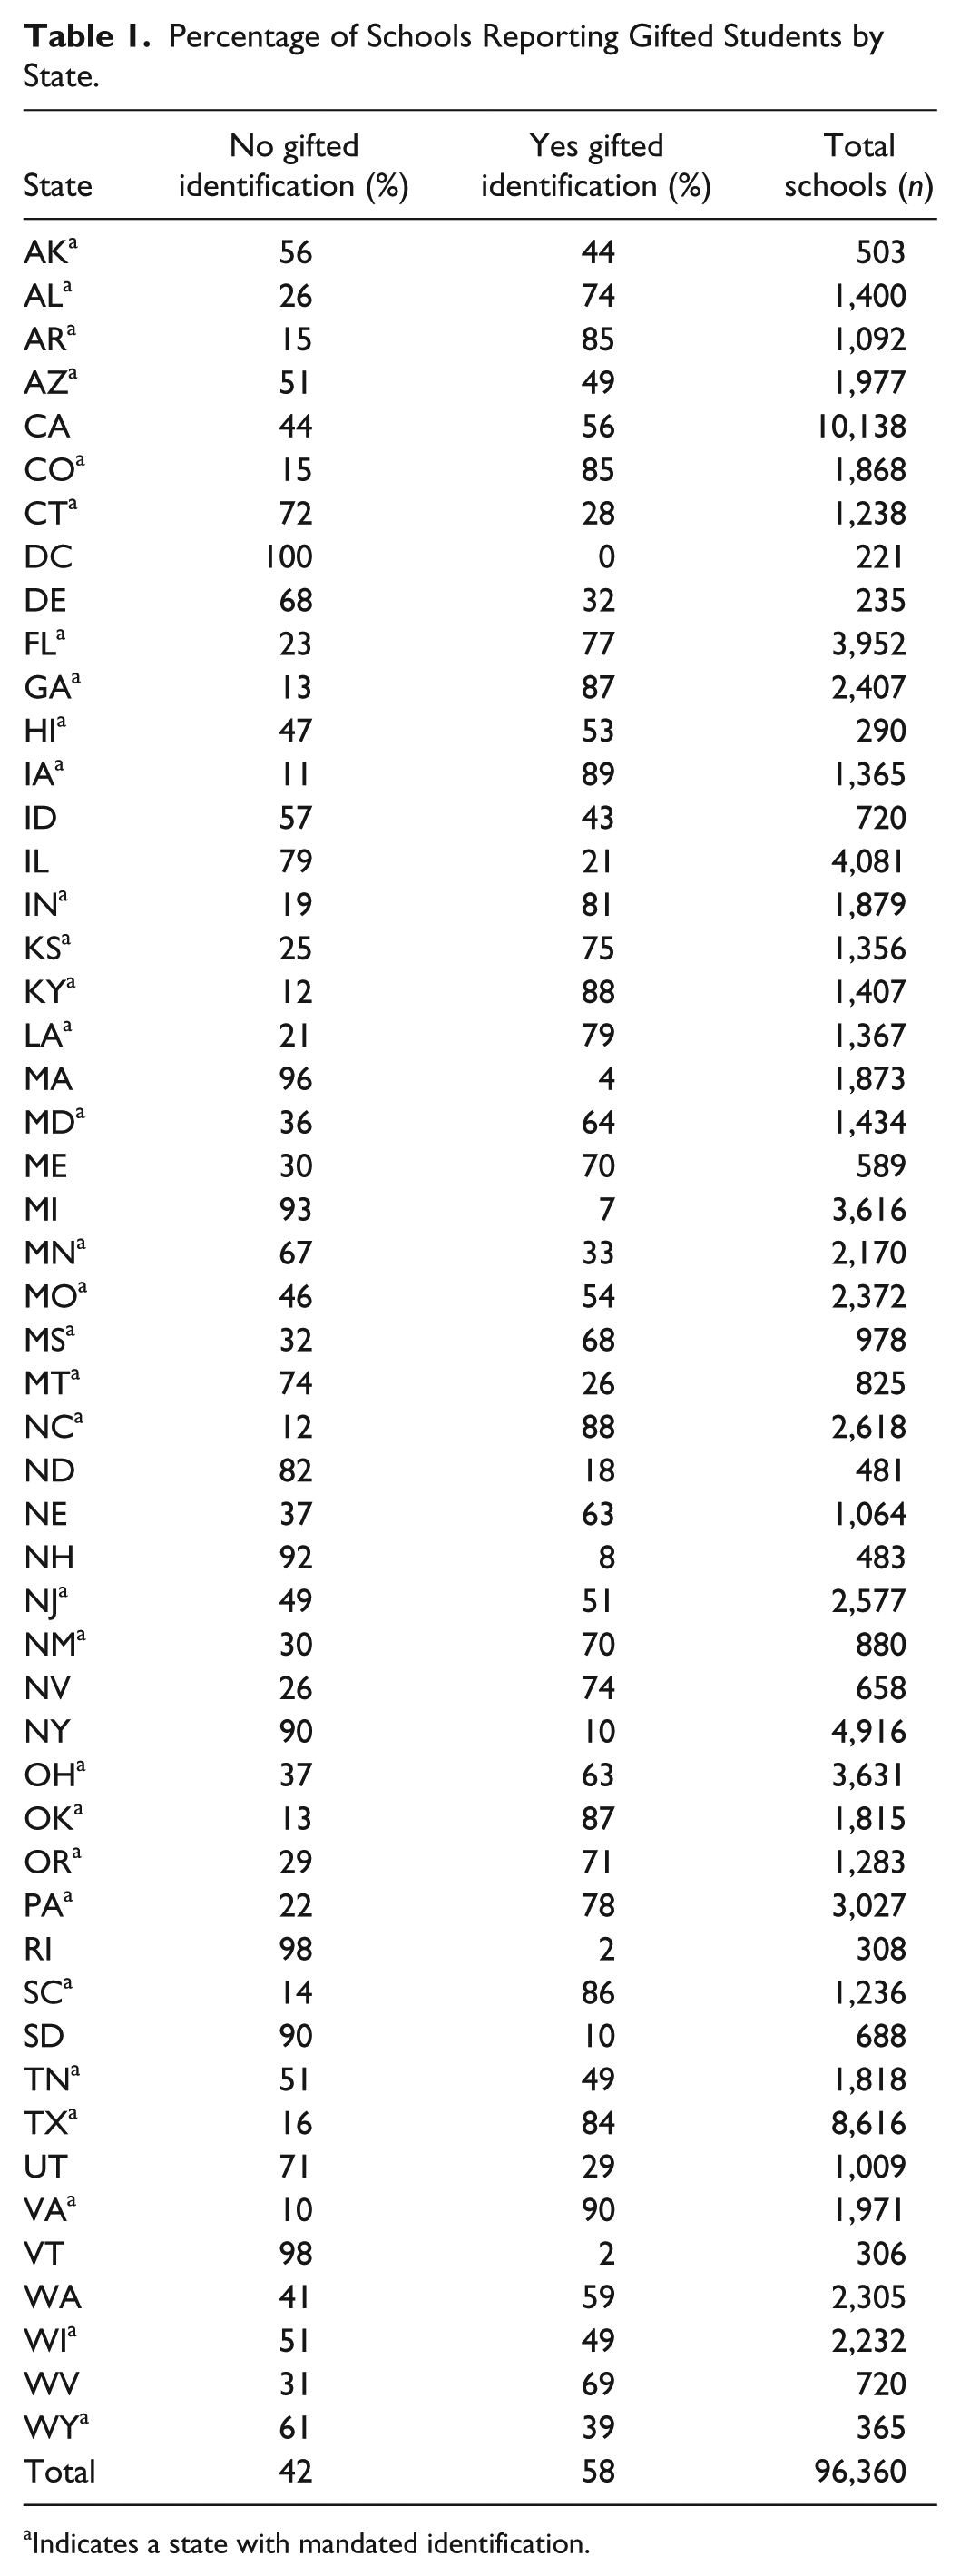
Indicates a state with mandated identification.
With regard to subgroup proportionality, Figure 2 presents RI values from the last 4 years of the Yoon and Gentry analyses (2000, 2002, 2004, 2006) as well as the most recent 4 years of OCR data (2010, 2012, 2014, 2016). There was no data collection in 2008. Table 2 presents the specific RI values from 2006 and 2016 to allow for direct comparison between 2016 and the last year of the Yoon and Gentry analysis.

Representation rates by year and student subgroup: 2000-2016.
Representation Indices by Race/Ethnicity: 2006 and 2016.
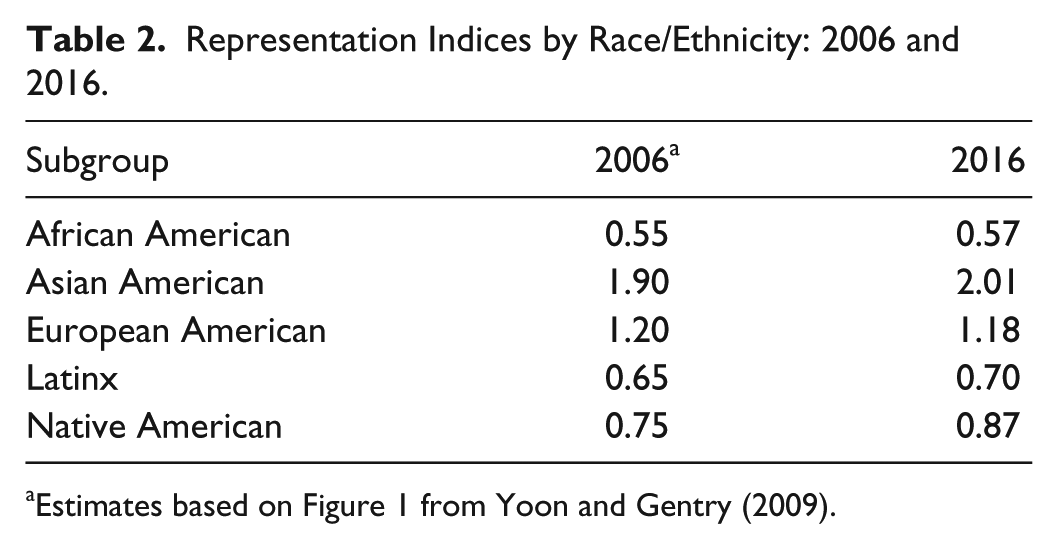
Estimates based on Figure 1 from Yoon and Gentry (2009).
Since the last data point from the Yoon and Gentry report (2006), and in the years following, little has changed at the national level. African American, Latinx, and Native American students remain underrepresented (2016 RIs of 0.57, 0.70, and 0.87, respectively), and European American and Asian American students remain well represented (RIs of 1.18 and 2.01, respectively). In addition, students who were classified as LEP or who received services under IDEA were also underrepresented (0.27 and 0.21, respectively). Despite the attention that gifted education disproportionality has received in the scholarly literature (see Dai, Swanson, & Cheng, 2011) and the fact that data are now collected from and made available to all districts in the nation, little has changed. Table 3 presents 2016 subgroup representation rates for every state in the nation. We have posted these same values from 2014 and 2012 for every state and for all seven student subgroups to this article’s Open Science Framework page at https://osf.io/325m9/.
State Representation Indices by Student Subgroup: 2015-2016 OCRD.
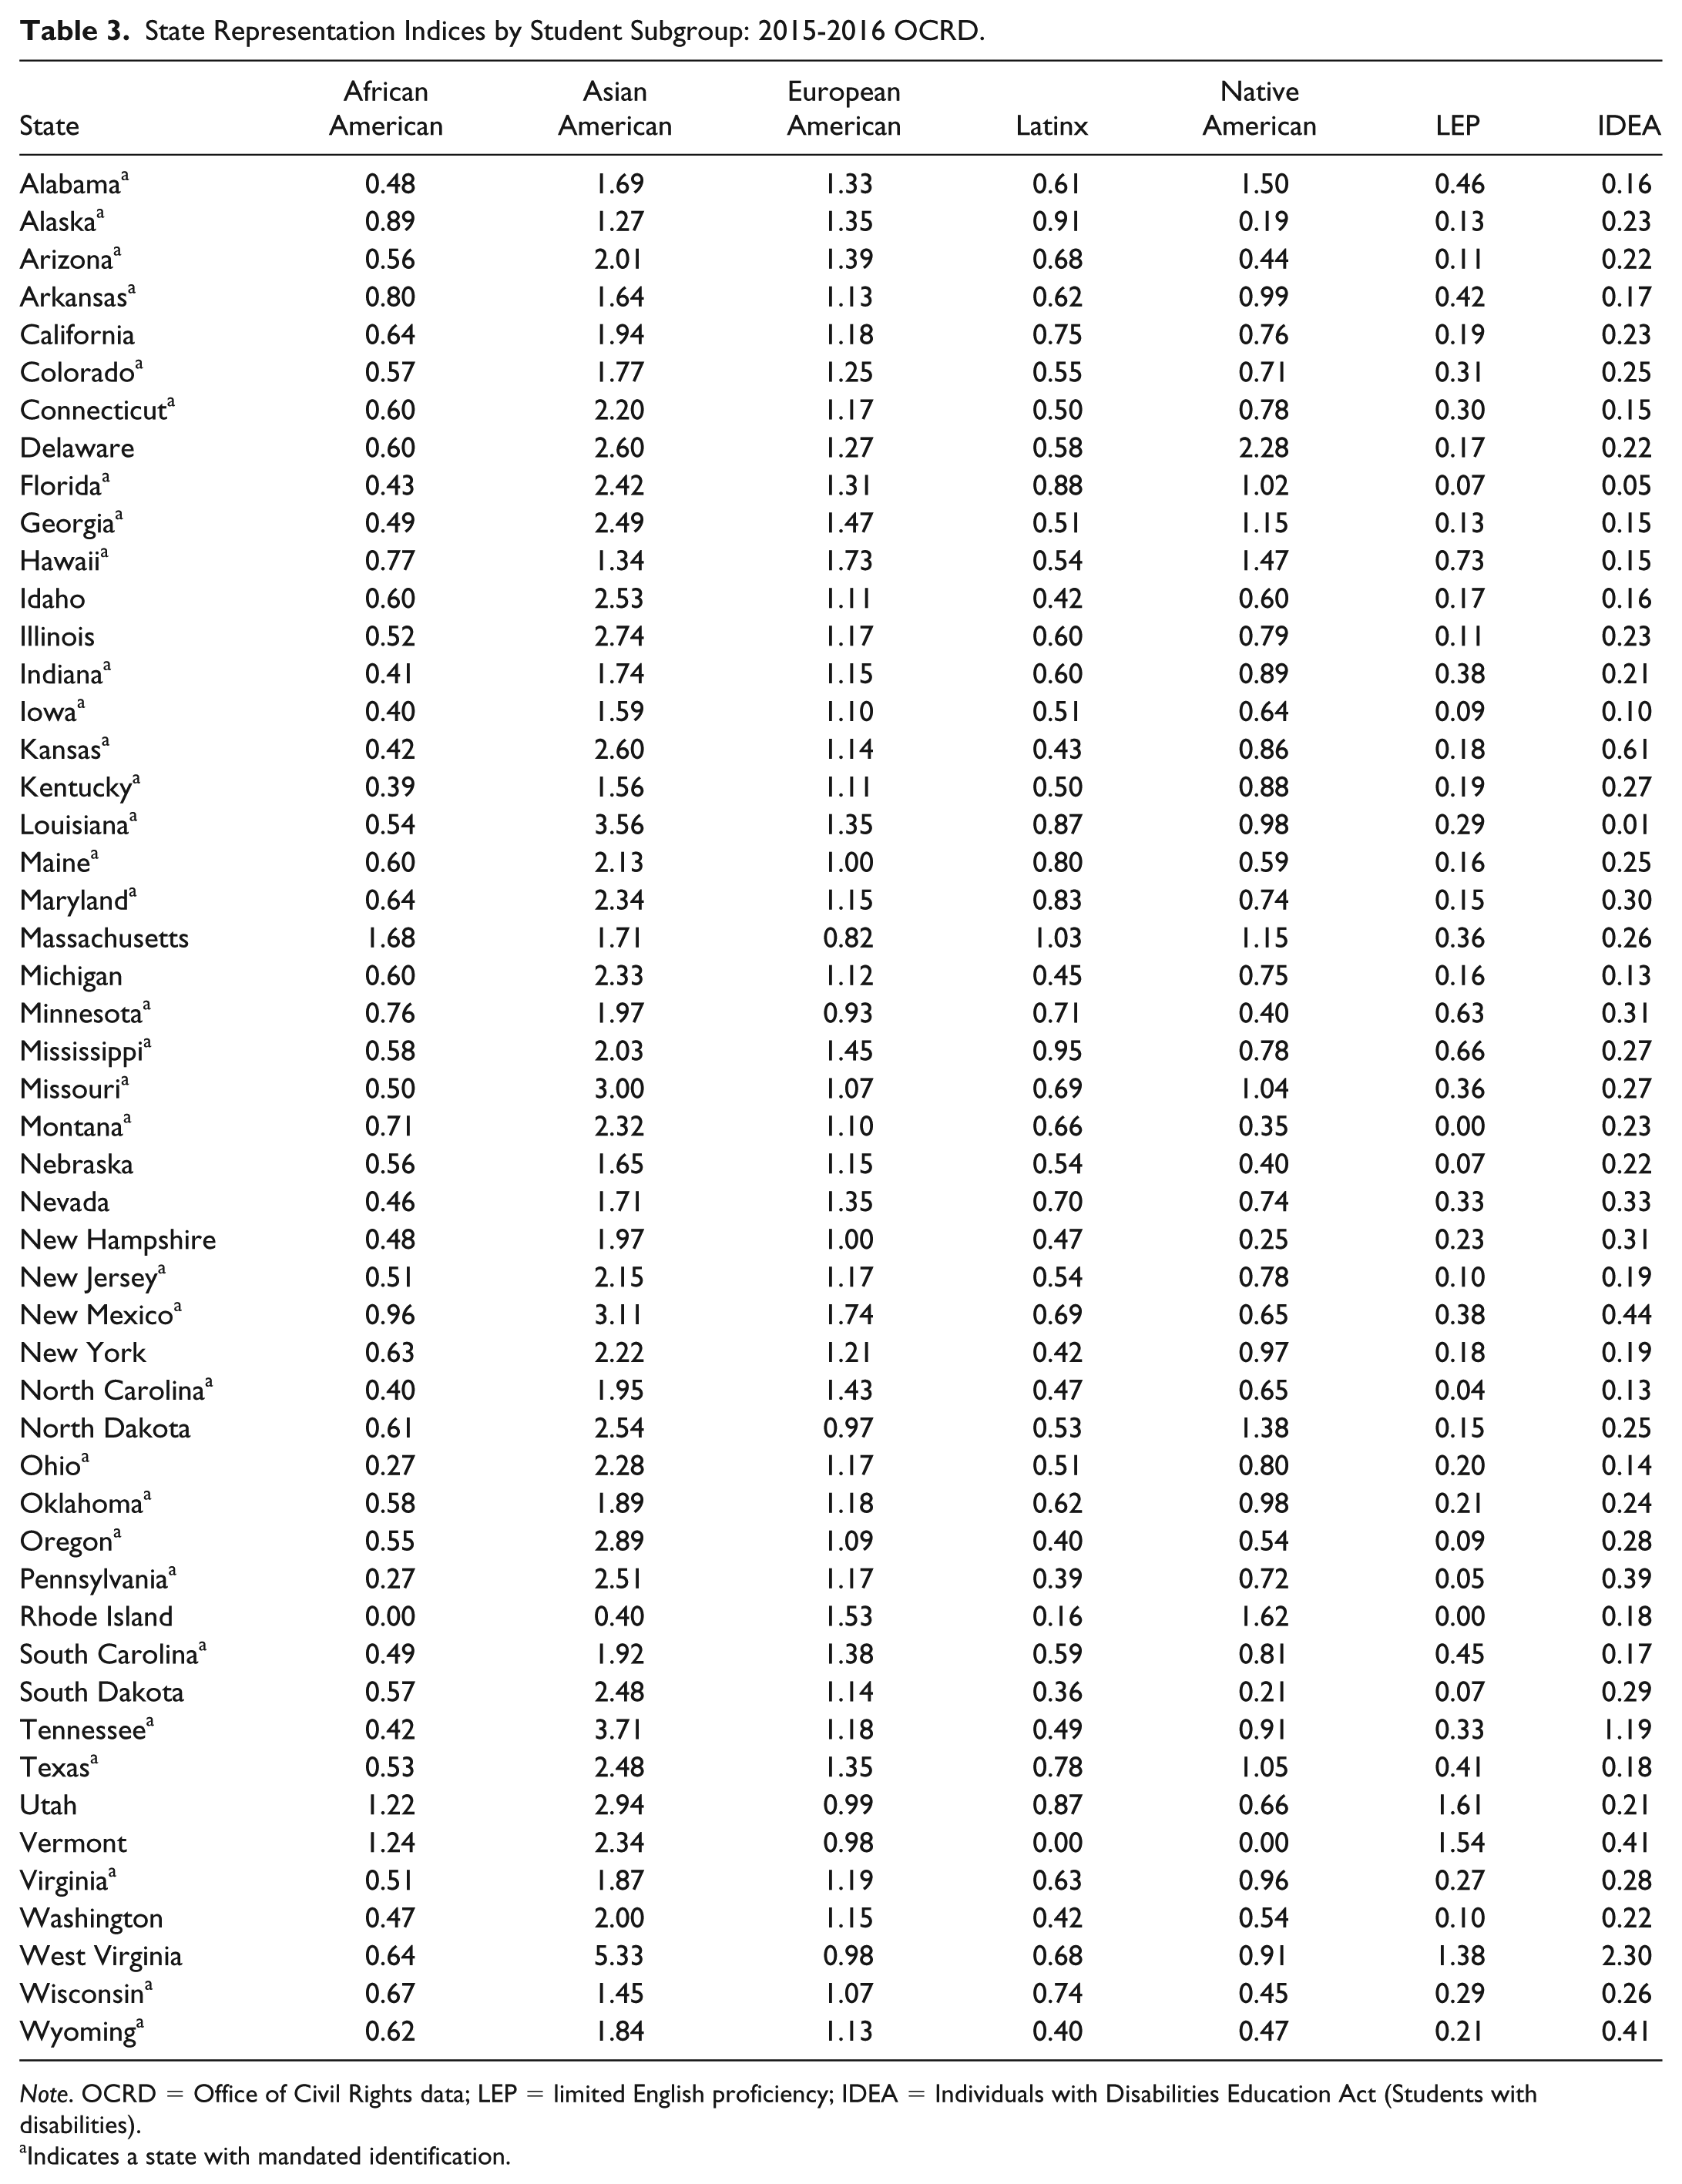
Note. OCRD = Office of Civil Rights data; LEP = limited English proficiency; IDEA = Individuals with Disabilities Education Act (Students with disabilities).
Indicates a state with mandated identification.
Although it is difficult to evaluate changes in state-level representation rates, a few state-level comparisons between data reported in Yoon and Gentry (2009) and the 2016 data are worth mentioning. Between 2006 and 2016, some states have made progress toward greater proportionality. For example, in 2006, New Mexico (~2.5% African American residents) had an RI for African American students of 0.79, which by 2016, had improved to 0.96, suggesting the identification gap had been narrowed substantially. Not all states showed a positive change. Ohio (~12.8% African American residents) moved from 0.60 to 0.27 in the same time period. Progress has been made in some states but improvement was not consistent across the country. Maryland (~9.8% Latinx) and Alaska (~7.0% Latinx) demonstrated narrowing Latinx identification gaps, moving from RIs of 0.70 and 0.60, respectively, in 2006 to 0.83 and 0.91 in 2016. Conversely, states such as New York (~19% Latinx) showed increased disproportionality for Latinx students moving from just more than 0.50 in 2006 to 0.42 in 2016.
It is challenging to look at changes in Native American and Alaskan Native representation rates because the relatively small percentages in each state make the RIs less stable from year to year. All aggregate racial/ethnic categorizations can have the negative side effect of making it appear as if these were homogenous populations, which is not the case. With Native Americans this is especially true, because more than 500 different tribal cultural groups are often clustered in regions around the country. For this reason, within-state comparisons may be a more accurate indicator than national comparisons over time as a metric of any change in representation rates. The states of Alaska (~15.2%), Montana (~6.6%), New Mexico (~10.6%), Oklahoma (~9.2%), and South Dakota (~9.0%) have the largest Native American populations as a percentage of their overall populations (U.S. Bureau of the Census, 2013). As with African American and Latinx students, changes in proportionality from 2006 to 2016 have been variable. Oklahoma and Alaska remained relatively stable (0.95 and 0.19 to 0.98 and 0.19), New Mexico made improvement toward proportionality (0.51 to 0.65), and Montana and South Dakota showed worsening disproportionality (0.44 and 0.30 to 0.35 and 0.21). As with African American and Latinx representation rates, those for Native American students can best be described as variable or inconsistent (see Table 3 as well as figures for each demographic group on the OSF site).
Students with LEP or who are served under IDEA were not included in the 2009 Yoon and Gentry analysis, but results presented in Table 3 make clear that students from these groups are the most disproportionately underrepresented. These groups are unique when compared to racial/ethnic groups, in that some levels of English proficiency or specific disabilities might prevent a student from benefitting from gifted education services, whereas others might not. For example, if a student is not proficient enough in English to benefit from advanced math or science content instruction, then it might make sense for that student to not be identified at that point in time. However, if this is the case, then the school should be doing more to support that student’s strengths as well as his or her English-learning needs. Regarding disabilities and giftedness, there is a body of literature about students who are twice exceptional—that is, they have a disability and an identified gift (e.g., Baum, Schader, & Owen, 2017; Webb et al., 2005). Students with learning disabilities, behavioral disorders, attention deficits, dyslexia, and physical disabilities, for example, can also have gifts and talents (Baum et al., 2017; Baum & Olenchak, 2002). However, they frequently go underidentified due to masking effects—meaning the gift masks the disability, and the disability masks the gift (McCoach, Kehle, Bray, & Siegle, 2001). As a result, these students who are twice exceptional are at risk of appearing typical in ability, when in fact they are exceptional (Baum et al., 2017; Webb et al., 2005).
Looking at representation rates across the entire United States is complicated by the fact that there are few Federal policies regarding gifted education. In fact, most gifted identification and programming policies are at the state level, with some states mandating identification or services, as well as some partially or fully funding these mandates. It stands to reason that state laws, such as those to identify and/or provide services to those identified, would influence representation rates. Due to changes to state policy often being suggested as potential solutions to the problem of underrepresentation (e.g., Plucker et al., 2015), this seemed a reasonable factor to investigate. Unfortunately, the results regarding state policy in Research Questions 1 and 2 showed mixed differences between states that do and do not have state mandates. Table 4 presents average RIs by student subgroup for those states that mandate identification, those states that mandate gifted education services, and those states that mandate identification and services.
Representation Indices by State Mandates: 2015-2016 OCRDC.

Note. OCRDC = Office of Civil Rights data collection; LEP = limited English proficiency; IDEA = Individuals with Disabilities Education Act (Students with disabilities).
With regard to identification, there seems to be little relationship between a state mandate and proportionality. For example, Native American students were less represented in states that mandated student identification compared with those that do not (0.77 vs. 0.87). Similarly, students who were served as LEP and those concurrently served as gifted and under IDEA were less represented in states with mandated identification (LEP, 0.30 vs. 0.34; IDEA, 0.25 vs. 0.38), although the differences were fairly small. Alternatively, African American and Latinx students were better represented in states that had an identification mandate (0.66 vs. 0.48 and 0.60 vs. 0.58, respectively).
Table 4 shows no clear trend between mandated services and proportionality. The five racial/ethnic groups were all very similar regardless of service mandate (always within less than a tenth of a point). Differences across service mandates were only slightly larger for LEP and IDEA, in both cases students were better represented in states with no service mandate. States that mandated both services and identification showed nearly identical numbers to either individual mandate. All this suggests either state mandates have little influence on proportionality or the relationship is more complicated.
Discussion and Call to Action
There are three main takeaways from our research. The first is that past trends in disproportionality have continued with a few state-level exceptions. Second, simply having state mandates does not appear to translate to proportionality—the relationship can best be described as variable or inconsistent. Finally, a number of potential interventions exist to mitigate disproportionality, but most require additional large-scale study if past trends in underrepresentation are to be interrupted.
With regard to state mandates, Table 4 suggests no clear pattern. Although these data are purely descriptive in nature, the lack of any clear pattern between policy and proportionality suggests state-mandated gifted identification or services do not guarantee proportionality, and in some cases, are associated with even worse disproportionality. When states “mandate” gifted identification in all schools, underlying score differences, existing due to educational and opportunistic inequality, may result in disproportionality. In other words—mandated universal consideration could result in disproportional gifted populations because some groups have greater access to educational opportunities and, as such, perform higher on identification measures. It is also possible that even with identification or service “mandates,” the districts that implement with high fidelity are those that serve more advantaged groups, again resulting is disproportional representation (e.g., Fertig & Lewis, 2015). Finally, it is also possible that even when states do mandate identification, they leave so much control up to individual districts, the problems described in the literature review continue to act as barriers for students from traditionally underrepresented populations. A deeper policy evaluation is needed.
Before outlining steps that schools or states might take to mitigate disproportionality, it is important to note a prerequisite for any valid identification process: identification must be aligned to the programs and services provided to those identified students. This presumes that the goal of identification of students with gifts and talents is to locate students who have a need for, and would benefit from, a particular service. If this presumption is true, then alignment between the skills and abilities measured by the identification process and fostered in the resulting services must be maintained. If a district modifies its identification process to mitigate disproportionality but does so at the expense of no longer measuring skills needed for program success, then little has been gained (for a lengthier discussion of this issue, see Plucker & Peters, 2016). If the identification process is going to be differentiated to more proportionally identify students from certain subgroups, then services must be differentiated as well to ensure student success. Simply labeling a larger number of students is not the goal of gifted education. Instead, the goal is to develop the talents of and meet the learning needs of all students, some who require “gifted” or advanced educational interventions to have their needs met. Thus, the following set of interventions or policy changes have been suggested in the literature to improve the diversity of populations identified with gifts and talents.
1. Nominate and assess a larger number of students: Whatever the process is to determine eligibility, if you want to miss fewer students, formally evaluate as many as possible.
Across the country, the most common way to identify students as gifted and talented is through a two-stage process (NAGC, 2015). In such systems, students must first pass through a screening phase, and those who “qualify” are given a confirmation assessment to determine if they are eligible for gifted services. In addition to always harming the quality of the resulting identification system sensitivity (see McBee et al., 2016), this approach also disproportionately harms students from underrepresented populations. Some students who could pass the confirmation assessment are missed if they are not nominated (Card & Giuliano, 2016; Grissom & Redding, 2016).
While a 2018 report from the National Center for Research on Gifted Education (Gubbins et al., 2018) listed the adoption of universal consideration policies as its first recommendation for improving the identification of students with gifts and talents who are also English language learners, this approach is needlessly costly if the giftedness assessments are not part of the ordinary testing regime. Nominating the top 50% of students yields almost all the benefits of universal screening at a half the assessment cost. Nominating the top 30% of students represents a good compromise between assessment cost and identification system sensitivity in most realistic scenarios. Lowering the threshold necessary to be formally tested for program entry does not lower the evaluation/identification standards, it simply lowers the threshold necessary to be formally considered. In their 2016 article, McBee et al. showed that typical two-phase systems, in which only a small percentage of students are nominated, can miss the majority of students they are designed to find. A well-designed two-phase system, which nominates a relatively large proportion of students on the basis of characteristics closely related to what will be measured in the confirmatory testing phase, can be nearly as effective as universal consideration, and at a much lower cost.
2. Use local building norms: Instead of comparing student scores to the rest of the nation, compare them to the scores of other students at the same school.
When using national normative scores, the question asked is which students in this school scored higher than X% of other students in the nation? Moving to a building normative comparison changes the question to which students in this school are the most advanced compared to their peers in the same grade in the same school, therefore most likely in need of supplementary services?
One reason for underrepresentation is the segregation of schools combined with the use of national norms. Students of similar racial and income groups are increasingly attending schools where they are in the majority (Reardon, Robinson, & Weathers, 2015). Students affected by poverty also tend to score lower on tests of academic achievement or ability, which in turn leads to large numbers of schools dominated by traditionally underrepresented groups with few students identified as gifted and talented (Yaluma & Tyner, 2018). When national normative criteria are used for identification of students with gifts and talents, this often leaves some schools with few identified students and others with nearly 100% of students identified for gifted education.
A 2005 monograph from the National Research Center on the Gifted and Talented (Lohman) put it simply: national norms will disproportionately over-identify students at high-achieving schools and underidentify students in schools with overall low student achievement. Because students from underrepresented racial/ethnic groups and those from families with low incomes are more likely to attend schools in which achievement is low, the result is underrepresentation at the aggregate level (i.e., state or nation). Instead of taking the top X% of students based on a national norm, every school should seek to identify its top X% of students as gifted. Carman, Walther, and Bartsch (2018) showed that using local building norms all but eliminated identification disproportionality in one of the largest districts in the country. Building norms have the added benefit of making logical sense. Instead of saying that the top 5% nationally are always in need of special services (national norms), using building norms support the claim that the most advanced kids in every school, regardless of their level of achievement, are those most likely to be underchallenged in that school.
3. Use group-specific norms or criteria: Compare students only to those who have had similar opportunities to develop the skills being tested.
Using a building norm addresses the question: Which students in my school are the most advanced compared with their peers in the same grade in the same school? Using a building norm plus a group-specific norm addresses the same question but does so while trying to control for access and opportunity. In a recent analysis of one state’s data, researchers from the National Center for Research on Gifted Education found that modified identification criteria in the form of lower cut scores for students with LEP or from low-income families substantially closed the identification gap (Siegle et al., 2018). Similarly, a large Florida school district used universal screening plus a form of group-specific norms and substantially narrowed their identification gaps (Card & Giuliano, 2016).
Any time a national or local norm is used, children are typically compared to other children the same age or in same grade level. The rational for this is that “grade level” stands in as a proxy for opportunity. The challenge is that two students in the same grade level, even within the same school district, could have had vastly different educational experiences, both before and since they started school. Some may have had excellent preschool experiences, whereas others had none. Instead of comparing kids based on age or grade, another option to mitigate disproportionality is to compare each child to others of similar opportunity to learn. The federal definition of “giftedness” describes this as comparing students to others of similar age, experience, and environment (U.S. Department of Education, 1993). In other words, instead of comparing a Grade 3 student from a high-income family who had multiple years of preschool followed by 3 years of high-quality education to a student who had no preschool and a more average education, identification systems should compare each of these children to peers who have had similar opportunity to learn. In practice, this can translate to comparing low-income students only to other low-income students. This is not a politically easy thing to implement or explain to families because it can come across as penalizing students who are not from disadvantaged groups, but it would help mitigate disproportionality (Carman et al., 2018; Peters & Engerrand, 2016). The other important caveat is that in diversifying the population of identified students, group-specific norms will also result in a gifted student population with a wider range of learning needs. This may require a broader range of services or even support structures to assure the newly identified students are successful.
4. Implement multiple pathways: Multiple opportunities will always result in larger numbers of identified students.
The “multiple pathways” identification process can also be called the “or” combination rule because a student must meet only one of several criteria to be identified. For example, a student might qualify based on a test score, or on the basis of self-nomination, or through an alternative pathway, such as a portfolio. Any one of these pathways allows a student to access services (“or”) compared with earlier examples in which several criteria had to be met (“and”). Additionally, identification should begin early, and the process should continue throughout a child’s educational career. Finding students early, before they fall further behind (Wyner, Bridgeland, & Diiulio, 2007), can help ensure that their talents are recognized and nurtured. If identification is delayed, students miss out on opportunities to develop potential, further exacerbating achievement and identification disparities. Similarly, identification needs to be repeated as often as services are available. If gifted services exist in grades K–12, then annual, proactive identification should take place.
There are two important considerations to the “multiple pathway” option. First, it will identify additional students from all subgroups—not just those that were previously underrepresented—potentially negating any mitigation of disproportionality. This is a place where two methods can be combined: implement an additional pathway (“or” rule), but only for groups that have had fewer opportunities to develop their talents (alternative criteria for a target group). McBee, Shaunessy, and Matthews (2012) found that doing so mitigated underrepresentation in Florida, and Gubbins et al. (2018) recommended alternative pathways in addition to universal consideration as a way to increase the identification rate of gifted English language learners. Second, as with group-specific norms, an “or” rule will identify students with a wider range of learning needs than will an “and” rule or a single-pathway identification system. This wider range of learning needs and readiness may necessitate a wider range of services.
5. Diversify the teaching workforce: Students need teachers who look like them.
In 2016, the U.S. Department of Education detailed the racial diversity of teachers and students in the United States. In every state, the percentage of students of color exceeds that of the teachers who are, across the country, 82% White. Diversifying the teaching force can help close achievement gaps (Egalite, Kisida, & Winters, 2015), improve academic outcomes, and provide students with strong role models (Klopfenstein, 2008). With regard to gifted education disproportionality, as long as teachers remain a data point in student identification, diversifying the teaching force could support greater equity in gifted education. As noted by Grissom and Redding (2016), students from African American families are far more likely to be identified if they have same-race teachers. As long as teachers are still a substantial component in the identification process, a potential pathway to better racial/ethnic representation in gifted education is to have a teacher workforce the better mirrors the student population. A new program, Pathways to Teaching (Goings & Bianco, 2016), has shown promise for recruiting and retaining teachers of color, through working with high school students who are African American, Latinx, and Native American to encourage them to explore careers in teaching.
6. Proactively mitigate unequal opportunity: Schools can help mitigate the unequal access and opportunity that is the root cause of disproportionality.
The United States has the dubious honor of having some of the largest income-based achievement gaps in the world (Chmielewski & Reardon, 2016), and poverty is also predictive of gifted identification (Hamilton et al., 2017; Siegle et al., 2018). Students who have had the greatest access to early educational opportunities, both in and out of school, are also the most likely to be identified as gifted. One solution to the problem of disproportionality is to mitigate the effect that family income has on educational opportunities. If all students, regardless of financial capacity, can have their strengths, interests, and talents developed, then the influence of family resources can be mitigated. This involves placing gifted services in the 42% of schools in the United States that have no such programs, staffing those programs with knowledgeable, skilled, culturally competent teachers, and ensuring early talent development services are in place. These efforts should include high-quality, universal, early-childhood educational programs, some of which have been shown to mitigate achievement and honors enrollment gaps even into middle school (Gormley, Phillips, & Anderson, 2018).
Several approaches have shown promise in addressing disproportionality via frontloading educational opportunities for larger numbers of students from underserved subgroups (Plucker & Peters, 2016). In their 2018 review of the literature and exploratory study related to gifted English language learners, Gubbins et al. described such efforts: “Establish a preparation program prior to formal identification procedures that provides students with learning opportunities to enhance knowledge and academic skills necessary for a student to be recognized” (p. 21). Mitigating inequality of opportunity is always preferable to any kind of alternative identification after the fact. The primary downside is that mitigating unequal educational opportunities is guaranteed to cost more money and require more staff than some of the other efforts described above (e.g., building norms). Despite this challenge, below we highlight a sample of some promising practices that, if more widely implemented, could serve to mitigate disproportionality.
Scholar Identity Model™ and Institute
The scholar identity model (SIM: Whiting, 2006, 2014) is a psychosocial total cognitive change theory process. Through the mastery of the SIM’s nine constructs: Self Efficacy (Bandura, 1977), Future Orientation (Eccles & Wigfield, 2002; Grantham, 2004), Willing to Make Sacrifices (Dweck, 2000; Maehr, 1984), Internal Locus of Control (Rotter, 1966), Self-Awareness (Cooley & Ayres, 1988), Achievement > Affiliation (McClelland, 1961), Academic Self Confidence (Hrabowski, Maton, & Greif, 1998), Race Consciousness (Worrell, Cross, & Vandiver, 2001), and Masculinity/Gender Issues (Majors & Billson, 1993; Whiting & Lewis, 2008) and by engaging its four supporting pillars (family, school, community, and mentoring), students’ academic self-efficacy and engagement are taught, developed, nurtured, and supported. The SIM’s flexibility is ideal for assisting high potential children who are African American, Latinx, or Native American, all of whom often discuss feelings of isolation as the “only one” in gifted and talented services. Whether embedded in the curriculum or through the more deliberate Scholar Identity Institute, the outcomes include greater resiliency and engagement (Whiting, 2009, 2012).
Total School Cluster Grouping
Originally developed by researchers with the National Research Center for the Gifted and Talented (Gentry, 1999), the total school cluster grouping model offers a whole-school approach with early and continual identification of students, with the express purpose of helping all students achieve at higher levels, simultaneously supporting all teachers to use gifted education strategies with their students as they maintain high expectations (Gentry, 2014). This approach results in increased student achievement, more students being identified as high achieving, fewer students being identified as low achieving, and better proportions of students from underserved populations achieving at advanced levels. Research on this model has shown an increase in the numbers of students from traditionally underrepresented populations identified as gifted (Brulles, Cohn, & Saunders, 2010; Brulles, Peters, & Saunders, 2012; Collins & Gan, 2013; Matthews, Ritchotte, & McBee, 2013; Pierce et al., 2011), in part because it combines many of the actions described above: universal screening, multiple pathways, and proactive, early talent development.
STEM Starters+
In a recent, multiyear study funded by the Federal Javits program, Robinson, Adelson, Kidd, and Cunningham (2018) investigated the use of frontloaded engineering curricula on the achievement and gifted identification rate of first-grade students from low-income families. Although the work is ongoing, results to date are promising. They include increased science achievement and engineering knowledge of treatment students; recognition of advanced cognitive behaviors; and increased nomination of traditionally underserved students for gifted services. Engaging students in complex, engineering tasks seems to unveil talents among underserved students, resulting in higher achievement and better recognition of their talents by their teachers.
Limitations
There are limitations to the programs and steps we have described, primarily that they have not yet been widely implemented (a finding in its own right). We debated whether we could be so bold as to offer suggestions that “did not come directly from our data.” But our data, like those that have been reported previously, are descriptive in nature, and the results are consistent and troubling, which is why we chose to offer some steps to mitigate this longstanding and unacceptable condition of disproportional representation in the field of gifted education. We believe to do less is unethical. We suggest implementation, evaluation, and study of the literature-based suggestions we include in this article.
Additionally, the OCR data are limited to what is reported by schools, which means error likely exists. They also represent a wide variety of identification policies because few states mandate that all districts use the same process for identification. The data do not include the Bureau of Indian Education (2018) Schools that serve more than 41,000 Native American youth in the country; and until recently (2010 and earlier), populations of Native American Youth were so small that the OCR cautioned drawing conclusions from the data due to the inherent error in these small population sizes. The OCR data do not include identification rates by eligibility for federal meal subsidy, which is especially problematic given what is known about the relationship between poverty, achievement, and likelihood of being identified as gifted. This points to a critical need in the research literature: an investigation of the current demographic state of gifted education after controlling for relevant background factors (e.g., family income, prior academic achievement). Such a perspective has gained attention in the field of special education and should be similarly applied to gifted education (e.g., Morgan, Farkas, Hillemeier, & Maczuga, 2017).
Conclusion
The data presented in the results section make clear that, although the nation as a whole has not made progress toward greater proportionality, some states have improved. This is a finding that warrants additional research to better understand why some states are doing better than others (Plucker, Makel, Matthews, Peters, & Rambo-Hernandez, 2017). For example, some states, such as Minnesota, have legal mandates that require all schools to identify gifted and talented students and yet their African American RIs have declined. Similarly, Illinois had no state policy or mandate for gifted education when these data were collected (this has recently changed), but in 2016, African Americans were proportionally represented in gifted programs. What explains these state-level trends? What policies have been successful? What policies or actions can be implemented elsewhere to effect greater change? Each of these questions needs further study.
Similarly, the field would benefit from wider application of not only policy research in general but also well-designed, confirmatory studies designed to test hypotheses such as the idea that universal screening for gifted program eligibility will increase the demographic diversity of identified populations. Many of the promising interventions presented above need stronger empirical foundations. Perhaps the clearest take-away from this article is that simple, expanded awareness has not mitigated the problem of disproportionality. The topic is ubiquitous in gifted education circles, and yet, it persists. If the field of gifted education and K–12 education more broadly is concerned about inequity, then attention needs to be paid to inequity at advanced levels of achievement, including broad implementation of services designed to mitigate this inequity.
Footnotes
Declaration of Conflicting Interests
The author(s) declared the following potential conflicts of interest with respect to the research, authorship, and/or publication of this article: Currently, the first author serves as the Association Editor for the National Association for Gifted Children – the organizational publisher of Gifted Child Quarterly. However, this article was submitted prior to his term in this position and he played no role in its review or the decision to publish.
Funding
The author(s) disclosed receipt of the following financial support for the research, authorship, and/or publication of this article: Research support for this project was provided by the Untapped Potential Project.