
Abstract
Background:
Food security is a topical issue but one that can be difficult to measure.
Objective:
To develop a community-approved food basket tool and use this to investigate the availability and affordability of a healthy diet in a multicultural urban setting.
Design:
A 7-day healthy food basket (HFB) containing 96 foods for six household types was developed through focus groups (n = 6) with local residents recruited via the local health service and community organisations. A total of 41 stores were surveyed against the recommendations of the HFB. The availability and price of core food groups and energy dense discretionary foods were analysed.
Setting:
A multicultural area in Central London with a high concentration of socially and economically deprived households.
Results:
Healthy food for a variety of minority ethnic diets was available in the study area, although only one supermarket and three online stores stocked the full basket. Discretionary foods were readily available and often cheaper than healthier options. The largest proportions of cost were attributed to protein foods (30%–38%) and fruit and vegetables (20%–27%). Most foods in the HFB were cheaper at larger supermarkets, although fruit and vegetables cost less at markets and local stores. Total basket price varied greatly between stores, with cost savings achieved when buying from at least three stores.
Conclusion:
Economically disadvantaged members of the community may be excluded from accessing a healthy diet rather than cheaper foods that are energy dense and low in nutrients, particularly if they are unable to shop around. These findings provide insight for the development of voluntary sector partnership programmes, community education and local policy planning.
Introduction
Nutrition is a key determinant of health. Poor dietary intake is associated with deaths from heart disease and cancer (World Cancer Research Fund, 2007) and increased falls and fractures in the elderly (Meijers et al., 2012). Inequalities in diet further exacerbate health inequalities (Faculty of Public Health, 2005). Recent national UK surveys show a clear socio-economic gradient whereby lower income households consume higher fat foods and less fruit and vegetables (DEFRA, 2013). In 2012, UK households spent an average 12% of their income on food and non-alcoholic drinks (DEFRA, 2013). In the lowest income households, the percentage spent on food and non-alcoholic drinks was as much as 17%. This percentage may rise further as food prices increase (Lang and Schoen, 2014), and this rise may affect lower income households’ budgetary capacity to achieve a nutritionally adequate diet (Drewnowski and Darmon, 2005; Hirsch, 2011; Jones et al., 2014). Low household income household has consistently been found to be a significant contributor to household food insecurity in other high-income nations including the USA, Canada, New Zealand and Australia (Carter et al., 2010; Kettings et al., 2009; Palermo and Wilson, 2007).
Recently, in the UK, there has been a rise in food bank usage (London Assembly, 2013) linked to welfare reform by observers (Field et al., 2014) although firm evidence to support this link is limited (Lambie-Mumford et al., 2014). In high-income countries, food insecurity is known to correlate with social risk factors for poor health, including being of minority ethnic background (Nord, 2014), living in a low-income household (Tingay et al., 2003), being older (Lee and Frongillo, 2001; Whelan et al., 2002), a lone-parent (Dowler, 1997) or experiencing social isolation (Lee and Frongillo, 2001).
‘Food poverty’ and ‘food insecurity’ are terms used interchangeably within the literature (Jones et al., 2013; Maxwell, 1996). Both terms agree households’ experience of this includes limited or uncertain physical or economic access to enough safe, nutritious food for a healthy, active life (DEFRA, 2006).
In the absence of a standard measurement of food insecurity at a household level (Jones et al., 2013), food baskets can be a useful indicator of cost and availability of a healthy diet (Anderson et al., 2007; Bowyer et al., 2009). Different food basket tools have been proposed to assess local or regional risk factors for food insecurity. In addition to food baskets reflecting mainstream diets, minority ethnic food baskets have been proposed including those developed with Black Caribbean, Black African (Bowyer et al., 2009), Turkish (Bowyer et al., 2009) and South Asian (Dowler et al., 2001; Oldfield et al., 2001) communities in mind. Healthy food baskets (HFBs) that comprise commonly consumed foods to meet national dietary guidelines have also been used to measure food cost and availability in the USA (Beaulac and Kristjansson, 2009), Australia (Harrison et al., 2007; Palermo and Wilson, 2007) and Scotland (Anderson et al., 2007).
Health promotion activities to address food insecurity and protect those most at risk of lifestyle diseases can be carried out locally and nationally. When conducting local health initiatives around diet, in addition to affordability, the acceptability of suggested diets is important for adherence (Maillot et al., 2010). Few studies have included a consensual approach to developing a HFB. Oldfield et al., (2001) consulted Muslim communities in East London to consider the cultural amendments for a Minimum Income Standard (MIS) for this group, providing valuable information on Bangladeshi diets. In developing a MIS for a socially acceptable standard of healthy living (Hirsch, 2011), Bradshaw et al. (2008) used a consensual approach with community focus groups to devise lists of commonly consumed items and quantified these to meet nutritional requirements. Lists were kept realistic by including snack foods and alcohol. The MIS food lists were unsuitable for this study as prices were only from online sources, and study participants were drawn from small UK towns and rural areas without the ethnic diversity seen in the current study area – five wards in an inner London borough (in North Kensington) home to approximately 45,000 people, of whom 62% are financially vulnerable (Office for National Statistics, 2011). A service review was deemed necessary by the local public health nutrition team because of increasing concern about food insecurity in the wake of the UK financial crisis and fiscal reviews. Elderly residents and new migrants in the current study area had previously been identified by health services as having a high food insecurity risk, although the key factors for their risk of food insecurity would require clarification in order for effective interventions to be devised.
The aim of this study was to develop a HFB tool to measure household food security using input from community members of a range of minority ethnicities. This study then aimed to map affordability, physical access and availability of the new HFB by multicultural low-income households.
Methods
Community consultation
The HFB was to contain items relevant to the local community. In all, 42 local residents participated in six focus groups to determine a representative local diet. Ethical approval was sought from the lead research organisation, a National Health Service (NHS) Trust, but not required for the study, being a service evaluation. Research participants were informed that their opinions and contributions would be kept confidential and that individuals would not be identifiable in the published results.
Focus group participants were recruited via local organisations and NHS community services. Participation was incentivised with grocery vouchers. All who agreed to take part were organised into focus groups. The lead researcher (A.G.) attended all focus groups with another facilitator. Each focus group had unique characteristics such as (1) Caribbean, (2) older women, (3) single men, (4) mothers, (5) parents and grandparents and (6) older people. Focus groups were activity based. Participants were shown items included in the MIS food basket (Centre for Research in Social Policy, 2008). Foods were displayed in their packaging, and participants indicated those they ate weekly. Foods not displayed that participants consumed weekly were recorded. Consensus across focus groups was assumed to indicate commonly eaten foods, and these were incorporated into the basket. Frequency and portion sizes were emphasised less as final baskets were adjusted to meet dietary recommendations. Recordings were transcribed verbatim and transcripts were analysed using framework methodology; results are to be published elsewhere.
Selection of survey area
To focus on food security, North Kensington, a socially and economically deprived area within the neighbourhood, was determined from local data (The Royal Borough of Kensington and Chelsea, 2011) and was the setting for phase 2, the HFB survey. The population under study has low average income and a high rate of migration into and out of the community. The survey area was identified by choosing four central points known to the community (two primary schools, a community centre and sheltered housing block). All shops within a 400-m radius were surveyed: 33 stores and 1 marketplace. In addition to these central points, five stores and two marketplaces frequently identified in focus groups were included in the survey.
Development of a consensual HFB
Results from focus groups were used to develop 7-day menus for six case study households reflecting national nutrition recommendations. The case study households represent those in the study area more likely to be affected by low income, and these are (1) lone female parent, three children – British diet; (2) two parents, two children – British diet; (3) lone female parent, three children – Moroccan diet; (4) pensioner couple – British diet; (5) lone male pensioner – British diet; and (6) lone male pensioner – Caribbean diet. North Kensington is home to the largest Moroccan community in the UK. It also has a large Caribbean population whose members often have a low income. Community consultation revealed that Moroccan families often ate foods traditional to this ethnic group. A traditional Caribbean diet was usually followed by older Caribbeans. Therefore, the Moroccan HFB was compiled for the lone-parent household and Caribbean diet for the male pensioner household.
The research team included state registered dietitians and nutritionists who analysed the menus using nutrition composition software (Dietplan, Forestfield software limited) ensuring compliance with national nutrition recommendations for each household member in the case study households. Nutrition analysis was also checked against the Eatwell Plate (Public Health England, 2013) for composition by food group and against dietary reference values for energy, micro- and macro-nutrients (Department of Health, 1991; Health Knowledge, 2011; Scientific Advisory Committee on Nutrition [SACN], 2011).
Foods identified by focus groups were used wherever possible with portion sizes adjusted by a dietitian until final menu plans met nutrition recommendations. This included reducing salt content and increasing polyunsaturated fat content. A complete list of foods including quantities for each case study household was produced, comprising the HFB. HFB correlation to local minority ethnic diets was checked for acceptability through dietitian-led individual interviews with participants who attended three different nutrition education programmes over a 2-week period. The interviewees were not involved in the initial focus group consultation. The final HFB included 96 products from all Eatwell Plate food groups.
Collection of the HFB
The HFB survey was carried out in-store using a computer tablet with a locally created collection tool installed. Surveyors were four final year nutrition students who all received standardised training from the lead researcher (A.G.). Permission from store managers was obtained prior to conducting the survey in October 2013. Stores surveyed were 4 online supermarkets; 6 large supermarkets and 5 small supermarkets covering the market-leading brands (DEFRA, 2013); 14 speciality stores (butchers, greengrocers and minority ethnic speciality foods); 9 convenience stores; and 15 market stalls (across 3 markets). Online stores were included for comparison as they were more likely to have a complete HFB, and services may consider increasing access to these should the cost of healthy food be lower. For optimum value, larger packet sizes were chosen where the HFB would allow for the contents to be used by the case study household. The total number of packets needed by each household to meet nutrient requirements for 7 days was calculated. For most products, the cheapest brand available was selected, but for 15 products, the market-leading brand was included reflecting focus group preferences and allowing direct comparison between stores. The availability and price of the HFB for each case study household were analysed in Excel 2010 by area and store type. Median price was calculated for each store type. Items were substituted for a predetermined standard equivalent where missing. The final price of the HFB for each household was calculated for the amount needed for 7 days including waste. Remaining non-perishable foods were not included in the price.
Results
Focus group outcomes informed the final HFB
Community consultation revealed that foods commonly eaten by focus group participants were mostly similar to foods included in the MIS food baskets (Centre for Research in Social Policy, 2008). The foods identified by two or more groups, with group consensus, were incorporated into the HFB, including 15 branded items. Foods in the MIS basket eaten by few or no focus group members were removed. The final HFB for each case study household contained a combination of foods in appropriate quantities to meet energy and nutrient recommendations. The full list of items is shown in Table 1. 1
Products included in the healthy food basket (HFB) for each case study household for 7 days.

Specific brand included.
Availability and quality
All 96 products in the HFB survey were available in the study area. The number of items missing in each store type varied. Many products were widely available across locations and store types. However, speciality vegetables (e.g. green bananas and cassava) were generally less available than others. Halal chicken was not always available in supermarkets. Three (of four) online stores and one (of six) large supermarkets stocked the full HFB. Items missing in supermarkets were mostly fruit and vegetables, particularly vegetables in the Moroccan and Caribbean baskets. Speciality vegetables and halal chicken were commonly available at markets and butchers. Of the nine convenience stores, six did not stock any fresh fruit and vegetables.
Price by store type
Fruit and vegetables purchased from any of the three markets surveyed were cheaper than other store types. Of the 23 fresh fruit and vegetable products, 16 were cheapest at markets (Table 2). Convenience stores and small supermarkets cost most for all food groups. The cost of the basket at a large supermarket depended on the supermarket chain and was not always cheaper than small independent stores. The price online was less than in the large high-street version of the same supermarket chain, and online supermarkets were cheapest for shelf products. Meat and fish were as cheap or cheaper in butchers and fishmongers than large supermarkets. Halal chicken was often cheaper than non-halal. Sweet potato was one of the few speciality vegetables that was comparatively costly, approximately twice as expensive as potatoes. Healthy snacks (yoghurt, fruit and vegetables) were similarly priced to unhealthy snacks (crisps, biscuits and chocolate bars). Unhealthy snacks were more likely to be available in convenience stores than fruit, vegetables or yoghurt. Large supermarkets and online stores had the lowest prices for snacks. The lowest median price for a snack (per serve), by store type, was two sweet biscuits (6 pence) from an online supermarket and 30 g raisins (7 pence) from a small supermarket. Fresh fruit ranged from 9 pence to 53 pence per recommended portion (NHS, 2013) based on weight of a medium piece of fruit in Dietplan 7.
Range in price (GBP) of fresh fruit and vegetables a per kilogram by store types.
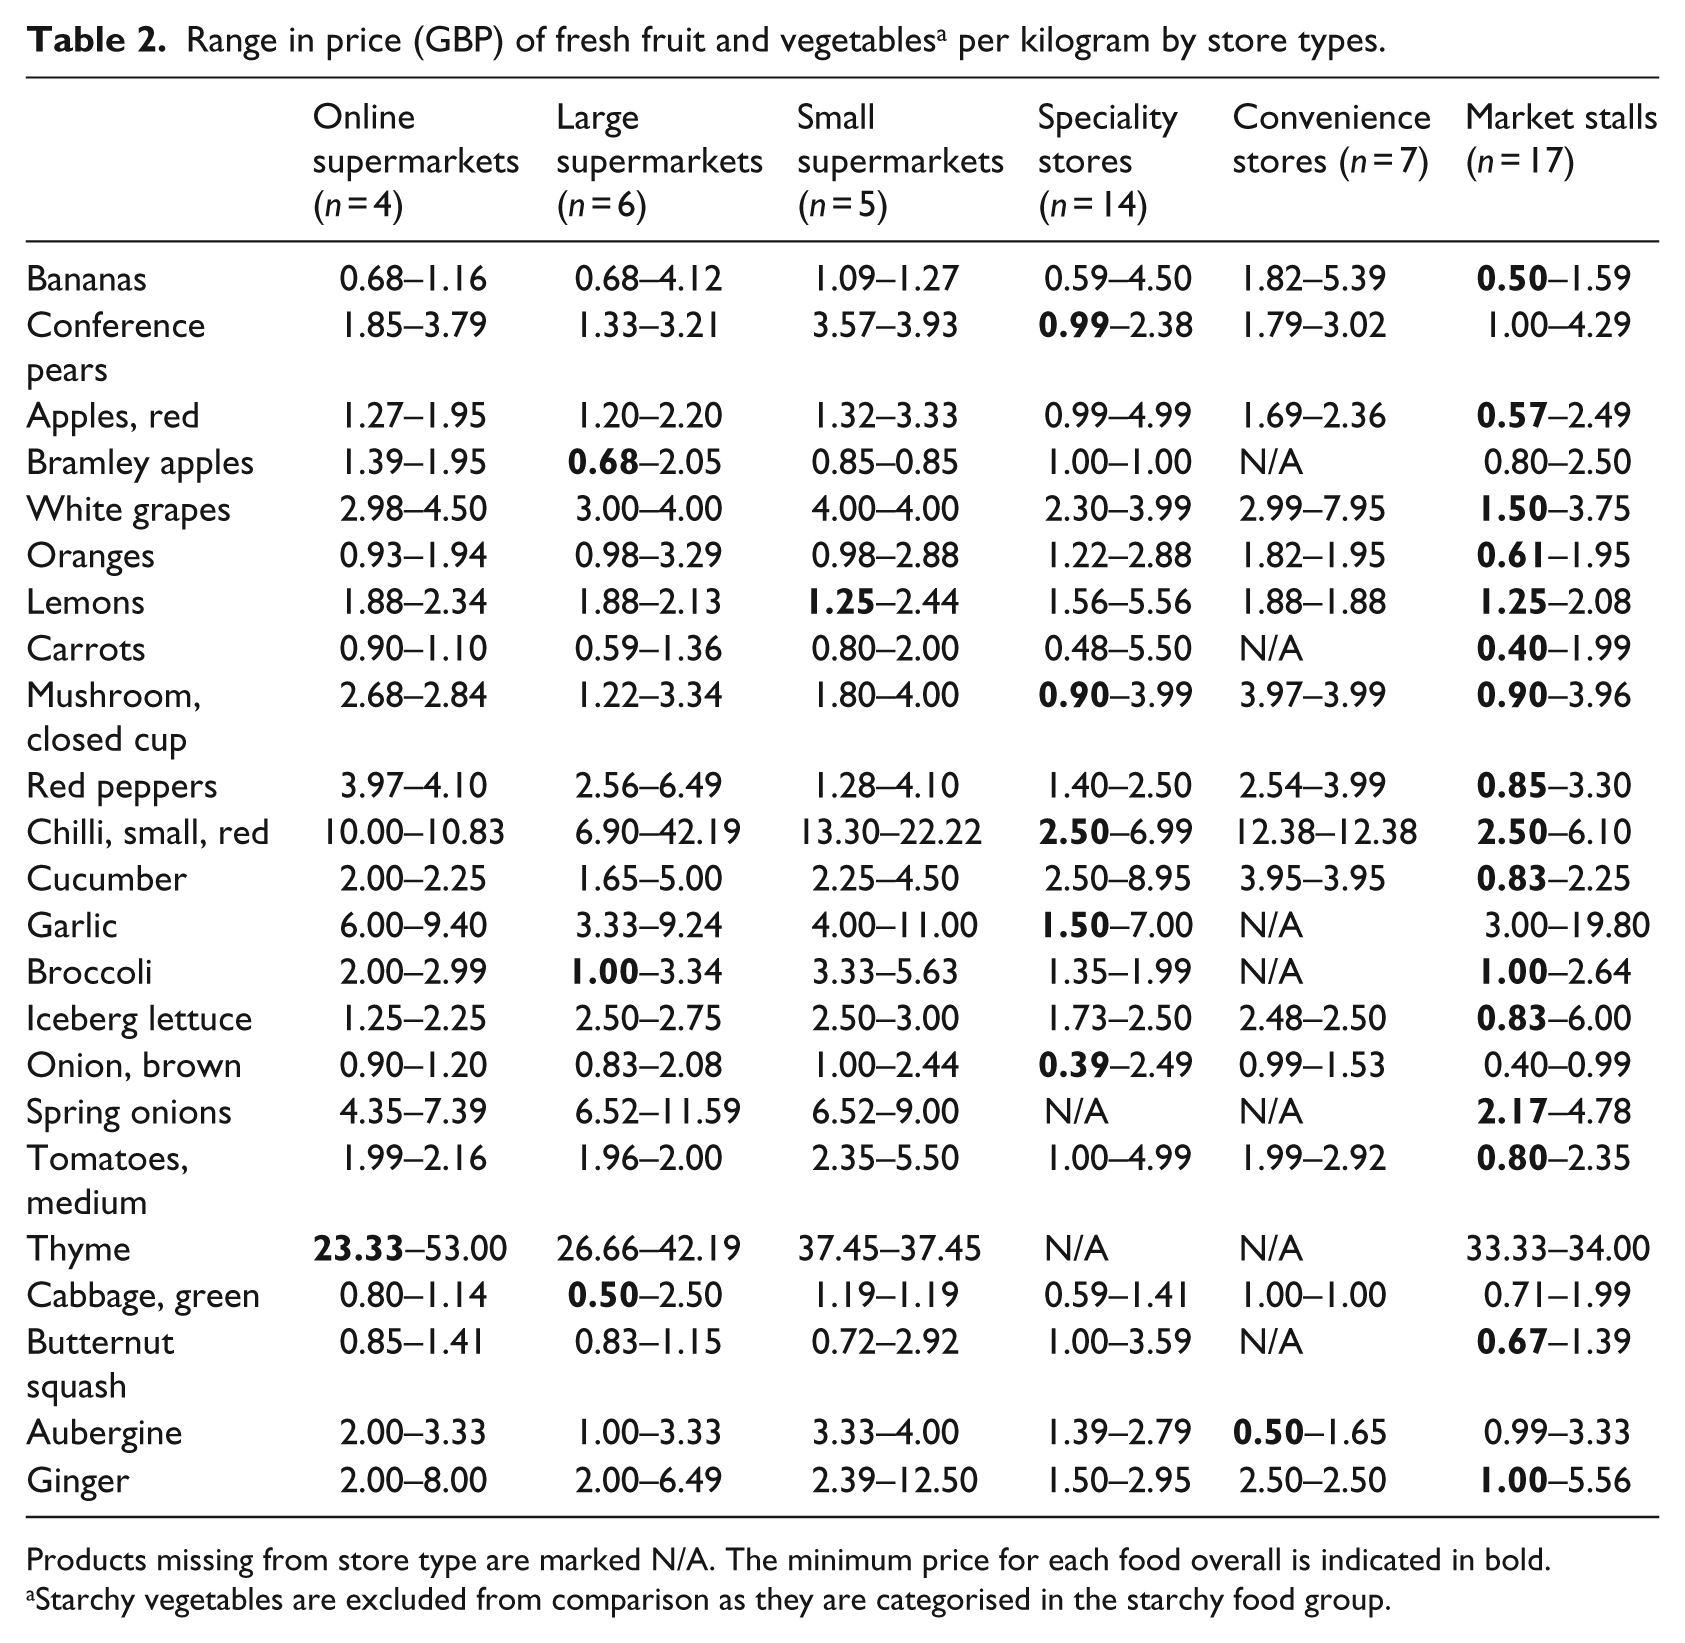
Products missing from store type are marked N/A. The minimum price for each food overall is indicated in bold.
Starchy vegetables are excluded from comparison as they are categorised in the starchy food group.
Results for six case study households
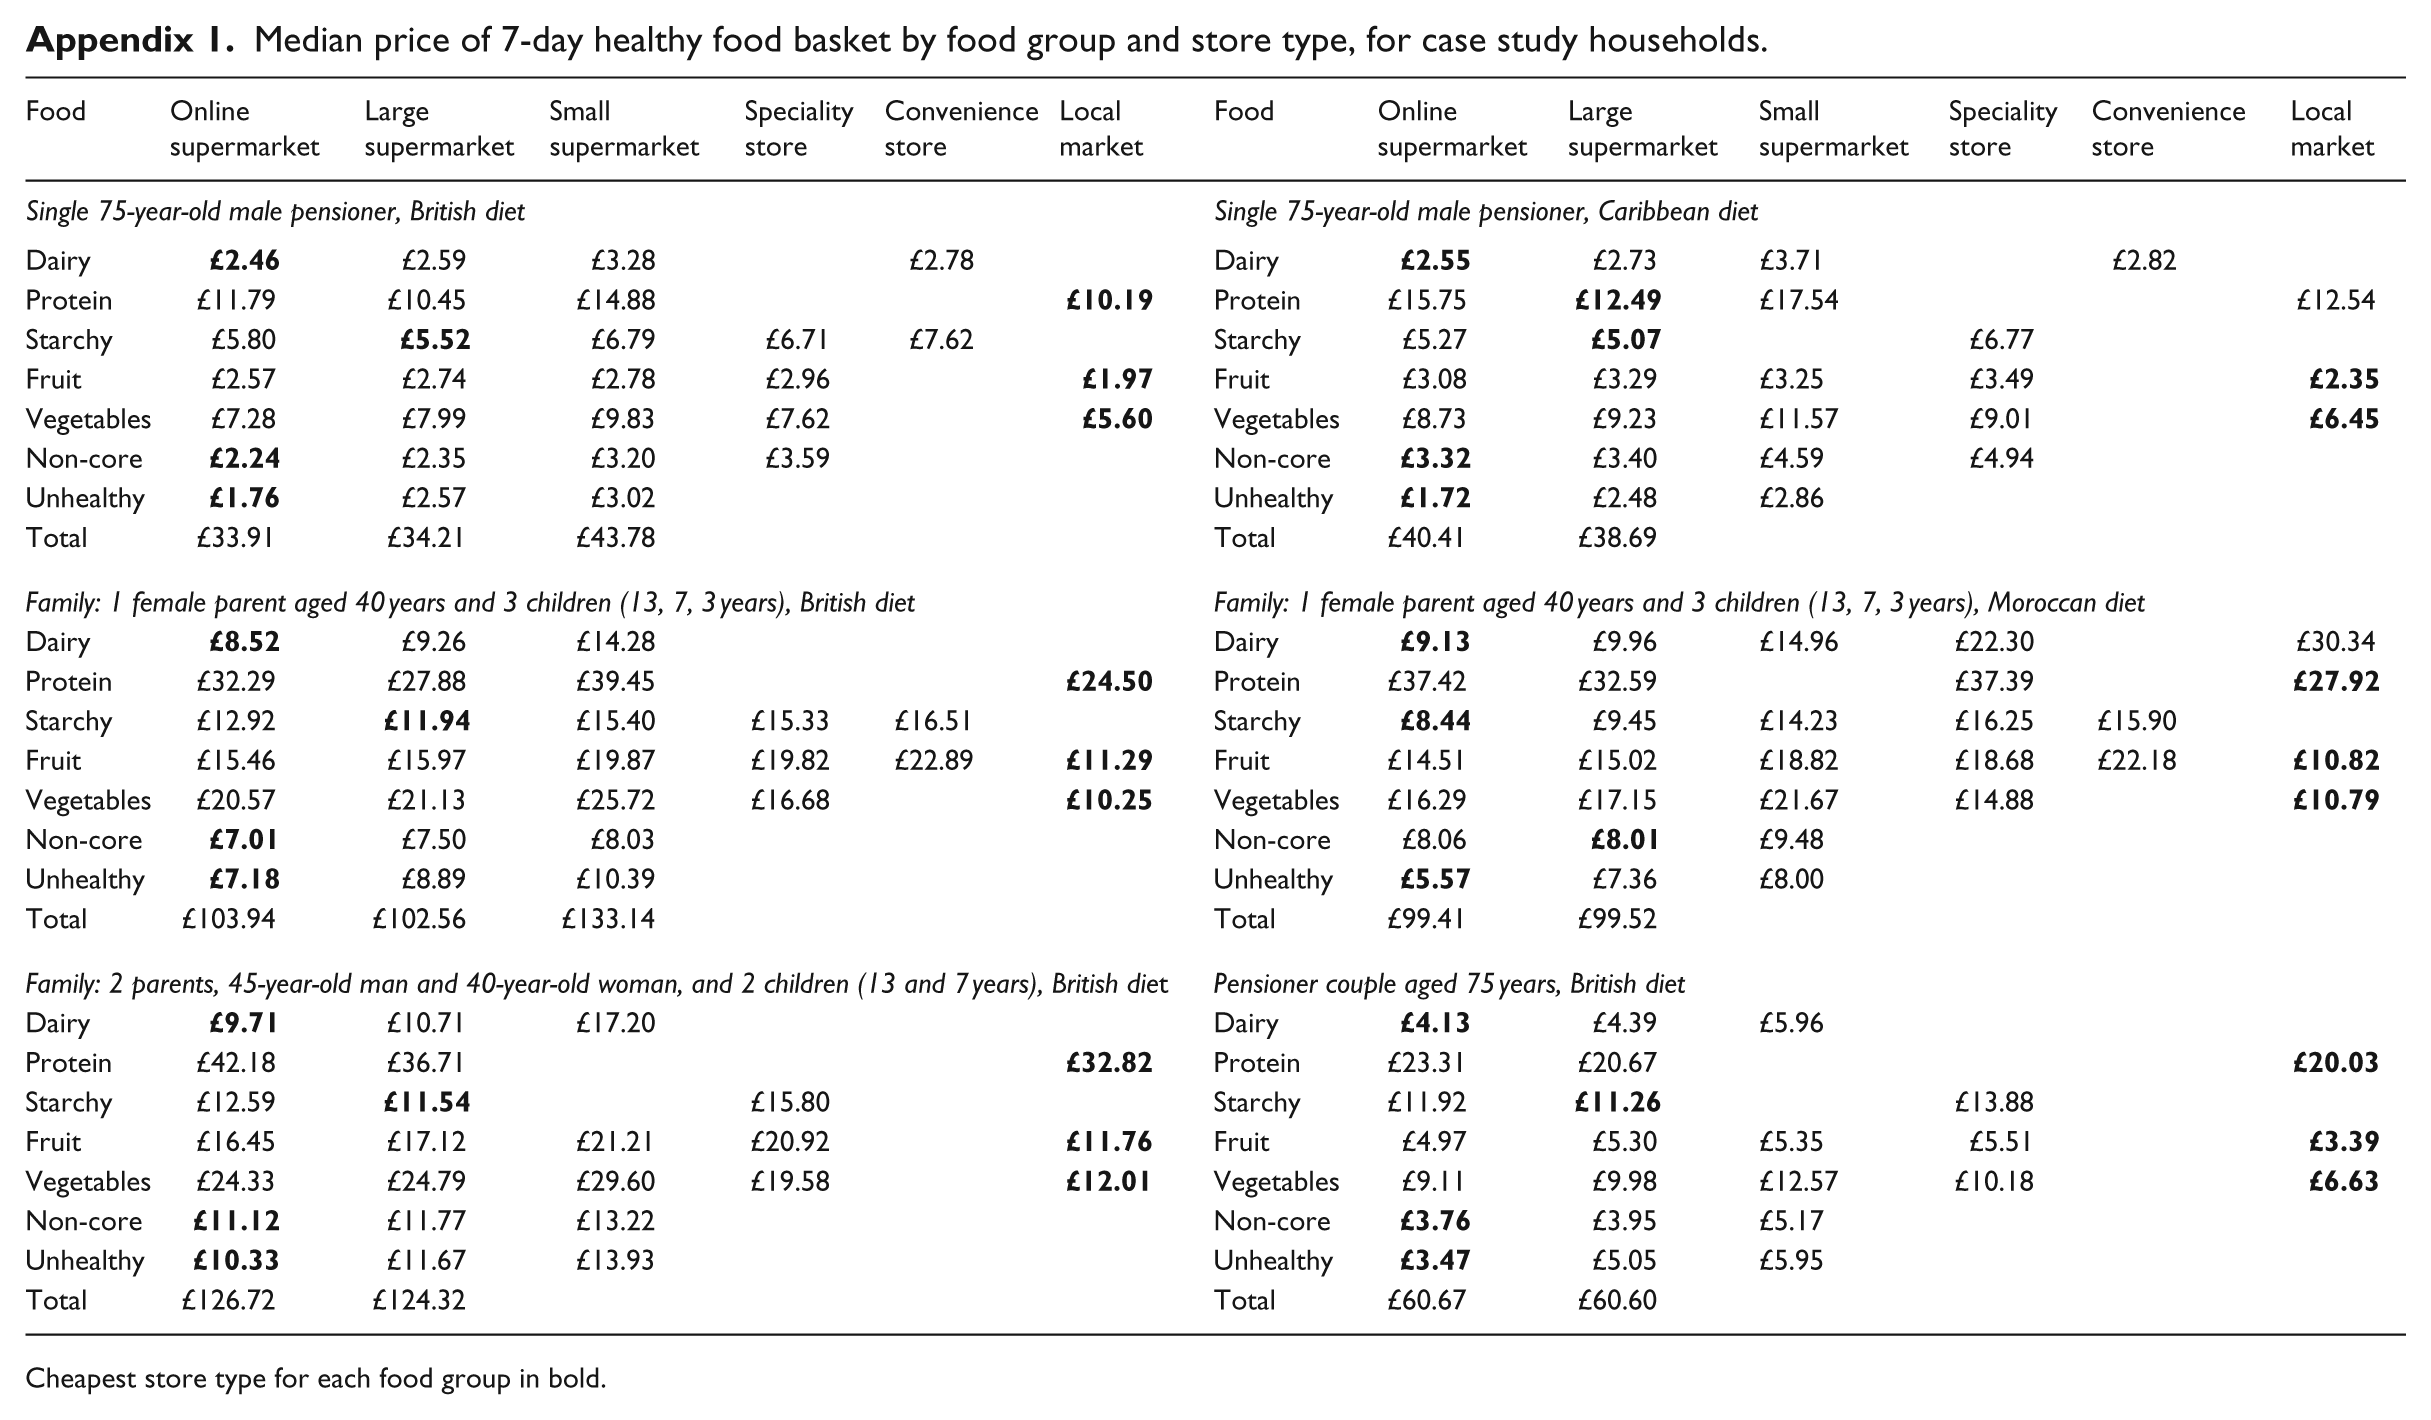
For the lone-parent household, the median Moroccan diet price, when purchased from the cheapest possible combination of shops, was comparable to the British diet – £80.68 versus £80.69, respectively (Appendix 1). The Caribbean diet costs more than the British diet for a single male pensioner (£33.95 vs £29.74). This was mostly due to the larger quantities of fresh herbs and spices in the Caribbean HFB. The pensioner couple HFB costs £52.67, while the single male pensioner HFB costs £29.74. Two adult and two children HFB was £99.30 versus £80.69 for the sole adult household (extra toddler in this household). Protein foods (meat, fish and eggs), fruit and vegetables made up the largest cost. Protein foods cost 30%–38% of the median price of a basket, and fruit and vegetables cost 20%–27% of the basket.
Discussion
This study developed a nutritionally complete HFB using community consultation, refined to reflect a healthy diet and checked for acceptability through a second consultation with the local population. Locally consumed foods were mostly consistent with findings from previous HFB studies (Bowyer et al., 2009; Bradshaw et al., 2008). However, our HFB had a larger component of herbs, fresh vegetables and fish as well as ‘unhealthy’ foods, reflecting local practice and providing a more accurate picture of the real-life cost of eating. Although frozen or canned fruit and vegetables are often cheaper than fresh versions, they were not acceptable to focus group participants who did not commonly eat them. Therefore, another unique element was that many fresh fruit and vegetables were included in the basket.
The HFB was widely available, but the cost of fruit, vegetables and lean protein foods was high. This suggests that food insecurity leads to unhealthy diets rather than food insufficiency (Bowyer et al., 2009; Dowler and O’Connor, 2012). Availability of choice at a store had an impact on the cost of an item. For example, the big savings seen from online supermarkets compared to large high-street versions of the same chain were largely because the full range of generic items was available as were the range of packet sizes. Significant savings could be made by shopping around, placing a disproportionate financial burden on the time-poor, those unable to travel and new migrants less familiar with the area (Nord, 2014). These findings support conclusions reached by the Greater London Authority (2013), Jones et al. (2013) and Drewnowski et al. (2012) that food insecurity is symptomatic of personal poverty and of environmental issues around supply and cost of healthier foods. The basket costs less per head in larger households, placing single occupant households (particularly the elderly) at higher risk of food insecurity. Community programmes should, therefore, seek to ease the burden of the extra expense as well as alleviate the impact of social isolation for this group.
It was of note that fruit, vegetables and protein foods were found to be more costly online. These items deserve particular attention as they are essential for a healthy diet and collectively accounted for the majority of the cost of the HFB. Although markets were found to be most economical for purchasing fruit and vegetables, there were some logistical difficulties here including limited availability at some stalls, difficulty in interpreting pricing and price variability within markets. This would clearly disadvantage those with mobility issues or reduced ability to interpret pricing, further complicating the impact of limited funds on food. Fruit and vegetable consumption is falling. Households with the lowest incomes purchase less fruit and vegetables, on average just 2.9 portions per person per day (DEFRA, 2013). The same study found that the main food issue of concern to respondents was food prices, supporting a need for food security interventions in marketplaces to promote lower price produce and improve pricing transparency. In this neighbourhood, promoting a return to local stores and markets would improve affordability of healthier foods as well as increase local capacity to influence food supply.
Interestingly, it was protein foods that accounted for the largest cost in the basket rather than fruit and vegetables as seen in previous international studies (Harrison et al., 2007; Palermo et al., 2008; USDA, 2007). This is likely to be in part due to differences in dietary recommendations.
The high cost of protein foods in the basket may cause low-income households to substitute high-quality protein for cheaper alternatives often high in saturated fat and salt. Results from this study can be used in food security interventions to highlight the cheapest protein sources, which were not intuitive, being a large supermarket for some items and butchers or fishmongers for others. Food security interventions could include information on vegetarian protein options available in the local area. Food security programmes could enable people to bulk-buy staple items online to save on these foods and limit delivery charges incurred from online purchasing by reducing the frequency of orders.
Healthy and unhealthy snacks were approximately the same price. Unhealthy snacks (crisps, biscuits and chocolate) were more available in convenience stores than healthy snacks. The results suggest that high intake of unhealthy snacks may be linked to availability, convenience, child pressure and lack of planning not just actual cost. Heavy reliance on convenience stores, particularly for snacks, is likely to increase obesity risk. The cheapest foods were long life starchy foods and should be incorporated in low budget healthy diets.
The study area is in the top 7% of socially and economically deprived wards in London (Greater London Authority, 2010). The combination of extreme wealth and poverty in this condensed urban area presents large inequalities and can contribute to isolation and reduce availability of affordable options. As evidenced by the price of protein foods, fruit and vegetables in this study and in line with previous findings (Food Standards Agency, 2007), nutrients most likely to be lacking in diets of people with a small food budget in the study area are iron, zinc, vitamin B12, folate, protein as well as fibre. This supports wider findings that those suffering from food insecurity are at increased risk of malnutrition rather than undernutrition, putting them at risk of lifestyle diseases such as obesity that are associated with disproportionate intake of high-fat and high-sugar foods (Food Standards Agency, 2007).
It should be noted that the HFB survey provides insight into the ability to afford an acceptable healthy diet; however, other factors also influence whether a healthy diet is followed. These other factors include cooking methods and eating meals outside the home and may have a considerable bearing on the overall diet.
This study adds to the literature by way of combining an HFB survey with a consensual local diet. It had been acknowledged previously that theoretical published diets often do not reflect actual experience (Rydén and Hagfors, 2011). The major strength of this study was that the HFB is representative of local diets, meaning the final price estimates are likely to reflect real life, and results can be used directly in food security programmes. There were a large number of stores surveyed in this study including all store types present. Standardising training and collection tools used by surveyors improved consistency and accuracy and provides an opportunity to repeat this study. Following the creation of this tool, it would be useful to repeat the study to monitor changes in prices and availability and to evaluate food access interventions.
Limitations
Collecting a HFB for the full range of household compositions in the area was outside the scope of the study; therefore, a conclusion regarding the precise household compositions that were most at risk of food insecurity was not reached. However, smaller households had a higher cost per person than larger households. As with all HFB tools, this newly created tool is useful for estimating the cost of eating healthily, identifying risk factors for food insecurity and tracking changes over time. The HFB cannot be used as an assessment tool for defining food insecurity. No seasonality data were collected, but this was controlled for by collecting over a short (3-week) time period. It was also not possible to model average or minimum prices per store type due to high numbers of missing items in some stores. Therefore, an approach reflecting shopping routines was taken. The median price for food groups was calculated to avoid inclusion of outlying prices. The Central London location of this study is an area of heavy traffic, low car ownership and plentiful public transport. It is likely that this had a significant bearing on shopping routines. The study findings are, therefore, specific to areas of this type and are likely to differ significantly from suburban or rural areas in terms of population and transport.
Conclusion
Findings indicate that a nutritionally complete diet for a range of minority ethnic diets was available locally. The price of fruit, vegetables and lean protein foods was particularly high, cumulatively 57%–63% of the total cost. Therefore, households at risk of food insecurity are unlikely to afford a nutritionally complete diet. The cheapest baskets included fruit and vegetables from markets, protein foods from large supermarkets and online long life and dairy foods. Results suggest that avoiding small supermarkets and convenience stores in this neighbourhood to save money and moving from large supermarkets to local speciality stores (greengrocers, butchers and fishmongers) may create savings. High levels of literacy, numeracy and decision-making skills are, however, required to compare prices, and it may be necessary to shop in at least three store types to reduce costs. Because of this, when coupled with low available funds, the elderly, those with restricted access, time-poor households and those without Internet access are at the highest risk of food insecurity.
This study was undertaken to inform local delivery of food security interventions, although the authors note that policy-makers will also play an important role in increasing access to healthy foods through price and availability. The key findings from this study have been incorporated into local dietetic education groups and nutrition training for volunteers. There are plans to work with local food banks and other community organisations to ensure that findings which can help local people locate healthy more affordable options are included in their client information. Results indicate that food insecurity interventions in the area should include a combination of advocacy for a minimum acceptable income and for local markets coupled with local consumer advice on reducing food costs.
Footnotes
Appendix
Median price of 7-day healthy food basket by food group and store type, for case study households.
| Food | Online supermarket | Large supermarket | Small supermarket | Speciality store | Convenience store | Local market | Food | Online supermarket | Large supermarket | Small supermarket | Speciality store | Convenience store | Local market |
|---|---|---|---|---|---|---|---|---|---|---|---|---|---|
| Single 75-year-old male pensioner, British diet | Single 75-year-old male pensioner, Caribbean diet | ||||||||||||
| Dairy |
|
£2.59 | £3.28 | £2.78 | Dairy |
|
£2.73 | £3.71 | £2.82 | ||||
| Protein | £11.79 | £10.45 | £14.88 |
|
Protein | £15.75 |
|
£17.54 | £12.54 | ||||
| Starchy | £5.80 |
|
£6.79 | £6.71 | £7.62 | Starchy | £5.27 |
|
£6.77 | ||||
| Fruit | £2.57 | £2.74 | £2.78 | £2.96 |
|
Fruit | £3.08 | £3.29 | £3.25 | £3.49 |
|
||
| Vegetables | £7.28 | £7.99 | £9.83 | £7.62 |
|
Vegetables | £8.73 | £9.23 | £11.57 | £9.01 |
|
||
| Non-core |
|
£2.35 | £3.20 | £3.59 | Non-core |
|
£3.40 | £4.59 | £4.94 | ||||
| Unhealthy |
|
£2.57 | £3.02 | Unhealthy |
|
£2.48 | £2.86 | ||||||
| Total | £33.91 | £34.21 | £43.78 | Total | £40.41 | £38.69 | |||||||
| Family: 1 female parent aged 40 years and 3 children (13, 7, 3 years), British diet | Family: 1 female parent aged 40 years and 3 children (13, 7, 3 years), Moroccan diet | ||||||||||||
| Dairy |
|
£9.26 | £14.28 | Dairy |
|
£9.96 | £14.96 | £22.30 | £30.34 | ||||
| Protein | £32.29 | £27.88 | £39.45 |
|
Protein | £37.42 | £32.59 | £37.39 |
|
||||
| Starchy | £12.92 |
|
£15.40 | £15.33 | £16.51 | Starchy |
|
£9.45 | £14.23 | £16.25 | £15.90 | ||
| Fruit | £15.46 | £15.97 | £19.87 | £19.82 | £22.89 |
|
Fruit | £14.51 | £15.02 | £18.82 | £18.68 | £22.18 |
|
| Vegetables | £20.57 | £21.13 | £25.72 | £16.68 |
|
Vegetables | £16.29 | £17.15 | £21.67 | £14.88 |
|
||
| Non-core |
|
£7.50 | £8.03 | Non-core | £8.06 |
|
£9.48 | ||||||
| Unhealthy |
|
£8.89 | £10.39 | Unhealthy |
|
£7.36 | £8.00 | ||||||
| Total | £103.94 | £102.56 | £133.14 | Total | £99.41 | £99.52 | |||||||
| Family: 2 parents, 45-year-old man and 40-year-old woman, and 2 children (13 and 7 years), British diet | Pensioner couple aged 75 years, British diet | ||||||||||||
| Dairy |
|
£10.71 | £17.20 | Dairy |
|
£4.39 | £5.96 | ||||||
| Protein | £42.18 | £36.71 |
|
Protein | £23.31 | £20.67 |
|
||||||
| Starchy | £12.59 |
|
£15.80 | Starchy | £11.92 |
|
£13.88 | ||||||
| Fruit | £16.45 | £17.12 | £21.21 | £20.92 |
|
Fruit | £4.97 | £5.30 | £5.35 | £5.51 |
|
||
| Vegetables | £24.33 | £24.79 | £29.60 | £19.58 |
|
Vegetables | £9.11 | £9.98 | £12.57 | £10.18 |
|
||
| Non-core |
|
£11.77 | £13.22 | Non-core |
|
£3.95 | £5.17 | ||||||
| Unhealthy |
|
£11.67 | £13.93 | Unhealthy |
|
£5.05 | £5.95 | ||||||
| Total | £126.72 | £124.32 | Total | £60.67 | £60.60 | ||||||||
Cheapest store type for each food group in bold.
Acknowledgements
The authors wish to acknowledge the work of the field surveyors of the healthy food basket survey (Charlotte Foster, Niamh O’Sullivan, Rachel Luffman, Sarah Awatli, Stela Chervenkova and Toni Russell) as well as community members who kindly shared their personal experience of shopping for food locally. This work could not have been done without the generous assistance of staff at the following voluntary sector organisations: Citizens Advice Bureau, Open Age, Age UK and 240 Project. The authors also thank Claire Palermo, Elizabeth Dowler and Martin Caraher for advice on methodology. All authors contributed to the design, implementation and analysis of the research. Alison Ginn led on design and project implementation, conducted and analysed focus groups and led on data analysis and manuscript preparation. Anne Majumdar designed the focus groups, analysed results and was the final editor. Beth Menger sought research approval from the NHS Trust and was responsible for methodology and project design. Ginny Eastwood conducted focus groups and healthy food basket survey training. Marimba Carr led on selection of target area and designed the 7-day diets for case studies.
Funding
The author(s) received no financial support for the research, authorship, and/or publication of this article, and work was carried out as part of usual employee duties. This work was part of a service review to analyse gaps and improve effectiveness of service delivery.