



Abstract
Objective:
Poor quality communication with healthcare providers has been associated with provider avoidance. Because obesity is stigmatised in healthcare settings, this association may differ for patients who are overweight or obese compared to patients who are normal weight. Our objective was to determine if associations between patient-centred communication and provider avoidance differed by body mass index (BMI) category.
Methods:
We used data from the Health Information National Trends Survey 3, a cross-sectional data set that is nationally representative of the USA. We examined adjusted associations between patient-centred communication (measured using a six-item scale) and healthcare provider avoidance, stratified by BMI category (normal weight, overweight or obese).
Results:
The association between patient-centred communication and provider avoidance was similar in normal weight (adjusted odds ratios [AOR] = .65; 95% CI, .51–.83), overweight (AOR = .69; 95% CI, .55–.86) and obese (AOR = .55; 95% CI, .43–.70) subgroups. Across all three BMI categories, higher levels of patient-centred communication were significantly associated with lower odds of provider avoidance.
Conclusion:
This study highlights the importance of patient-centred communication for good-quality healthcare and for patients’ healthcare decisions, regardless of patient characteristics such as BMI. Patient-centred communication can positively impact healthcare seeking for diverse groups, even those who may experience stigma and discrimination in healthcare.
Introduction
Poor patient–provider communication has been associated with avoiding healthcare providers (Faith et al., 2015; Kannan and Veazie, 2014; Moore et al., 2004), and higher rates of healthcare avoidance have been documented among overweight and obese individuals (Ferrante et al., 2007; Østbye et al., 2005). Some overweight and obese individuals report experiencing negative encounters with providers including stigmatisation and discrimination (Malterud and Ulriksen, 2011; Merrill and Grassley, 2008; Puhl and Brownell, 2006). Types of stigmatisation and discrimination include being blamed for one’s weight, receiving disrespectful treatment and being the object of inappropriate comments (Puhl and Brownell, 2006). In circumstances when the patient feels blamed for his or her weight status, discussions between providers and their patients regarding weight management may be tense. More empathetic communication styles, as well as efforts to reduce patient blame, on the part of the provider have been linked to better outcomes for patients (Epstein and Street, 2007; Persky and Street, 2015; Pollack et al., 2011). Unfortunately, overweight and obese patients may be less likely to receive such empathetic communication from their providers.
Studies have demonstrated that some healthcare providers hold negative attitudes towards overweight and obese patients (Puhl and Brownell, 2001; Puhl and Heuer, 2009). Weight bias among providers may adversely affect patient–provider interactions. For example, Gudzune et al. (2013) found that physicians spent less time in building emotional rapport with overweight and obese patients than they did with normal weight patients, which could negatively impact the patient–provider relationship, patient adherence, healthcare utilisation and ultimately patient outcomes. Although patient–provider communication may be impacted upon by provider weight bias, experimental studies have not demonstrated a relationship between providers’ negative attitudes towards overweight and obese patients and the treatments prescribed (e.g. Hebl et al., 2003; Hebl and Xu, 2001; Wigton and McGaghie, 2001).
The combination of poor communication and provider bias could contribute to healthcare avoidance among overweight and obese patients, including encouraging delays in seeking healthcare, seeking care from other providers or avoiding the healthcare system altogether. Indeed, previous experiences of weight stigma, as well as anticipated weight stigma, have been identified as a reason for avoiding healthcare (Amy et al., 2006; Drury and Louis, 2002). These studies, however, used convenience or regional samples or examined specific healthcare services, and therefore, their findings may not be representative of the general population and general healthcare utilisation.
More research is needed to understand the role of weight in patient–provider interactions and health outcomes. We located no studies that examined the relationship between patient-centred communication and provider avoidance by weight status. Building on prior analyses of the association between patient–provider communication and provider avoidance using nationally representative data (Faith et al., 2015), our objective in the present study was to examine whether this relationship differed by weight status. Specifically, we hypothesised that the inverse association between patient-centred communication and provider avoidance would be stronger among individuals in higher body mass index (BMI) categories.
Methods
Data source
Data come from the Health Information National Trends Survey (HINTS) 3. Data for HINTS 3 were collected between January 2008 and April 2008 by computer-assisted telephone interview and by mail. The final sample for HINTS 3 (n = 7,674) is representative of the population of the USA aged 18 years and over when data are weighted. The survey’s methods are described in detail elsewhere (Cantor et al., 2009). We used HINTS 3 rather than more recent iterations of HINTS because it included our dependent variable of interest (i.e. provider avoidance), as well as measures of patient-centred communication, BMI and covariates.
Study variables
Provider avoidance was measured using the following question: ‘Some people avoid visiting their doctor even when they suspect they should. Would you say this is true for you, or not true for you?’ Response categories included (1) ‘true’ or (2) ‘not true’.
The measure of patient-centred communication is based on the six core functions of patient-centred communication identified by Epstein and Street (2007). The patient-centred communication score is an average of responses to six items, and this measure has been used in previous research (e.g. Blanch-Hartigan et al., 2015; Underhill and Kiviniemi, 2012). Participants were asked, within the past 12 months, how often did doctors, nurses or other healthcare professionals (1) ‘give you the chance to ask all the health-related questions that you had?’, (2) ‘give the attention you needed to your feelings and emotions?’, (3) ‘involve you in decisions about your healthcare as much as you wanted?’, (4) ‘make sure you understood the things you needed to do to take care of your health?’ and (5) ‘help you deal with feelings of uncertainty about your health or healthcare?’ Participants were then asked how often, over the past 12 months, they felt they could rely on doctors, nurses or other health professionals to take care of their healthcare needs. Response categories for all six items were (1) ‘never’, (2) ‘sometimes’, (3) ‘usually’ and (4) ‘always’. Respondents who were missing responses to three or more of the individual questions were treated as missing for the scale score. The scale had good reliability (Cronbach’s α = .89), consistent with previous research (e.g. Blanch-Hartigan et al., 2015; Finney Rutten et al., 2015; Underhill and Kiviniemi, 2012). Higher scale score indicated better patient-centred communication.
BMI was calculated from self-reported height and weight. We then classified respondents into standard BMI categories (Expert Panel on the Identification, Evaluation, and Treatment of Overweight in Adults, 1998) as follows: (1) <18.5 as ‘underweight’, (2) 18.5–24.9 as ‘normal weight’, (3) 25.0–29.9 as ‘overweight’ and (4) >30.0 and above as ‘obese’. Due to a small sample size for the underweight category (n = 130), participants in that group were excluded from analysis.
Potential covariates included age, sex, race/ethnicity, education level, working status, marital status, perceived health status, health insurance status, having a regular healthcare provider and frequency of provider visits in the last year.
Data analysis
All analyses were conducted in Stata version 12.1. Data were weighted using sampling weights provided by HINTS. For all variables, ‘don’t know’ and ‘refused’ responses were coded as missing.
We first examined bivariate associations. We estimated the weighted means of patient-centred communication and tested for differences between BMI categories. We used cross-tabulations to assess the statistical significance of associations between BMI categories and all other variables. To assess effect modification of BMI on the relationship between patient-centred communication and provider avoidance, we estimated multiple logistic regression models stratified by BMI category.
Results
Descriptive characteristics of participants are shown in Table 1. Approximately, one-third (33.9%) indicated that they avoided healthcare providers. In general, patient-centred communication levels were high; average patient-centred communication scale scores were 3.28 (on a scale ranging from 1 to 4). Weighted proportions (not shown) indicate that 35% of the participants were normal weight, 35% were overweight and 28% were obese. Bivariate analyses indicated no significant differences in provider avoidance or in patient-centred communication levels across BMI category. As shown, bivariate analyses also indicated that age, sex, race/ethnicity, education level, working status, marital status, perceived health status and having a regular source of care were significantly associated with BMI. Stratified multiple logistic regression results indicated that the association between patient-centred communication and provider avoidance was similar in normal weight, overweight and obese subgroups (Figure 1). Across all BMI categories, higher levels of patient-centred communication were significantly associated with lower odds of provider avoidance. Similarly, in additional analyses (data not shown), the interaction term for BMI (treated as a continuous variable) and patient-centred communication was not significant.
Descriptive characteristics of HINTS Cycle 3 participants by body mass index category. a
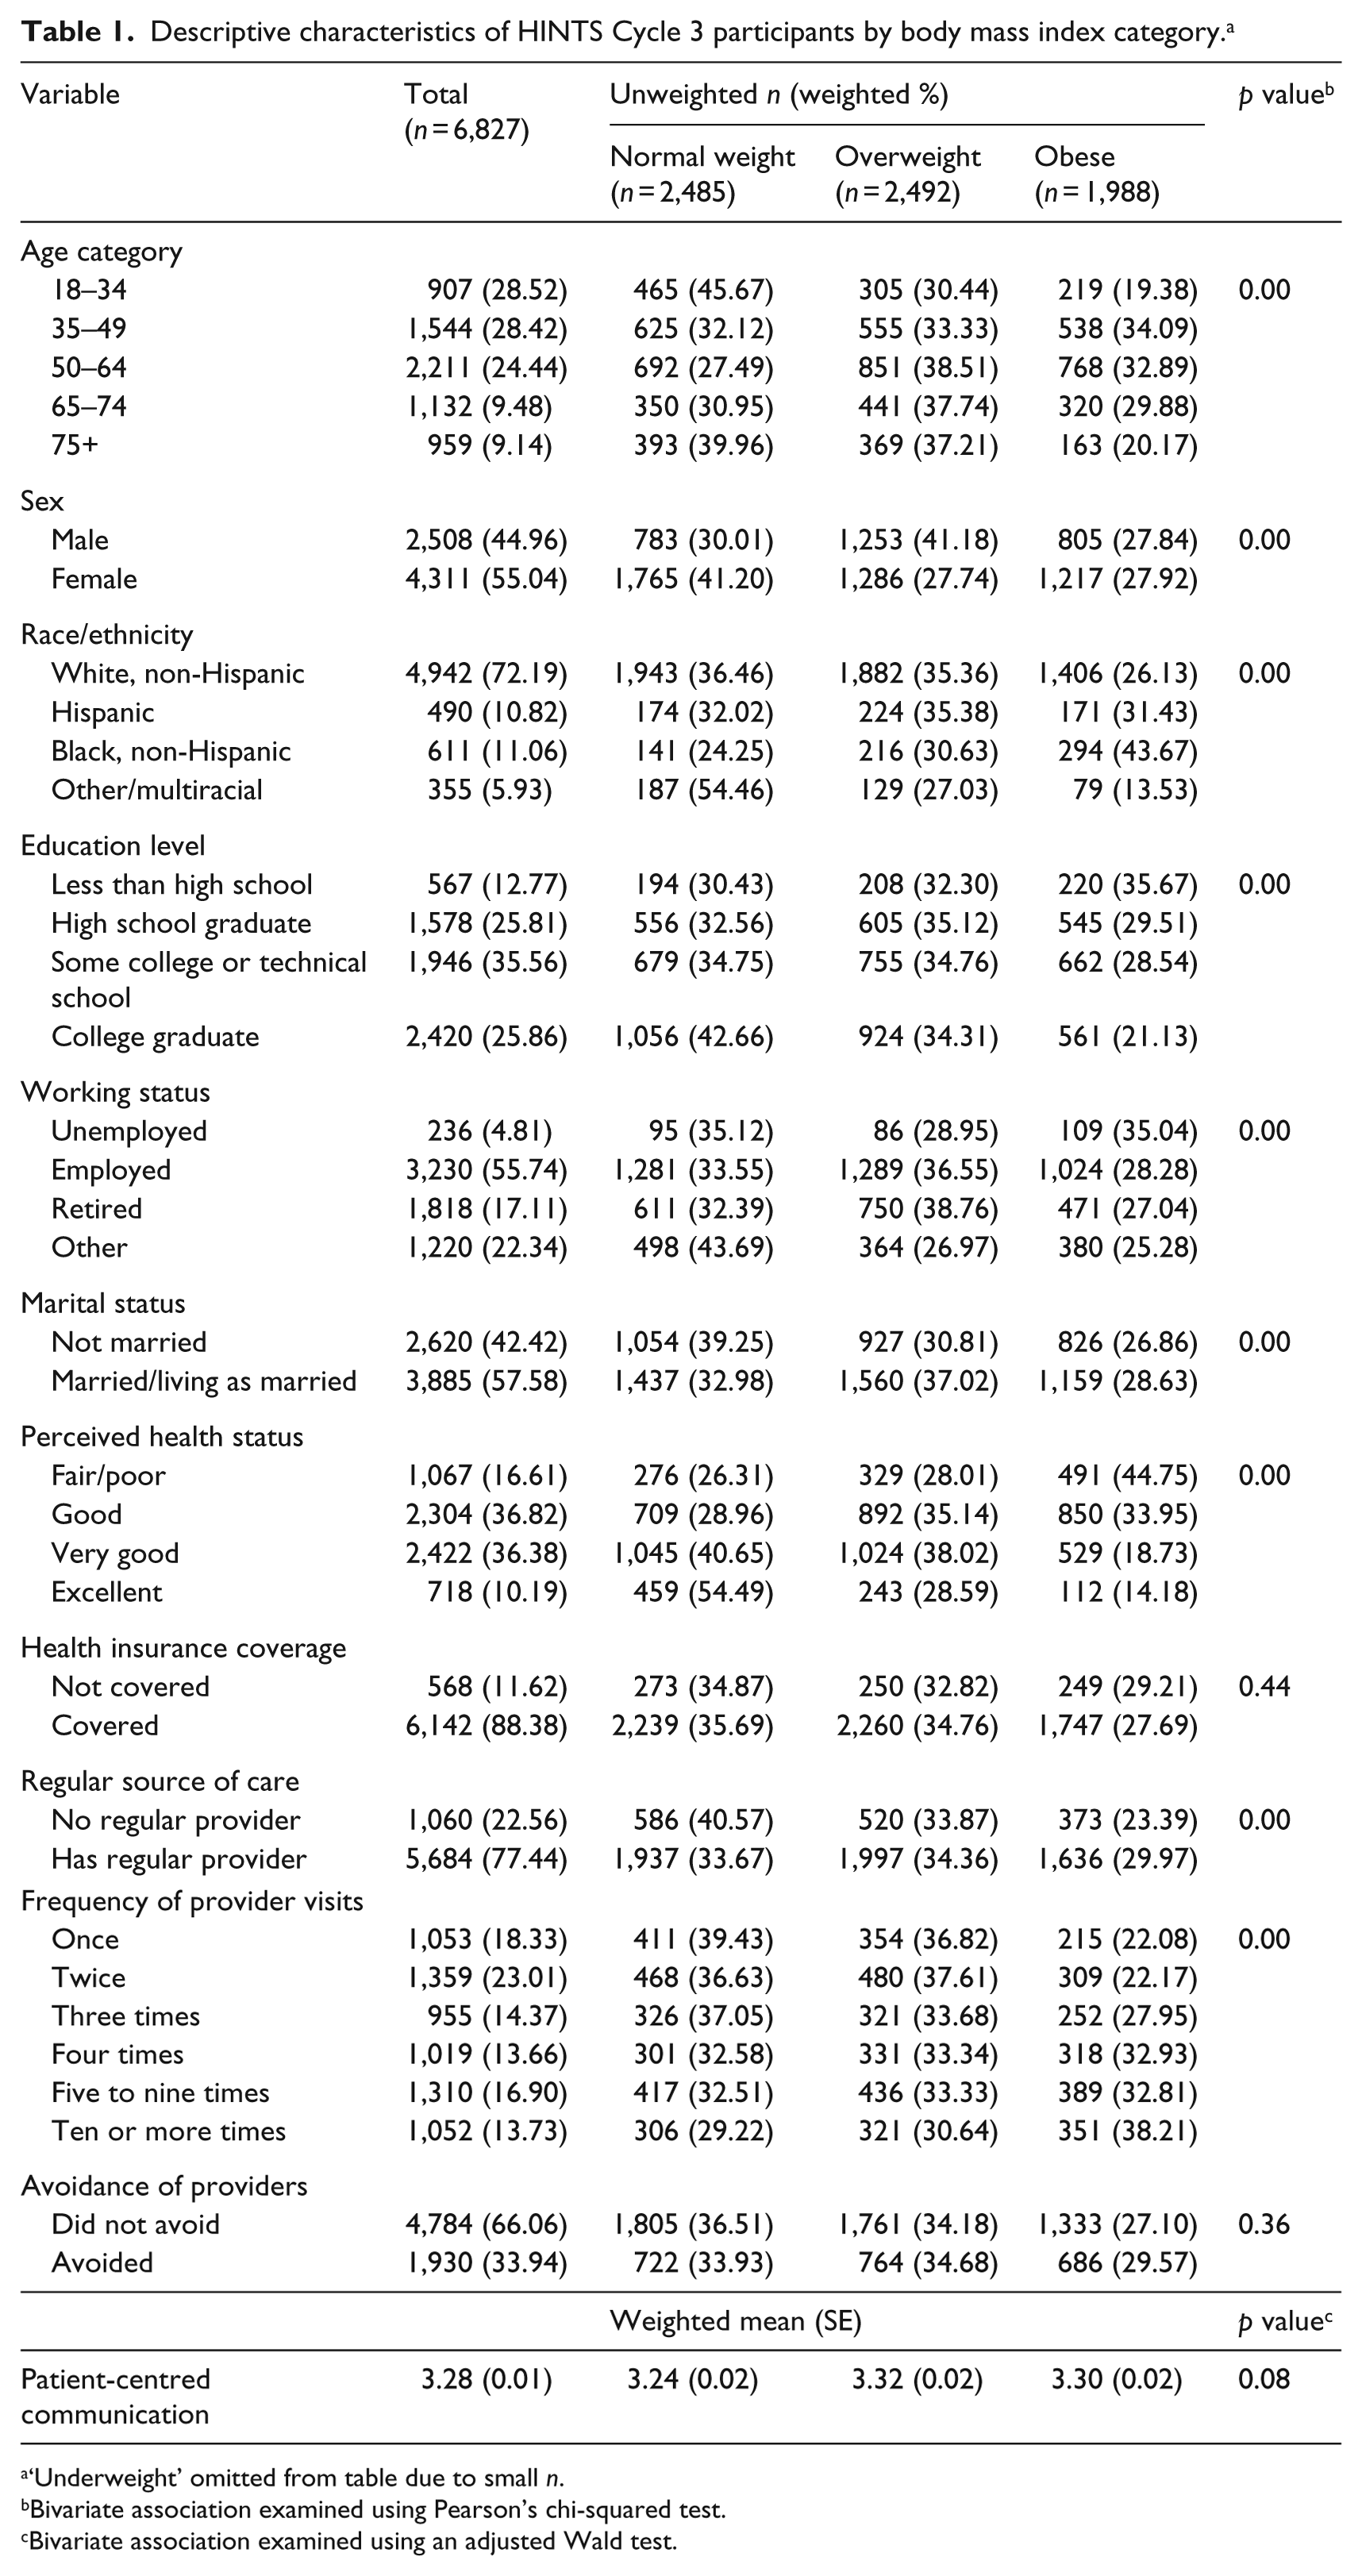
‘Underweight’ omitted from table due to small n.
Bivariate association examined using Pearson’s chi-squared test.
Bivariate association examined using an adjusted Wald test.
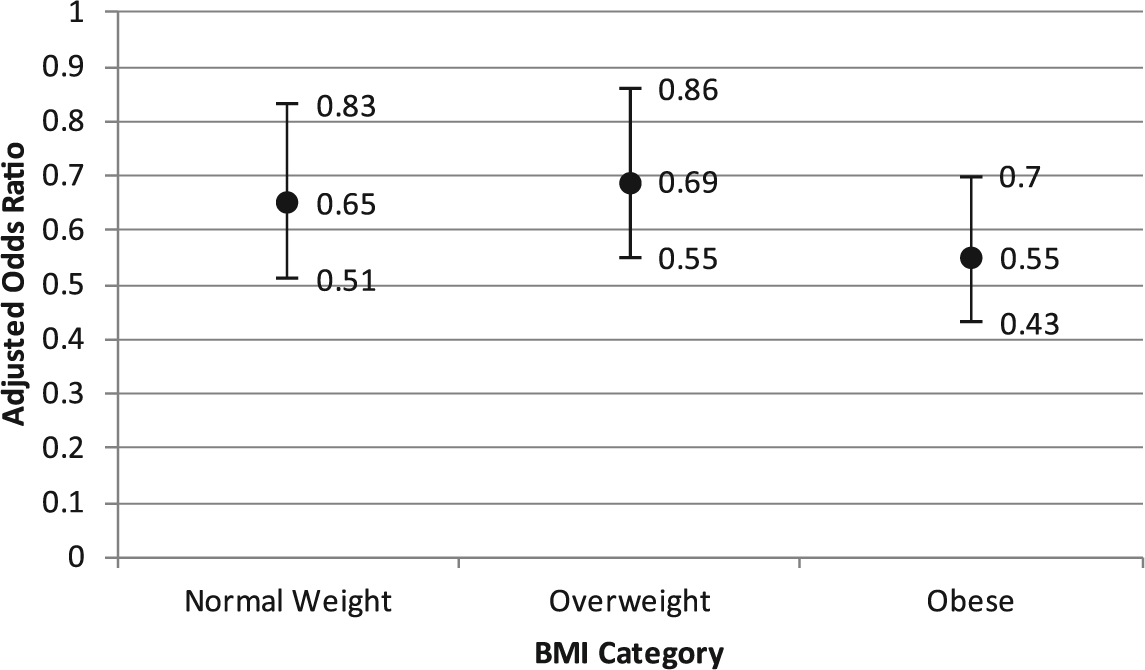
Adjusted associations between patient-centred communication and provider avoidance by body mass index category. Point estimates represent adjusted odds ratios of provider avoidance for each one-point increase in patient-centred communication; error bars represent 95% confidence intervals. All models were adjusted for age, sex, race/ethnicity, education level, working status, marital status, perceived health status, insurance status, regular source of care and frequency of provider visits. Hosmer-Lemeshow Goodness-of-Fit tests were not significant in each model.
Discussion
Contrary to our hypothesis, the relationship between patient-centred communication and provider avoidance was similar for those who were normal weight, those who were overweight and those who were obese. A few possible explanations for these findings exist. We hypothesised that the relationship would be different for overweight and obese individuals because of the stigma and other negative experiences they have in healthcare encounters due to their weight. Our data, however, did not allow us to explore the diversity of experiences that individuals with overweight and obesity may have. Although some patients in the overweight and obese BMI subgroups may experience weight bias in healthcare settings, which could alter the effects of poor-quality communication with providers, others may not. Unfortunately, HINTS 3 did not include measures of weight-based stigma, discrimination or other aspects of patient–provider interactions. Future studies that examine weight-based stigma and discrimination as potential modifiers of the communication–avoidance relationship may provide new information about how patient-centred communication can influence healthcare-seeking behaviour for patients who are obese and overweight, as well as other patients.
Limitations
This study also has limitations that may have affected the results. Specifically, it has a cross-sectional design, relies on self-report data and may be confounded by unmeasured variables. For example, the measure of patient-centred communication asks respondents to reflect on the prior 12 months, the measure of provider avoidance does not pertain to a specific period and the measure of BMI is based on self-reported height and weight at the time of data collection. Because people tend to underreport their weight (Kuczmarksi et al., 2001), some overweight and obese respondents may be misclassified in lower weight categories, which would lessen the observed effect of BMI on the communication–avoidance relationship. Studies that can provide better evidence of the temporal sequence of the variables and include the collection of weight and height data by research staff may produce different results. In addition, due to the small size of obese subgroups, we were not able to stratify by obesity categories (e.g. Obese I, II and III).
Another limitation of the measurement is that the questions used to measure patient-centred communication and provider avoidance did not pertain to specific providers or types of visits; furthermore, the measure of provider avoidance was binary and broad. Certain healthcare services or types of procedures may be more threatening or uncomfortable for overweight or obese patients, especially if excess body weight is relevant to the service or procedure. For example, previous studies linking weight status with avoidance of care have focused on breast and cervical cancer screenings (Amy et al., 2006, Wee et al., 2000). Future studies that use more specific measures are needed to understand the relationships between these variables in specific healthcare contexts and better inform interventions. Finally, although HINTS data, when weighted, are representative of the US population aged 18 years and over, our findings may not be generalisable to persons who have not recently visited their provider. Any participants who did not visit the doctor in the previous 12 months were excluded from our models because they were not asked to respond to the patient–provider communication questions.
Our findings highlight the importance of patient-centred communication in patients’ healthcare experiences, regardless of patient characteristics such as BMI. For all BMI subgroups, those who reported greater patient-centred communication had lower odds of provider avoidance. These findings add to the body of evidence indicating that patient-centred communication may have important implications for use of healthcare services (Faith et al., 2015; Kannan and Veazie, 2014; Moore et al., 2004), as well as outcomes related to patient satisfaction (Rathert et al., 2013) and patient-reported well-being and quality of life (Epstein and Street, 2007; Robinson et al., 2013). In conclusion, our results suggest that patient-centred communication and healthcare seeking are linked for diverse groups, even those who may experience weight stigma and discrimination in healthcare. Further research is needed to better understand the role of patients’ weight in their healthcare experiences, the quality of patient–provider interactions and healthcare use.
Footnotes
Funding
The author(s) received no financial support for the research, authorship and/or publication of this article.