



Abstract
Objective:
To promote healthy beverage consumption among 9–12 grade students (ages 14–18) by means of a 4-week curriculum promoting increased awareness of drinks containing added sugar and the association between sugar-sweetened beverage consumption and health risks.
Design:
Quasi-experimental pre–post design.
Setting:
High schools in Northern California with at least 50% of students eligible for free or reduced-price meals.
Method:
A 4-lesson version of the Rethink Your Drink high school curriculum was piloted in three high schools in two northern California counties. Two high schools in the same area served as comparison sites. A survey of beverage-related knowledge, behaviours, perceptions and self-efficacy was administered to intervention and comparison students before and after the intervention. Focus groups with students and an online survey and semi-structured interviews with teachers were conducted following the intervention.
Results:
Intervention students reported significantly greater frequency of reading Nutrition Facts labels and understanding of beverage choice influences and decreased consumption of diet soda than comparison students. A decrease of 0.26 times per day in consumption of sugar-sweetened beverages relative to the comparison group was not significant.
Conclusion:
The intervention resulted in some positive outcomes, but improvements in targeted beverage consumption were not significant. Students and teachers want shorter, more engaging and experiential curricula that build on previous learning. Findings point to actionable recommendations for improvement of high school healthy beverage curricula and suggest the need for reinforcement using a multi-level approach.
Introduction
In the USA, an estimated 20.5% of young people between the ages of 12 and 19 years are obese (Kann et al., 2018; Ogden et al., 2016). Sugar sweetened beverages (SSB) are a significant source of added sugars in the US diet (Block, 2004) and a significant contributor to obesity and diet-related chronic disease (Babey et al., 2009; Hu and Malik, 2010; Malik et al., 2010). While rates of sugar-sweetened beverage (SSB) consumption among adolescents have been declining in recent years, they remain high; 65.4% of young people aged 12–19 reporting SSB consumption on a given day in 2013–2014 (Bleich et al., 2018).
Schools are the ideal locations for curriculum-based interventions and the only setting where the majority of youth can be reached. Therefore, it is critical that feasible and effective approaches to reducing SSB consumption among adolescents in the school setting be developed and evaluated. In a review of school-based strategies to reduce SSB consumption, Tipton (2016) identified a range of successful approaches, including education; combinations of education and behavioural or policy, systems and environmental change; and policy change at the school, district or state level. Studies focusing on adolescents have come to similar conclusions (Lane et al., 2016; Vézina-Im et al., 2017).
Despite favourable results associated with educational interventions, no practical healthy beverage curriculum for high school students has been approved by the US Department of Agriculture (USDA) for use in Supplemental Nutrition Assistance Programme-Education (SNAP-Ed). This is a serious gap that should be addressed, given that SNAP-Ed is one of the largest and most wide-reaching nutrition education programmes in the USA.
Given the important role that schools can play in promoting healthy behaviours (Flynn et al., 2006) and the absence of an appropriate SNAP-Ed allowable high school beverage curriculum, in 2012 the California Department of Public Health (CDPH) Nutrition Education Obesity Prevention Branch (NEOPB) developed a healthy beverage curriculum targeting students in grades 9–12 (ages 14–18). The curriculum was designed as part of the Rethink Your Drink social marketing initiative developed by NEOPB. Activities are conducted with adults and children in a variety of community-based settings using different combinations of materials and approaches. Rethink Your Drink is used widely throughout California, especially as part of the SNAP-Ed programme known as CalFresh Healthy Living (CFHL) in California. Although California law limits the sale of SSBs in high schools to electrolyte replacement beverages with no more than 42 g of added sweetener per 20-ounce serving, compliance with the law is mixed (Samuels et al., 2009) and students are allowed to bring their own SSBs to school. The Rethink Your Drink curriculum is intended to complement state and local policy, systems and environmental change efforts by promoting reduced SSB intake within and outside the school environment.
The Rethink Your Drink high school curriculum promotes four key behaviours: (1) drink water instead of SSBs; (2) choose from a variety of healthy beverage options over SSBs; (3) use the Nutrition Facts label to choose beverages with less added sugar; and (4) use the Ingredient List to choose beverages with little or no added sugars. Developed in 2012, the entire curriculum consists of seven lessons ranging from 50 minutes to 2 hours each. However, because of time limitations, a shortened version consisting of four of the seven Rethink Your Drink lessons was evaluated. Lessons were taught once a week over the course of 4 weeks, with all teachers adhering to the same protocol. Learning objectives were informed by the Health Belief Model (HBM) and included: expanding student understanding of perceived susceptibility to health problems associated with excessive sugar consumption and benefits of reduced sugary beverage consumption; increased awareness of and reduction in barriers to behaviour change; increased self-efficacy and confidence to make healthier beverage choices and cues to action, including teaching students how to read Nutrition Facts labels and Ingredients Lists and encouraging them to do so. While informed by the Health Belief Model, the Rethink Your Drink curriculum does not address perceived severity of health problems associated with SSB intake. The omitted lessons addressed nutrition and physical activity guidelines, comparing intake to recommendations, goal-setting, action planning, tracking beverage consumption and taste testing healthier beverages.
The Rethink Your Drink curriculum engages with the Health Education Content Standards for California Public Schools, (California Department of Education, 2008) and the California Nutrition Competencies for grades 9–12, (Center for Nutrition in Schools, 2009). It also incorporates nutrition and physical activity recommendations from the 2015 Dietary Guidelines for Americans and the 2008 Physical Activity Guidelines for Americans. In order to determine its effectiveness and to meet the USDA requirement that all curricula used with SNAP-Ed funds be evidence-based, NEOPB asked the University of California Nutrition Policy Institute to evaluate the Rethink Your Drink curriculum’s impacts on student beverage-related knowledge, behaviours, perceptions and self-efficacy.
Methods
Study sample
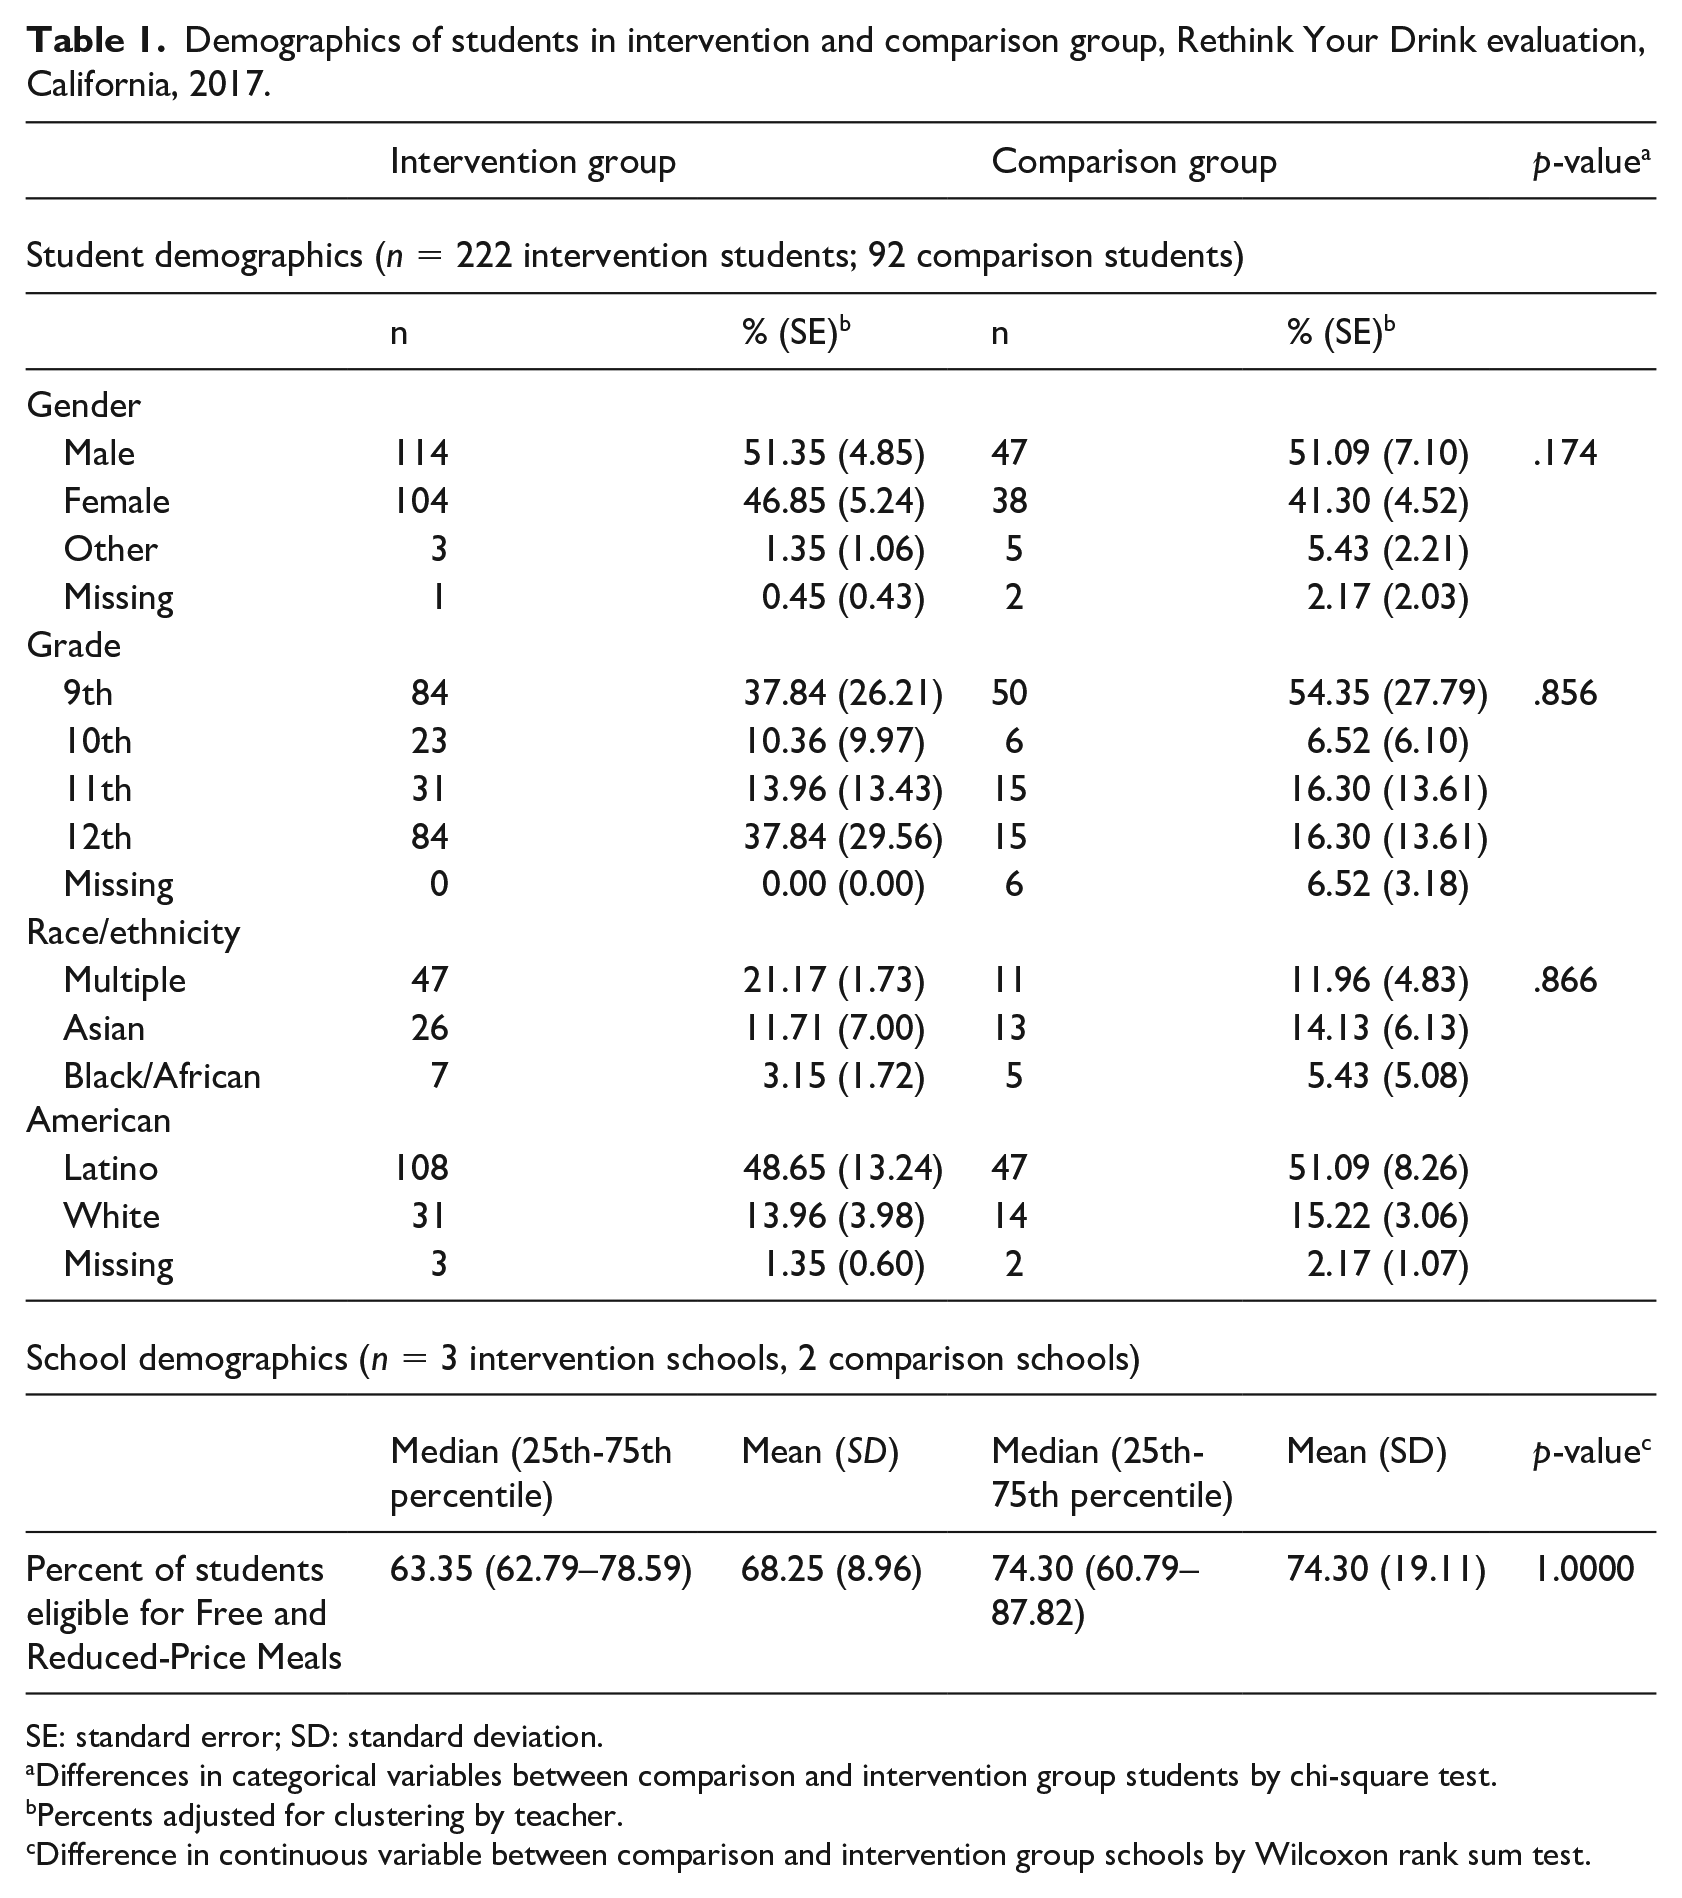
The 4-lesson version of the Rethink Your Drink high school curriculum was piloted in three high schools in two northern California counties. Two high schools in the same areas served as comparison sites. School recruitment was conducted by compiling a list of traditional (i.e., non-alternative) public high schools in school districts in two northern California counties in proximity to the research team that met the CFHL qualifying threshold of at least 50% of students being eligible for free or reduced-price meals. Counties with sugary drink taxes or that had had such taxes on the ballot were excluded. CDPH staff contacted school administrators at the 24 eligible schools in the two counties to assess their interest in participating in this effort. Seven teachers at five schools agreed to participate. The schools ranged in size from 808 to 1,543 students, with an average of 1,209 students. On average, 68% of students at intervention schools and 74% of students at the comparison schools were eligible for free and reduced-price meals. There were no significant differences between the two groups in this regard.
The final sample consisted of three intervention schools (four teachers) and two comparison schools (three teachers). Both control and intervention teachers received an honorarium for their participation. Three teachers volunteered to implement the curriculum in more than one class. All students in class on the day of the pre-test and post-test (351 and 337 respectively) were invited to participate. Both students and parents were provided the opportunity to opt out. An overview of student recruitment and participation is presented in Figure 1.
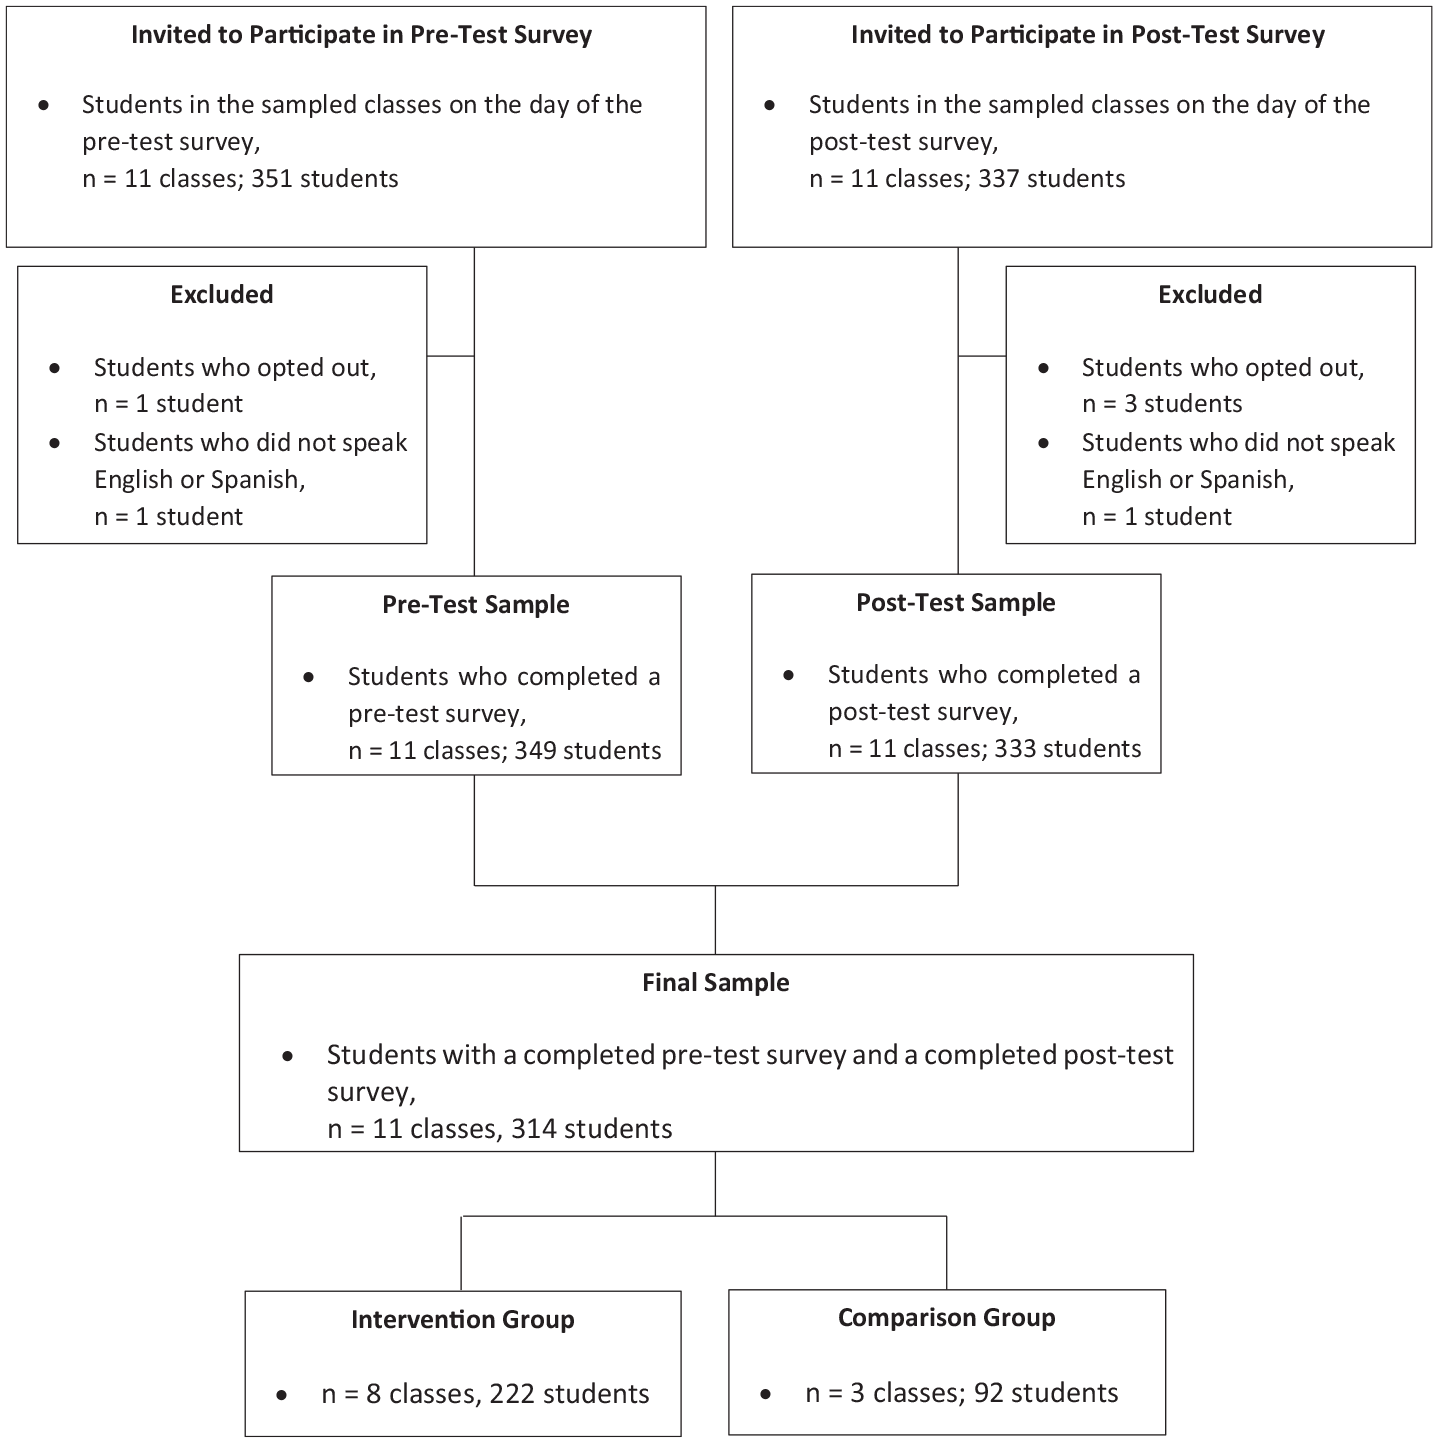
Study sample flow chart.
The final intervention group consisted of eight classes, including Health (2 classes, 54 students), Physical Education (1 class, 30 students), Economics (3 classes, 84 students) and Advancement via Individual Determination (a college readiness programme) (2 classes, 54 students). The comparison group consisted of three teachers with one class each: Health (1 class, 31 students), Physical Education (1 class, 27 students) and Forensics (1 class, 34 students). Intervention group teachers participated in a half-day training prior to implementing the curriculum.
The University of California-Davis Institutional Review Board and the California Health and Human Services Agency, Committee for the Protection of Human Subjects approved the study procedures.
Data collection instruments and procedures
Student surveys
The curriculum’s impact on constructs associated with the Health Belief model was assessed via a pre/post-test survey administered in the classroom and made available in English and Spanish. The student surveys included questions adapted from the CDPH NEOPB ‘What Do You Drink?’ survey (unpublished) – which, although not validated, has been used by county health departments to evaluate the efficacy of local Rethink Your Drink interventions – as well as some newly developed questions covering:
Behaviours: Consumption of sugar- and non-sugar sweetened beverages;
Knowledge and skills: Ability to identify beverages with added sugar, identify the amount of sugar in a beverage, rank beverages based on sugar content and understand the difference between naturally occurring and added sugars;
Perceived susceptibility and benefits: Identify health impacts of sugar consumption, agreement with statements ‘Consuming too much sugar can impact my health’ and ‘I would like to drink fewer sweetened beverages’;
Self-efficacy: Confidence in understanding reasons for choosing certain beverages, ability to identify healthy beverages, find valid health information about different beverages and understand the difference between natural and added sugars; and
Cues to action: Frequency of reading the Nutrition Facts label and Ingredients List when choosing a drink.
Intervention group students completed the self-administered pre-test and post-test surveys during class time, 2 weeks prior to and 3 weeks following implementation of the curriculum. Comparison group students completed the surveys within the same timeframe.
Teacher and student perspectives regarding the Rethink Your Drink curriculum were elicited via a survey of, and interviews with, intervention group teachers and focus groups with intervention group students using instruments developed by the study authors. Intervention teachers (n = 4) were asked to complete an online survey to provide feedback on the curriculum after teaching each lesson. The survey elicited teacher perceptions regarding preparedness to teach the lesson; organisation; clarity of instructions; time allocation; lesson flow; appropriateness of learning level; student engagement; appropriateness for diverse cultures and individuals; need for modifications; and feedback on individual lesson components. In addition, semi-structured key-informant interviews were conducted with each of the intervention teachers within 4 weeks of completing the curriculum. The interviews elicited teacher perceptions of the curriculum, including how well the curriculum met its objectives and recommendations for improving the curriculum.
Two focus groups were conducted with 9th grade students at two intervention schools during a 4-week period following curriculum completion. The focus groups elicited student perceptions of the curriculum, the perceived impacts of the curriculum on HBM constructs and other outcomes, and recommendations for improving the curriculum. All participating classes were invited and teachers agreed to allow the research team to conduct focus group discussions with 2 of their classes. All students in those classes were invited to participate on an ‘opt-in’ basis, including signed parental consent and verbal student assent. Twenty-one parents provided consent and thirteen students (nine at one school, four at another) agreed to participate in the focus groups. The two focus groups, which lasted 23 and 40 minutes, took place during school hours in private classrooms at each school site. Each focus group was conducted using a script by two members (moderator and note taker) of the research team. A school staff member not intimately familiar with the students (to reduce bias) was present at each focus group.
Data analysis
Data from all students who completed both the pre- and post-test survey were included in the analysis. Chi-square tests adjusted for clustering by teacher were used to examine whether there were differences in the demographic characteristics of intervention and comparison group students. In the analyses examining the impact of the curriculum on outcomes of interest, ordinal categorical outcomes were treated as continuous and analysis of covariance was conducted on their change scores, controlling for pre-test scores. Standardised effect sizes were calculated for each outcome by dividing the adjusted mean difference by the pooled standard deviation. A Wilcoxon rank sum test was used to examine whether there was a difference in the percent of FRPL-eligible students between intervention and comparison group schools. All analyses were adjusted for grade, gender and race/ethnicity and accounted for clustering by teacher and results with a p-value of less than .05 were determined to be significant. All analyses were conducted using SAS 9.4. Student focus groups and teacher interviews were recorded and manually transcribed by a member of the research team. Focus group findings were analysed based on a set of a priori codes based on the principal themes in the interview guide. Initial coding of the transcripts was conducted by one member of the research team, with additional emergent codes added as needed. A second member of the research team reviewed the transcripts and codes and suggested adjustments, which were made with agreement of both researchers. Key patterns were identified and salient quotes were extracted. The teacher interview transcripts were reviewed by two members of the research team. Key patterns were developed based on the principal themes outlined in the interview guide, however, formal coding was not conducted given the small number of interviews.
Results
Student survey
There were no significant differences between intervention and comparison students with respect to gender, grade or race/ethnicity (Table 1). Slightly over half of each group was male. Approximately one-third (37.8%) of the intervention group and approximately one half (54.4%) of the comparison group were in the 9th grade and 37.8% of the intervention group and 16.3% of the comparison group were in the 12th grade. Approximately half of the students in each group (48.7% intervention; 51.1% comparison) were Latino. Very few were African-American (3.2% intervention; 5.4% comparison). Spanish language surveys were completed by five intervention group students (2.3%) and four comparison group students (4.3%).
Demographics of students in intervention and comparison group, Rethink Your Drink evaluation, California, 2017.
SE: standard error; SD: standard deviation.
Differences in categorical variables between comparison and intervention group students by chi-square test.
Percents adjusted for clustering by teacher.
Difference in continuous variable between comparison and intervention group schools by Wilcoxon rank sum test.
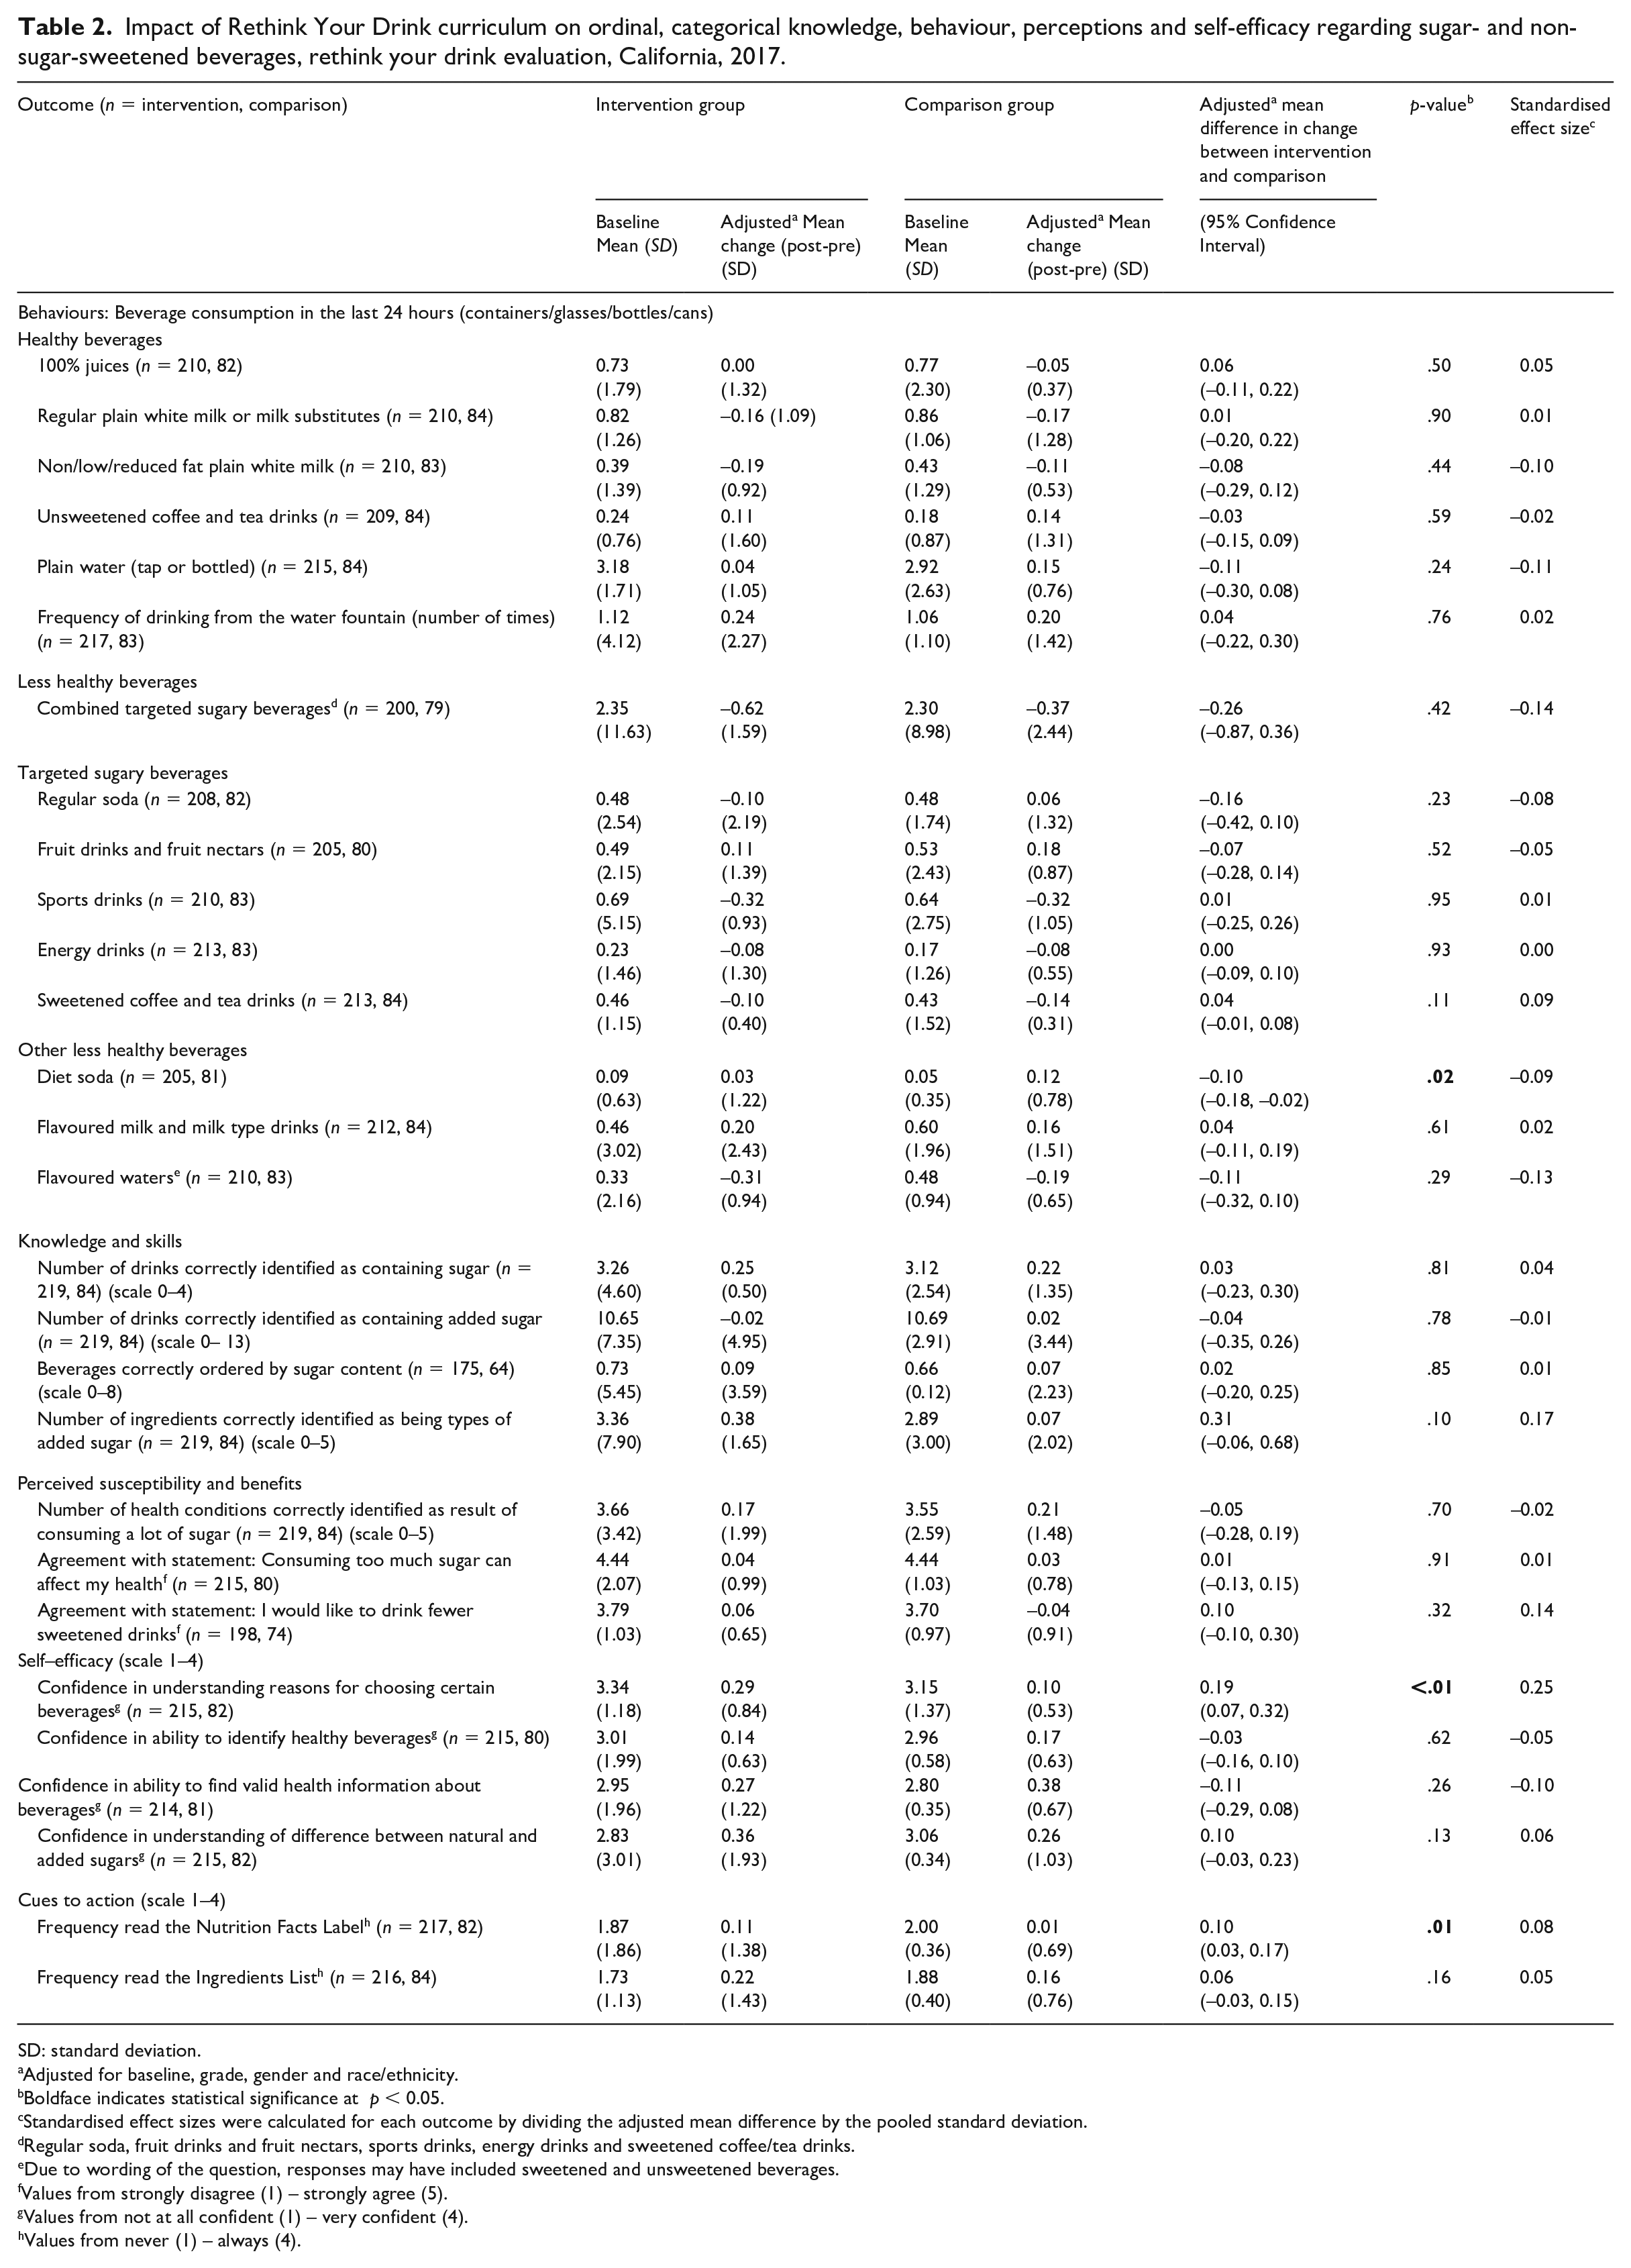
At baseline, intervention students drank on average 0.69 containers/glasses/bottles/cans of sports drinks, 0.48 regular sodas, 0.49 fruit drinks, 0.46 sweetened coffees or teas, 0.46 flavoured milks and 0.24 energy drinks per day for a total of 2.84 sugary drinks per day (not including flavoured waters which may have been a mixture of sweetened and unsweetened). Intakes by comparison students were very similar to that of intervention students for most sugary drinks but somewhat higher for flavoured milk at 0.60 per day and flavoured water at 0.48 per day (vs 0.33 among intervention students). Intervention students reduced their intake of targeted SSBs by 0.62 whereas comparison students reduced their intake by 0.37 per day over the course of the study; however, the difference between reduction in intake of the 2 groups was not significant.
There were small reductions in intake (0.08–0.32 per day) by intervention students for many of the targeted sugary drinks but none of these reductions in intake was significantly different from those observed in the comparison group. Intervention students consumed 0.09 diet sodas per day, on average, at baseline compared to 0.05 in the comparison group. The intervention group increased their intake slightly (by 0.03) but much less so than the comparison group (0.12) resulting in a significantly smaller increase in intake among intervention students.
Regarding healthy beverages, intervention students consumed on average 0.82 containers of whole white milk, 0.38 containers of reduced, low or nonfat milk, 0.73 containers of 100% juices, 0.24 unsweetened coffees or teas and 3.18 plain waters per day at baseline. Intakes were similar for comparison students. Among intervention students there were small reductions in milk intake, no change in 100% juice intake and small increases in intake of water and unsweetened coffees/teas. However, none of these changes was significantly different from changes in intake among comparison students.
Intervention students’ average scores regarding beverage-related knowledge, perceptions and self-efficacy improved over time for all questions and the comparison group’s scores improved over time for all but one question. In one case, the improvement in the intervention group was significantly greater than for the comparison group: understanding their own reasons for choosing certain beverages. The intervention and comparison groups both experienced improvements, albeit some very small, in beverage-related knowledge over time for all items except one question for the intervention group. None of the improvements in knowledge or skill scores was significantly greater for the intervention compared to the comparison students.
With respect to cues to action and reading the nutrition facts label and nutrient list when purchasing beverages, on a 4-point scale (1 = never, 4 = always) both intervention and comparison students averaged nearly 2 at baseline. Intervention students increased their score with regard to reading the nutrition facts label over time significantly more than did the comparison students. Both groups also increased the frequency with which they read the nutrient lists, but the increases were not significantly different between the two groups (Table 2).
Impact of Rethink Your Drink curriculum on ordinal, categorical knowledge, behaviour, perceptions and self-efficacy regarding sugar- and non-sugar-sweetened beverages, rethink your drink evaluation, California, 2017.
SD: standard deviation.
Adjusted for baseline, grade, gender and race/ethnicity.
Boldface indicates statistical significance at p < 0.05.
Standardised effect sizes were calculated for each outcome by dividing the adjusted mean difference by the pooled standard deviation.
Regular soda, fruit drinks and fruit nectars, sports drinks, energy drinks and sweetened coffee/tea drinks.
Due to wording of the question, responses may have included sweetened and unsweetened beverages.
Values from strongly disagree (1) – strongly agree (5).
Values from not at all confident (1) – very confident (4).
Values from never (1) – always (4).
Findings from the teacher survey and interviews and student focus groups
Teachers felt positively about the curriculum overall. They reported that the lessons were well-aligned with the learning objectives and that the nutrition education competencies helped them understand the lesson’s fit with health education content standards. At the same time, teachers indicated that they frequently did not implement all components of the curriculum due to issues including lack of time and reluctance to burden students with additional homework. In particular, they frequently did not incorporate the last components of each lesson (‘Cool Down’, ‘Check for Learning’ and ‘Extension/Links’).
Students participating in focus groups offered a variety of perceptions regarding the curriculum. Focus group participants reported some behaviour changes, including drinking lower fat milk at home, drinking more water and choosing smaller portions of SSBs. They also mentioned asking parents to stop drinking sugar-sweetened beverages and to prepare healthy beverages from the recipe cards provided as part of the curriculum.
Reported changes in knowledge included increased awareness of the health impacts of SSBs and increased ability to read Nutrition Facts labels and calculate the amount of sugar in beverages. For example, a student noted that ‘I can read . . . the Nutrition Facts label easier and calculate how much sugar is in [a beverage]’. Another reported that the Rethink Your Drink curriculum helps ‘people realise how much sugar . . . affects your body’. Nonetheless, increased student knowledge was not necessarily accompanied by behaviour change. A focus group participant explained that ‘I’ll look at the nutrition label, but I just like figuring out how much sugar is in it for fun. I’ll still drink it’.
Focus group participants felt that the majority of students in their classes paid minimal attention while the lessons were being taught. They also suggested that the curriculum might be more effective with more impressionable younger students, noting that high school students ‘have . . . [ingrained] habits and . . . can’t really break them’. Students also reported receiving similar information in middle school, making the lessons redundant. As one explained, the lessons were ‘kind of repetitive because . . . in [middle school] Health Science they . . . already teach you this . . . so I still remember it’.
Teachers and student recommendations for improving the curriculum included: reducing the curriculum from four to three lessons; improving flow by teaching the curriculum as a single unit over several consecutive days rather than once a week, including PowerPoint type slides to make the curriculum more engaging for students and easier for teachers, providing healthy drinks for students to sample, greater use of technology and online activities, more games and opportunities for social interaction, and modifying the curriculum to target younger students before habits become ingrained.
Discussion
The Rethink Your Drink high school curriculum was developed to fill a gap in the available materials to support CDPH-led CFHL efforts in California. CFHL is the largest single on-going source of funding for nutrition education and policy, systems and environmental change work in California. Therefore, it is critical that effective interventions be identified and disseminated through this programme. The curriculum was evaluated separately, rather than in combination with complementary policy, systems and environmental change efforts in order to meet the USDA requirement that all curricula implemented with SNAP-Ed funds be evidence-based.
The students that participated in this study had room for improvement in their beverage intake. At baseline, intervention students were drinking 3.17 sugar-sweetened beverages on average per day, only 1.2 containers of milk and 3.18 glasses or bottles of water. Although the students that received the curriculum did reduce their intake of targeted sugar-sweetened beverages, this decrease was not significantly different from the comparison group. This -0.26 greater decrease among participants is encouraging and of a magnitude that is similar to that achieved in other studies of similar interventions (Sichieri et al., 2009). However, post hoc power calculations revealed that the study was not sufficiently powered to detect a difference in difference of this magnitude. So, these findings are inconclusive.
Changes in healthy beverage intake were mixed and not significantly different between intervention and comparison groups, suggesting that this curriculum was not effective at increasing intake of healthy beverages. Student recommendations included offering healthy beverages for sampling. A greater emphasis on healthy alternatives could potentially improve the effectiveness of the curriculum in this regard (Muckelbauer et al., 2009; Sichieri et al., 2009).
At baseline, students in this study already had high levels of knowledge regarding the health consequences of added sugar and their desire to decrease their SSB intake was also high. For example, the average score on a scale of 1–5 was 3.79 for agreement that ‘I would like to drink fewer sweetened drinks’ and 4.44 on a scale of 1–5 for agreement that ‘Consuming too much sugar can affect my health’. Therefore, it is not surprising that these did not improve over time.
Compared to their intentions and awareness, student skills and self-efficacy were lower at baseline. There was significant improvement relative to the comparison group for one of the four measures of self-efficacy but no significant improvements in skills relative to the comparison group. There was a significantly greater increase in frequency of intervention students reading the Nutrition Facts label compared to the comparison group. During this evaluation, these improvements in label reading and self-efficacy however did not translate into significantly improved beverage consumption. During focus groups, the students explained that they read the Nutrition Facts label because it is fun but not necessarily to guide their beverage selections. They also cited a lack of motivation to change. They felt that their habits were firmly established and the curriculum alone did not effectively motivate them to change. A similar phenomenon was reported by Jensen et al. (2009) who found that increased reading of Nutrition Facts labels was not associated with increased use of labelling to select food items. Greater improvements in skill, self-efficacy and motivation may be necessary to achieve significant behaviour change, whether through adjustments to the curriculum or through reinforcement from a multi-level approach including complementary policy, systems and environmental change interventions. Studies have identified increased effectiveness of nutrition education when implemented in conjunction with policy, systems and environmental change efforts (Lane et al., 2016; Vézina-Im et al., 2017).
These findings suggest that developing a curriculum that is effective for improving beverage consumption among high school students may be challenging. Students may feel they already know the material and lack motivation to change. Focus group findings indicate that students want visually engaging, experiential, interactive lessons that incorporate technology and social interaction. Similar recommendations have been made by students participating in other studies (Seo and Sa, 2010). Students’ comments also suggest that curricula should build upon rather than repeat what students have learned in earlier grades. Teachers indicated that they want shorter lessons that they can easily fit into the already packed school curriculum and that do not increase the homework burden on students. Therefore, in the case of the Rethink Your Drink curriculum it might be worth considering the replacement of some of more didactic and knowledge-oriented parts of the curriculum with the more interactive curriculum elements that were removed – as well as other elements from the full curriculum such as goal-setting and action-planning, which may be particularly critical for behaviour change – without increasing overall curriculum length.
Furthermore, relying on a curriculum alone to effect behaviour change is not optimal. Several reviews have shown that beverage interventions are most effective when educational approaches are combined with policy, systems and environmental change efforts (Lane et al., 2016; Tipton, 2016; Vézina-Im et al., 2017). Seo and Sa (2010) report that interventions with three or more components may be more effective in reducing obesity among minority children in the USA than those with fewer components. Given the widespread popularity of the Rethink Your Drink materials and the demand for reproducible, evidence-based interventions targeting SSB intake, the effectiveness of this curriculum may be increased by if it is revised in accordance with the findings from this study, paired with evidence-based policy, systems and environmental change strategies and then retested for impact on behaviour change with a larger sample.
Limitations
A primary limitation of this study was the small sample of participating schools and classrooms. Furthermore, the survey instrument, although adapted from a commonly used tool in California, was not validated and due to feasibility concerns we evaluated a shortened version of curriculum consisting of four lessons, rather than the original seven-lesson curriculum, which has yet to be evaluated. An assessment of fidelity to curriculum implementation was not conducted and would be useful for interpretation of results. Self-report of dietary intake is subject to inaccurate recall and social desirability bias. Despite these limitations, this study provides valuable information about high school students’ knowledge, behaviours, perceptions and self-efficacy regarding beverages, and actionable recommendations to inform the improvement of curricula targeting beverage intake among high school students.
Footnotes
Acknowledgements
We are grateful to students, teachers and schools for their participation in this study.
Funding
The author(s) disclosed receipt of the following financial support for the research, authorship, and/or publication of this article. This work was funded by the US Department of Agriculture’s Supplemental Nutrition Assistance Programme – USDA SNAP, through the California Department of Public Health. These institutions are equal opportunity providers and employers.
