
Abstract
Objective:
The objective of this study was to investigate use patterns among early adopters of adaptive cruise control (ACC).
Background:
Extended use of ACC may influence a driver’s behavior in the long term, which can have unintended safety consequences.
Method:
The authors examined the use of a motion-based simulator by 24 participants (15 males and 9 females). Cluster analysis was performed on drivers’ use of ACC and was based on their gap settings, speed settings, number of warnings issued, and ACC disengaged. The data were then examined on the basis of driving performance measures and drivers’ subjective responses to trust in ACC, understanding of system operations, and driving styles. Driving performance measures included minimum time headway, adjusted minimum time to collision, and drivers’ reaction time to critical events.
Results:
Three groups of drivers were observed on the basis of risky behavior, moderately risky behavior, and conservative behavior. Drivers in the conservative group stayed farther behind the lead vehicle than did drivers in the other two groups. Risky drivers responded later to critical events and had more ACC warnings issued.
Conclusion:
Safety consequences with ACC may be more prevalent in some driver groups than others. The findings suggest that these safety implications are related to trust in automation, driving styles, understanding of system operations, and personalities.
Application:
Potential applications of this research include enhanced design for next-generation ACC systems and countermeasures to improve safe driving with ACC.
Introduction
The modern-day vehicle consists of a great deal of automation designed to improve highway capacity and driver safety. One such automation is adaptive cruise control (ACC), a system designed to assist drivers with automated longitudinal driving control by maintaining the driver’s preset speed to the extent possible within constraints of a preset headway from a lead vehicle. Studies on drivers’ use of ACC have shown that it can improve driving comfort and enhance traffic flow (Bose & Ioannou, 2001; Hoedemaeker, 2000; Kesting, Treiber, Schönhof, & Helbing, 2008; Liang & Peng, 2000). However, the benefits of ACC related to safety are not as clear. Some studies indicate safer driving with ACC, as demonstrated by lower maximum speeds, fewer speed variations (Bjørkli & Jenssen, 2003; Suzuki & Nakatsuji, 2003; Törnros, Nilsson, Östlund, & Kircher, 2002), and fewer headway variations (Ward, 2000). Less-safe behavior has also been observed, such as more frequent off-road glances during ACC use (Thompson, Tönnis, Lange, Bubb, & Klinker, 2006) and harder braking (Bjørkli & Jenssen, 2003).
In these studies, researchers have examined ACC safety consequences by comparing drivers’ performance with and without ACC use. The examination of risk compensation (homeostasis) theory (Trimpop & Wilde, 1994) requires understanding the user’s own level of acceptable risk and changes in behavior over time, as previously examined in drivers who use antilock braking systems (Aschenbrenner & Biehl, 1994; Grant & Smiley, 1993; Sagberg, Fosser, & Saetermo, 1997; Winston, Maheshri, & Mannering, 2006), variable speed limit information (Boyle & Mannering, 2004; Jackson & Blackman, 1994), and airbags (Sagberg et al., 1997; Winston et al., 2006).
Although behavioral adaptation is acknowledged in the use of new technology, little has been established regarding underlying explanatory factors and processes (Rudin-Brown & Noy, 2002; Saad, 2004). Llaneras (2006) has indicated that behavioral adaptation extends beyond changes in driver performance to also include drivers’ attitudes and feelings as well as their mental model of the system operation, capabilities and limitations, and utility and effectiveness and its impact on driving styles. As expected, capturing all of these components is a complex task.
There are implications related to behavioral adaptation from prolonged exposure to ACC. The system has been available in the United States since 2001, but the number of active users is still relatively small. However, those who used ACC when it was first marketed to general consumers (henceforth called early adopters) can provide initial insights on safety as well as adaptive behavior.
Previous field operational tests and simulator studies have provided some insights on short-term performance, behavioral changes, and safety among early adopters of ACC (Hoedemaeker & Brookhuis, 1998; Hoedemaeker & Kopf, 2001; Sayer, Fancher, Bareket, & Johnson, 1995; Stanton, Young, & McCaulder, 1997). Long-term adaptation has also been implied in surveys, and responses suggest that during the course of months or years, changes in performance and reliance can occur (Jenness, Lerner, Mazor, Osberg, & Tefft, 2008; Llaneras, 2006). These studies showed that ACC was well received among early adopters primarily on the basis of its perceived convenience and improved safety. However, few respondents fully understood how the system operated and overestimated the effectiveness of ACC in situations in which it does not work appropriately. Both automation overreliance and a lack of system understanding may cause misuse of the system. In situations in which system limits are exceeded, more critical “near-misses” or collisions may occur.
This study focuses on ACC use patterns of current users and examines the differences and safety consequences of a shared and cooperative control system (Flemisch, Kelsch, Loper, Schieben, & Schindler, 2007). Both the driver and the ACC system share control of the vehicle at the same time, and both receive feedback from the vehicle for subsequent control. The ACC system can also alert the driver when a safety critical event occurs such that the driver can override it as needed. According to this control model, each controller in the loop (the driver and ACC system) will exhibit different responsibilities or driving tasks.
The driver, as a higher-level controller, needs to supervise the ACC system and even override as necessary in addition to monitoring road environments. The driver’s mental model of ACC (attitudes, feelings, and knowledge), trust in ACC (Rajaonah, Anceaux, & Vienne, 2006), and driving styles have effects on maintaining these driving tasks and will further affect driving safety. These variables are, therefore, considered as inputs from the driver. When the ACC automation is engaged, it will detect the lead vehicle and maintain headway distance and speed as well as provide feedback to the driver. The gap and speed setting inputs will regulate the ACC system and further affect safety. The actions from the driver, the ACC system, and the cooperation between them have an overall influence on driving safety (see Figure 1).
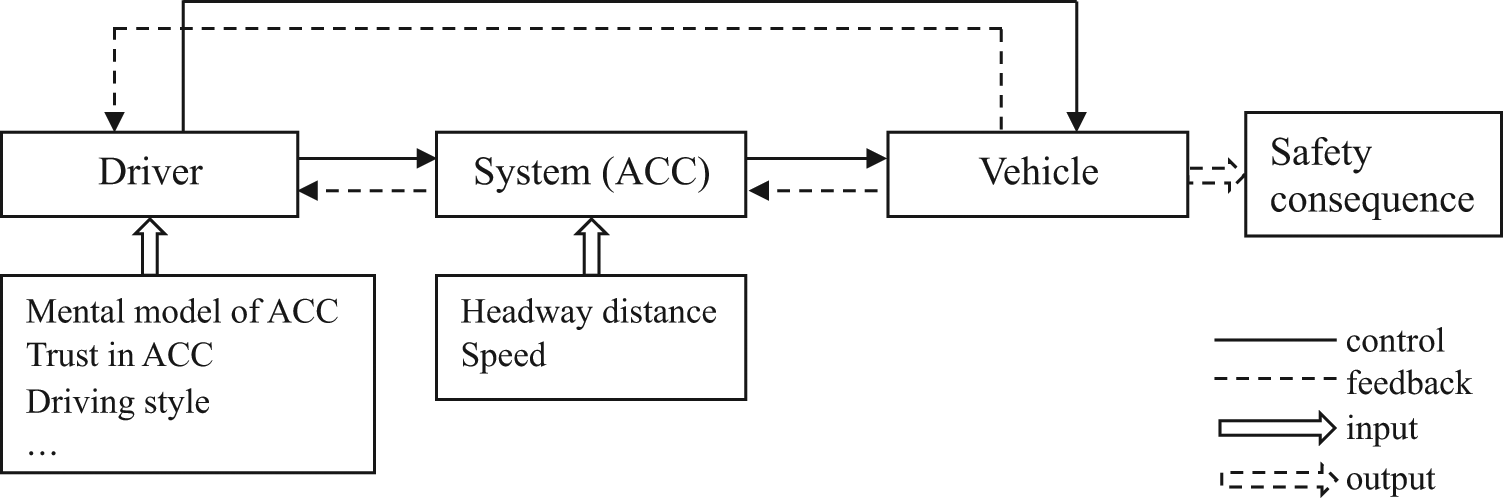
Driver-system-vehicle model for adaptive cruise control.
Drivers’ behavior may change given changes in driving tasks and safety issues. Hence, a good understanding of drivers’ adaptation to ACC after prolonged use becomes essential for recognizing the potential safety benefits of the system. In this study, it is hypothesized that early adopters will exhibit distinct ACC use patterns (adaptive behaviors). By investigating subgroups based on use patterns, we can determine why certain drivers will cooperate better with ACC than others and how ACC can be potentially used for safety among different driver groups.
Method
Participants
There were 24 participants with a registered Toyota or Lexus solicited from a motor vehicle database from the Iowa Department of Transportation (Dickie & Boyle, 2009). This institutional review board–approved (No. 200809771) database included a list of Iowa-registered vehicles that could be equipped with ACC by make, model, and year. All participants were screened for some ACC experience and drove at least 4,830 km per year. The mean age was 55.8 years (SD = 13.7, minimum = 31, maximum = 77). There were 14 males with a mean age of 60.4 years (SD = 14.2) and 9 females with a mean age of 48.8 years (SD = 9.9). Participants’ median self-reported driving distance with ACC was 21,726 km (range = 483 to 87,758). We excluded one driver because of the low percentage of ACC use during the study drive.
Apparatus
The driving simulator
The University of Iowa’s motion-based simulator (National Advanced Driving Simulator) was used in this study. It consisted of a motion base with 13 degrees of freedom and a 24-foot-diameter dome in which the cab of a passenger vehicle was mounted. The dome could rotate around its vertical axis by 330° in each direction and moved independently along the x-axis and y-axis in a bay 64 ft × 64 ft. The visual system consisted of eight LCD projectors that projected a 360° photorealistic virtual environment.
The ACC system
The ACC system was based on the Toyota Dynamic Laser Cruise Control system and could be engaged only within a speed range of 40.3 to 141.5 km/h. ACC controls and display features were also designed similarly to this vehicle (Figure 2). Two types of alerts may also appear as needed. The ACC will automatically disengage and send an audio alert of termination at a speed of 40.3 km/h or lower. When the leading vehicle brakes hard and the required deceleration rate exceeds the ACC maximum rate (0.3 g), an audio alert of deceleration limit exceedance is also sent.
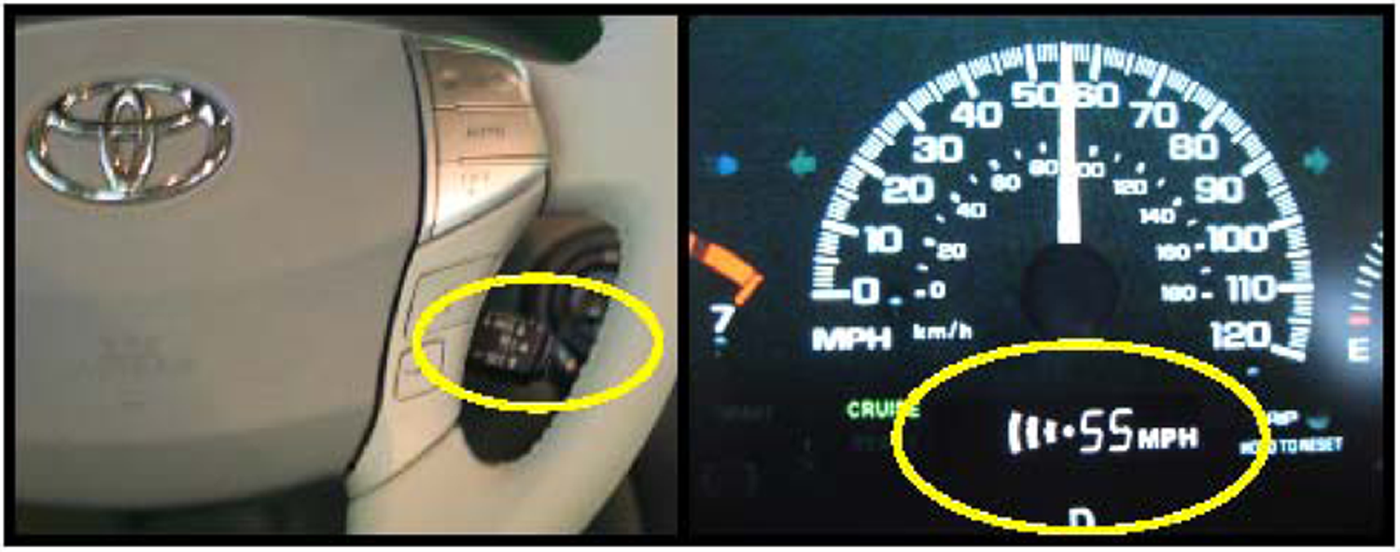
Adaptive cruise controls (left) and display (right) in the motion-based simulator.
We conducted real-world testing on a 2010 Toyota Avalon in a variety of roadway and traffic environments to validate the realism and performance of the ACC model. The data from the accelerometer were collected at 10 Hz and included longitudinal acceleration, lateral acceleration, and engine revolutions per minute (RPM). A laptop data acquisition system was also connected to the car’s onboard diagnostic system port and was used to collect engine RPM, engine load, throttle input, and velocity. Finally, a video camera and digital voice recorder were used to record the icons and alerts generated by the car and to assist in deducing any unknown model parameter values. The model included built-in lag for detecting vehicles, adaptive limits on deceleration and jerk, and adaptive sensor object detection on curves.
Driving Environment and Tasks
The simulated driving environment controlled for the road geometry (straight and curve) and road type (rural, interstate, and residential). The radius of the curved roads ranged from 91 m to 1,173 m. The distance of rural, interstate, and residential road segments is 22 km, 21 km, and 3 km, respectively. The main study scenarios consisted of 14 events and had an estimated drive time of about 30 min (i.e., each event appears approximately 2 min apart). Of the 14 events, 3 were critical events, 3 were noncritical events, and 8 were other types.
Critical events were designed to elicit crash-avoidance maneuvers from the driver (e.g., braking or steering) and included a braking lead vehicle with a high deceleration rate (exceeding the ACC maximum deceleration rate of 0.3 g) on both curved and straight roads. Noncritical events did not require crash-avoidance maneuvers from the driver, and the ACC system could safely respond to the events. The noncritical events included a braking lead vehicle with a low deceleration rate (not exceeding the ACC maximum deceleration rate) on both curved and straight roads. Other events may or may not have required crash-avoidance maneuvers from the driver, and these include encounters with a vehicle that was slow moving, stationary, cutting in, or entering or exiting an interstate ramp. These were not considered critical or noncritical because the deceleration rates were not controlled but were included to add realism to the experiment.
During the drive, seven events occurred in the rural environment, six events appeared in the interstate environment, and the stationary vehicle event happened in the residential environment. There were two main study drives administered between participants to control for any order effect associated with the sequence of events. The order of the matched critical and noncritical events and the location of the curve entering-detection events were balanced between these two study scenarios. The lead vehicle decelerating events occurred in identical (paired) straight and curve segments in the rural environment and in identical straight segments in the interstate environment. A preliminary analysis showed no significant differences between the two study drives. Therefore, they were not separated out in the final data analysis.
Procedure
After arrival at the testing facility, participants completed an informed consent form and surveys covering general questions about their driving style and background, previous experience with ACC, health history, and trust in ACC. Participants were then provided with an overview presentation of the simulator cab and the ACC system to be used on their drive. Immediately afterward, they completed an estimated 5-min practice drive in the interstate environment to become familiar with the simulator and the ACC system. The main study began after participants reported that they were comfortable in the simulator and understood the tasks. Participants were instructed to drive with the ACC engaged as much as they were comfortable doing so but also to drive as they would normally. After the drive, participants completed a questionnaire to assess the realism of the simulator and a postdrive questionnaire asking questions about three video clips that reflected key events in the drive (e.g., critical driving event, stationary vehicle).
Performance Measures
We used three measures to examine driving performance. These measures included the vehicle’s relative position to a lead vehicle (minimum time headway [MTH]), the minimum allowed reaction time from the controller (adjusted minimum time to collision [AMTTC]), and driver’s reaction time to critical events.
The MTH, defined as the minimum time it would take the participant’s vehicle to travel the distance from the participant to the lead vehicle given the participant vehicle’s current velocity, has previously been used to study behavioral adaptation (Hoedemaeker & Brookhuis, 1998). The AMTTC was defined as the amount of spare time the controller (either the driver or ACC system) has available on the basis of the avoidance response chosen. This measure differs from the traditional minimum time to collision by accounting for the change in velocity as well as change in deceleration rate, which allows a more accurate and robust approach to examine crash scenarios (Brown, 2005). The driver’s reaction time was defined as the elapsed time from the initiation of the event, for example, when the lead vehicle began to decelerate (indicated when the lead car brake lights came on), to the driver’s initial steering wheel or braking response and has been used in studies related to a new in-vehicle technology and driver distractions (Consiglio, Driscoll, Witte, & Berg, 2003; Srinivasan & Jovanis, 1997).
Drivers’ Sense of Realism
There is always a concern when conducting a simulator study that the scenarios and system may not be “realistic enough.” Responses to the postdrive questionnaire regarding the simulator’s resemblance to real-world driving were solicited. The responses were based on a 7-point Likert-type scale ranging from 0 (not realistic at all) to 6 (completely realistic). The mean and median scores for the majority of questions were 4 and higher, indicating that drivers did perceive the scenarios to be fairly realistic (see Table 1 for a subset of the 19 questions on realism).
Summary (Mean, Median) of Participant Responses to Simulator Realism Assessment
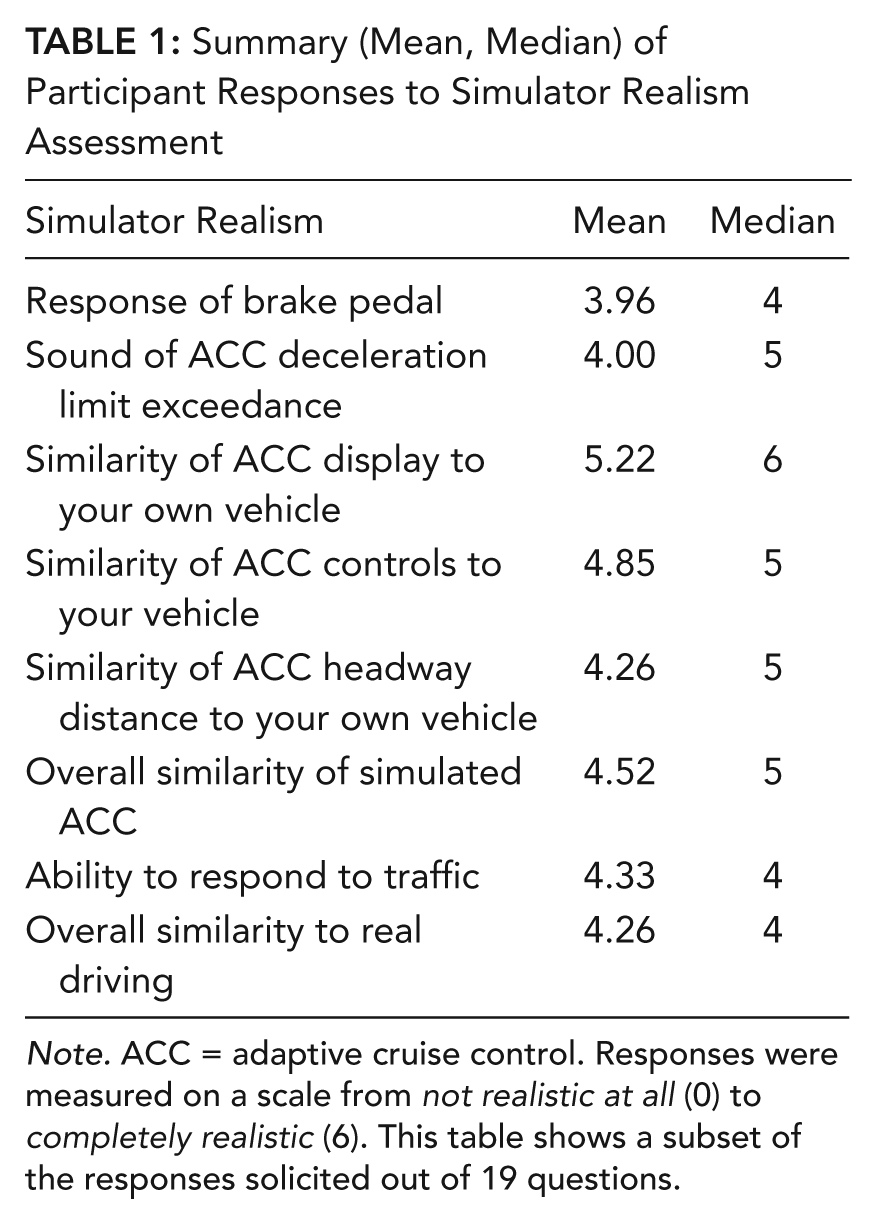
Note. ACC = adaptive cruise control. Responses were measured on a scale from not realistic at all (0) to completely realistic (6). This table shows a subset of the responses solicited out of 19 questions.
Data Analysis
Studies suggested that there were subgroups of ACC users based on age, experience, and drivers’ awareness of ACC system limitations (Dickie & Boyle, 2009; Jenness et al., 2008; Rajaonah et al., 2006). The subgroups in Dickie and Boyle’s (2009) study were determined on the basis of cluster analysis, a method proven useful in other studies that have examined technology use among driver groups (Conquest, Spyridakis, Haselkorn, & Barfield, 1993; Deery & Fildes, 1999; Donmez, Boyle, & Lee, 2010; Lee, McGehee, Brown, & Reyes, 2002). This same methodology was used in this study to cluster drivers on the basis of ACC use patterns to gain insights on potential safety consequences.
The cluster analysis was developed with the use of statistical software R with the hierarchical clustering method of Ward’s minimum variance. This method was chosen on the basis of minimizing the error sum of squares between two clusters added across all the variables and is most appropriate for quantitative variables. The number of clusters was determined from the pseudo F (PSF) statistics, which is a measure of between-cluster variation divided by within-cluster variation and can capture the “tightness” of clusters.
Drivers’ adaptive behavior can be measured by their use of ACC (driver-system) and is demonstrated in this study by drivers’ preferred selections of headway and speed and their intervention preference with ACC. The specific measures used included total number of times ACC was disengaged; percentage of time the short, medium, or long gap settings were selected; the total number of warnings issued; and the differences between average set speed and speed limit. These variables were collected across the entire drive for each participant and were therefore used as the clustering variables.
Drivers’ mental model of ACC (attitudes, feelings, and knowledge), trust in ACC, and driving habits could be appropriate subjective measures to capture differences in behavior across cluster groups. These cluster groups may also vary in driving performance, and these can be observed in the three performance measures collected from the simulator: MTH, AMTTC, and drivers’ reaction time to critical events.
We assessed statistical differences of subjective variables among the cluster groups using a bootstrapping sampling technique. Bootstrapping is a computer-intensive approach to statistical inference that constructs a number of resamples of the observed data set by random sampling with replacement from the original data set (Efron, 1979; Efron & Tibshirani, 1994). Bootstrapping procedures can be used when the theoretical distribution of a statistic is complicated or unknown or when the sample size is insufficient for straightforward statistical inference (Adèr, Mellenbergh, & Hand, 2008). The 95% confidence interval (CI) was examined, and statistical significance was assessed if the pairwise test did not include zero. Linear mixed-effects model takes into account within-subject effects and unequal variances. Therefore, this model was used to evaluate driving performance among cluster groups.
Results
Cluster Analysis
The PSF statistics suggested that three clusters (PSF = 9.23) were appropriate compared with two (PSF = 10.3) and four clusters (PSF = 15.5). These clusters were classified as conservative, moderately risky, and risky. Drivers in the conservative group selected lower set speed and longer gap settings and had fewer warnings. Therefore, this cluster was considered to be the least risky group. Drivers in the moderately risky group set higher speed and shorter gap settings, but they drove moderately safely, as demonstrated by the smallest number of warnings. Drivers in the risky group had the most warnings and the smallest number of ACC-disengaged events (Table 2). As shown in Figure 3, conservative and moderately risky drivers had significantly fewer warnings than risky drivers (ΔC-R = −2.82, CI [−3.33, −2.33], and ΔM-R = −2.95, CI [−3.50, −2.43]). (C-R is the mean difference between conservative and risky clusters, M-R is the mean difference between moderately risky and risky clusters, and so forth.)
Mean Values for Adaptive Cruise Control (ACC) Use Pattern by Cluster Group
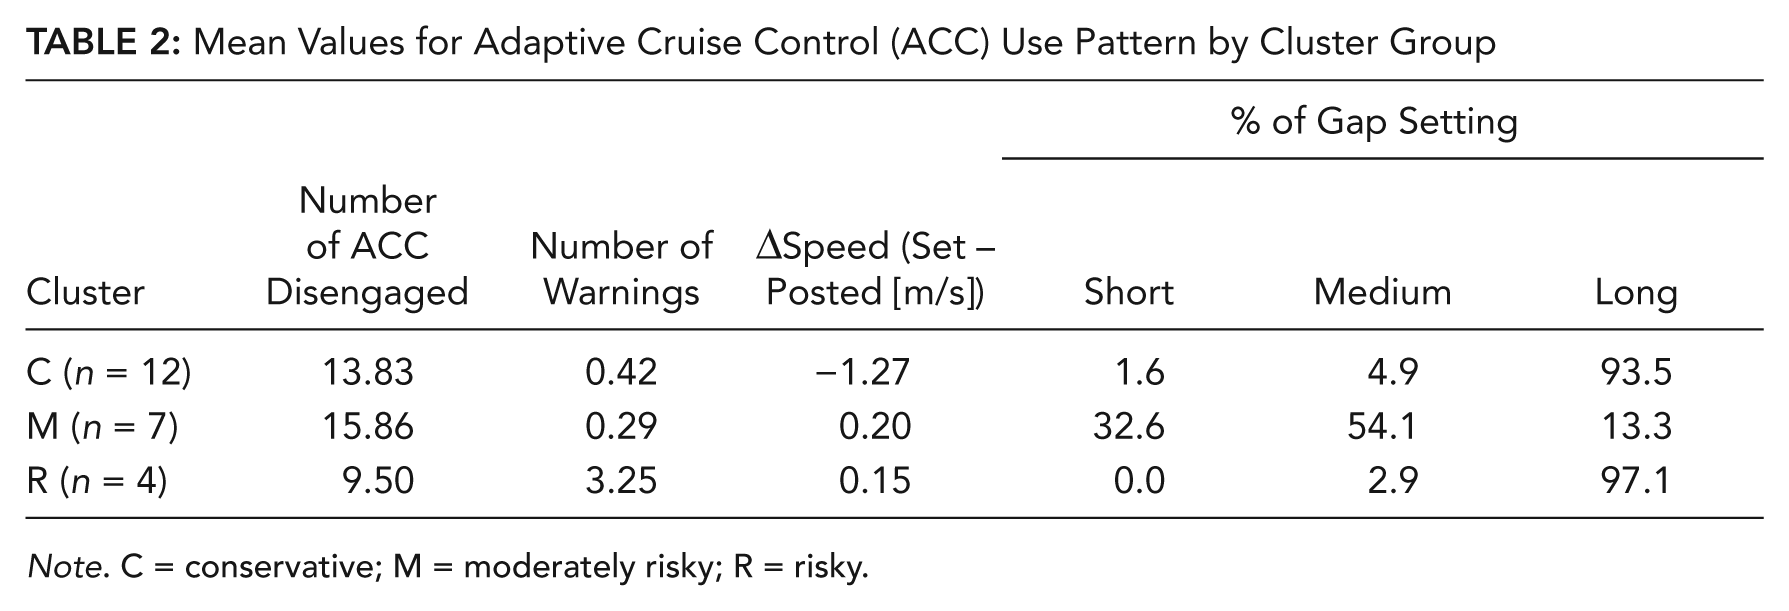
Note. C = conservative; M = moderately risky; R = risky.
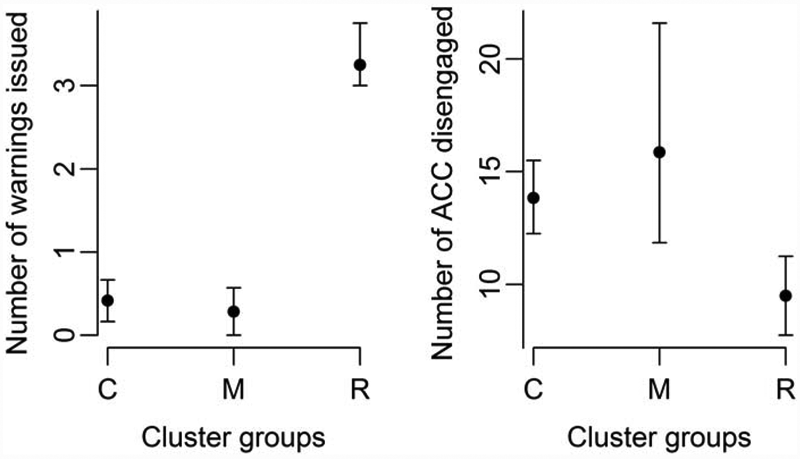
The different use patterns among cluster groups: conservative (C), moderately risky (M), and risky (R).
The proportions of males in the conservative, moderately risky, and risky groups were 66.7%, 57.1%, and 50.0%, respectively. There were no significant differences in gender proportions among the cluster groups (p = .86, Fisher’s exact test). We measured experience by the number of kilometers driven with the ACC vehicle, and others also used this surrogate measure to examine early adopters of ACC (Jenness et al., 2008; Llaneras, 2006). Experience was divided into three groups by total kilometers driven with the ACC vehicle: between 0 km and 32,187 km (0 and 20,000 miles), between 32,188 km and 64,374 km, and greater than 64,374 km. The group with the most experience was the conservative cluster, with 41.7% (moderately risky = 14.3%, risky = 25.0%).
Participants were also examined across two age groups: age 60 and younger, and older than 60 years. The risky group appeared to have the largest proportion of drivers 60 and younger (75.0%), with a mean age of 54.3 years (the conservative and moderately risky group had 50.0% and 57.1%, respectively). However, there were no significant differences across experience (p = .56, Fisher’s exact test), nor were there any differences observed between age groups (p = .86, Fisher’s exact test) among the cluster groups.
Subjective Measure Analysis
Studies have shown that trust may affect the use of automatic controllers (Dzindolet, Peterson, Pomranky, Pierce, & Beck, 2003; Lee & See, 2004; Parasuraman & Riley, 1997). There were 12 questions related to trust in ACC reflecting drivers’ attitude to ACC operation, the extent to which ACC performed properly, and the drivers’ self-confidence in manually intervening. Each question was answered on a scale that was based on the degree to which participants trusted ACC from 0 (not at all) to 100 (extremely high) (Muir & Moray, 1996).
There were significant differences among 5 of the 12 trust questions. Drivers in the conservative group were more likely to count on the ACC system to do its job when compared with drivers in the moderately risky group (ΔC-M = 19.61, CI [5.23, 34.66]). Compared with the other two groups (ΔR-C = −13.42, CI [−22.75, −4.66]; ΔR-M = −11.93, CI [−22.79, −0.78]), drivers in the risky group were less likely to trust ACC to work the same for similar circumstances at different time periods. Drivers in the moderately risky group had less trust in the ACC system’s display than did drivers in the other two groups (ΔM-C = −18.88, CI [−39.62, −1.12]; ΔM-R = −21.64, CI [−42.73, −3.21]). Drivers in the conservative group had higher overall trust in the ACC system when compared with drivers in the moderately risky group (ΔC-M = 22.04, CI [0.79, 45.66]). Drivers in the conservative group were more likely to trust their cooperation with the ACC system compared with drivers in the moderately risky group (ΔC-M = 20.55, CI [0.39, 40.29]).
There were three questions related to knowledge of ACC. Each question was on a 5-point Likert-type scale ranging from 1 (not at all), indicating aware, to 5 (very much), indicating unaware; and 6 corresponded to do not know (toward unaware). Drivers in the conservative group were more likely to know that the ACC does not function with a stationary vehicle compared with the moderately risky group (ΔC-M = −1.33, CI [−2.62, −0.02]). Drivers in the conservative group were more likely to know the ACC does not function well when a leading vehicle brakes hard compared with the risky group (ΔC-R = −1.50, CI [−2.75, −0.17]).
Driving style may also influence the use of automatic controllers, and we solicited 15 responses using a driving style questionnaire (West, Elander, & French, 1992). Each question was on a 6-point Likert-type scale ranging from 0 (never or very infrequently) to 5 (very frequently or always). Drivers in the moderately risky group were more likely to plan long trips in advance when compared with drivers in the other two groups (ΔM-C = 1.29, CI [0.07, 2.48]; ΔM-R = 1.63, CI [0.29, 2.79]). Drivers in the conservative group were more likely to like people giving them advice about their driving compared with drivers in the risky group (ΔC-R = −1.08, CI [−1.75, −0.50]). Drivers in the moderately risky group ignored distractions more easily while driving than did drivers in the risky group (ΔM-R = 0.82, CI [0.29, 1.46]). Drivers in the moderately risky group were more likely to drive faster than drivers in the other two groups (ΔM-C = 1.19, CI [0.12, 2.25]; ΔM-R = 1.57, CI [0.36, 2.64]). Drivers in the risky group passed vehicles more frequently on a four-lane roadway if they had the opportunity than did drivers in the conservative group (ΔR-C = 0.92, CI [0.08, 1.83]).
Performance Measure Analysis
Noncritical events
In terms of the ACC system, auto brake control is an essential factor that may affect safety consequence. Noncritical events were designed to allow ACC to safely respond to the event without any intervention from the driver. There were 69 noncritical events (or 3 per driver) in this study, and drivers responded to 21.7% of these noncritical events (Table 3). We evaluated both AMTTC and MTH between cluster groups by using linear mixed-effects models.
Response Frequency to Noncritical Events Among Cluster Groups

Note. C = conservative; M = moderately risky; R = risky.
Drivers in the moderately risky group responded to noncritical events more often than did drivers in the other two groups, and drivers in the risky group did not respond to any noncritical event. Significant differences in response frequency were shown between drivers in the moderately risky and risky groups (p = .03, Fisher’s exact test). Drivers in the moderately risky group also showed significantly shorter AMTTC (moderately risky vs. conservative, p = .004; moderately risky vs. risky, p = .01) and MTH (moderately risky vs. conservative, p < .001; moderately risky vs. risky, p < .001) compared with drivers in the other two groups, but there were no significant differences between drivers in the conservative and risky groups (Figure 4).
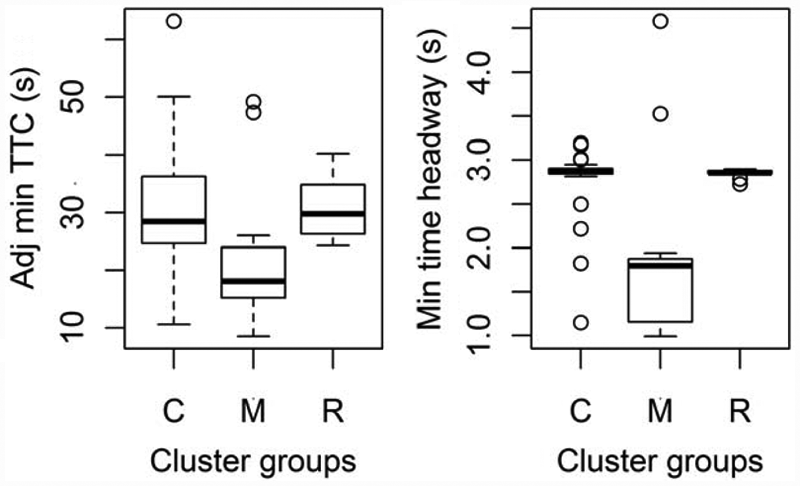
Performance during noncritical events.
Critical events
Critical events were designed to elicit crash-avoidance maneuvers from the driver. There were 68 critical events (1 event value was not recorded), with drivers responding to 97% of these events. Two nonresponses did occur: one from the conservative group and the other from the risky group. There were no significant differences for AMTTC among the three groups for critical events. Drivers in the conservative group had a significantly longer MTH compared with drivers in the moderately risky group (p = .008). Drivers in the risky group showed a significantly longer reaction time (risky vs. conservative, p < .001; risky vs. moderately risky, p = .01) compared with drivers in the other two groups (Figure 5).
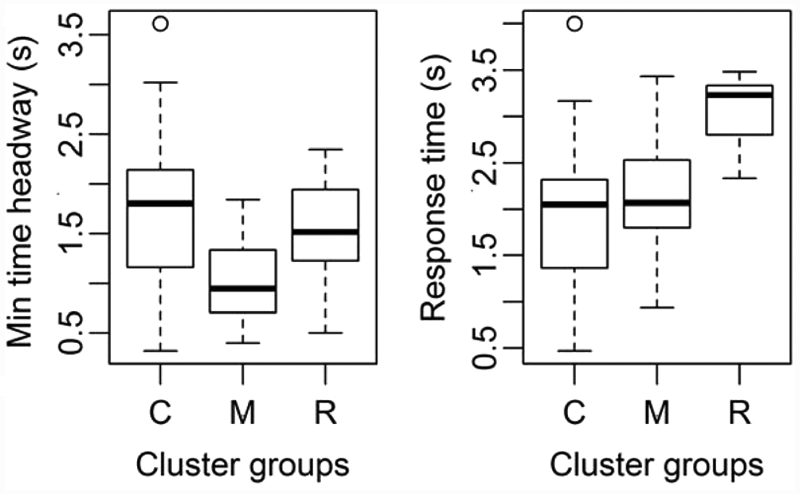
Performance during critical events.
Discussion
The driver-system-vehicle model identifies factors that can affect behavioral adaptation and safety in a shared and cooperative system, such as an ACC. Given that there are few early adopters using the same ACC configuration, the number of participants who can be recruited in any one region is limited. But initial studies in this area are important for future design considerations of not only ACC but other in-vehicle technologies that require shared cooperation with the driver. To overcome the limited sample size, the bootstrapping technique was used to help identify differences among three cluster groups of ACC users.
The conservative (and lowest risk) group selected longer gap settings and lower speeds when using ACC and had fewer warnings issued compared with the risky group. Drivers have been shown to be more aware of ACC limitations with prolonged use (Dickie & Boyle, 2009), and the drivers in the conservative group also demonstrated this finding. They had the most experience with ACC and awareness of ACC limitations compared with the other two groups. This group also showed a more cautious use pattern (lower speed setting and longer gap setting).
Drivers in the moderately risky cluster used shorter gap settings and higher set speeds and would intervene more frequently. These moderately risky drivers appear to be very confident in their driving skills (as revealed by the driving style questionnaire) and also received fewer warnings compared with the risky group. In contrast, the risky group never used the short gap setting, had the most warnings, and had the smallest number of disengaged ACC when compared with the other two groups.
Drivers in the moderately risky group were more likely to report driving faster and expected ACC to work even in situations when it would not, such as when approaching a stationary vehicle. In other words, this group was not as aware of the limitations of ACC as other groups and may actually misuse the system. Interestingly, this misuse may relate to the reported low levels of trust in ACC. Moderately risky drivers were also more likely to intervene when compared with the other two groups. Muir (1994) had observed similar behavior in operators intervening when trust in the automation fell below a certain threshold. Moderately risky drivers also reported being more likely to plan long trips and to more easily ignore distractions than did drivers in the risky group.
These behavioral characteristics are consistent with the mental model that is intrinsic within each driver as described by Rudin-Brown and Noy (2002). That is, some drivers are internals and believe their behaviors are guided by their personal decisions and efforts, whereas externals believe their behaviors are guided by external circumstances. These beliefs, in turn, guide what kinds of attitudes and behaviors people adapt. In this respect, the moderately risky group appears to be internals, and the risky group appears to be externals. Recognizing the connection between behavioral adaptation and psychological characteristics can provide further insights on how drivers adapt to ACC.
The risky drivers exhibited relatively high trust in ACC and displayed the most ACC usage in the simulator. However, they also had the most warnings. This phenomenon, known as automation complacency (Parasuraman, Molloy, & Singh, 1993) can exist if the operator trusts the automation too much. As a result, these drivers may fail to override the system when its operational limits are exceeded or if the system fails (Parasuraman, 2000). Hence, the risky drivers’ use of ACC may be more related to misaligned trust in the automation rather than intentional aggressive driving behavior.
As previously stated, drivers actually need to intervene during highly critical situations since ACC cannot decelerate quickly enough within this critical moment. This requirement may be an issue for drivers in the risky group since they responded later to critical events whenever ACC was engaged. This group was not as aware (as the conservative group) that ACC does not actually function well when a lead vehicle brakes hard. Hence, additional training on ACC would be useful since this lack of awareness can have serious safety implications.
It is noted that validation of this simulator study to real-world driving is still needed. Several speed validation studies, involving simulators and instrumented vehicles, have shown that the outcomes were not always the same but were consistent (Yan, Abdel-Aty, Radwan, Wang, & Chilakapati, 2008) with similar increases and decreases in speed and acceleration for various conditions (Godley, Triggs, & Fildes, 2002). In the current study, we assessed the sense of realism by soliciting drivers’ perception of the ACC system tested in the simulator compared with their own vehicle. The results suggested that the simulator was fairly realistic, but further studies are needed on road to examine these issues in greater detail.
A better understanding of drivers’ adaptive behavior with ACC will provide valuable insights for systems tailored for individual differences and more focused driver training. Our study demonstrated that some users are more aware of the system capabilities and, as such, appear to drive safer than others who are less aware. Other users have more trust in their driving skills and are able to cooperate with ACC. But there is also a group of ACC users who demonstrate greater overreliance on ACC with less understanding of the system capabilities and limitations. Recognizing these different use patterns will help enhance design and training for not only ACC but also other in-vehicle technologies to improve driving safety.
Key Points
With the use of a motion-based driving simulator to examine early adopters of adaptive cruise control (ACC), three distinctive groups of drivers were identified on the basis of use patterns.
Conservative drivers tend to stay farther away from the lead vehicle when compared with moderately risky and risky drivers.
Risky drivers responded later to critical events and had more ACC warnings.
Safety implications are related to mental model of ACC, trust in automation, driving styles, and personalities.
Footnotes
Acknowledgements
This work was supported by funding from the U.S. Department of Transportation (USDOT) National Highway Traffic Safety Administration (Contract No. DTNH 22-06-D-00043, Task Order 0005), with Stephanie Binder as the contracting officer, and by the National Science Foundation (NSF) under Grant Number IIS 1027609. The authors also acknowledge the National Advanced Driving Simulator for providing the simulator and survey data and the help of the researchers at the Human Factors and Statistical Modeling Laboratory for critical editing. Any opinions, findings, and conclusions or recommendations expressed in this article are those of the authors and do not necessarily reflect the views of the USDOT or NSF.
Huimin Xiong is a PhD student at the University of Washington. She received her MS in mathematics (2008) from the Wichita State University. She also has a master’s degree in business management and BS in chemical engineering from Tianjin University, China.
Linda Ng Boyle is an associate professor at the University of Washington. She received her PhD in civil and environmental engineering (1998) and MS in inter-engineering (1994), both from the University of Washington. Her BS is in industrial engineering from the State University of New York at Buffalo.
Jane Moeckli is a qualitative analyst with the Iowa City Veterans Affairs Health Care System. She received her PhD in geography from the University of Iowa in 2007.
Benjamin R. Dow is at the Chrysler Group, LLC. He received his BSE in industrial engineering from the University of Iowa in 2008.
Timothy L. Brown is a research scientist at the National Advanced Driving Simulator at the University of Iowa. He received his PhD in industrial engineering from the University of Iowa in 2000.