
Abstract
Introduction
The use of open rigid inflatable boats (RIBs) for high-speed transit is fundamental to contemporary maritime operations. The RIB transit phase delivers passengers (e.g., Special Forces, the Coast Guard, naval and rescue services) to their mission; however, degradations in physical and cognitive task performance immediately following it have been reported for experienced operators (McMorris, Myers, Dobbins, Hall, & Dyson, 2009; Myers et al., 2011). These degradations appear to be caused by the high level of shock and impact during the transit, so there is a need to investigate mitigation procedures to help passengers maintain their physical abilities during posttransit activities. Maintaining physical performance is important, as these specific passengers are required to carry out arduous physical tasks after completion of a transit (e.g., maritime interdiction, visit, board, search and seizure, search and rescue).
Maritime interdiction and visit, board, search and seizure operations often require the high-speed craft passengers to board or assault a large ship traveling at high speed, often at night, using wire ladders and wearing heavy, bulky operational equipment, including body armor. This posttransit boarding phase has been identified in maritime interdiction operations as a mission-critical failure point (Dobbins, Myers, Stark, & Mantzouris, 2010). The search and rescue task often requires boarding and lifting in restricted or precarious situations in which the ability to observe, think, act, and move quickly with strength and precision are important. Therefore, any reductions in cognitive and physical performance are likely to have an exaggerated impact on mission success and to expose personnel to increased risk of injury.
Suspension seats are widely used on land in road and off-road vehicles (Gunston, Rebelle, & Griffin, 2004) and increasingly in larger high-speed marine craft (e.g., U.S. Navy MkV Special Operations Craft and RNLI Tamar Class Lifeboat) to isolate the occupants from vertical shocks or impacts and vibration. However, these seats are bulky (e.g., the seat fitted to the MkV Special Operations Craft weighs around 65 kg before additional control equipment is fitted and requires electrical power), complex in design, and heavy, thus limiting their use on smaller open high-speed craft, such as RIBs, where both deck space and carrying capacity (payload) are restricted. However, an increasing number of suspension seats are becoming available for RIBs, but these seats are still heavier and considerably more expensive than standard seat designs. The lightest suspension seats available are around 20 kg, which could still be 2 or 3 times the weight of a basic fixed seat and 10 times the cost. Therefore, to justify the reduction in payload and their greater expense, it is important that suspension seats are shown to be effective at maintaining the performance of RIB passengers and crew.
Motion sickness is a common problem at sea (Lawther & Griffin, 1988b). Although the authors are not aware that suspension seats fitted to larger high-speed marine craft could increase the incidence of motion sickness, this possibility might not be the case for smaller vessels. Should the fitting of suspension seats to a RIB increase the incidence of motion sickness, then any likely beneficial effects would be reduced or possibly result in passengers’ arriving in a worse condition at the end of the transit compared with the start. Any reductions in physical or mental capacity are likely to affect operational performance (Gal & Mangelsdor, 1991).
The objective of this research was to investigate whether fitting compact, lightweight suspension seats in an open RIB craft would allow the physical performance of the passengers to be maintained following an open-sea transit. We conducted two transits, one in calm and the other in moderate-to-rough sea conditions. In each case, running performance immediately after a high-speed transit in an RIB fitted with the passenger suspension seats was compared with that by a group who used the standard RIB fixed seat. We hypothesized that any decrements in passengers’ running performance posttransit would be smaller for those on suspension seats compared with those on fixed seats.
Method
Approach and Participants
The study comprised two transits, one conducted in calm and one in rough sea conditions. The transits were conducted approximately a month apart and in the same location. Each transit involved two Royal Marine (men) specialist maritime boarding teams that were randomly assigned to an RIB fitted with either fixed or suspension seats (Table 1). The group numbers were equal for each experiment (calm, 5 vs. 5; rough, 6 vs. 6), and the RIBs transited simultaneously side by side. Each transit was preceded and immediately followed by a constant-speed shuttle run test for the assessment of individual team members’ physical performance. This assessment has been identified as a suitable methodology for measuring performance changes following high-speed RIB transits (Myers et al., 2011). Participants were instructed to avoid strenuous physical activity the week before their transit, with adherence enforced by team leaders. The study was conducted after review and approval by the U.K. Ministry of Defence Research Ethics Committee. All participants were volunteers and their written informed consent was obtained prior to their participation.
Participant Characteristics for the Calm and Rough Transits
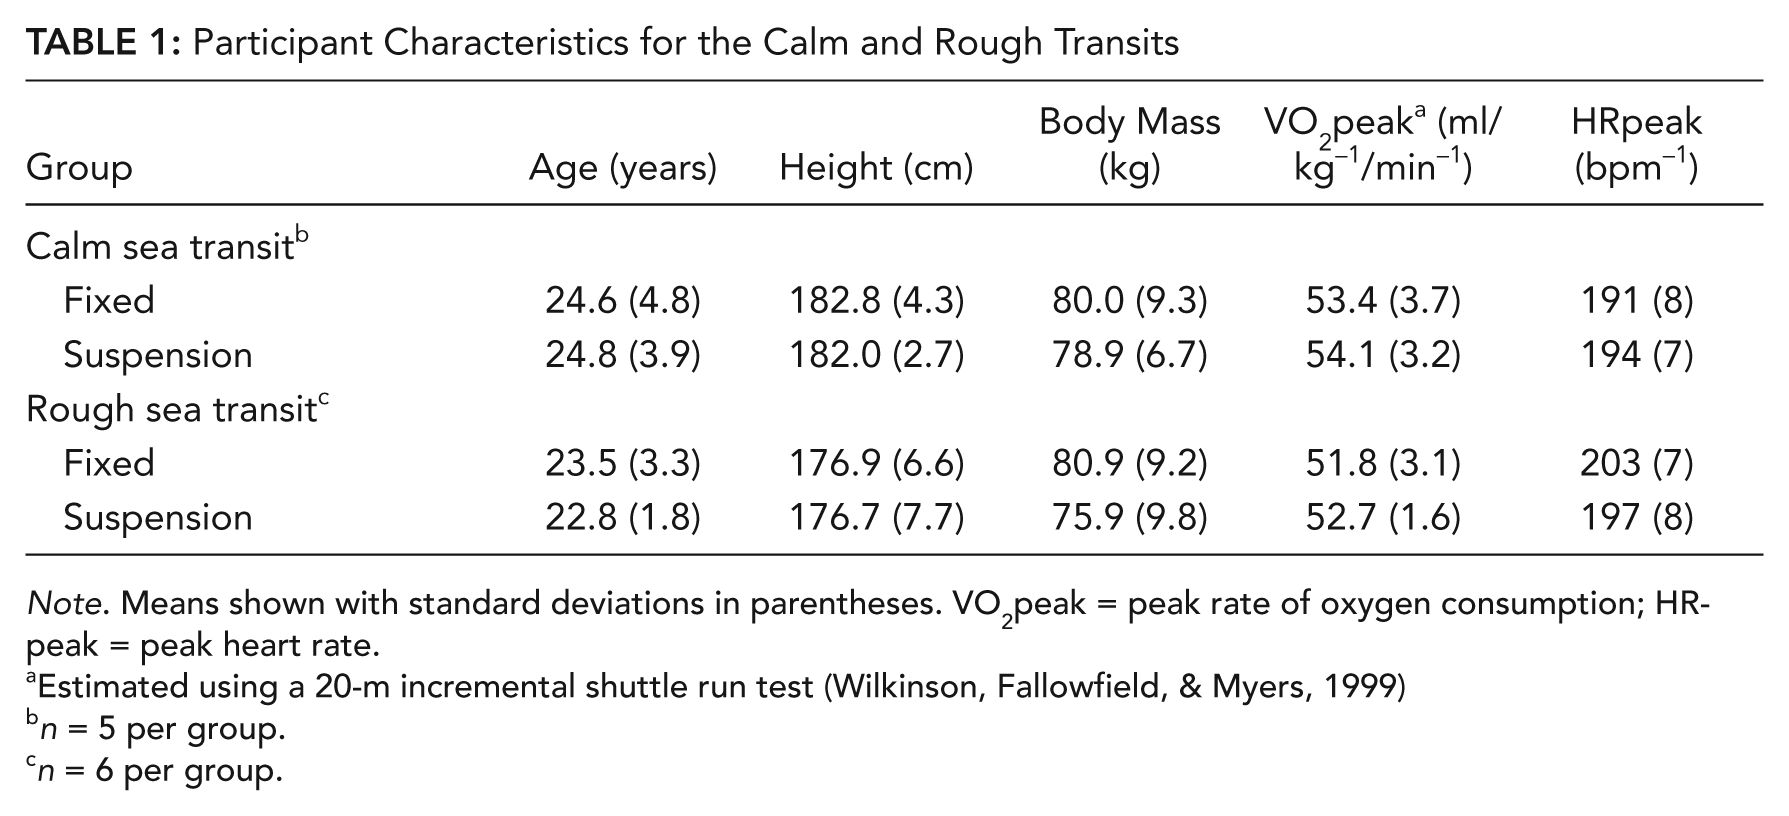
Note. Means shown with standard deviations in parentheses. VO2peak = peak rate of oxygen consumption; HRpeak = peak heart rate.
Estimated using a 20-m incremental shuttle run test (Wilkinson, Fallowfield, & Myers, 1999)
n = 5 per group.
n = 6 per group.
Two U.K. MOD 8.5-m RIBs (Arctic 28, BAE Systems Surface Ships, Portsmouth, United Kingdom) were used for the study. Of the two boats, one was left as standard, with its stock fixed straddle seats (weight 10 kg per pair), and the other had these seats replaced with six commercially available straddle-type suspension seats (Biscaya, Ullman Dynamics AB, Gothenburg, Sweden; weight 22 kg). The two seat types are shown fitted in Figure 1. Both seats required passengers to sit astride them with their feet on the deck. The suspension seats incorporated a composite leaf spring and damper to mitigate shock and vibration, whereas the standard seat was fixed and padded with closed cell foam. The suspension seats were mounted on custom manufactured frames to ensure their seat pan height was equal to that of fixed seat. The standard fixed coxswain seats were retained to ensure conformity of control in the RIBs.
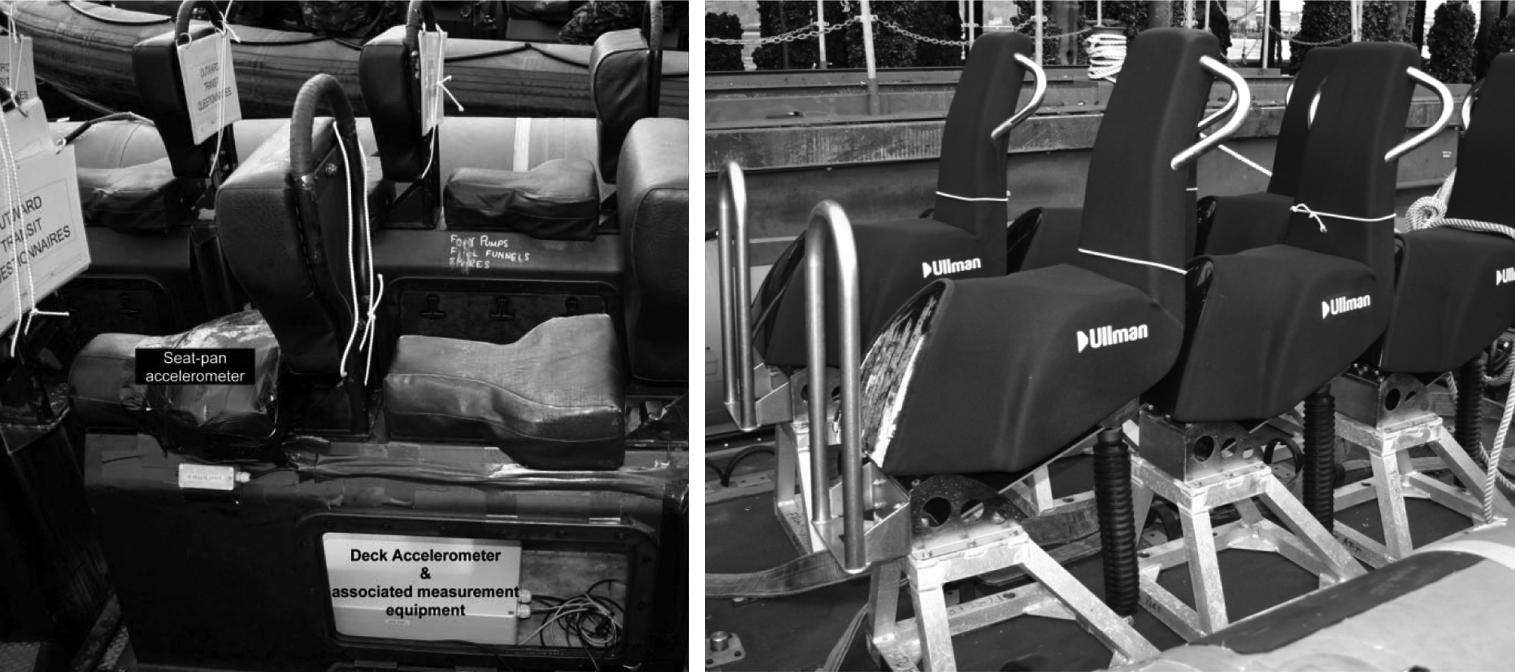
Fixed and suspension seats. The light-colored box seen below the port-side fixed seat housed the deck accelerometer and associated measurement equipment, which was covered by a hatch during transit. The seat pan accelerometer can be seen fitted to the forward of the two fixed seats. A measurement setup identical to that of the fixed seat was fitted to the corresponding suspension seat.
The duration of each transit was 3 hr and followed the same out-and-back course, with the two RIBs driven side by side at 40 knots. There was a short halt at the halfway point of the transit and before entering the harbor (while permission to enter was granted), when participants’ ratings of perceived exertion (RPE; Borg, 1982) and motion sickness (Golding & Kerguelen, 1992) were collected. During the transits, participants wore operational equipment (weapons, body armor, etc.), including maritime personal protective equipment (weight 25.1, SD = 3.7 kg). To minimize any affects that cold conditions during the transit may have had on posttransit performance, participants wore their issued high-insulation arctic warfare clothing over a base layer comprising service-issue boots, combat trousers, and T-shirt. Hearing protection was worn to control for the reported magnifying effect of noise on the perception of vibration (Howarth & Griffin, 1990). The transit-specific clothing and personal protective equipment were donned before the transit and doffed immediately after its completion.
Baseline Measurements
Each pair of teams completed a habituation session the week before their respective transits to familiarize them with all measurements and procedures. As part of this session, we administered an exhaustive 20-m incremental shuttle run test (20-m test), following the protocol described by Wilkinson, Fallowfield, and Myers (1999), to obtain an estimate of their peak rate of oxygen consumption (VO2peak) and a measure of their peak heart rate (HRpeak). The 20-m test was completed in a well-ventilated gymnasium with the participants wearing running shorts, T-shirts, and training shoes. Briefly, the 20-m test started at a running speed of 9 km/h−1 (2.5 m/s−1), and the participants were required to turn in time with an audible timing signal. The time interval between signals decreased for each shuttle to provide an increase in speed of 0.05 km/h−1 (0.01 m/s−1). The test was terminated when participants withdrew or they missed three consecutive timing signals. The number of shuttles completed was recorded and used in the calculation of peak running speed. We then used the peak running speed to calculate VO2peak (Table 1) using the equations of Wilkinson et al. Heart rate was recorded with the use of short-range telemetry (Team Polar, Polar Oy, Finland) and the highest 30-s value taken as HRpeak (Table 1).
Performance Measurements
The effect of the transit on passenger running performance was measured with a 12-m shuttle run test (12-m test), completed on the quayside, approximately 1 hr before and immediately posttransit. As with the 20-m test, participants were required to turn at the end of each shuttle in time with a timing signal, but for this test, the time interval was fixed and corresponded to a running speed of 11 km/h−1 (3.1 m/s−1). The withdrawal criteria were as for the 20-m test, and individual run times were recorded at volitional exhaustion, from which total run distance was calculated (run time/audible timing signal interval). Heart rate was recorded throughout the transit and during each 12-m test.
Environmental Measures
Air temperature and relative humidity were logged every 10 s during the 12-m runs and transits (Lascar EL-USB-2, Lascar Electronics, Whiteparish, United Kingdom), and air speed during the runs was recorded with a portable vane anemometer (AVM-01, Prova Instruments, Taipei, Taiwan). Transit air speed was assumed to be equal to average RIB speed. Air speed and air temperature were used to calculate the wind chill index and chilling temperature (Siple & Passel, 1945).
Transit Measurements
The speed and course of the RIB were logged with the use of GPS (AX22, Race Technology, Nottingham, United Kingdom). We measured impact of transit on each team member with a triaxial accelerometer (Seika B3, SEIKA Mikrosystemtechnik GmbH, Kempten, Germany) by attaching it to each RIB deck under the seat adjacent to the midpoint of the craft. The accelerometer measurement systems were configured with a measurement range of ±30 g and an overrange capability of 10,000 g. Vertical accelerations at the seat were measured with a single-axis Seika accelerometer. A static DC calibration was performed for each accelerometer before the beginning of each transit (British Standards Institution, 1994). The occupants of the instrumented seats in both RIBs were of similar stature and body mass in both sea-state conditions: calm (fixed, height = 180 cm, body mass = 99 kg; suspension, height = 182 cm, body mass = 101.7 kg) and rough (fixed, height = 170.5 cm, body mass = 104.8 kg; suspension, height = 170.5 cm, body mass = 100.3 kg).
Acceleration data were filtered to remove aliasing and were sampled at 2000 Hz. Online filtering was then performed to limit the bandwidth to 90 Hz before storage at 200 Hz (16-bit resolution) on a portable solid-state recorder (Embla A10, Embla Systems, Broomfield, CO). Transit acceleration data were reported as a Wk weighted root mean square (RMS) value and vibration dose value (VDV), in accordance with ISO 2631–Part 1:1997 (International Organization for Standardization, 1997), SAE J1013 (Society of Automotive Engineers, 1992), and Control of Vibration at Work Regulations (Health and Safety Executive, 2005). We also reported transit acceleration data as an impact count using the method described by Dobbins et al. (2008).
Briefly, we analyzed the transit vertical acceleration trace (Matlab, MathWorks, Natick, MA) to detect presence of impacts, which were assigned to according to their vertical acceleration to an appropriate bin covering a 0.2-g range. Data were reported in multiples of g, which were normalized for the acceleration attributable to gravity; that is, 1 g = 9.81 m/s−1. The cumulative impact count for each bin was plotted graphically for each transit with each bin (x-axis) labeled with the acceleration value at the start of its range. As low-magnitude bins tend to record general boat motions (Dobbins et al., 2008), lower bins were discarded (calm, <0.5 g; rough, <1.6 g). An estimate of average sea state for each transit was provided by the coxswains using the World Meteorological Organization sea state code (World Meteorological Organization, 2008). This code describes sea state according to the measurement or estimation of wave height.
Statistical Analysis
Statistical analysis was performed with PASW Statistics 18 (IBM UK, Portsmouth, United Kingdom). The Shapiro-Wilk test (Shapiro & Wilk, 1965) was used to determine the normality of data from dependent variables (heart rate, 12-m run test distance). Heart rate data were normally distributed so differences between seat types (independent variable) were compared within groups with paired t tests and between groups with independent t tests. The mean heart rate for the transit and HRpeak for the 12-m test were compared with the HRpeak measured during the 20-m test. The 12-m run test data were not normally distributed (p < .01), so seat types were compared within groups with the Wilcoxon’s signed-rank test (Wilcoxon, 1945), respectively, as were the perceptual data. Absolute percentage differences were calculated for the impact count data ([(seat count – deck count)/deck count] * 100) and mean percentage differences for the for the run and heart rate data ([(lower mean – greater mean)/greater mean] * 100). An alpha level of p ≤ .05 was considered statistically significant.
To assist the judgment of the importance any differences effect size (r) and 95% limits of agreement (for the 12-m run) were calculated according to the methods described by Field (2005) and Bland and Altman (1986), respectively. The limits of agreement for the run distance were derived from those data reported by Myers et al. (2011) for their control group (n = 12), who completed two 12-m run tests separated by 3 hr seated but with no sea transit. The difference was calculated between the mean pre- and post run distances and multiplied by the critical value of the t statistic for 11 degrees of freedom, as recommended by Hopkins (2000) for sample sizes of less than 20. This produced a 95% limits-of-agreement value of ±81.2 m. All data were presented as mean, 1 standard deviation.
Results
Performance and Perceptual Measurements
The run distances (in meters) during pretransit were similar between the two teams within each condition. The fixed groups’ posttransit run distance was reduced (Figure 2): calm (pretransit, M = 1274.9, SD = 523.7; posttransit, M = 1025.4, SD = 531.4), percentage change −20% (p = .068, r = .58); and rough (pretransit, M = 1507.7, SD = 404.1; posttransit, M = 1109.7, SD = 244.7), percentage change −26% (p = .028, r = .64). In comparison, the suspension groups’ run distance was effectively unchanged posttransit: calm (pretransit, M = 1471.9, SD = 554.9; posttransit, M = 1498.2, SD = 574.5), percentage change 2%; and rough (pretransit, M = 1691.7, SD = 338.7; posttransit, M = 1711.6, SD = 290.1), percentage change 1%.
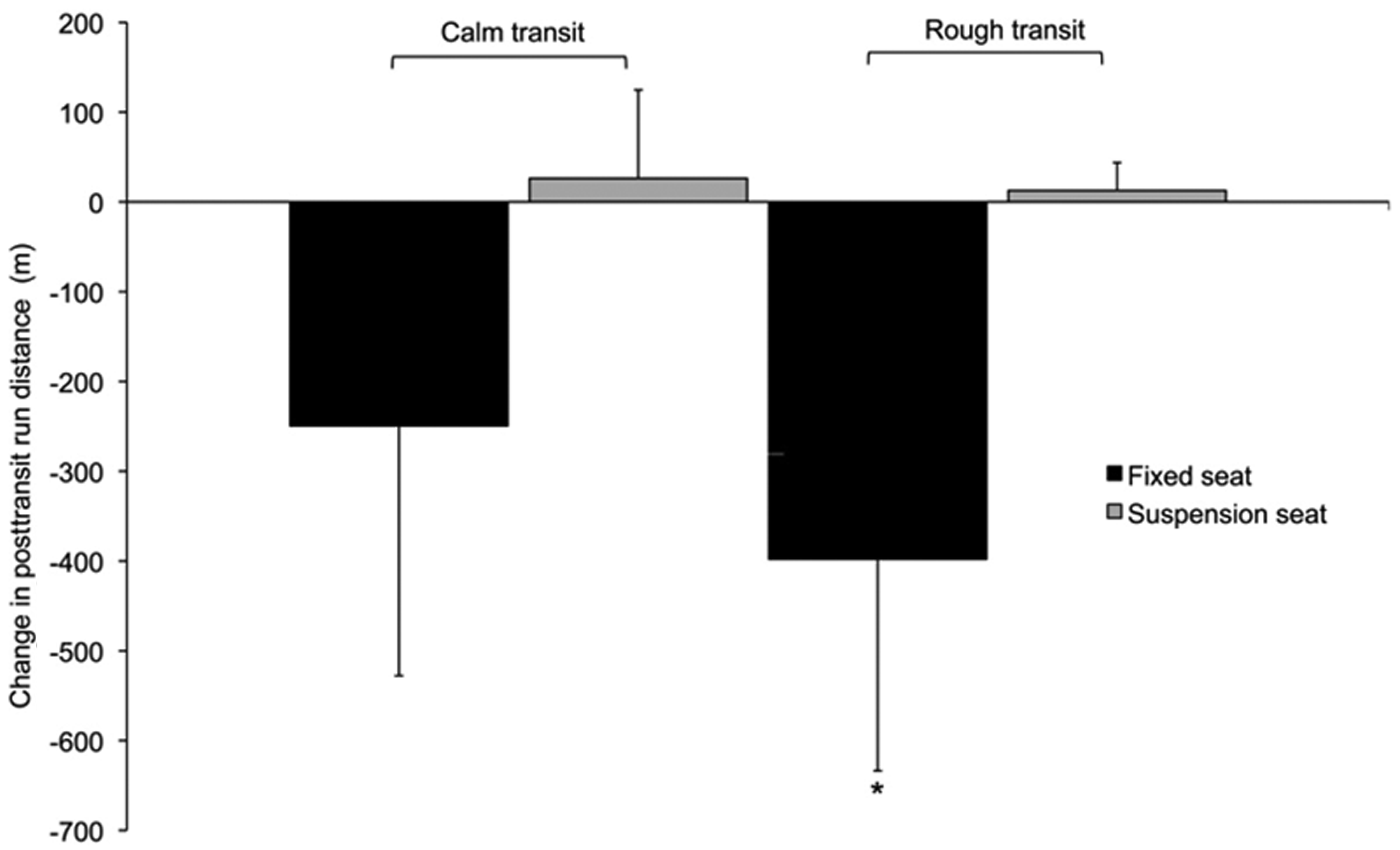
Changes in run test performance for the calm and rough transits.
There were no differences between HRpeak (Table 2) recorded during pretransit and that during posttransit shuttle run tests, for either of the transits, with figures ranging from 94% to 97% HRpeak (see Table 1 for HRpeak).
Heart Rates for the Calm and Rough Transits (bpm−1)
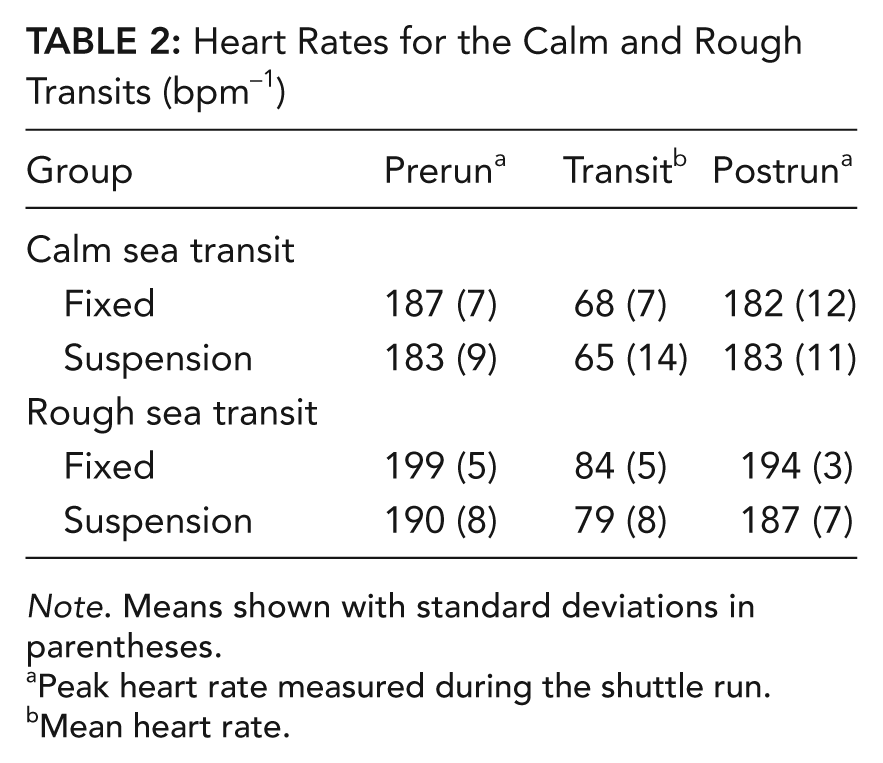
Note. Means shown with standard deviations in parentheses.
Peak heart rate measured during the shuttle run.
Mean heart rate.
The mean transit heart rates (Table 2) were similar between groups. The heart rates (percentage HRpeak) when pooled for each transit were higher for the rough condition, reflecting the sea state (calm, M = 35, SD = 5; rough, M = 42, SD = 3; p < .01, r = .69).The mean RPE during the outward and return legs of each transit were not different within groups, so the mean of the two were compared. There was no difference between the RPEs reported by each group (Table 3), indicating that participants felt only a “light” level of exertion during their respective transits.
Ratings of Perceived Exertion (RPE) and Motion Sickness for the Calm and Rough Transits
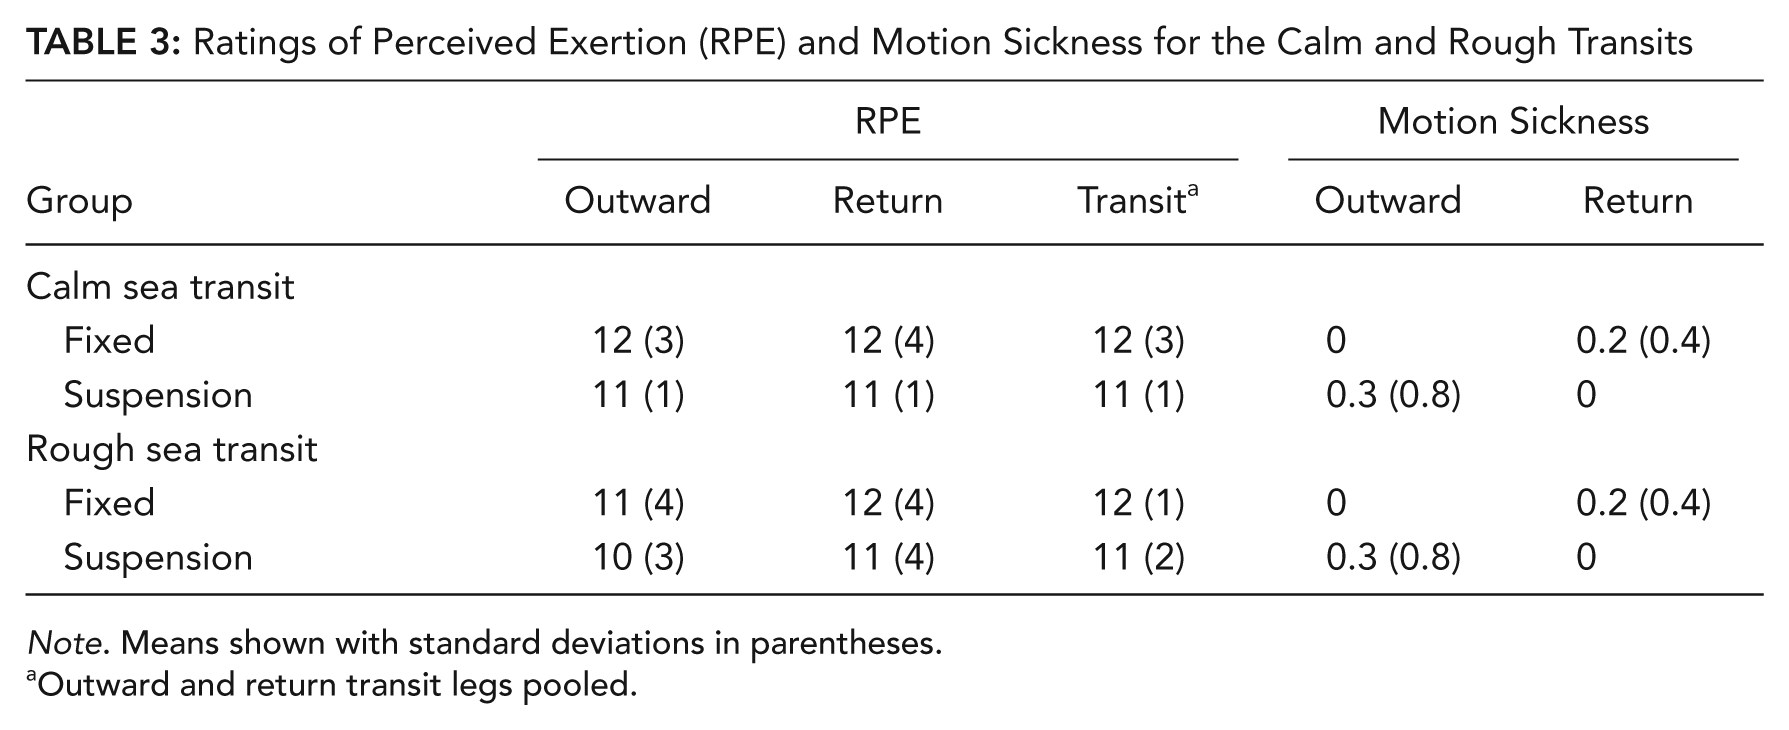
Note. Means shown with standard deviations in parentheses.
Outward and return transit legs pooled.
The motion sickness ratings given suggest there were no incidences of motion sickness (see Table 3).
Environmental Measurements
The environmental conditions were similar for both transits (calm, air temperature [tair] = 9°C, RH = 66%, wind chill index [WCI] = 1,042 W/m−2, chilling temperature [tch] = −8°C; rough, tair = 11°C, RH = 57%, WCI = 894 W/m−2, tch = −2°C). These environmental data categorize the environmental conditions for the calm transit as cold to very cold and for the rough transit as cold (Siple & Passel, 1945).
Transit Measurements
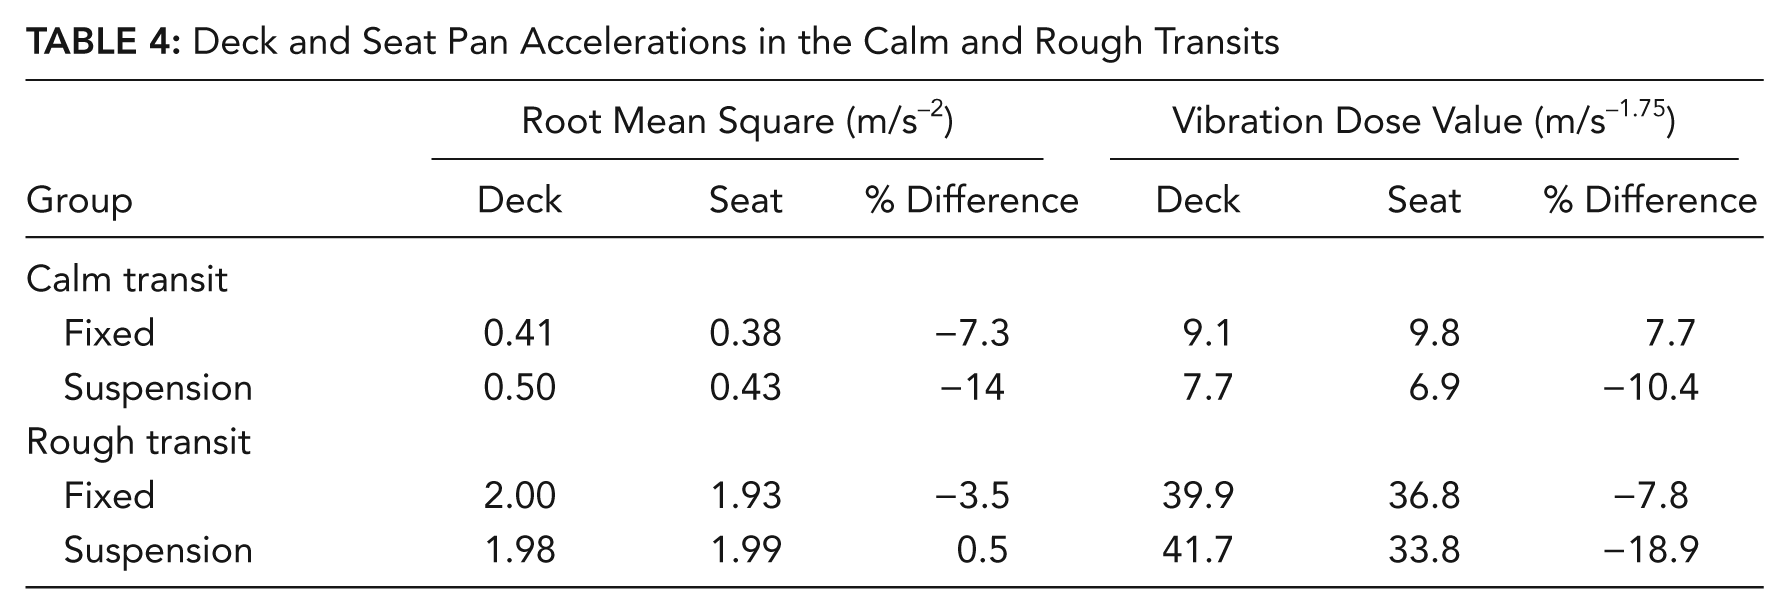
For both transits, the sea conditions resulted in predominately vertical accelerations with a negligible number in the lateral or fore and aft directions. As suspension seats are designed to mitigate vertical accelerations, only the vertical are reported. Table 4 shows the acceleration data expressed in two standard vibration reporting measures (Griffin, 1996).
Deck and Seat Pan Accelerations in the Calm and Rough Transits
Calm transit
For the calm transit, the weighted RMS values for both the suspension and the fixed boats (Table 4) corresponded with a comfort rating of fairly uncomfortable, derived from British Standards Institution (1987). Table 5 and Figure 3 showed that for the suspension-RIB deck, there were no impacts >1.6 g, and for the fixed RIB, there were none >2.6 g.
Impact Count and Peak Impacts for the Calm and Rough Transits
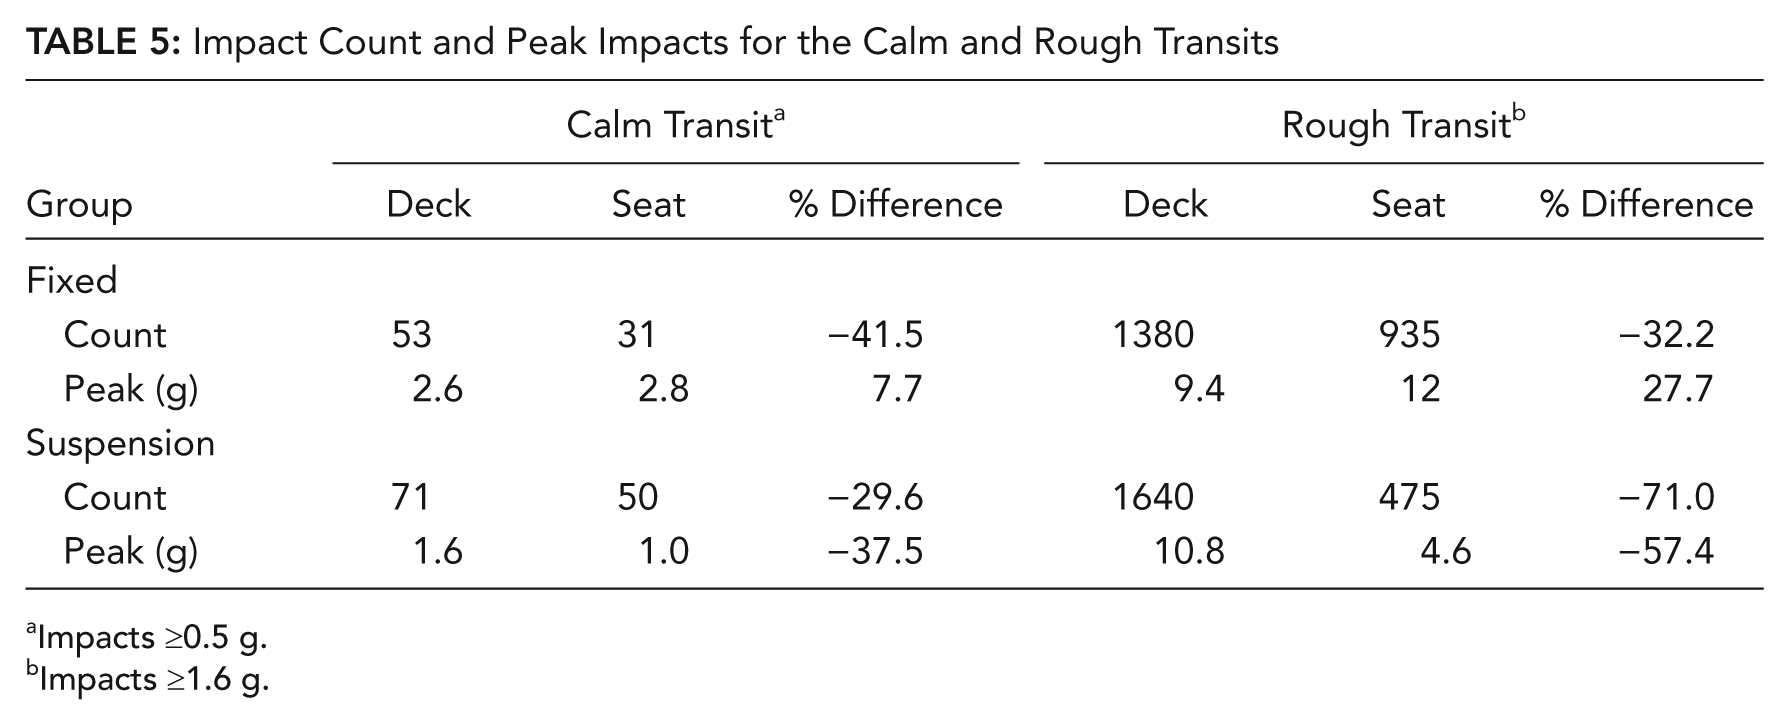
Impacts ≥0.5 g.
Impacts ≥1.6 g.

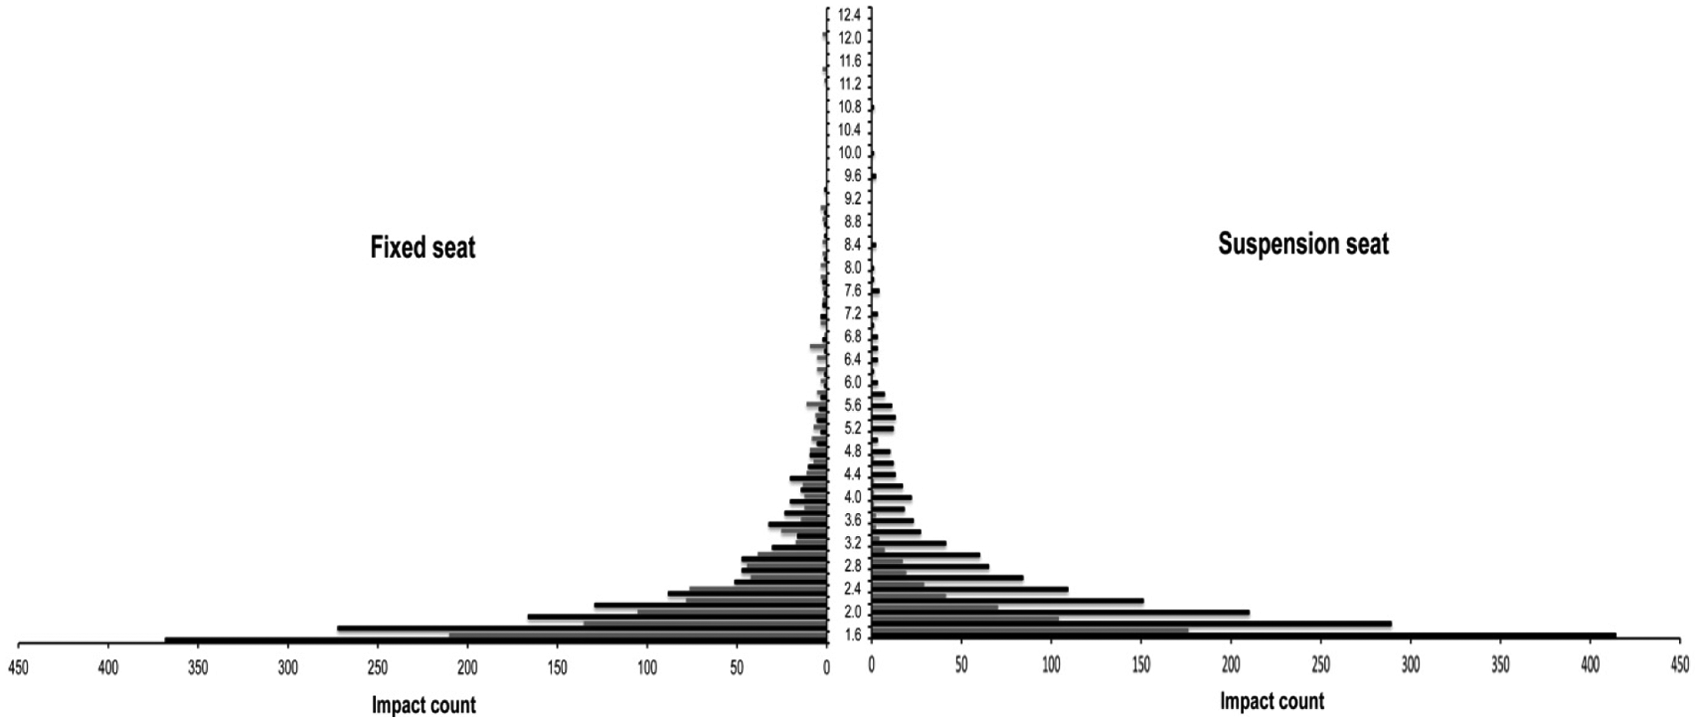
Vertical impact count for the calm transit. Black bars represent the deck and gray bars, the seat pan; y-axis shows vertical acceleration (g).
Rough transit
The standard acceleration RMS and VDV measures (Table 4) showed little to differentiate between the two seats. The weighted RMS values for both RIBs, deck, and seat pan corresponded with a rating between very uncomfortable and extremely uncomfortable. Table 5 and Figure 4 show that the number and peak magnitude of the deck impacts were greater on the suspension RIB compared with the fixed RIB. During the rough transit, both seats reduced the numbers of impacts recorded at the seat pan; however, the reduction for the suspension seat was about 40% greater when compared with the fixed seat (fixed, −32%; vs. suspension, −71%). A peak impact of 10.8 g (occurred at Minute 36 of the return transit leg) was observed on the suspension RIB deck, which the seat reduced by 57% to 4.6 g, whereas the fixed seat appeared to amplify its peak deck impact of 9.4 g (occurred at Minute 40 of the return transit leg) by 27% to 12 g.
Vertical impact count for the rough transit. Upper, ≥1.6 to 6 g; lower, ≥6.2 g. Black bars represent the deck and gray bars, the seat pan; y-axis shows vertical acceleration (g).
The sea conditions for calm transit were “flat calm” (sea state 0), whereas for the rough transit, there were wind-blown choppy waves, with a short wave period (sea state 2 to 3).
Discussion
The key finding of this study was that the use of lightweight suspension seats for high-speed marine transits in an open RIB maintained running performance, most likely through the reduction of the magnitude of the vertical shocks to which passengers were exposed.
Participants
For this study, specialized military personnel were purposely recruited from operational units for whom maritime boarding forms part of their current role. This was felt necessary because of the stressful nature of the environment and to increase the applicability of any findings to what is a small occupational group worldwide. It is recognized that this approach resulted in a small sample group for each transit and therefore may limit this study’s findings. However, the 22 participants in the two transits represent a reasonable percentage of the U.K. military population currently in that role. The participants were also homogenous in terms of their physical characteristics, with no differences between the groups, which would probably be expected, given the highly selective nature of their occupation. Also, the experimental design was realistic in terms of actual operations that are generally conducted in two small teams, each in an RIB.
Although the authors would like to have conducted multiple transits for each condition, this method was not possible, given, first, the unpredictable nature of the sea conditions and, second, the availability of personnel and extensive resources drawn from what is an operational unit on short notice to deploy. Despite the small sample sizes, the differences in running performance seen posttransit were substantial and had large effect sizes (r > .50; Cohen, 1992). The level of experimental control was also high for a field-based study. In particular, the level of access and the ability to control the physical activity of the participants limited what is often a confounding factor in studies involving military personnel (Hodgdon, Walsh, & Hackney, 2004).
Performance and Perceptual Measurements
Large reductions in distance run (in meters) were observed for the fixed-seat occupants immediately following both calm and rough transits (Figure 2). Although the reductions seen following the calm transit were not statistically significant (p = .068), the effect size was large (Cohen, 1992) and similar to that seen for the rough run reduction (calm, r = .58; rough, r = .64). When compared with the 95% limits of agreement (±81.2 m), the reduction in run distance following calm transit (−249.5 m) was more than 3 times greater, and the reduction following the rough sea transit (−398 m) was nearly 5 times greater. The large effect sizes and comparisons with the 95% limits of agreement suggest that the performance reductions observed were real and of importance despite the relatively small sample sizes used.
The credibility of the changes in running performance posttransit in the fixed groups were supported by the HRpeak recorded during the 12-m run. These heart rates indicated that all groups tried equally hard before and after their transits, which would be expected in teams of highly motivated elite military personnel. Notably, when questioned after the posttransit run, the participants who had used the fixed seats (calm and rough transits) indicated that their legs felt tired and heavy when they lined up for the 12-m run test following their transit but that they were surprised not to be able to get closer to their pretransit performance. These anecdotal reports of leg tiredness suggest that localized muscle fatigue may be a key cause of the reductions seen in posttransit running performance; however, this possibility would need to be confirmed.
It is possible that the cramped conditions may have contributed to the reduction in performance of the fixed group by restricting blood flow in the legs, causing localized ischemia (Eiken & Bjurstedt, 1987). However, there was little difference in the space afforded to each passenger on all boats, so any effect would have been uniform between seat conditions. Also, on arrival at the quayside, the participants had to walk along a jetty and up a gangplank to get to the test area and then doff their transit clothing before starting the 12-m run test. It is assumed that this activity prior to the 12-m run test was sufficient to limit any effects of the cramped conditions. Another explanation may have been reductions in peripheral blood flow (Spaul, Spear, & Greenleaf, 1986) or blood pooling (Maikala & Bhambhani, 2006), as these effects have been reported to result from whole-body vibration exposure.
Although neither changes in peripheral blood flow nor blood volume were assessed, we would argue that these findings for whole-body vibration have limited applicability to the high-speed RIB environment. During high-speed RIB transits, occupants are exposed to numerous, relatively high-g intermittent impacts separated by seconds rather than fractions of seconds, in which both the magnitude and frequency of occurrence are often random (Bass, Salzar, Ziemba, Lucas, & Peterson, 2005; Dobbins, Myers, & Hill, 2006; Myers et al., 2011; Peterson, Pierce, Price, & Bass, 2004). Studies simulating the exposure to humans from other transport platforms (e.g., cars, tractors, aircraft, ships) expose their occupants to continuous whole-body vibration at much lower magnitudes and higher frequencies (Wilder, Woodworth, Frymoyer, & Pope, 1982).
Muscle damage has been advanced as a contributory factor to reduced posttransit physical performance (Myers et al., 2011). Although markers of muscle damage were not assessed in this study, some damage is still likely to have occurred because of the need to perform repeated eccentric contractions when mitigating impacts (Clarkson & Tremblay, 1988). However, as the passengers’ feet were in contact with the RIB deck for both seat types, they all would have had to perform numerous eccentric contractions; therefore, any damage that occurred would have been similar between groups. The lack of change seen in the running performance of the suspension seat occupants suggests any muscle damage was minimal.
The mean heart rates recorded during the calm and rough transits were similar for both types of seat but with rates higher during the rough transit, which would be expected (Table 2). The pooled rough-transit heart rates were <45% HRpeak and are consistent with those previously reported by the authors (Myers et al., 2011) for similar sea conditions and are indicative of light work (Rodahl, 1975). The moderate relative heart rates reflect partly the low whole-body energy expenditure of the transits but also participants’ level of fitness and familiarity with the demands of high-speed RIB transits. The transit RPE showed a similar pattern to the heart rate data and indicated a comparable “light” level of perceived exertion (Borg, 1982), although they were no different between transits.
These findings and those of the authors’ previous studies (Myers et al., 2011; Myers, Withey, Dobbins, & Dyson, 2009) suggest that heart rate and RPE are effective measurement tools to use in this environment despite not being sensitive enough to discriminate between seat types. However, it should be noted that the authors encountered problems with electronic interference from boat engines and systems effecting heart rate measurement with some designs of heart rate monitors. These problems led to the selection of the system used, composed of a chest strap only that was both the receiver and the logger, which overcame problems encountered with those systems having a transmitting chest strap and separate logger.
The motion sickness ratings shown in Table 3 suggest a very low incidence of sickness within the participants, and it therefore is not an issue. The raw data showed that some mild symptoms were experienced by one person during the calm transit (fixed group, rating 1 = any symptoms, however slight) and two participants (fixed group rating of 1, return leg; suspension group rating of 2 = mild symptoms, however slight). Those participants experiencing symptoms when questioned indicated that these incidences occurred when the boat was stationary during the halfway point of the transit and when the RIBs stopped to change fuel tanks. At this point, the occupants were subject to low- frequency motions characteristic of open-sea conditions that might have caused motion sickness (Lawther & Griffin, 1988a).
Environmental Measures
Cold conditions have been reported to reduce posttransit running performance in passengers with insufficient thermal protection (Myers et al., 2009). However, although it was not practical to record core temperatures, when questioned, none of the participants reported feeling cold, apart from some chilling of the exposed face. This information indicates that the additional high-insulation clothing worn by the participants provided adequate protection, ensuring their run performance was not affected by the cold transit conditions.
Transit Measurements
In calm conditions, the standard RMS and VDV measures of impact showed little that would explain the difference seen in running performance posttransit. Although the absolute values were higher in the rough transit, they were similar between seat types despite the even greater difference seen in posttransit run performance. The inability of RMS and VDV measures to discriminate between the seat types, despite the latter being designed to take account of shocks (Mansfield, 2005), raises questions as to their suitability for comparative equipment assessments during high-speed marine transits. A similar conclusion was reached by Sandover (1998) regarding suitability of weighted RMS for describing high-acceleration events separated by minutes. The alternative method of reporting unweighted impact count and peak impact proposed by Dobbins et al. (2008) appears to be more representative (Table 5).
During the calm transit, the suspension seats appeared to be less effective at reducing the most frequently occurring lower-g impacts (0.6 g), compared with the fixed seat, which halved the number of impacts seen at the seat pan (Figure 3). However, the suspension seat dealt better with the larger amplitude deck impacts than did the fixed seat, which showed evidence of a degree of amplification occurring at the seat pan (e.g., deck peak impact of 2.6 g increased to 2.8 g at the seat pan). This superiority of the suspension seat at dealing with high-amplitude impacts may explain its apparent inferiority to the fixed seat at dealing with lower g impacts, as it shifted the higher impacts to a lower g, thereby increasing the count at lower g levels.
During the rough transit, the suspension seat was more effective at reducing the number of seat pan impacts ≥1.6 g compared with the fixed seat, despite the total deck impacts being greater for the suspension-seat RIB. The suspension seat reduced the peak impact at the seat pan to an extent that despite a peak deck impact of 10.8 g, there were no impacts >4.6 g recorded at the seat pan (Figure 4). In comparison, the fixed seat appeared to amplify the peak deck impact, with multiple impacts occurring above 9.4 g (peak deck impact), peaking at 12 g. It appears in both conditions, the suspension seat works by reducing the severity of vertical impacts, moving them to a level of g the occupants appear able to cope with. Those large impacts recorded at the fixed seat pan may have been caused by the occupant’s being bounced clear of the seat pan and then landing on it (termed “double slaps”). However, if double slaps did occur, then they may indicate that the fixed-seat occupants lacked the control to effectively deal with the initial impact.
Conclusion
The use of commercially available suspension seats fitted to an open RIB allowed passengers to maintain their running performance at pretransit distances following 3-hr high-speed transits in calm and rough sea conditions. The suspension seat acted to mitigate the RIB deck impacts by decreasing the number of higher-magnitude vertical impacts to lower g levels, which passengers appeared able to cope with. This reduction in the number of high-magnitude deck impacts by the suspension seats also appeared to prevent their occupants from feeling the leg tiredness that was reported by the fixed-seat passengers following both the calm and rough transits. It is suggested that this leg tiredness, indicative of localized muscle fatigue, is the most likely cause of the decrements in running performance.
The adoption of suspension seating and related technology should be considered for all maritime areas that subject personnel to frequently occurring high-magnitude impacts, in particular, where they have subsequent physically demanding mission requirements. Suspension seats may also aid craft control and safety and reduce the as-yet-to-be-quantified effects of chronic exposure to high-magnitude impacts.
Key Points
The fitting of suspension seats is recommended for high-speed boat operations.
Passengers using the suspensions seats maintained their running performance following 3-hr sea transits completed in calm and rough sea conditions compared with a reduction of −20% and −26% for those using fixed seats.
Passengers using the standard fixed seats reported tiredness in their legs posttransit, suggesting localized fatigue as a possible cause of the reductions seen, since heart rates and ratings of perceived exertion during transit were low and similar between groups.
Suspension seats appear to work by reducing the number of high-magnitude impacts experienced by the passengers.
Footnotes
Acknowledgements
The authors would like to acknowledge the high level of cooperation and logistical support from the Royal Marines and associated personnel and the enthusiasm and sense of humor shown at all times by the volunteers. The authors would also like to thank Iain Clark, boat project leader of Boats and Sea Survival Team MOD Abbey Wood, for funding the manufacture of the custom bases for the suspension seats. This research was supported by the Engineering and Physical Sciences Research Council (EP/C525744/1).