
Abstract
Objective:
The study was designed to show how driver attention to the road scene and engagement of a choice of secondary tasks are affected by the level of automation provided to assist or take over the basic task of vehicle control. It was also designed to investigate the difference between support in longitudinal control and support in lateral control.
Background:
There is comparatively little literature on the implications of automation for drivers’ engagement in the driving task and for their willingness to engage in non-driving-related activities.
Method:
A study was carried out on a high-level driving simulator in which drivers experienced three levels of automation: manual driving, semiautomated driving with either longitudinal or lateral control provided, and highly automated driving with both longitudinal and lateral control provided. Drivers were free to pay attention to the roadway and traffic or to engage in a range of entertainment and grooming tasks.
Results:
Engagement in the nondriving tasks increased from manual to semiautomated driving and increased further with highly automated driving. There were substantial differences in attention to the road and traffic between the two types of semiautomated driving.
Conclusion:
The literature on automation and the various task analyses of driving do not currently help to explain the effects that were found. Lateral support and longitudinal support may be the same in terms of levels of automation but appear to be regarded rather differently by drivers.
Introduction
The tendency in the literature on the implications of automation for human performance is to start with some kind of classification of levels of automation that is not domain specific. The number of levels of automation may vary. Thus Parasuraman, Sheridan, and Wickens (2000) identify 10 levels of automation from the lowest level, without any assistance, to the highest level, in which the human is completely supplanted by the system, whereas Parasuraman (2000) distinguishes 5 levels. Automation can supplant the human operator in a variety of ways. Parasuraman et al. (2000) assert that automation can be applied (at any level) to the various broad stages of information processing. Thus automation can assist or supplant the human in information acquisition, information analysis, decision and action selection, and last, action implementation. As examples of the four stages in the driving context, one might think about the following:
Displaying road signs on the dashboard
Warning of slippery road conditions
Advice on lane selection from a navigation system
Brake assist
However, it is worth noting that major elements in driving can be typified as a set of simultaneous tasks and subtasks, in which all the stages of information processing are being performed in parallel. One could even argue that driving is one overall task with a set of subtasks and sub-subtasks, with a number of tasks often being performed concurrently. Thus changing lanes would be a subtask, and indicator use would be a sub-subtask. Such a view of driving is suggested by Michon’s (1985) famous three-level model of the driving task as subdivided into the strategic level, the maneuvering level, and the control level. Engström and Hollnagel (2007) emphasize the need to focus on the interrelationship of different aspects of driving: “The driving task generally involves the pursuit of several simultaneous sub-goals with different time frames” (p. 70). The “driver-in-control” (Hollnagel, Nåbo, & Lau, 2003) explicitly links goals at four levels (tracking, regulating, monitoring, and targeting ) and suggests therefore that automation of one level might influence operator performance at another level. Thus automation of the lower levels of tracking or regulation might influence driver performance in monitoring, that is, situation assessment and, hence, situation awareness (Endsley, 1995).
This leads to the issue that in terms of overall operator involvement, one dimension not covered by the typology of Parasuraman et al. (2000) is the impact of automation of virtually all aspects of a task, such as driving, rather than just one part of it. Driver engagement will be quite different if faced with almost total and prolonged automation of major aspects of driving, as opposed to automation of one or more elements of the task as, for example, might occur with automation of wiper activation or climate control or even assistance in the performance of a particular maneuver, such as a lane change. And as the level of automation increases, there is a greater risk of out-of-the-loop performance and loss of situation awareness, especially when an automated system carries out all the steps of information processing through to action selection and implementation (Kaber & Endsley, 2004). When tracking and regulating in driving are automated, the driver will be faced with little need for input and attention, particularly when route choice is not an issue.
Hoc, Young, and Blosseville (2009) discussed interaction between driver and automation in terms of cooperation at different levels of the driving task: the metalevel, involving mental models; the planning level, involving risk perception; and the action level, involving vehicle control. Involvement in one level of the driving task by an automated system will have very different impacts on the operator than substitution of another level. Even assistance in maneuvering from, for example, a lane-change assistance system, gives only short-term support. On the other hand, substitution in control, as from an adaptive cruise control (ACC) or a lane-keeping system, might well leave the driver with a sense that the fundamental responsibility for driving has shifted to the automated system or systems. Having lost involvement and the need to engage, the driver might feel tempted to shift attention away from vehicle operation to other activities, for example, looking around at the scenery and engaging in distracting tasks, such as infotainment. Thus the willingness to engage in distracting activities may be an indicator of driver confidence in the capability of the vehicle to maintain safe operation.
Indeed, drivers may feel fully justified in their engagement in distracting activities—why have an automated system if the there is no advantage apart from reduced effort in driving to be gained thereby? This possibility could pose a problem for system designers, who in the future might not be able to maintain the line that the driver has responsibility and might have to demonstrate that responsibility can be shared between system and driver in a safe manner.
An additional issue is whether automation of different aspects of vehicle control leads to different impacts on driver engagement. In theory, the driving task literature might provide guidance here. At the vehicle control level, the driving task literature identifies two major elements, longitudinal control and lateral control. Perhaps the most often cited such analysis is the comprehensive set of descriptions compiled by McKnight and Adams (1970a, 1970b), targeted at the domain of driver education. In that analysis, steering and speed control are identified as “basic control tasks,” whereas car following is classified as one of the “tasks related to traffic conditions” (McKnight & Adams, 1970a). In steering, one subtask is defined as directional control, and one sub-subtask is to maintain correct position in the lane. Criticality is rated as +11 for encountering opposing traffic but only +5 for lane keeping. (Criticality values were assigned by a group of experts and were standardized so as to range from −20 to +20 with a mean of 0 and a standard deviation of 10.)
In speed control, one subtask is to vary pressure on the accelerator to maintain constant speed, and a sub-subtask is to maintain the speed of the traffic flow (criticality +7). In following, three main subtasks are defined: maintain adequate following distance from the lead vehicle (criticality up to +16), adjust speed to the speed of the lead vehicle (criticality up to +14), and observe traffic to anticipate changes in lead vehicle velocity (criticality up to +9). Thus steering is treated as less safety critical than car following but more safety critical than general speed maintenance, presumably on the basis of risk in case of failure. Differences between the tasks of lateral and longitudinal control are not specifically discussed.
A more recent task analysis of driving was carried out by Battelle for the U.S. Federal Highway Administration to assist in the assessment of information systems used in the context of commercial vehicle operations (Wheeler et al., 1996). The report identifies two functionally equivalent subtasks of vehicle control: speed control, with a goal to match vehicle speed with driving requirements, and position control, with a goal to match vehicle direction with driving requirements.
A contemporaneous report by Battelle for the U.S. National Highway Traffic Safety Admini-stration, again in the context of commercial vehicle operations (Tijerina et al., 1996), was a review of previous literature on driving task analysis with a particular focus on workload. Detailed aspects of the tasks of vehicle control and specifically how longitudinal and lateral control are performed were not covered. Similarly, the more recent discussion of driving task analysis by Fastenmeier and Gstalter (2007) treats the two aspects of vehicle control as functionally equivalent: “On the control level the two main tasks are steering and speed control, including horizontal and vertical shaping” (Fastenmeier & Gstalter, 2007, p. 963). Interestingly, the framework that they propose is almost entirely focused on situations that arise in longitudinal control, and lateral control is not really addressed.
Whereas the driving task literature may treat the two aspects of vehicle control as being equivalent, other studies point to some differences. Young and Stanton (1997) found much lower workload when drivers had to provide only longitudinal control (i.e., with lane-keeping support) than when they had to provide only lateral control (with ACC). These results were substantially replicated in Young and Stanton (2002). This finding suggests that the attentional requirements for the two aspects of vehicle control may not be equivalent and that lateral control is more demanding than longitudinal control.
As discussed earlier, increasing automation of the control level of the driving task, particularly, continuous as opposed to intermittent automation, may result in driver disengagement from driving and willingness to engage in other activities, including infotainment. Such shifting of attention into other activities will depend in part on how much reliance drivers feel they can place on the system to maintain safe progress. Lee and See (2004) have reviewed how reliance is in part based on trust and how trust is in turn influenced by the characteristics of automation. They define trust as “the attitude that an agent will help achieve an individual’s goals in a situation characterized by uncertainty and vulnerability” (Lee & See, 2004, p. 54). Thus one important factor in determining reliance will be the extent to which automation can achieve an individual’s goals.
If one goal in driving is to obtain the maximum enjoyment or reward from the time spent driving, then drivers may be willing to place more reliance on a system that frees them from monotonous aspects of driving and allows attention to other activities. This reliance will be influenced by the trust that they have in the system’s capability to keep them out of danger. As used here, the term capability can be likened to that of “technical competence” as used by Muir (1994): “The expectation of technical competence is probably closest to our intuitive understanding of what it means to trust a machine; machines are designed to perform a task, and we expect them to work properly— to be competent” (p. 1911). The more capable the automation of vehicle control, the more reliance drivers will be willing to place in that automation and the more willing they will therefore be to engage in non-driving-related tasks.
On the basis of our review, a number of research questions can be identified:
Does driver attention and effort invested shift away from driving as automation increases from taking over some major part of vehicle control to taking over virtually all aspects of vehicle control?
As automation is increased, are drivers more willing to engage in secondary tasks, such as infotainment, and is there a commensurate decrease in the effort invested in driving?
Is there a difference in driver confidence in the capability of the automation between lateral and longitudinal support?
Does the experience of assistance in a semiautomated condition (whereby part of vehicle control is automated) influence subsequent driver behavior in a highly automated condition (whereby virtually all of vehicle control is automated)?
An experiment conducted recently in a U.K. national project, EASY (Effects of Automation on Safety), allows an examination of how the partial substitution of a driver’s task by a semiautomated driving system affects operator response and of how that learned response affects subsequent behavior in highly automated driving. In information-processing terms, the support was at the level of action implementation. In terms of levels of automation, the level was high in the range defined by Parasuraman et al. (2000). However, only part of the driving task was substituted in the semiautomated condition, as opposed to virtually all major aspects of the driving task in the highly automated condition. In one version of the semiautomated condition, longitudinal control was substituted; in the other version, lateral control was substituted. Given the fact that in driving, the tasks of lateral and longitudinal control are generally treated as functionally equivalent, one might expect that the impact of these two versions on operator response should have been similar. The experiment was designed to reveal whether that was the case.
The four conditions are quite similar to those in Young and Stanton (1997). The experiment discussed in that article investigated the impact on driver workload of driving in four conditions: manual driving; driving with ACC; driving with an active steering (AS) system, that is, with the vehicle performing lateral control; and driving with the combination of ACC and AS (ACC+AS). The focus of the study was on impact on workload as measured by secondary task performance while driving and subjective rating in the form of NASA–Task Load Index provided at the end of each drive. The major conclusion was that workload with ACC was not different from that in manual driving, whereas both AS and ACC+AS resulted in lower workload, with the largest effect being in the combined ACC+AS condition. Another study by the same authors used the same conditions and the same simulator to focus on attentional capacity in underload situations, that is, with no opportunities for drivers to focus on alternative tasks (Young & Stanton, 2002).
The study by Young and Stanton (1997) may appear to be quite similar to the one reported here. But there are a number of important differences. First of all, the earlier study focused on workload, whereas the current one focuses on attentional shift. Next, the earlier study used a counterbalanced design, whereas the current one used increasing automation as a way to investigate learning effects. The earlier study had a two-lane rural road as the driving environment, in contrast to the motorway environment of the current study. Rural road driving is more demanding than motorway driving and presents participants with the potential threat of veering into the path of opposing traffic. In addition, the previous study was conducted on a fixed-base driving simulator with scene display on a computer monitor. The current study was conducted on a moving base simulator (8-degrees-of-freedom motion base) with an eight-channel visual system providing a 250° forward field of view as well as a 60° rear view and LCD side mirrors. The effort required for lateral control and the probability of lane excursion are both known to be higher in simulators without a motion base as compared with static driving simulators.
Thus Greenberg, Artz, and Cathey (2003) found that with certain secondary tasks, there was a substantial increase in lane violations when the motion system of a simulator was disabled as compared with the with-motion condition. Lack of motion also increased heading error, that is, the angular difference of the driven vehicle from the instantaneous road. The conclusion was that drivers need to pay more attention to heading angle when motion cues are absent or reduced. This finding is perhaps not surprising because without motion, only visual feedback on vehicle path is available. There is thus the potential for the lack of a motion base in a simulator to distort results, particularly when steering effort is an important factor.
Method
Apparatus
The EASY experiment was designed to investigate driver response to driving on a motorway with different levels of automation in seminaturalistic conditions. The experiment, conducted on the Leeds Driving Simulator, was set up so as to allow the drivers to choose whether and when they wished to engage in non-driving-related secondary tasks. A variety of tasks was offered: Drivers could play a game, such as air guitar; read a magazine; perform a grooming task, such as putting on makeup; eat a snack; watch a DVD; do a puzzle, such as a crossword or Sudoku; listen to the radio; and so on.
The University of Leeds Driving Simulator is a high-fidelity motion-based research apparatus. A Jaguar S-type vehicle cab sits in a 4-m spherical projection dome supported by two railed gantries crossed diagonally, with the bottom gantry sliding along a pair of 7-m tracks. This design allows 5 m of effective travel in each direction, providing motion forces longitudinally and laterally. The platform of the projection dome is capable of 8-degrees-of-freedom motion. The whole motion system provides realistic representation of the motion cues for a vast range of driving scenarios. Inside the dome, the driving environment is presented by a six-channel imaging system and an eight-channel sound system. The interior of the vehicle cab provides the original control interfaces and information display of the Jaguar S-type.
Roadway
The experimental road was a three-lane motorway comprising straight sections and two types of curves (either a 750-m or a 1,000-m radius each with a curve length of 252 m). These sections were joined to create a road that was approximately 55 miles (88.5 km) long. It took approximately 45 min to complete each drive, given the standard speed limit of 70 mph (112.6 km/h) applicable on U.K. motorways. The curve sections required only very gentle steering. Approximately 65% of the road consisted of such gentle curves. Other traffic was presented to create a natural feeling of driving on a motorway on a typical and ordinary day. The surrounding traffic drone vehicles, which appeared in Lane 1 (the slow left-hand lane), would travel at a speed below 70 mph; in Lane 2 (the middle lane), they would travel at approximately 70 mph; and in Lane 3 (the fast lane), they would travel faster than 70 mph. The other vehicles were not designed to interact with the participant’s vehicle in any particular way. The whole driving environment was relaxed and calm, although traffic density increased somewhat during each drive.
Experimental Design
Each participant drove the same experimental road three times. To enable the investigation of learning effects and of the impact of the two paths to high automation, the conditions were not counterbalanced. Initially, the participants drove without support from any driver assistance system, that is, with manual control of the vehicle’s longitudinal and lateral movements, which was the baseline condition. The second time, they had the support by either ACC or a lane-keeping system in which the vehicle steered itself. This second drive constituted semiautomated driving, which was a between-subject condition. The third drive, they had the support of both technologies (i.e., highly automated driving). This experimental design was selected rather than a more traditional alternative of a fully counterbalanced design because a central focus of the study was on learning and carryover effects as automation increased. In addition, it was felt that a counterbalanced design would suffer from a potential contamination in that for some participants, manual driving would be influenced by the experience in semi- or highly automated driving.
Participants were instructed to move to or stay in the middle lane as soon as they saw the first junction, which is approximately 1 mile (1.6 km) after first joining the motorway. This instruction was applicable to all three scenarios. For the baseline scenario, participants were instructed to stay in the middle lane for the rest of the drive and to observe the speed limit. For the semi- and highly automated scenarios, participants were instructed to activate the support system as soon as they had driven past the junction. If the participant forgot to do so, the researcher would remind him or her via the intercom promptly. For the semiautomated scenario, the lateral group (which had the lane-keeping system enabled) was instructed to observe the speed limit, whereas the longitudinal group (which had ACC enabled) had the vehicle speed set at 70 mph (112.6 km/h).
A lead car was absent most of the time; it would appear only when the participant was responsible for the vehicle’s longitudinal movement (i.e., in the baseline drive and for the lateral group in semiautomated driving) and if the participant chose to exceed the speed limit. Participants were advised that the support system was 100% reliable when provided (i.e., during the semi- and highly automated driving scenarios). This point was intended to indicate to the participants that they should not expect to encounter system failures. However, participants were instructed to exercise due care and attention at all times as they would in the real world.
Participants
There were 25 drivers in the longitudinal group and 24 drivers in the lateral group. Most were male (22 males in both groups). The two groups were similar in terms of mean age. Mean age was 47.2 years (SD = 11.1) in the longitudinal group and 48.4 years (SD = 10.1) in the lateral group. Driving experience (mean years since passing the test) was 28.0 years (SD = 11.3) and 27.9 years (SD = 11.6), respectively. They differed somewhat in terms of reported annual mileage with a mean of 30,200 miles (48,600 km) for the longitudinal group and 25,000 miles (40,200 km) for the lateral group. But all were high-mileage drivers with a minimum of 8,000 miles (12,874 km) a year.
Data
Data were collected on task uptake, defined as the number of drivers who chose to engage in a particular nondriving task, and on task engagement, defined as the percentage of a drive in which drivers were involved in a particular task.
Eye movement, recorded by Seeing Machine’s FaceLAB 4, was used to identify participants’ visual attention. FaceLAB 4 records eye movements at 60 Hz. The driver’s field of view was divided into five spatial regions as illustrated in Figure 1, similar to Hughes and Cole (1988). The central region was defined as a 6° radius circle around the mode of fixations within a 60-s moving window. The left region covered glances to the center console (e.g., the DVD screen and radio controls) as well as the left side mirror, door window, and passing traffic in the adjacent lane. The right region covered glances to the right side mirror, door window, and passing traffic in the adjacent lane and in the opposite carriageway. The bottom region covered mainly the dashboard, where the speedometer, rev counter, and a variety of gauges were located. The top region covered mainly the sky. In addition to eye movement, participants’ heart rate was also recorded by the BIOPAC physiological data acquisition system as an indication of overall workload during the drive (de Waard, 1996). It was expected that changes in heart rate would reflect the effort invested in driving, with negligible effects from engagement in the entertainment tasks since these tasks were not very resource demanding (they would have mostly been classified as “easy” in the scale of Lai and Carsten, 2003). Not all of the data was complete for all the participants.
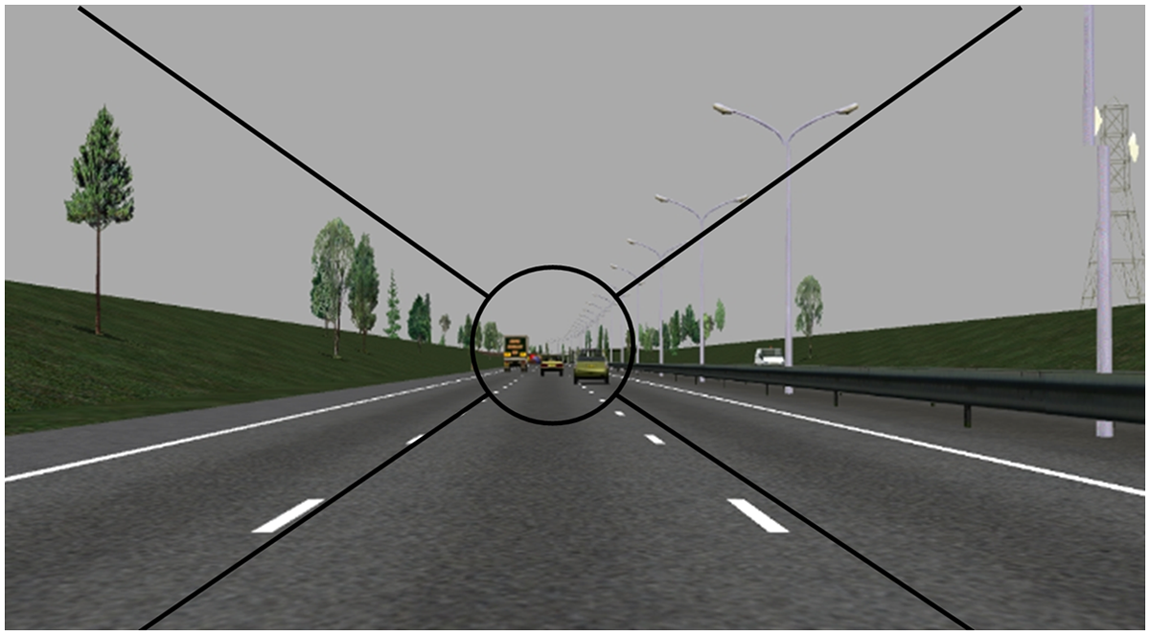
Visual attention regions.
The FaceLAB 4 equipment was also used to collect data on PERCLOS (percentage of eyelid closure over the pupil) as an indicator of driver fatigue. These data were collected in part out of concern that because of the experimental design, there might be a confounding effect of fatigue, that is, greater fatigue with each successive drive. Since the PERCLOS data did not show any consistent pattern of increasing fatigue with successive drives, these concerns were allayed.
Results
Figure 2 compares the mean percentage, across all 49 participants, of glances falling into the five visual attention regions across the experimental conditions. The vast majority of glances was into the central region. Participants also spent a considerable amount of time glancing to the left or the right region, where other traffic was likely to be present. The amount of time spent on the central region decreased noticeably as the level of automation increased, which is supported by the statistical test results shown in Table 1. The difference between the two automation paths was not statistically significant at the .05 level (i.e., Table 2). However, the effect sizes suggest that the between-group difference was enlarged when the experiment progressed from the manual mode to the semiautomated mode. This difference seemed to have carried over to the highly automated mode (i.e., the effect size of 0.45 from the highly automated mode was still double the effect size of 0.23 from the manual driving mode).
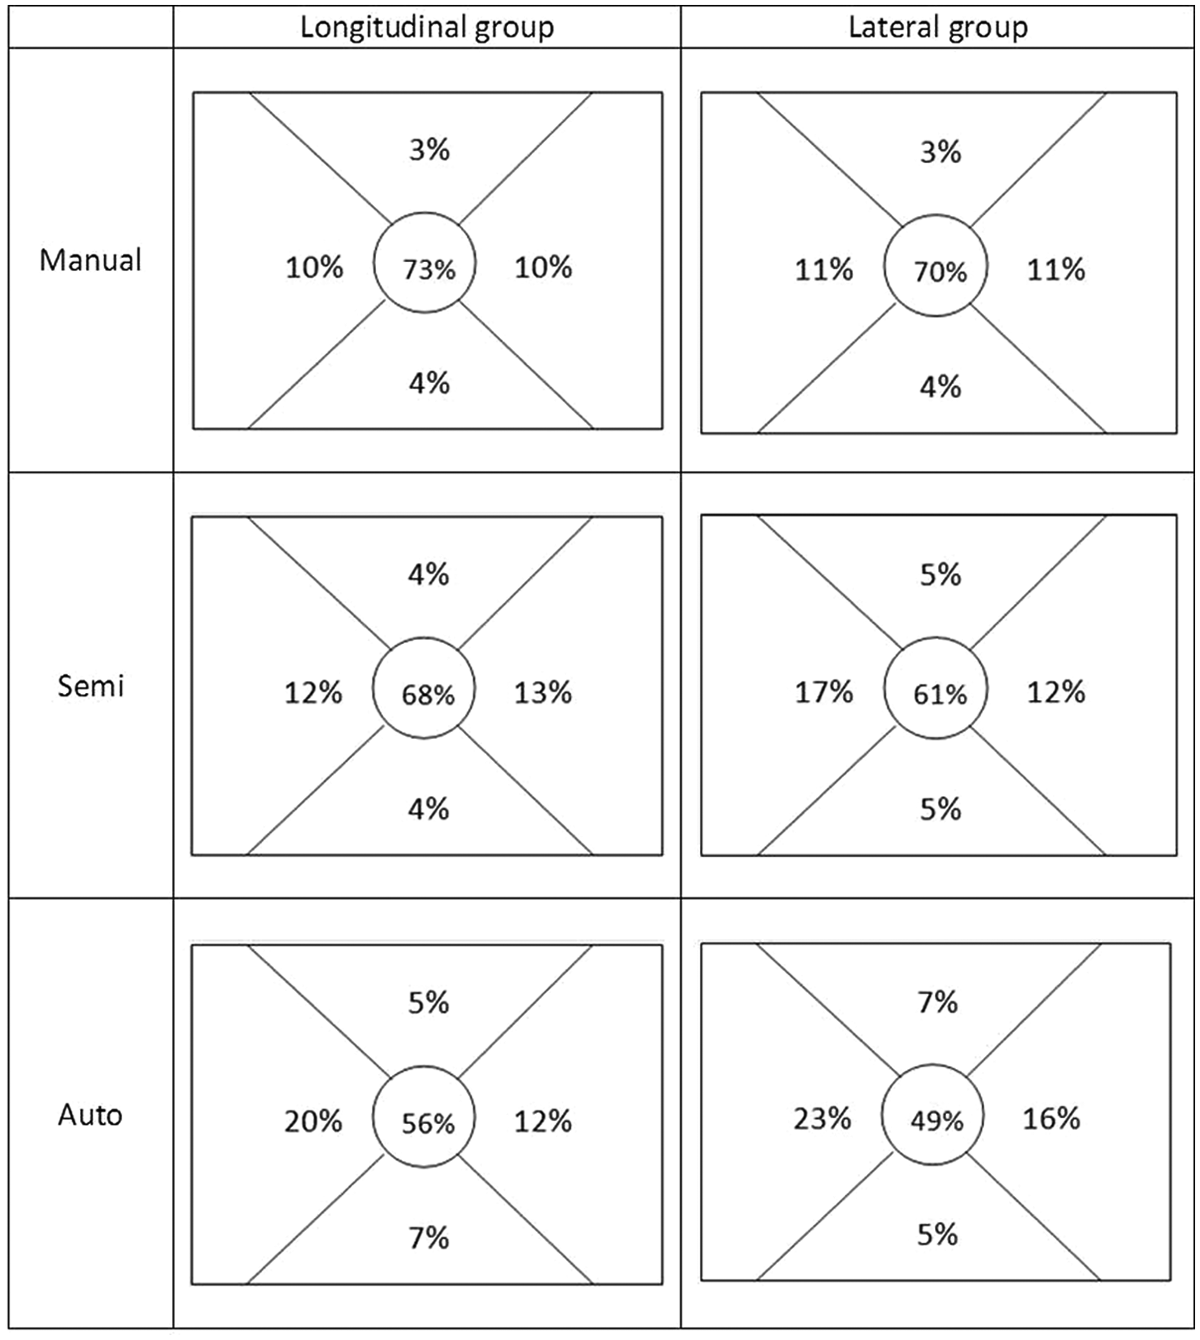
Distribution of attention.
ANOVA Test Results for the Central Region
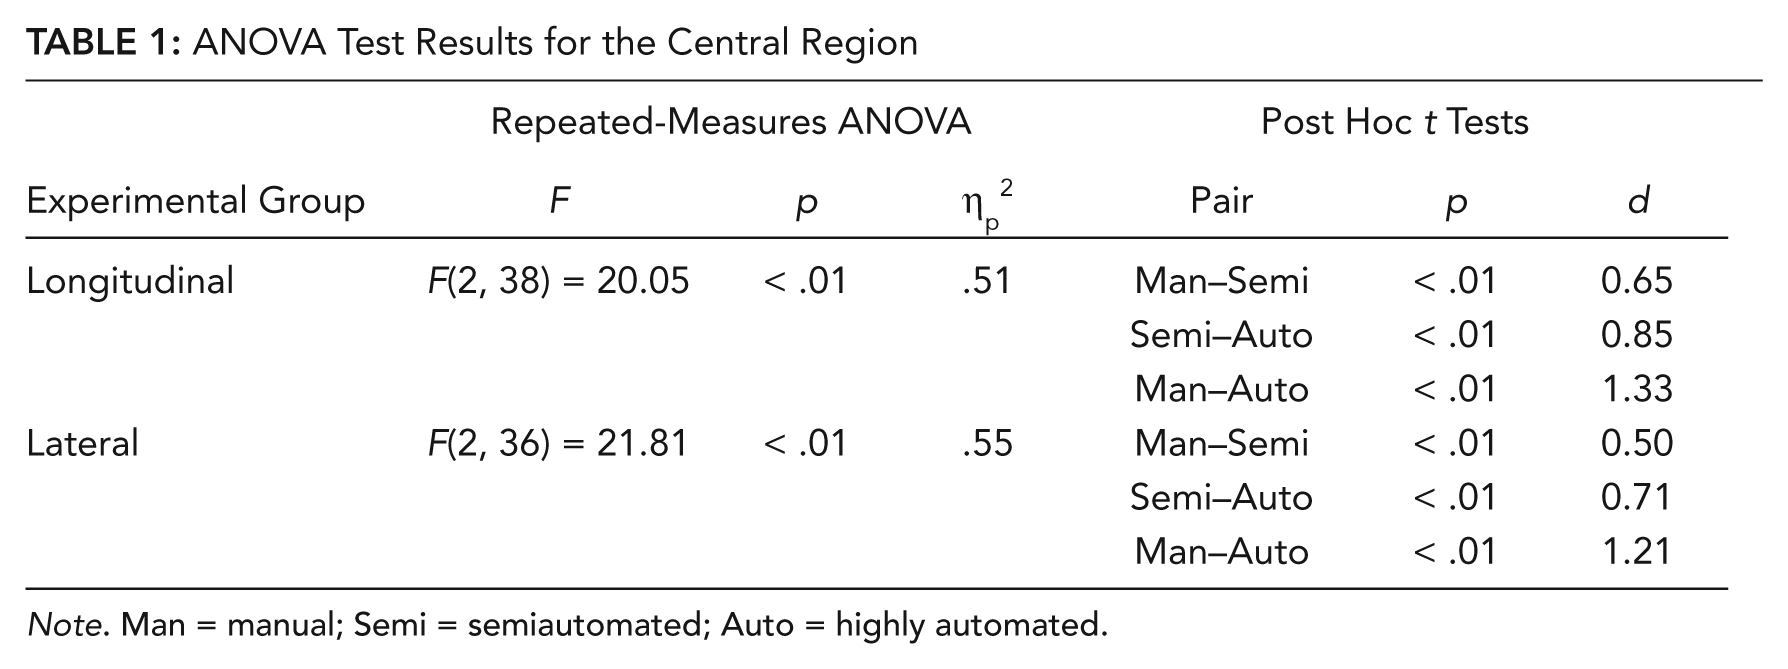
Note. Man = manual; Semi = semiautomated; Auto = highly automated.
T Test Results for the Central Region
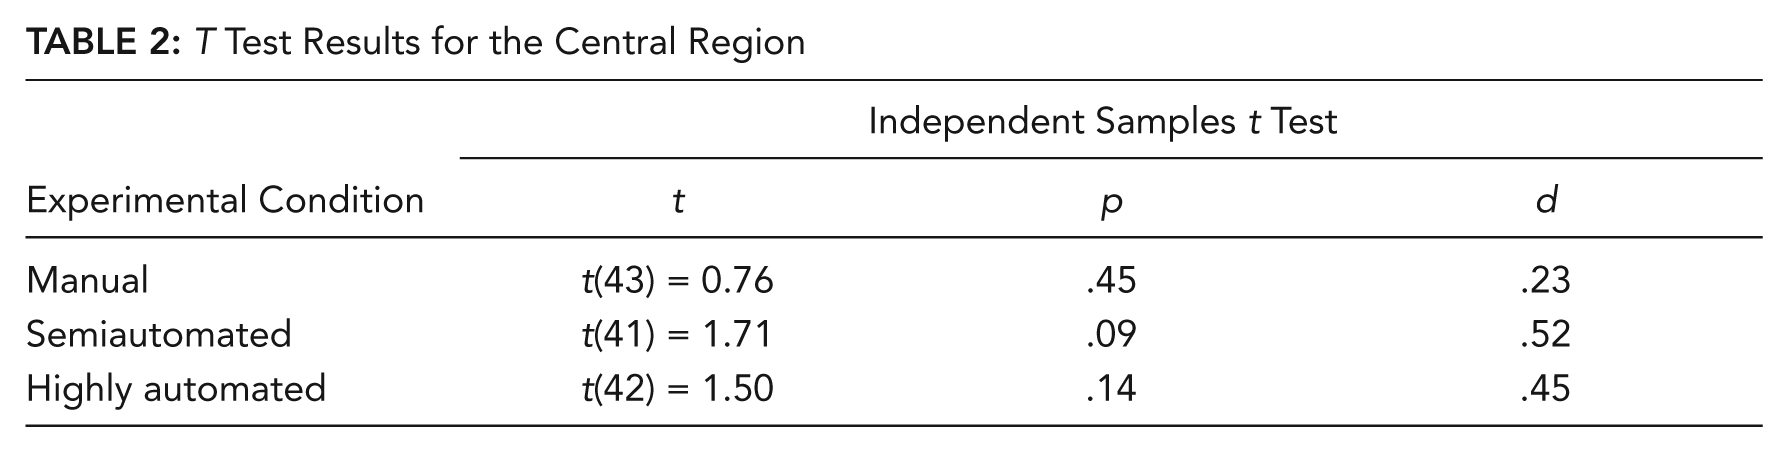
Figure 2 also suggests that there was a tendency for participants to shift their glances to the left region when the level of automation increased. Interestingly, the lateral group appeared to have started this shift during semiautomated driving, which is one stage earlier than for the longitudinal group. There were small changes in glances to other areas, including the top (sky), indicating a greater tendency for a general loss of focus on the roadway.
As indicated earlier, drivers were offered a number of non-driving-related tasks that they could choose to take into the vehicle and then choose to engage in when they felt comfortable to do so. Uptake (i.e., choice to do within a drive) of a number of tasks was observable. For example, quite a few drivers chose to eat while driving. For those who had longitudinal support in semiautomated driving, the number of instances of eating was 9 in manual driving, 17 in semiautomated driving, and 14 in highly automated driving. For those who had lateral support in semiautomated driving, the number of instances of eating was 3 of 24 in manual driving, 22 in semiautomated driving, and 33 in highly automated driving.
However, some of these tasks were short-lived. Overall, there were only two tasks in which drivers engaged for a substantial proportion of their driving. Those tasks were listening to the radio and watching a DVD. Figure 3 shows the mean proportion of journey in which drivers were engaged in a task, with standard errors. There are indications that listening to the radio did increase with automation, but this activity is not normally considered very demanding or distracting. Therefore engagement in the DVD task is considered to be more important.
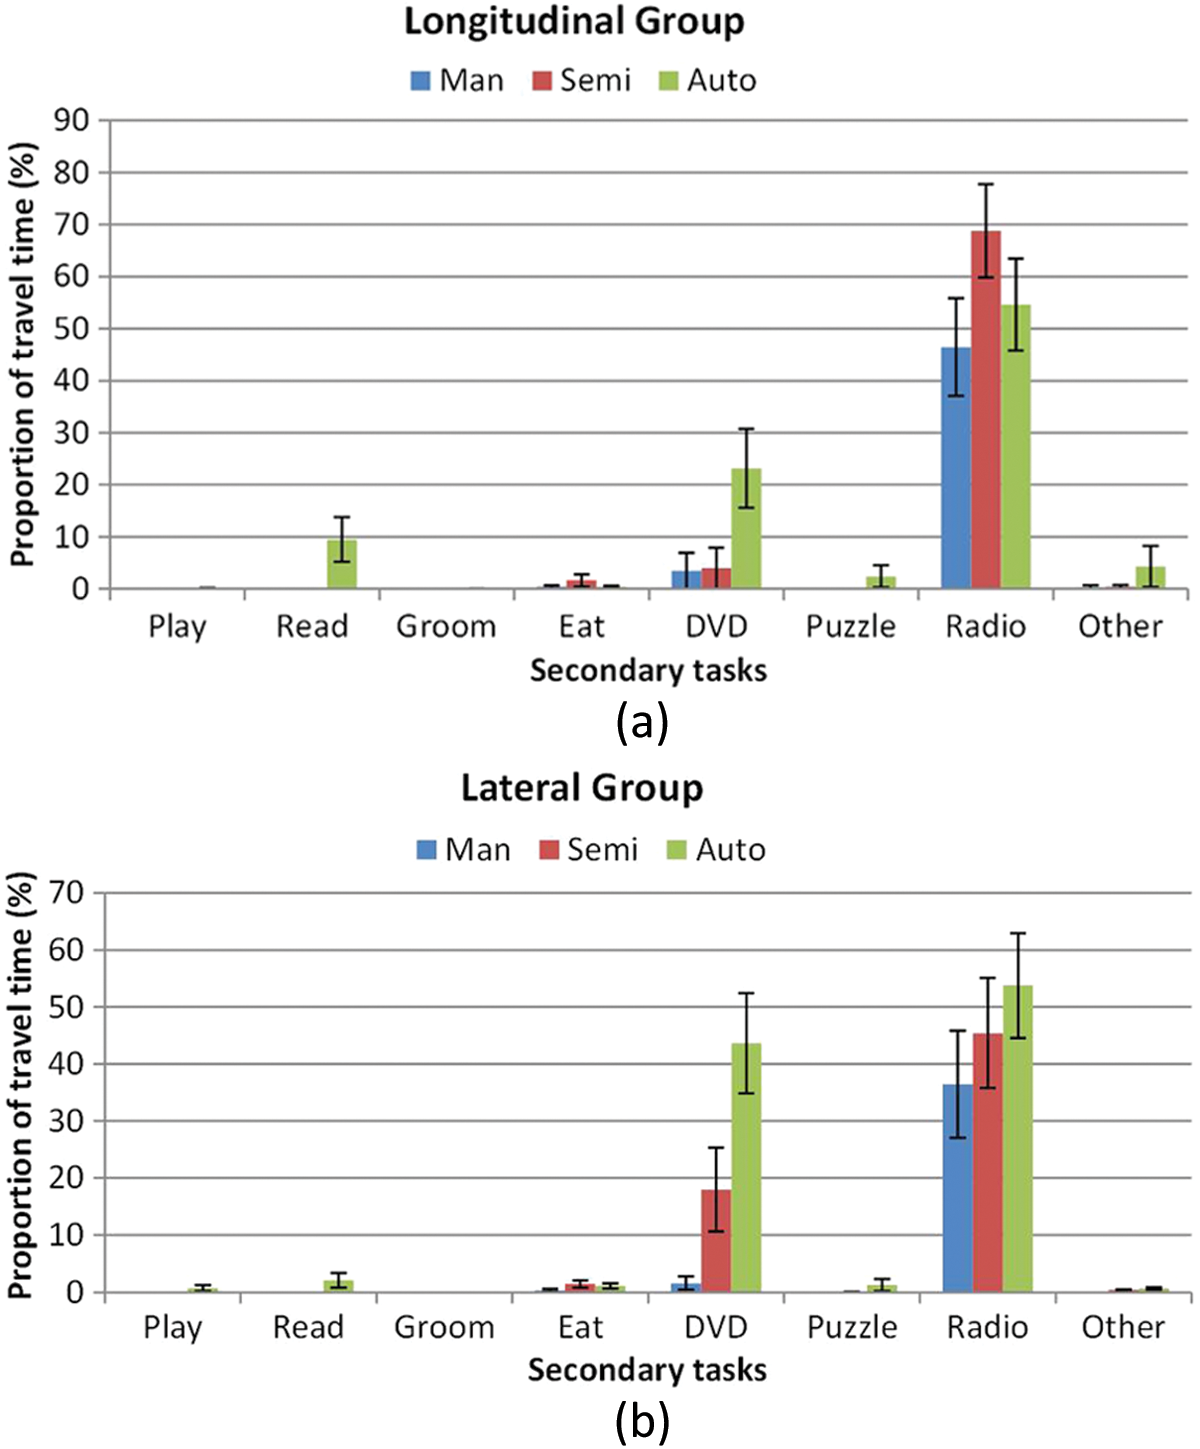
Engagement in secondary tasks.
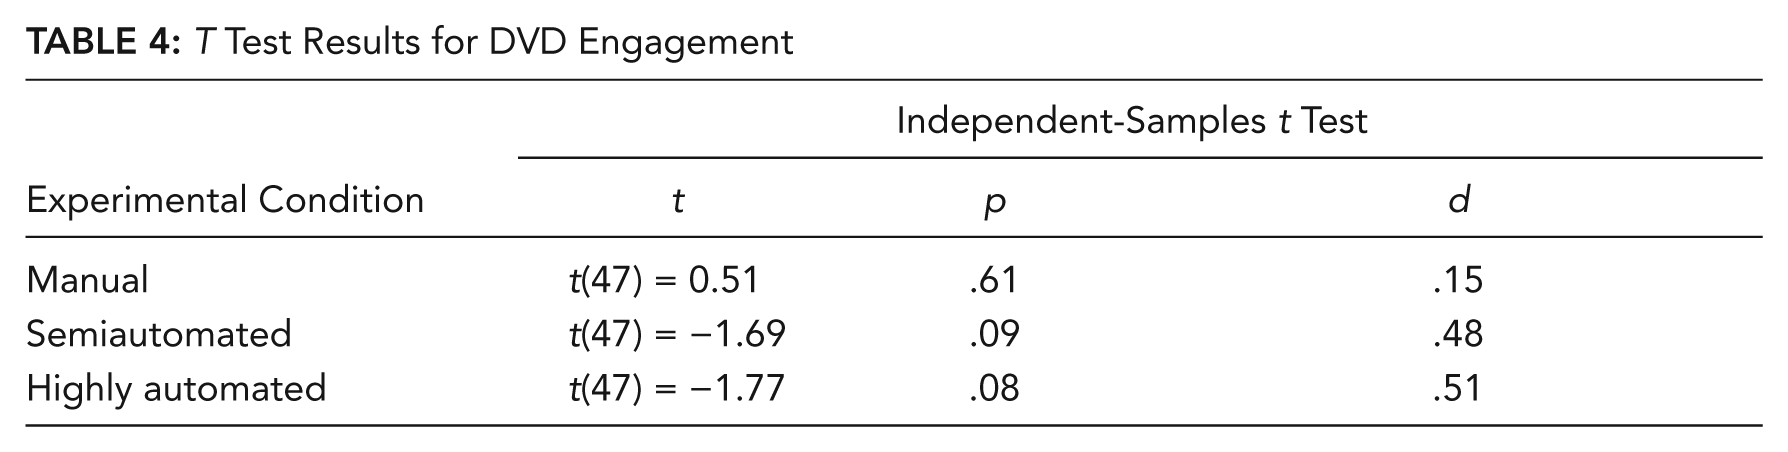
Table 3 presents the mean proportion of journey time when a DVD was running. This information is also illustrated in Figure 4, which shows the same data as Figure 3 but just for the DVD task. It can be observed that the lateral group shifted attention away from the central region one stage ahead of the longitudinal group. Although the differences in DVD engagement between the two groups were not statistically significant at the .05 level, the effect sizes suggest that there was a carryover effect; that is, the effect size of the between-group difference, shown in Table 4, increased from 0.15 to 0.48 and then to 0.51 as the level of automation increased.
DVD Engagement and Associated ANOVA Test Results
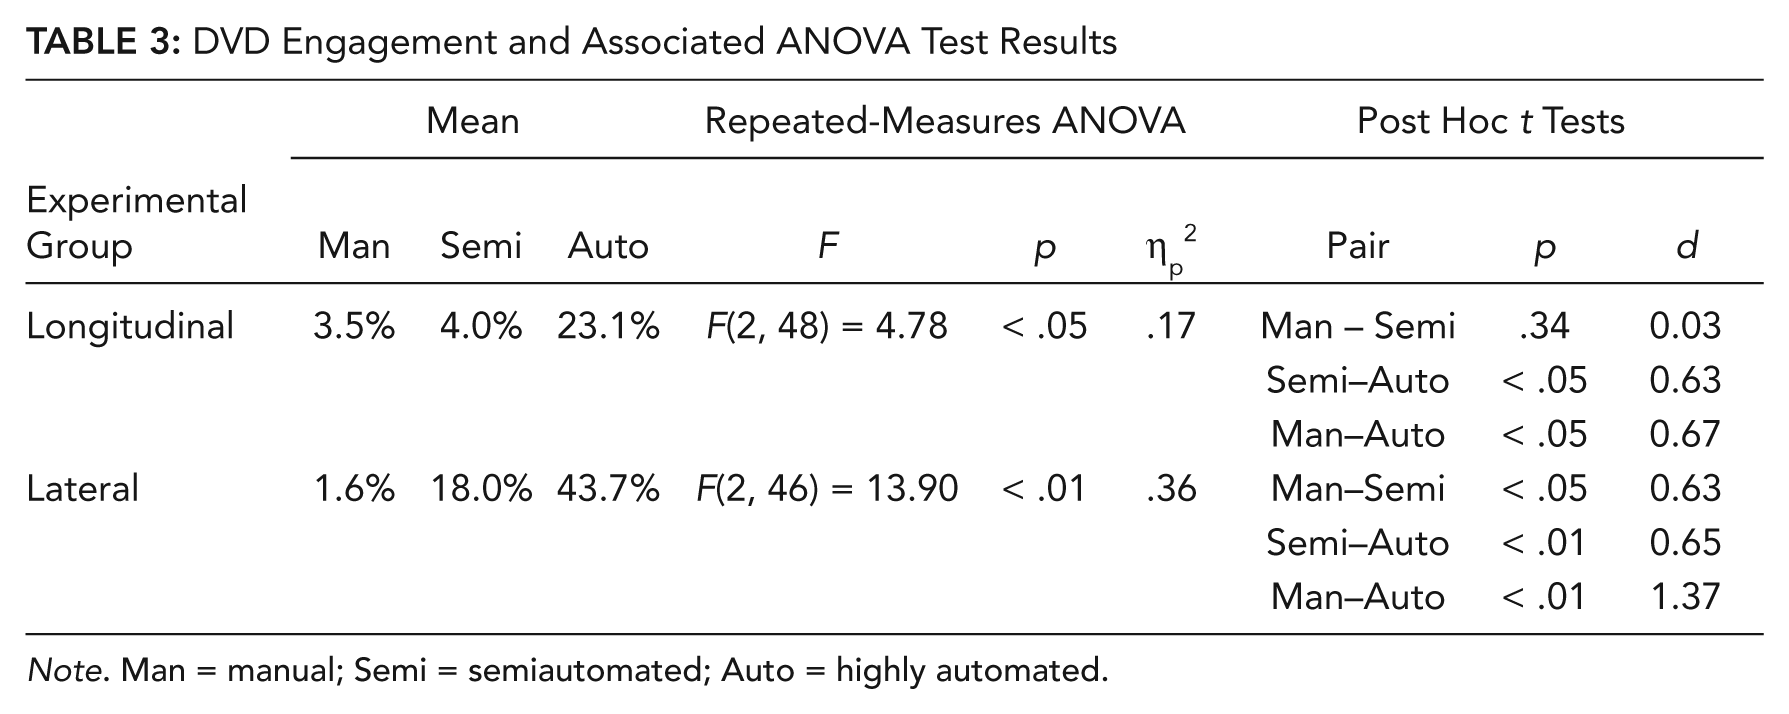
Note. Man = manual; Semi = semiautomated; Auto = highly automated.
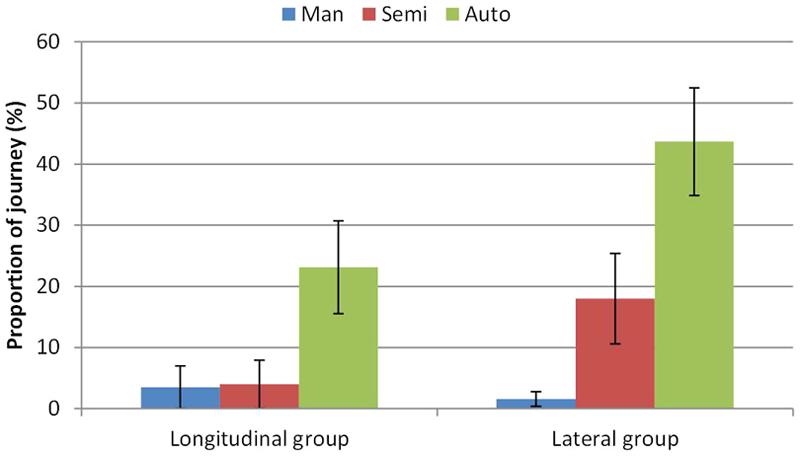
Engagement in DVD task.
T Test Results for DVD Engagement
The data on DVD engagement can be linked to the data on visual attention by region, shown in Figure 2. Since the DVD screen was located in the left region, the change in the pattern of glances falling in the left region can largely be attributed to watching the DVD.
It is also of interest to investigate the attention allocation in the absence of the DVD task. Figure 5 presents the distribution of glances among the five visual attention regions from the 24 participants who never turned on the DVD throughout the three driving modes. The proportion of attention spent on the central region again decreased in line with an increase in the level of automation. This observation is also supported by statistical test results depicted in Table 5. However, for the lateral group, there was little difference between the semiautomated condition and the highly automated condition. The effect size of the between-group comparisons (see Table 6) again suggests that the two different automation paths encouraged the participants to adopt different attention allocation strategies. Thus the effect size enlarged from 0.63 to 0.87 as the driving mode moved from manual to semiautomated. The effect size of the between-group difference decreased when moving to the highly automated driving. However, this effect is likely attributable to the aforementioned floor effect.
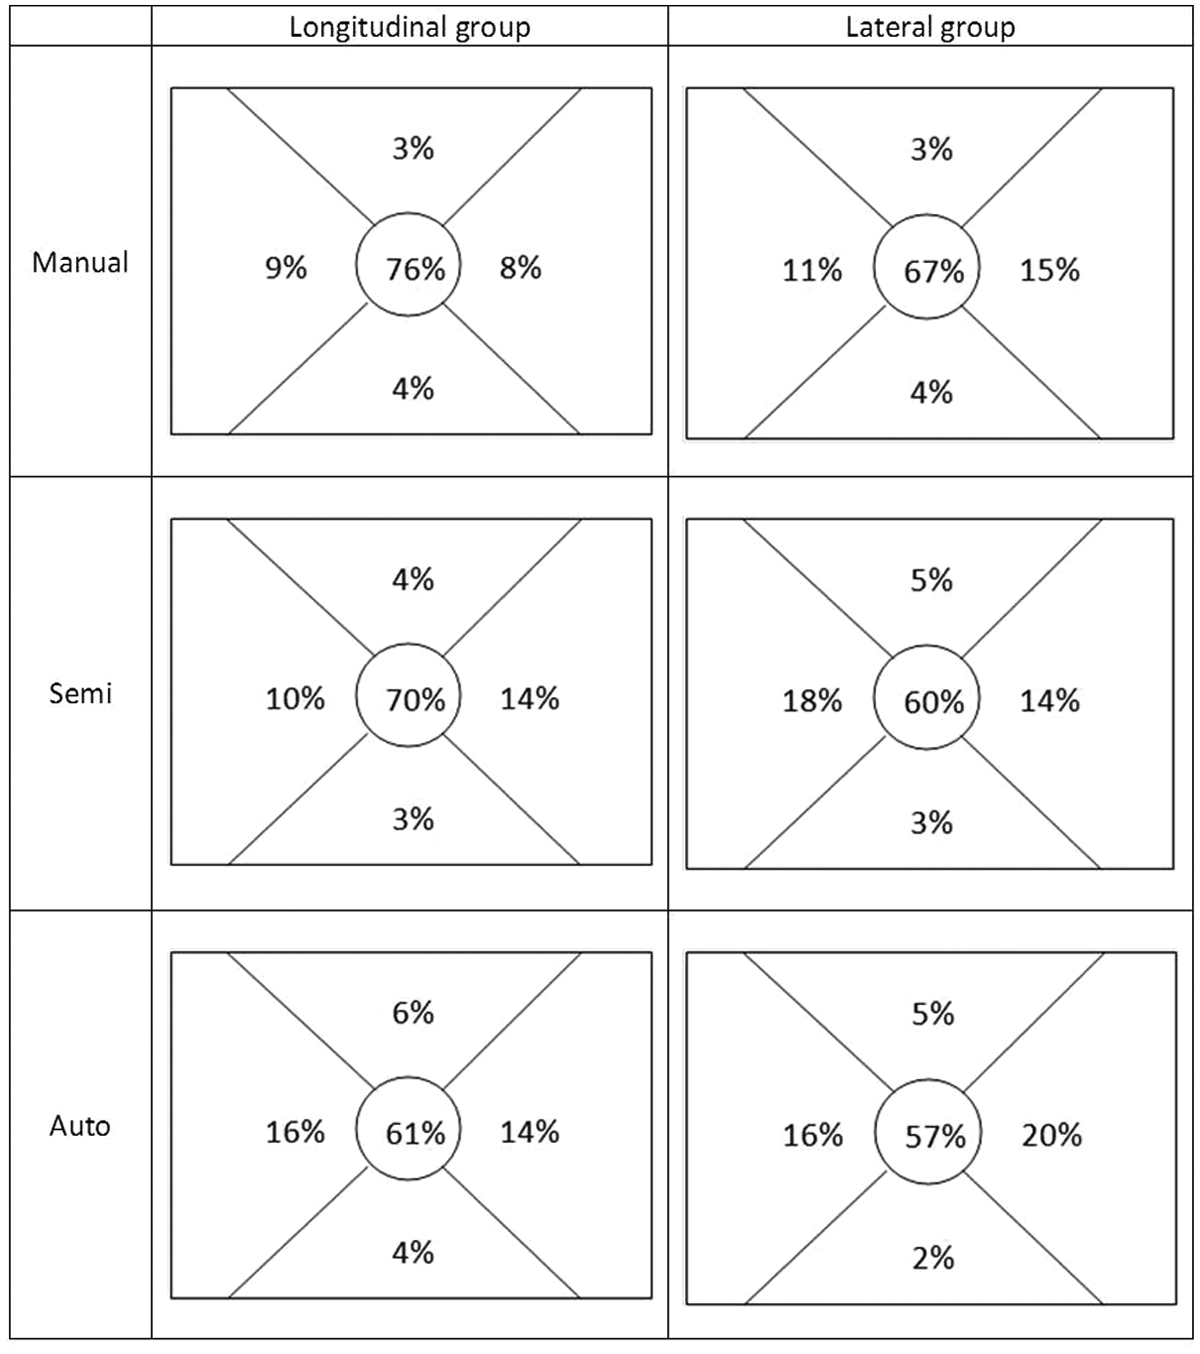
Distribution of attention when not involved in the DVD task.
ANOVA Test Results for the Central Region Without Involving the DVD Task

Note. Man = manual; Semi = semiautomated; Auto = highly automated.
T Test Results for the Central Region Without Involving the DVD Task
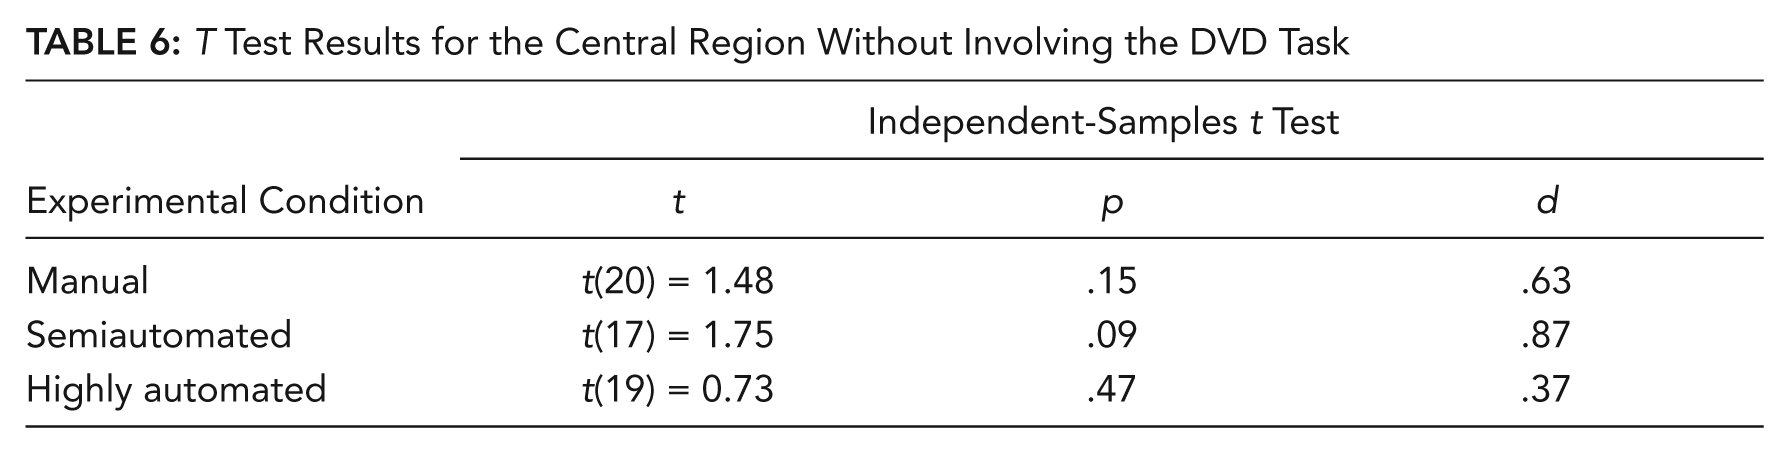
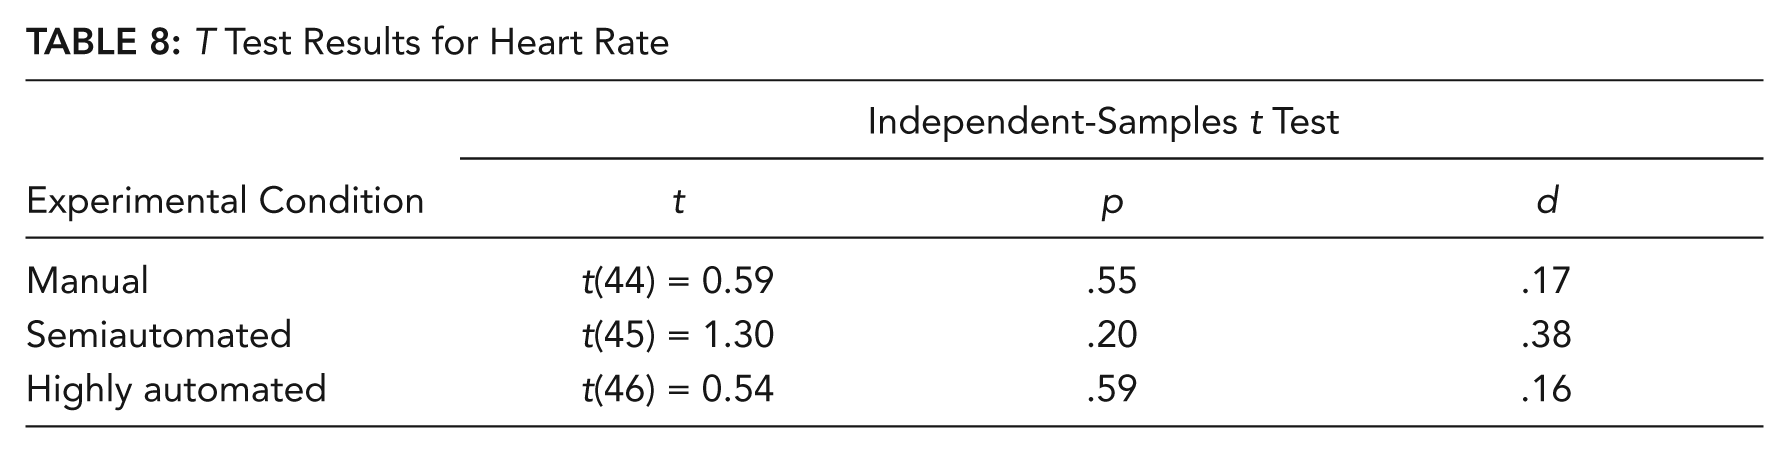
Table 7 reports the mean heart rate as well as associated statistical test results, and Table 8 shows the counterpart t tests for the comparisons within each level of automation. The same data are illustrated in Figure 6 (with standard errors shown). It is rather evident that participants were investing less effort when the driving task was supported. Since none of the distracting tasks was in any way demanding, there is no reason to believe that engagement in those tasks substantially affected the results. The findings on heart rate are in line with the other data, with decreasing overall workload as automation increased and a more substantial drop for the lateral group as compared with the longitudinal group from manual to semiautomated driving.
Heart Rate and Associated ANOVA Test Results
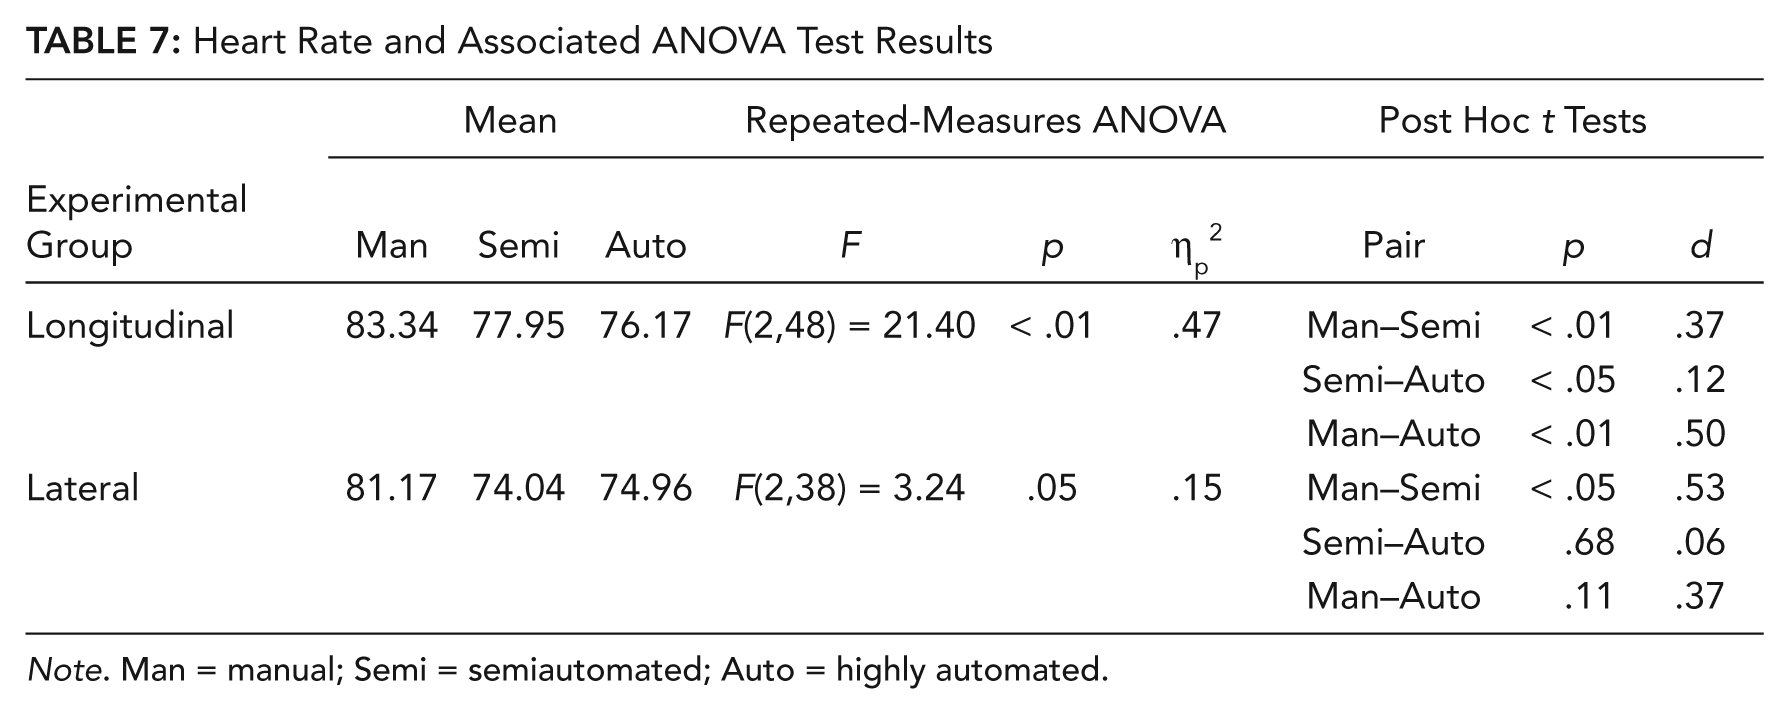
Note. Man = manual; Semi = semiautomated; Auto = highly automated.
T Test Results for Heart Rate
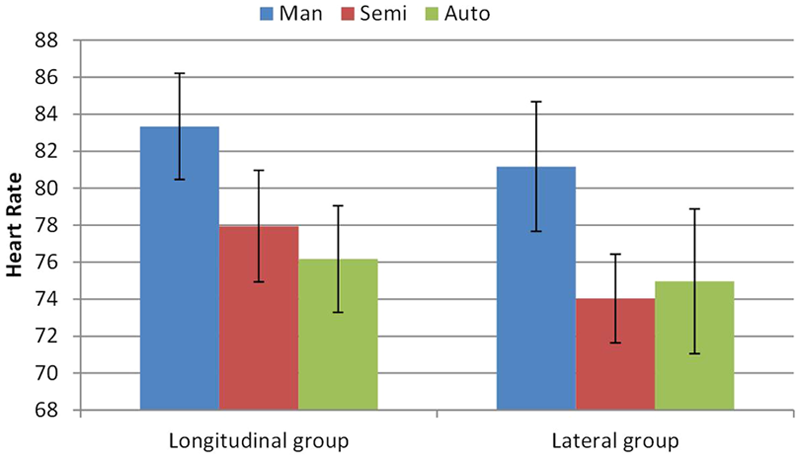
Heart rate.
Discussion
Drivers did not exhibit the same response to longitudinal and lateral support. There are some clear indications that lateral support was closer to highly automated driving. Why should this be so? Why would drivers be less attentive to the road and traffic when driving with lateral support and more attentive when driving with longitudinal support? The explanation for this finding was not in the quality of the two systems, since both were reliable and both were “well engineered” so as to keep the vehicle in high-quality control.
It is possible that there were systematic differences between the groups in a priori willingness to engage in secondary tasks while driving with system support, but the two groups were generally matched in their characteristics, so this explanation is not that plausible.
So the explanation must lie in the nature of the driving task (or subtask) being supplanted by the automated function. It can be argued that in motorway driving, when desired maximum speed has been established and when no close car following is involved, longitudinal control is largely a feedback task. Indeed, this is the principle on which ACC is built. Lateral control has a major feed-forward element, whereby drivers read the road ahead to determine their yaw input, as opposed to merely responding to momentary deviations from desired lane position. A mathematical model of driver lateral control requires a preview of the road ahead (Guo & Guan, 1993; Sharp, Casanova, & Symonds, 2000).
With longitudinal support, drivers must still engage in steering and hence in anticipation of the road path ahead. This engagement requires fairly constant reference to the roadway to check the lateral position and path of the vehicle. Drivers are likely to be aware that a small change in heading angle can soon result in a lane or roadway excursion and that deviation from a desired path is dangerous.
The proposition that drivers wish to maintain a safety margin in lateral control is long-standing. It was discussed by Gibson and Crooks (1938), albeit more in terms of lateral obstacles, such as parked cars, than in terms of the vehicle’s relationship with the roadway. Van Winsum and Godthelp (1996) defined this safety margin as time to line crossing (TLC), that is, the time available for a driver until the moment at which any part of the vehicle reaches one of the lane boundaries. They observed that TLC was roughly constant both across driver and within drivers across road situation, which, in the case of their study, were curves of differing radii. Typical minimum TLCs for each curve radius studied were in the range of 2.5 to 2.9 s. We are not aware of any study that has directly compared drivers for their preference both in forward time to collision (TTC) and in TLC. However, it is interesting to note that the minimum TLCs observed by van Winsum and Godthelp were larger than the typical minimum TTCs adopted by drivers, which suggests that drivers in general wish to maintain a larger safety margin for lateral than for longitudinal control.
On the other hand, when they have lateral support, drivers need merely to check for lead vehicle position. If there is no close lead vehicle and hence little likelihood of a collision in the next few seconds, they may feel free to divert their attention away from the roadway, confident that the lateral support system will maintain the vehicle on a safe course.
There are implications here for the process of task analysis, at least in the driving domain. Hierarchical task analysis has a long and honorable history in human factors and ergonomics and has occupied a central place in the repertoire of methods since the late 1960s (Stanton, 2006). At the conclusion of his review of the method, Stanton (2006) states, “The approach was flexible enough to enable it to be applied to a wide variety of domains and applications” (p. 77).
In decomposing vehicle control, the literature treats longitudinal and lateral control as being two equivalent subtasks. By creating conditions in which the two have been fully decoupled, the experiment has shown that in terms of driver attention, they are not equivalent. A very detailed deconstruction of even apparently straightforward driving tasks, such as longitudinal control and lateral control, is needed to understand driver motivation and behavior in semiautomated conditions. Such a deconstruction should involve defining the task in terms of its operational elements, goals, strategies, and attentional requirements. The preexisting driving task literature, although quite extensive and arguably somewhat complete in terms of task enumeration, does not provide such a rich description of these fundamental aspects of vehicle operation.
Conclusions
When provided with the support of automation, drivers will shift attention away from the driving task and tend to use the support to enable engagement in nondriving tasks. As might be expected, this tendency goes up with increasing automation. However, the findings indicated that this effect is mediated by the type of support offered in vehicle control. Drivers feel more capable of turning their attention away from driving when given lateral support as compared to when they have longitudinal support. As evidenced here, this experience then carried over into highly automated driving. This finding shows that the pathway to high automation may be an important influence on attention to the roadway and traffic.
Current typologies of automation are not necessarily able to provide insight into how operators will respond when a task involving action selection in the form of continuous vehicle control is substituted. It is important to understand how the actual task being substituted might affect operator engagement in the overall driving task. Lateral and longitudinal control have fundamentally different properties in terms of the amount of preview required. Automation of headway control, as with ACC, may have less impact on general driver engagement and situation awareness than automation of lateral control, as with a lane-keeping system. The standard literature on levels of automation does not really help to provide the insight required to understand the differing responses of drivers to assistance systems that only partially supplant manual control. Equally, the literature on driving task analysis does not decompose vehicle control sufficiently to provide much insight into behavior with automation. A more detailed decomposition is needed to provide a full understanding.
Key Points
Increasing automation leads to increasing willingness to shift attention from driving to secondary tasks.
There are different effects of the two types of semiautomated driving, in that drivers were more willing to engage in secondary tasks with lateral support than with longitudinal support.
In some respects, driving with lateral support was more like driving with full automation, whereas driving with longitudinal support was more like manual driving.
Equally, the literature on levels of automation does not really help to explain these differences, whereas decomposition of the tasks involved in vehicle control does suggest explanations.
Previous task analyses of driving have not deconstructed vehicle control sufficiently to reveal some important differences between longitudinal and lateral control.
Footnotes
Oliver Carsten is a professor of Transport Safety at the Institute for Transport Studies at the University of Leeds. He received his PhD in U.S. social history from the University of Michigan in 1981.
Frank C. H. Lai is a senior research fellow at the Institute for Transport Studies at the University of Leeds. He received his PhD in transport studies from the University of Leeds in 2005.
Yvonne Barnard is a senior research fellow at the Institute for Transport Studies at the University of Leeds. She received her PhD in social science informatics from the University of Amsterdam in 1995.
A. Hamish Jamson is a principal research fellow at the Institute for Transport Studies at the University of Leeds and manager of the University of Leeds Driving Simulator. He very recently obtained his PhD in motion cuing in driving simulators from the University of Leeds.
Natasha Merat is a senior research fellow at the Institute for Transport Studies at the University of Leeds. She was awarded her PhD in psychology from the University of Leeds in 1999.