
Abstract
Objective:
The objective was to determine whether operators with an expectancy that automation is trustworthy are better at calibrating their trust to changes in the capabilities of automation, and if so, why.
Background:
Studies suggest that individual differences in automation expectancy may be able to account for why changes in the capabilities of automation lead to a substantial change in trust for some, yet only a small change for others.
Method:
In a baggage screening task, 225 participants searched for weapons in 200 X-ray images of luggage. Participants were assisted by an automated decision aid exhibiting different levels of reliability. Measures of expectancy that automation is trustworthy were used in conjunction with subjective measures of trust and perceived reliability to identify individual differences in trust calibration.
Results:
Operators with high expectancy that automation is trustworthy were more sensitive to changes (both increases and decreases) in automation reliability. This difference was eliminated by manipulating the causal attribution of automation errors.
Conclusion:
Attributing the cause of automation errors to factors external to the automation fosters an understanding of tasks and situations in which automation differs in reliability and may lead to more appropriate trust.
Application:
The development of interventions can lead to calibrated trust in automation.
Introduction
In an effort to reduce human error in complex systems, a variety of automated aids to improve diagnostic and decision-making processes are being implemented (Wiegmann, Rich, & Zhang, 2001). A large body of research has identified that one of the critical variables that may influence decisions about automation use is an operator’s trust in the automation (see Lee & See, 2004, for a review). Operators tend to use automation that they trust while rejecting automation that they do not. For appropriate use to occur, operator trust must match the true capabilities of the automation (Lee & See, 2004). The appropriateness of trust can be evaluated in terms of its calibration, or “the correspondence between a person’s trust in the automation and the automation’s capabilities” (Lee & See, 2004, p. 55).
The calibration of trust can be affected by characteristics of the automation, the operator, and the context (Merritt & Ilgen, 2008). Studies examining how these factors individually influence trust include how trust is affected by automation reliability (Dzindolet, Peterson, Pomranky, Pierce, & Beck, 2003), automation display content and format (Lee & See, 2004), automation errors (Dzindolet et al., 2003; Lee & Moray, 1992; Wiegmann et al., 2001), task difficulty (Madhavan, Wiegmann, & Lacson, 2006), and the consequences of misses and false alarms (Keller & Rice, 2010; Parasuraman & Riley, 1997). These studies have identified how individual factors influence trust; however, it is not fully understood how the dynamic interaction of these factors influences trust. For example, Lee and Moray (1994) found that for some people changes in the capabilities of the automation led to a substantial change in trust, yet for others it led to a small change. This finding suggests that the relationship between automation characteristics and trust may be moderated by individual differences.
An individual difference that can influence initial trust level, as well as how new information and feedback are interpreted is one’s expectancy that others can be trusted (Rotter, 1967). Singh, Molloy, and Parasuraman (1993a) developed the Automation-Induced Complacency Potential (AICP) Rating Scale to assess attitudes toward everyday automation such as automated teller machines and automotive cruise control. The scale represents the general tendency or propensity to trust automation and has been used as a measure of people’s expectancy that automation can be trusted (Lee & See, 2004; Merritt & Ilgen, 2008; Singh et al., 1993a). Some studies have referred to this construct as propensity to trust, but we follow the convention in the interpersonal trust literature and refer to the AICP measure as automation expectancy.
Individual differences in expectancy may be able to account for why changes in the capabilities of the automation in previous studies led to a substantial change in trust for some, yet for others it led to only a small change. Cohen, Parasuraman, and Freeman’s (1998) model of situation-specific trust showed that users can differ in calibration depending on their discriminations between situations in which the automation differs in reliability. Lee and See (2004) proposed that “one possible explanation that merits further investigation is that high [propensity to] trust individuals may be better able to adjust their trust to situations in which the automation is highly capable as well as to situations in which it is not” (p. 57). This led to the first research question explored here: Are operators with high automation expectancy better at calibrating their trust to changes in the capabilities of the automation?
The research question was tested using a baggage screening task in which participants searched for weapons in X-ray images of luggage with assistance from an automated decision aid. We operationally defined calibration as a lack of a discrepancy between the actual and perceived reliability of the automation. Both individual differences in automation expectancy and subjective measures (trust and perceived reliability) were examined. Specifically, we investigated individual differences in operators’ level of trust in an automated decision aid during trials exhibiting different levels of automation reliability.
As a follow-up to our research question, we were also interested in investigating why operators with high automation expectancy may be better at calibrating their trust. An integrative model of trust by Mayer, Davis, and Schoorman (1995) proposed that trust develops through a feedback loop, such that each time a trustor takes a risk with a trustee, the trustor evaluates the outcome. A model proposed by Tomlinson and Mayer (2009) combines Mayer et al.’s feedback loop with Weiner’s (1986) causal attribution theory to explain why negative outcomes sometimes lead to a decrease in trust and other times do not. According to Weiner’s attribution theory, negative outcomes (such as errors) cause individuals to identify the outcome’s cause (e.g., automation ability, luck, task difficulty). The locus of causality of this attribution can vary. An individual can attribute the cause of an error as either being internal to the automation (i.e., automation ability) or external to the automation (i.e., situation). If operators attribute the cause of errors to automation ability, Tomlinson and Mayer’s model would suggest that these operators should withdraw trust, however if operators attribute the cause of errors to external factors, the same model would suggest that operator trust may not necessarily decline.
Tomlinson and Mayer (2009) developed their model to explain when trustworthiness in interpersonal relationships is in need of repair, however their model could also be applied to explain why operators with high automation expectancy may be better at calibrating their trust. Trust calibration is based on the operator’s subjective perceptions of automation capabilities and not on the actual capabilities of the automation (Lee & See, 2004; Merritt & Ilgen, 2008; Wiegmann et al., 2001). Merritt and Ilgen (2008) found that operator perceptions were affected by individual differences in automation expectancy. Specifically, they found that operators with high automation expectancy who were paired with lower functioning automation suffered the largest negative effects on perceptions of machine characteristics and on trust. The parallel of these findings and Tomlinson and Mayer’s model certainly suggests that operators with high and low automation expectancy may differ in their ability to calibrate trust because of differences in the causal attribution of automation errors.
To test why operators with high automation expectancy may be better at calibrating their trust, the causal attribution of automation errors was manipulated for half of the participants. Previous research indicates that an individual’s causal attributions depend on the nature of available information (Kassin, 1979; Kelley, 1967; Teas & McElroy, 1986). Specifically, according to Kelley (1967), three types of information are used in attributing causal explanations—consistency (Does the individual behave similarly across time and situations?), consensus (Do other individuals in the same situation behave similarly?), and distinctiveness (Does the individual behave this way only in certain situations?). When people are presented with the combination of information indicating that a behavior is high in consistency, low in consensus, and low in distinctiveness, they will likely attribute the cause to the individual (Kassin, 1979; Kelley, 1967; Teas & McElroy, 1986). For example, if educators are trying to determine why one of their students failed a test in their class and reviewing the student’s other grades in their class indicates that the student has regularly scored poorly (high consistency), reviewing the transcript indicates that the student has failed other classes (low distinctiveness), and other students in the class performed well on the exam in question (low consensus), educators are likely to blame the student (e.g., poor study habits, lack of attention paid in classes, etc.).
The current study used two information conditions to test the causal attribution hypothesis. One condition was a control in which participants did not receive any information regarding the consistency, distinctiveness, or consensus of automation errors. Providing no such information is fairly typical in studies investigating trust in automated decision aids (e.g., Lee & Moray, 1992; 1994; Madhavan et al., 2006; Wiegmann et al., 2001). The other condition was a manipulation in which participants received a combination of information that should result in automation errors being causally attributed to the automation’s ability, rather than, for example, the situation or task. We hypothesized that operators with high automation expectancy would be better at calibrating their trust to changes in the capabilities of the automation because they attribute the cause of errors as internal to the automation.
Method
Participants
Participants were 225 undergraduate students from the Georgia Institute of Technology, 107 female and 118 male. The sample was 64.9% White, 4.0% Black, 24.4% Asian, and 6.7% other races. The mean age was 19.94, with a standard deviation of 2.03. All participants were over the age of 18, reported normal or corrected-to-normal vision, and reported being knowledgeable about computers and comfortable using them. Participants were compensated for their participation by receiving a course credit through Experimetrix.
Apparatus
The study took place in the Cognitive Ergonomics Lab at the Georgia Institute of Technology. The task was a medium fidelity X-Ray Screening Task similar to the task used in Merritt and Ilgen’s (2008) study. X-ray images of luggage were presented on a monitor. Some of the bags contained weapons, and some did not. Participants had to inspect the X-rays and determine if they believed a weapon was present and required a bag search, or if they believed that the bag did not contain a weapon and could be cleared. The slides depicted a weapon 30% of the time. This was the same rate as used in Merritt and Ilgen (2008) and was similar to the rate used in other studies investigating trust in automated decision aids (e.g., Dzindolet, Pierce, Beck, Dawe, & Anderson, 2001). Of course, this rate is higher than the actual rate of weapons in airport baggage; however, screeners are also required to identify common prohibited items such as liquids, aerosols, and scissors (Merritt & Ilgen, 2008). The difficulty of the slides varied and was largely based on the number of items present in each bag. Looking ahead, accuracy on individual items ranged from 16% to 100%.
Stimuli
Image set
The X-ray images of luggage used as stimuli were compiled with items from the image set used by Merritt and Ilgen (2008). The image set was originally developed with Transportation Security Administration help by running items through an X-ray machine at different angles. From this image set we chose 50 types of large bags. Items in the bag were randomly chosen from 10 types of clothing, 18 types of knives, 18 types of guns, and 242 various types of other items, including electronics (e.g., cell phones, laptops, MP3 players, radios, PDAs, pagers, and tape players), organic materials (e.g., papers, books, shoes, wallets, and diapers), and metal objects (e.g., tools, toys, keys, and coins). Each bag was standardized at a resolution of 768 × 576, displayed on a 30-inch monitor with a 1,024 × 768 resolution.
A total of 50 bags were compiled. These 50 bags were rotated 180°, flipped horizontally, flipped vertically, and repeated four times for the 200 trials in this experiment. See Figure 1 for an example of the four views for each bag. Each bag view was randomly assigned to one of four trial blocks. The order of bags within each trial block was random, which left only a 0.04% chance that a participant saw the same bag twice in a row. Looking ahead, a poststudy questionnaire indicated that 86% of participants did not notice a bag was repeated the second time screening it.
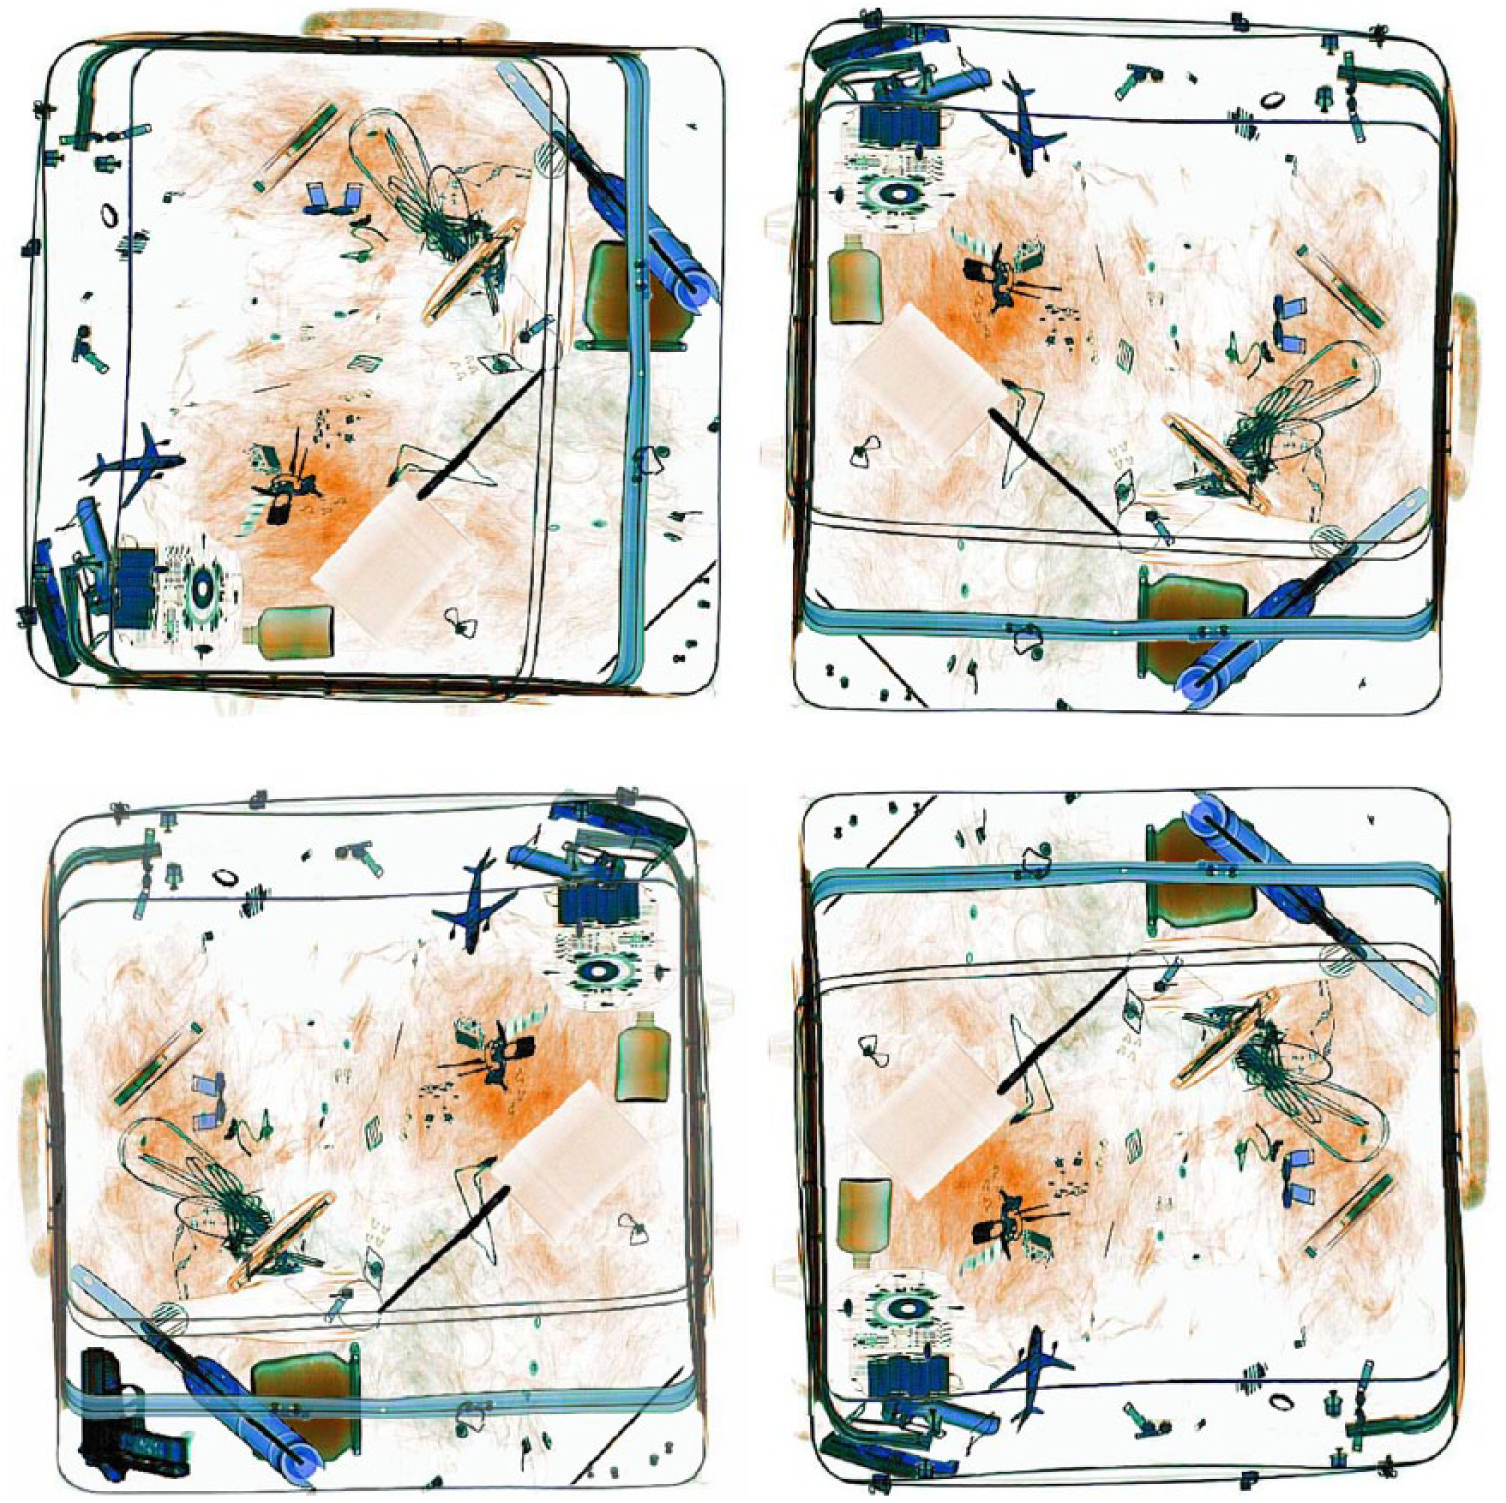
An example of the four different views of one bag.
Measures
Automation expectancy
Automation expectancy was assessed using Singh et al.’s (1993a) AICP Rating Scale. This scale represents the individual difference of expectancy that automation can be trusted (Lee & See, 2004; Merritt & Ilgen, 2008; Singh et al., 1993a) and is the same measure used by Merritt and Ilgen (2008; although they referred to it as propensity to trust). In previous research this measure has had high item intercorrelations (r > .98), internal consistency (α = .87), and test–retest reliability (r = .90; Singh et al., 1993a).
Items in this scale presented the participants with a statement, for example, “I would rather purchase an item using a computer than have to deal with a sales representative on the phone because my order is more likely to be correct using the computer.” Participants then rated their response on a 5-point Likert-type scale ranging from strongly disagree to strongly agree. The scale contained 20 items, including 4 fillers for checking whether participants were responding conscientiously. Scores on this measure could range from 16 to 80.
Trust and perceived reliability
Trust was assessed using a 12-item questionnaire developed by Jian, Bisantz, and Drury (2000) to assess trust between people and automation. Example items include “I can trust the system” and “The system is dependable.” Participants responded to each item using a 7-point Likert-type scale ranging from not at all (1) to extremely (7). In addition, perceived reliability was assessed by having each participant rate the reliability of the automated aid on a 100-point scale ranging from 0% (completely unreliable) to 100% (completely reliable; adopted from Wiegmann et al., 2001).
Causal attribution
Causal attribution of automation errors was assessed using an adaptation of Russell’s (1982) Causal Dimension Scale. The Causal Dimension Scale assesses the locus of causality of attribution identified by Weiner (1979) and has high internal reliability (α = .87; Russell, 1982). The format of the scale was modified to reflect the investigation of the operator’s causal explanation of automation errors. An example is, “Is the cause something that: Reflects an aspect of the automation (9) or Reflects an aspect of the situation (1).” Participants indicated their opinion on each item by circling a number between 1 and 9. Causal attribution scores were computed by summing the responses to the three items composing the locus of causality subscale. Scores on this measure could range from 3 to 27, with higher scores indicating that participants perceived the cause of automation errors as more internal to the automation. The internal reliability of the modified scale was α = .78.
Design
The experiment was a 2 (information: control, internal attribution) × 3 (reliability group: 100%–80%, 60%–80%, 80%–80%) factorial design. Information was a between-subjects manipulation of the type of information the operators received. Some operators received information indicating the consistency, consensus, and distinctiveness of the automated aid’s performance, whereas other operators received no such information. Participants were randomly assigned to an information condition.
Reliability group was a factor of the three experimental conditions used in this study. For the first group, the reliability of the automated aid was 100% for the first half of the experiment and, unbeknownst to the operator, was reduced to 80% for the second half of the experiment. In the second group, the reliability of the automated aid was 60% for the first half of the experiment and, unbeknownst to the operator, was increased to 80% for the second half. The third group was a baseline in which the automated aid remained at 80% reliability for the duration of the experiment. The three reliability conditions are identical to the ones used by Wiegmann et al. (2001) to investigate the effects of aid reliability on user’s trust. Wiegmann et al. found that operators were sensitive to automation reliability levels differing by a magnitude of 20%, thus the same conditions were used to investigate individual differences.
No change occurred in the presentation that could signal the change in reliability with the exception of the passage of time. Reliability group was a between-subjects manipulation, and participants were randomly assigned to a reliability condition. Participants were not told the reliability of the automated aid. Previous research has indicated that automation misses are more degrading to operator trust than are automation false alarms (Keller & Rice, 2010; Parasuraman & Riley, 1997). In an effort to avoid this potential confound, automation errors were equally divided between misses and false alarms in the conditions where the automated aid was not perfectly reliable.
Procedure
Each experimental session lasted less than one hour. Participants gave informed consent, then completed questionnaires to determine automation expectancy and demographic information. Participants were then given instructions that described the task, the weapons, and the procedure to clear or search a bag. Participants were instructed to use a keyboard to press [p] to pass the bag along and move onto the next bag or [c] to have the bag checked and move onto the next bag. Participants were instructed to screen the X-ray images of carry-on luggage as fast as they can while still adequately inspecting each bag for weapons.
After reviewing the instructions, participants completed three practice trials during which they screened bags without the assistance of the Automated Weapons Detector (AWD). Participants then received instructions with information about the AWD. The instructions for the internal attribution information group also included the following information about the consistency, consensus, and distinctiveness of the automated aid’s performance: “The Automated Weapons Detector does not perform the same as other automated detectors” (low consensus), “however its detection performance is the same regardless of weapon type” (low distinctiveness), “and it consistently provides the same recommendation when scanning the same bag multiple times” (high consistency).
Participants screened 200 bags. The AWD’s recommendation was displayed in the form of a text alert next to the X-ray image of the bag. Participants received feedback after every bag, letting them know whether their decision was correct or wrong. Accuracy and response time were recorded for each bag, but there were no time limits, rewards, or consequences for performance. Trust and perceived reliability were assessed twice, after every 100 trials. Causal attribution was assessed after participants screened all 200 bags.
Results and Discussion
There were four participants with perceived reliability scores more than three standard deviations from the mean. It is possible that some of these participants may have misunderstood the perceived reliability scale and reported perceived error rate instead. For example, when the automation was 80% reliable some participants reported outlying estimates of 10%, 14%, and 15%, which are actually not too far off from the 20% error rate. However, this could not be verified, and the data of the four participants were excluded. All hypotheses were tested using data from the remaining 221 participants. We used partial eta-squared (η p 2) as a measure of effect size, with .010 indicating a small effect, .059 a medium effect, and .138 a large effect (Cohen, 1988).
Causal Attribution
The causal attribution data were analyzed using an ANOVA with information condition as a between-subjects factor. The effect of information condition was significant, F(1, 220) = 4.270, p = .040, η p 2 = .020, indicating that the causal attribution information manipulation was effective. Participants in the causal information condition attributed the cause of automation errors as more internal to the automation compared to participants in the control information condition (M = 13.15, SD = 4.62, and M = 11.81, SD = 4.91, respectively).
Automation Expectancy
Automation expectancy scores ranged from 44 to 80 and were normally distributed, as confirmed by a Shapiro–Wilks test, W(221) = .994, p = .516. The mean automation expectancy was 61.59 (SD = 6.16), and the median was 61. The average of our sample was slightly higher than those reported in previous studies (M = 57.69, Singh et al., 1993a; Mdn = 56, Singh et al., 1993b; Mdn = 58, Prinzel, Freeman, & Prinzel, 1995; M = 56, Merritt & Ilgen, 2008).
Perceived Reliability
The perceived reliability data were analyzed using linear regression with repeated measures. Reliability condition (100–80, 80–80, 60–80), information condition (control, causal attribution), and automation expectancy were entered as between-subjects factors. Trial block was entered as a within-subjects factor for each 100 trials.
There was a significant main effect of automation expectancy, R2 = .02, F(1, 209) = 4.032, p = .046, η p 2 = .019, a significant three-way interaction among block, reliability condition, and information condition, R2 = .03, F(2, 209) = 4.943, p = .008, η p 2 = .045, and a significant four-way interaction among automation expectancy, block, reliability condition, and information condition, R2 = .06, F(2, 209) = 5.234, p = .006, η p 2 = .048. No other effects were significant.
To better understand the significant four-way interaction, separate three-way analyses were performed for each information condition.
Control information condition
In the control information condition depicted in Figure 2, it is clear that participants were sensitive to different reliabilities across the aids. As reliability changed from perfect to 80%, again participants showed sensitivity. Most important however is the finding that the extent to which participants were sensitive to changes in reliability depended on the participants’ automation expectancy score, producing a significant three-way interaction among automation expectancy, reliability condition, and block, R2 = .08, F(2, 106) = 3.131, p = .048, η p 2 = .056. Only this three-way interaction was significant.
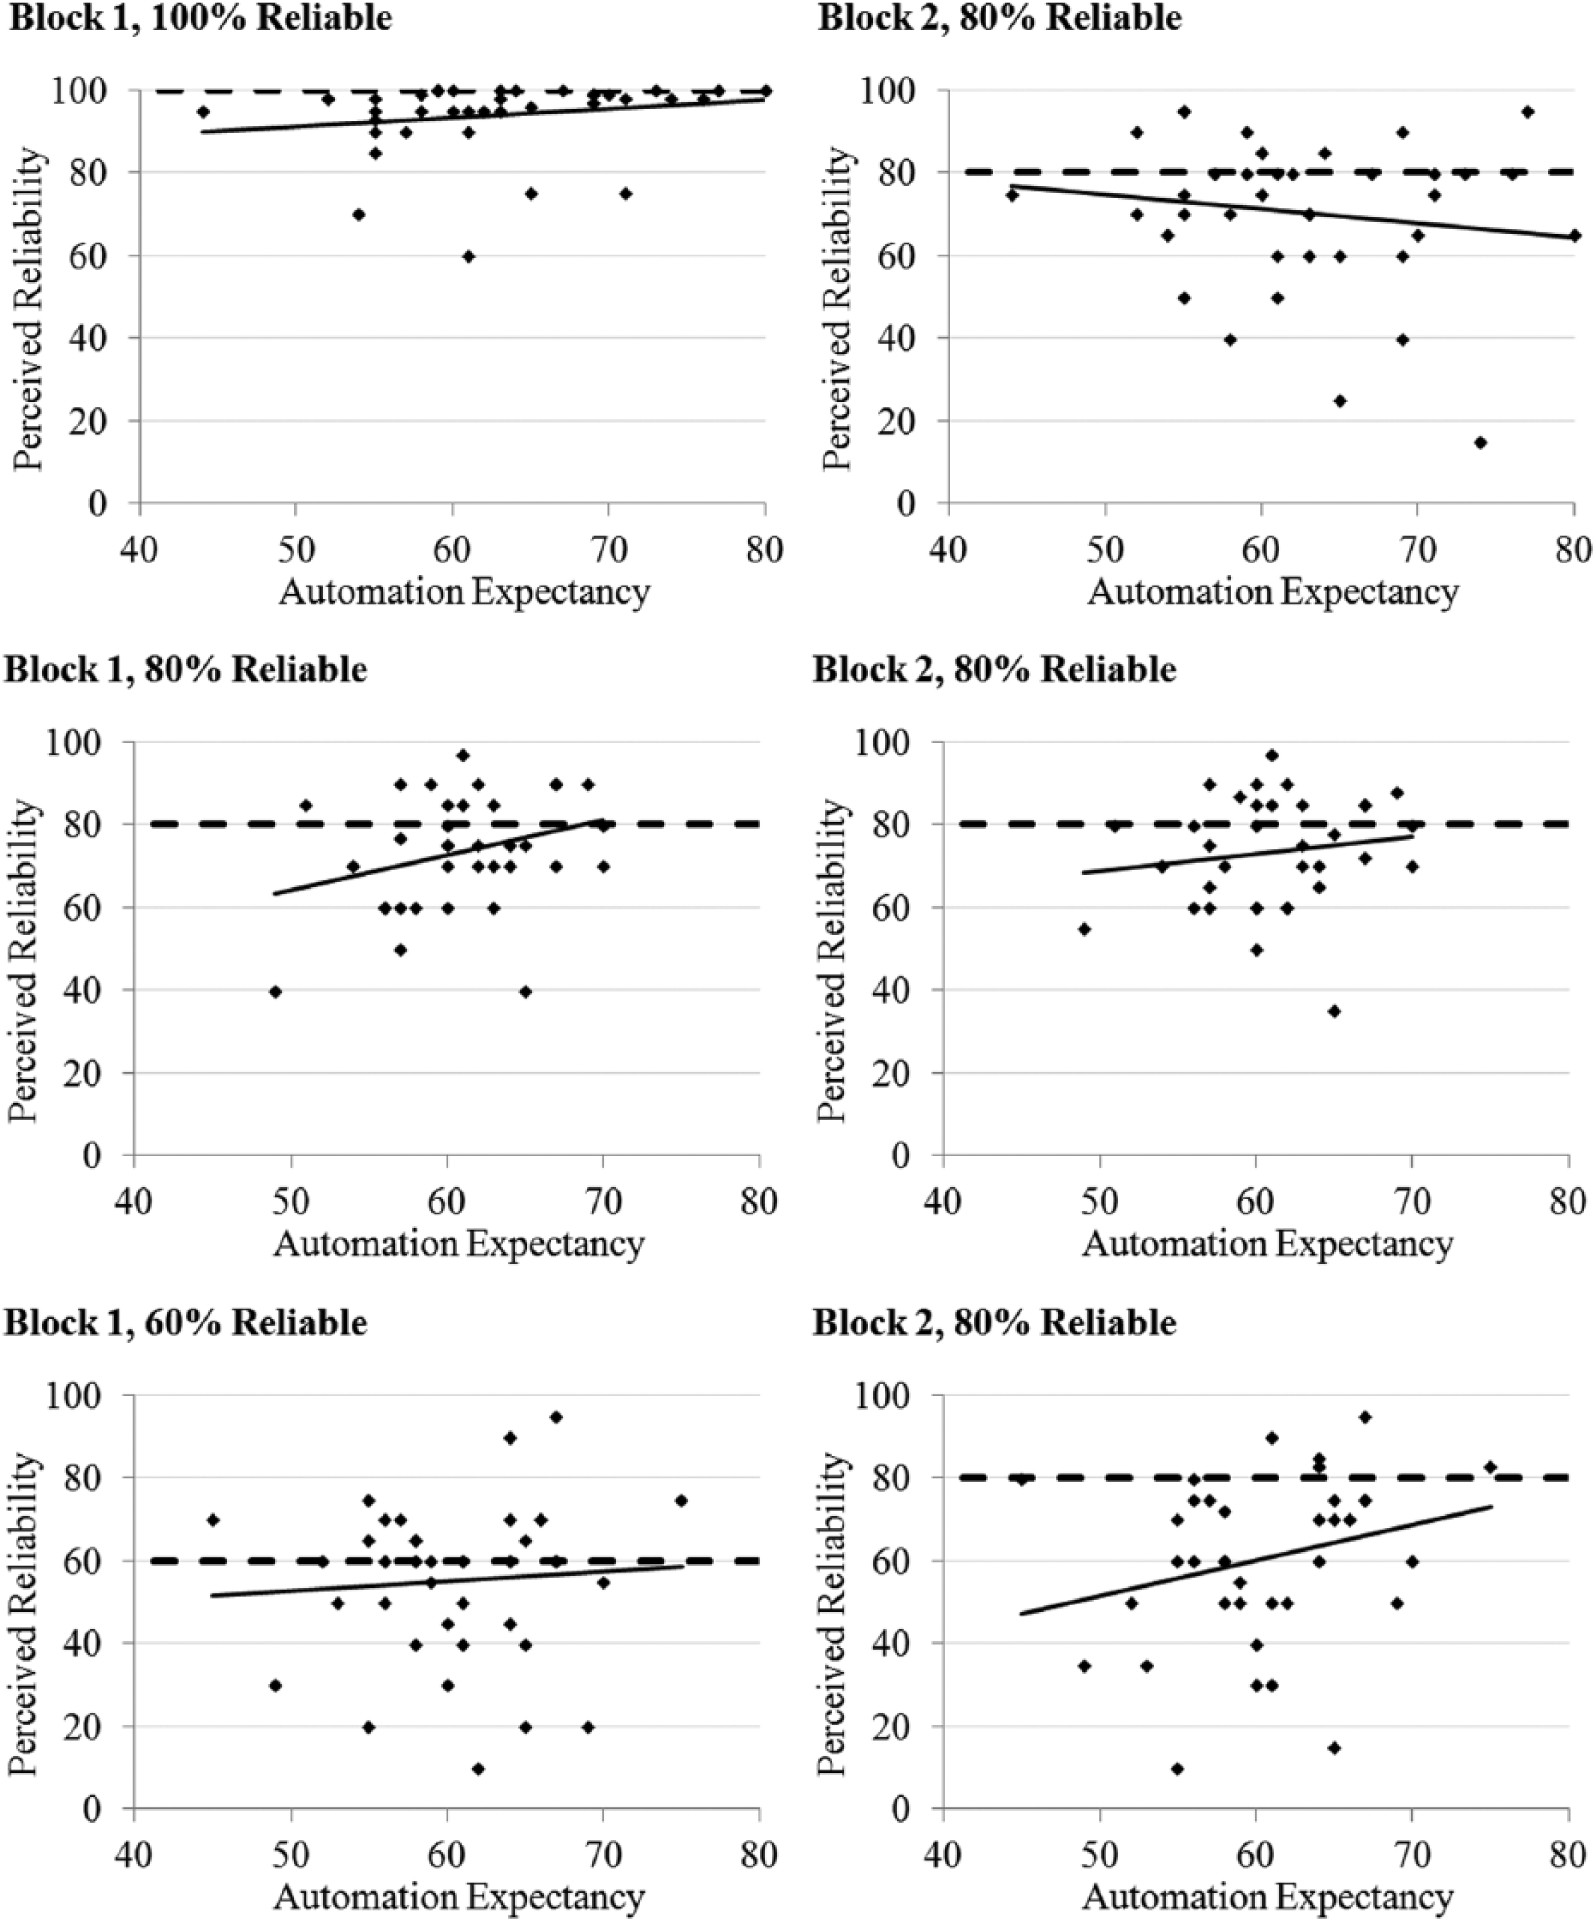
Actual (dotted) and perceived (solid) reliability for each trial block in the control information condition in which participants did not receive any information regarding the consistency, distinctiveness, or consensus of automation errors. The first row is the 100–80 reliability condition, the second row is the 80–80 reliability condition, and the third row is the 60–80 reliability condition.
As illustrated in Figure 2, participants with a higher automation expectancy compared with lower automation expectancy were slightly better calibrated in the first block, regardless of whether the automation was 100%, 80%, or 60% reliable. In the second block, however, we started seeing different effects of automation expectancy. The pattern of data indicated that higher automation expectancy resulted in better calibrated adjustment when the capability of the automation increased, but poorer calibrated adjustment when the capability decreased. Automation expectancy did not affect perceived reliability in the condition where reliability remained a constant 80%. If this three-way interaction involving automation expectancy was due to the causal attribution of errors, we may see it reduced or eliminated in the causal information condition, which guides them toward making similar attributions.
Causal information condition
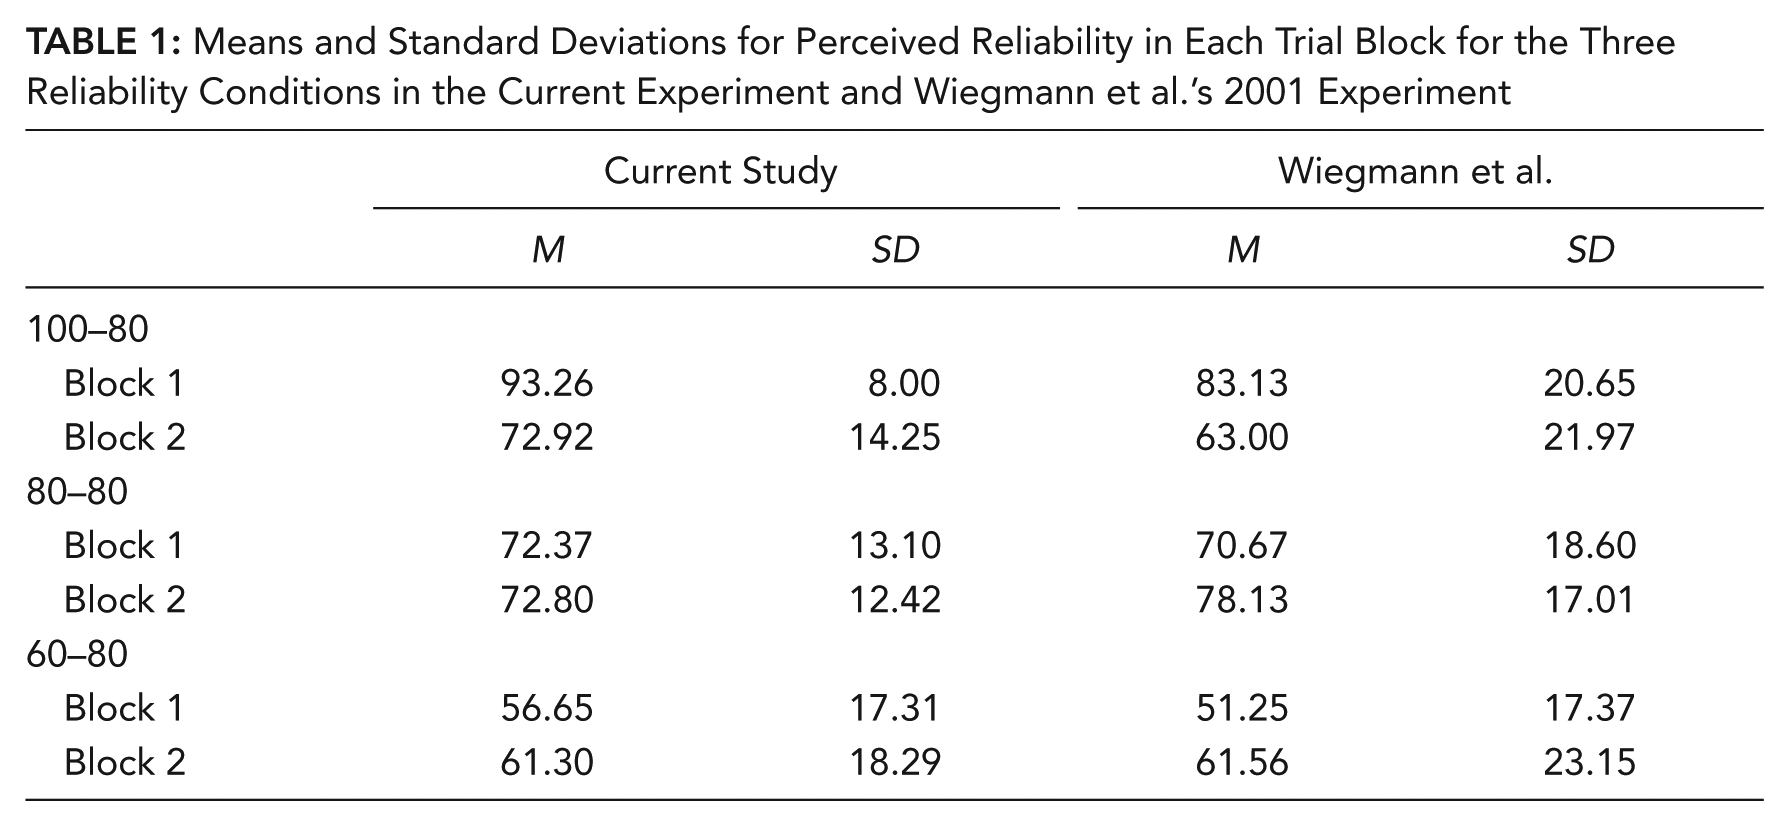
The separate three-way analysis for the causal information condition revealed a significant interaction between reliability condition and block, R2 = .02, F(1, 103) = 4.031, p = .021, η p 2 = .073, indicating that participants were generally sensitive to different aid reliability levels as well as changes in reliability as was true in the control condition. The pattern of this interaction matches Wiegmann et al.’s (2001) findings and supports their conclusion that trust is lost faster than it is regained, evidenced by the relatively large drop in perceived reliability when the aid went from 100% reliable to 80% compared to a much smaller increase in perceived reliability when the aid went from 60% to 80% reliable. The means and standard deviations are included in Table 1.
Means and Standard Deviations for Perceived Reliability in Each Trial Block for the Three Reliability Conditions in the Current Experiment and Wiegmann et al.’s 2001 Experiment
As illustrated in Figure 3, the separate three-way analysis also revealed that the individual differences found in the control information condition were eliminated by the causal attribution information manipulation. Automation expectancy was not significant in any interactions or as a main effect. More specifically, the three-way interaction that was found in the control information condition was not significant when attribution-biasing information was given, R2 = .04, F(2, 103) = 2.312, p > .10, η p 2 = .043.

Actual (dotted) and perceived (solid) reliability for each trial block in the causal attribution information condition. The first row is the 100–80 reliability condition, the second row is the 80–80 reliability condition, and the third row is the 60–80 reliability condition.
Trust
The trust scale data were analyzed using linear regression with repeated measures. Reliability condition, information condition, and automation expectancy were entered as between-subjects factors and trial block as a within-subjects factor. The results revealed a significant main effect of automation expectancy, R2 = .02, F(1, 209) = 4.112, p = .044, η p 2 = .019, but one that did not account for much variance (2%). This effect indicated that participants with higher automation expectancy had higher trust in the automation than participants with lower automation expectancy. No other effects were significant.
Most of the components included in the Jian et al. (2000) scale were not sensitive to the factors manipulated in this experiment. We then looked at the component most directly manipulated in this experiment, the competence component of trust (Question 10, “The system is reliable”). We found several significant effects including a significant four-way interaction among automation expectancy, block, reliability condition, and information condition, R2 = .08, F(2, 209) = 3.111, p = .047, η p 2 = .029. The pattern of this four-way interaction was the same as the pattern in the significant four-way interaction in the perceived reliability data, with higher automation expectancy participants being more sensitive to changes in automation reliability in the control information condition. Once again, the individual differences found in the control information condition were no longer present in the causal attribution information condition.
General Discussion
The results of this study may explain why previous experiments have sometimes found unstable and nonlinear changes in trust. We found that calibration of trust differed as a function of automation expectancy. We hypothesized that operators with high automation expectancy would be better at calibrating their trust to changes in automation performance. Our results indicated that high expectancy operators were indeed more sensitive to changes in reliability of automation; however, this sensitivity did not always result in better calibration. Operators with high automation expectancy had better calibrated adjustment when the capability of the automation increased, but poorer calibrated adjustment when the capability decreased.
We originally proposed that operators with high automation expectancy are more sensitive in calibrating their trust because they attribute the cause of errors as internal to the automation. We manipulated the causal attribution locus of errors in an attempt to make operators, especially those with low automation expectancy, better at calibrating trust. Our manipulation demonstrated to be effective, and we eliminated the effects of automation expectancy all together. However, the relationship between automation expectancy and causal attribution turned out to be the opposite of what we hypothesized. The internal attribution manipulation did not make low expectancy operators more sensitive in calibrating their trust with changes in automation reliability. Instead, the internal attribution manipulation made high expectancy operators less sensitive.
The relationship between automation expectancy, causal attribution locus, and trust is not as simple as we proposed in the introduction. Trust is a multidimensional construct that is based on a variety of factors (Lee & See, 2004). The task and situation related reliability of automation has been defined as one of the general bases of trust in automation (Lee & Moray, 1992; Lee & See, 2004). Studies have shown that appropriate trust depends on understanding the capabilities of automation in different situations (Lee & See, 2004). Discriminating between situations in which the automation differs in reliability leads to more appropriate trust (Cohen et al., 1998). This may be why we found that the internal attribution manipulation made operators less sensitive in calibrating their trust. Attributing the cause of errors as internal to the automation may mask changes in the capabilities of the automation. Operators with high automation expectancy may be more sensitive in calibrating their trust to changes in reliability because attributing the cause of errors as external to the automation helps foster an understanding of tasks and situations in which automation differs in reliability.
The results of our study are also applicable outside of the research community. Operators differing in automation expectancy may need different interventions (training) or information to successfully calibrate their trust levels. For example, operators with low automation expectancy may be given information that leads them to attribute the cause of automation errors as external to the automation (i.e., providing information indicating that automation behavior is high in consistency, high in consensus, and high in distinctiveness). Training programs can also be customized for operators with low automation expectancy to better understand the capabilities of automation in different situations.
As Lee and See (2004) stated, “Little research has addressed the challenges of promoting appropriate trust in the face of a dynamic context that influences its capability” (p. 75). Future studies should investigate individual differences in the calibration of trust in automation beyond the limitations in our study. Based on our hypothesis, we included only an internal attribution manipulation. Future studies should also examine whether providing information that results in automation errors being causally attributed to the situation results in higher sensitivity in adjusting trust to situations differing in reliability. The reliability conditions we chose were based on past research and experimental convenience, and may also potentially confound level of reliability and direction of reliability change. Future studies should investigate how calibrated adjustment varies as a factor of automation expectancy in a wider variety of reliability levels and directions of change. Understanding the dynamics of trust is critical in understanding the highly nonlinear patterns of automation reliance, and the first step in both explaining and predicting human–automation interaction.
Key Points
Calibration of trust with changes in automation performance differed as a function of automation expectancy and change in reliability.
Differences in adjusting trust to situations differing in trustworthiness were eliminated by manipulating the causal attribution of automation errors.
Operators who attribute the cause of automation errors as internal to the automation do not foster an understanding of situations in which automation differs in reliability and do not develop more appropriate trust.
Footnotes
Acknowledgements
Vlad L. Pop is a graduate research assistant at Georgia Institute of Technology. He earned his MS in engineering psychology from Georgia Institute of Technology in 2013.
Alex Shrewsbury is an undergraduate research assistant at Georgia Institute of Technology. He earned his BS in psychology from Georgia Institute of Technology in 2013.
Francis T. Durso is Professor of Psychology at Georgia Institute of Technology. He earned his earned PhD in learning/cognitive processes from the State University of New York at Stony Brook in 1980.