
Abstract
Strayer et al.’s conclusion that their “cognitive distraction scale” for auditory-vocal tasks indicates “significant impairments to driving” is not supported by their data. Additional analysis demonstrates that slower brake reaction times during auditory-vocal tasks were fully compensated for by longer following distances to the lead car. Naturalistic driving data demonstrate that cellular conversation decreases crash risk, the opposite of the article’s assumption. Hence, the scale’s internal and external validities for indicating driving impairment are highly questionable.
Keywords
Because a secondary task is “distracting” does not necessarily mean that it impairs driving. For example, whereas a reaction time (RT) increase due to distraction may be evidence of potential impairment, a longer following distance (FD) to a lead vehicle is likely evidence of improvement (e.g., Angell et al., 2006; Kircher et al. 2004). At a given speed, a longer FD indicates a longer following time (FT) to a lead vehicle. Evans and Wasielewski (1982) found that drivers with >1 s FTs in high-flow freeway traffic are relatively crash and violation free compared to drivers with shorter FTs. Young (2014b), using Naturalistic Driving Study (NDS) data, found that drivers lengthen FT during cellular conversations. Victor et al. (2015) found that increasing FT reduces rear-end crash risk. Rather, it is shorter headways that indicate driving safety impairment, for example, from alcohol (Strayer, Drews, & Crouch, 2006) or aggression (Tasca, 2000).
Drivers can increase FT by reducing speed (Yannis, Papadimitriou, Karekla, & Kontodima, 2010, Figure 2). Kircher, Ahlstrom, Palmqvist, and Adell (2015) found that bicyclists proactively reduce speed before calling or texting. Whether such compensations are proactive, reactive, or both, they improve safety margins (see Ahlstrom, Kircher, Thorslund, & Adell, 2015; Platten, Schwalm, Hülsmann, & Krems, 2014).
However, Strayer et al. (2015) claim that “brake RT increased as a function of condition over and above any compensatory effects associated with following distance” (p.
Mean Brake Reaction Time, Following Distance, Following Time, Safety Margin, and Cognitive Distraction Scale for the Eight Task Conditions
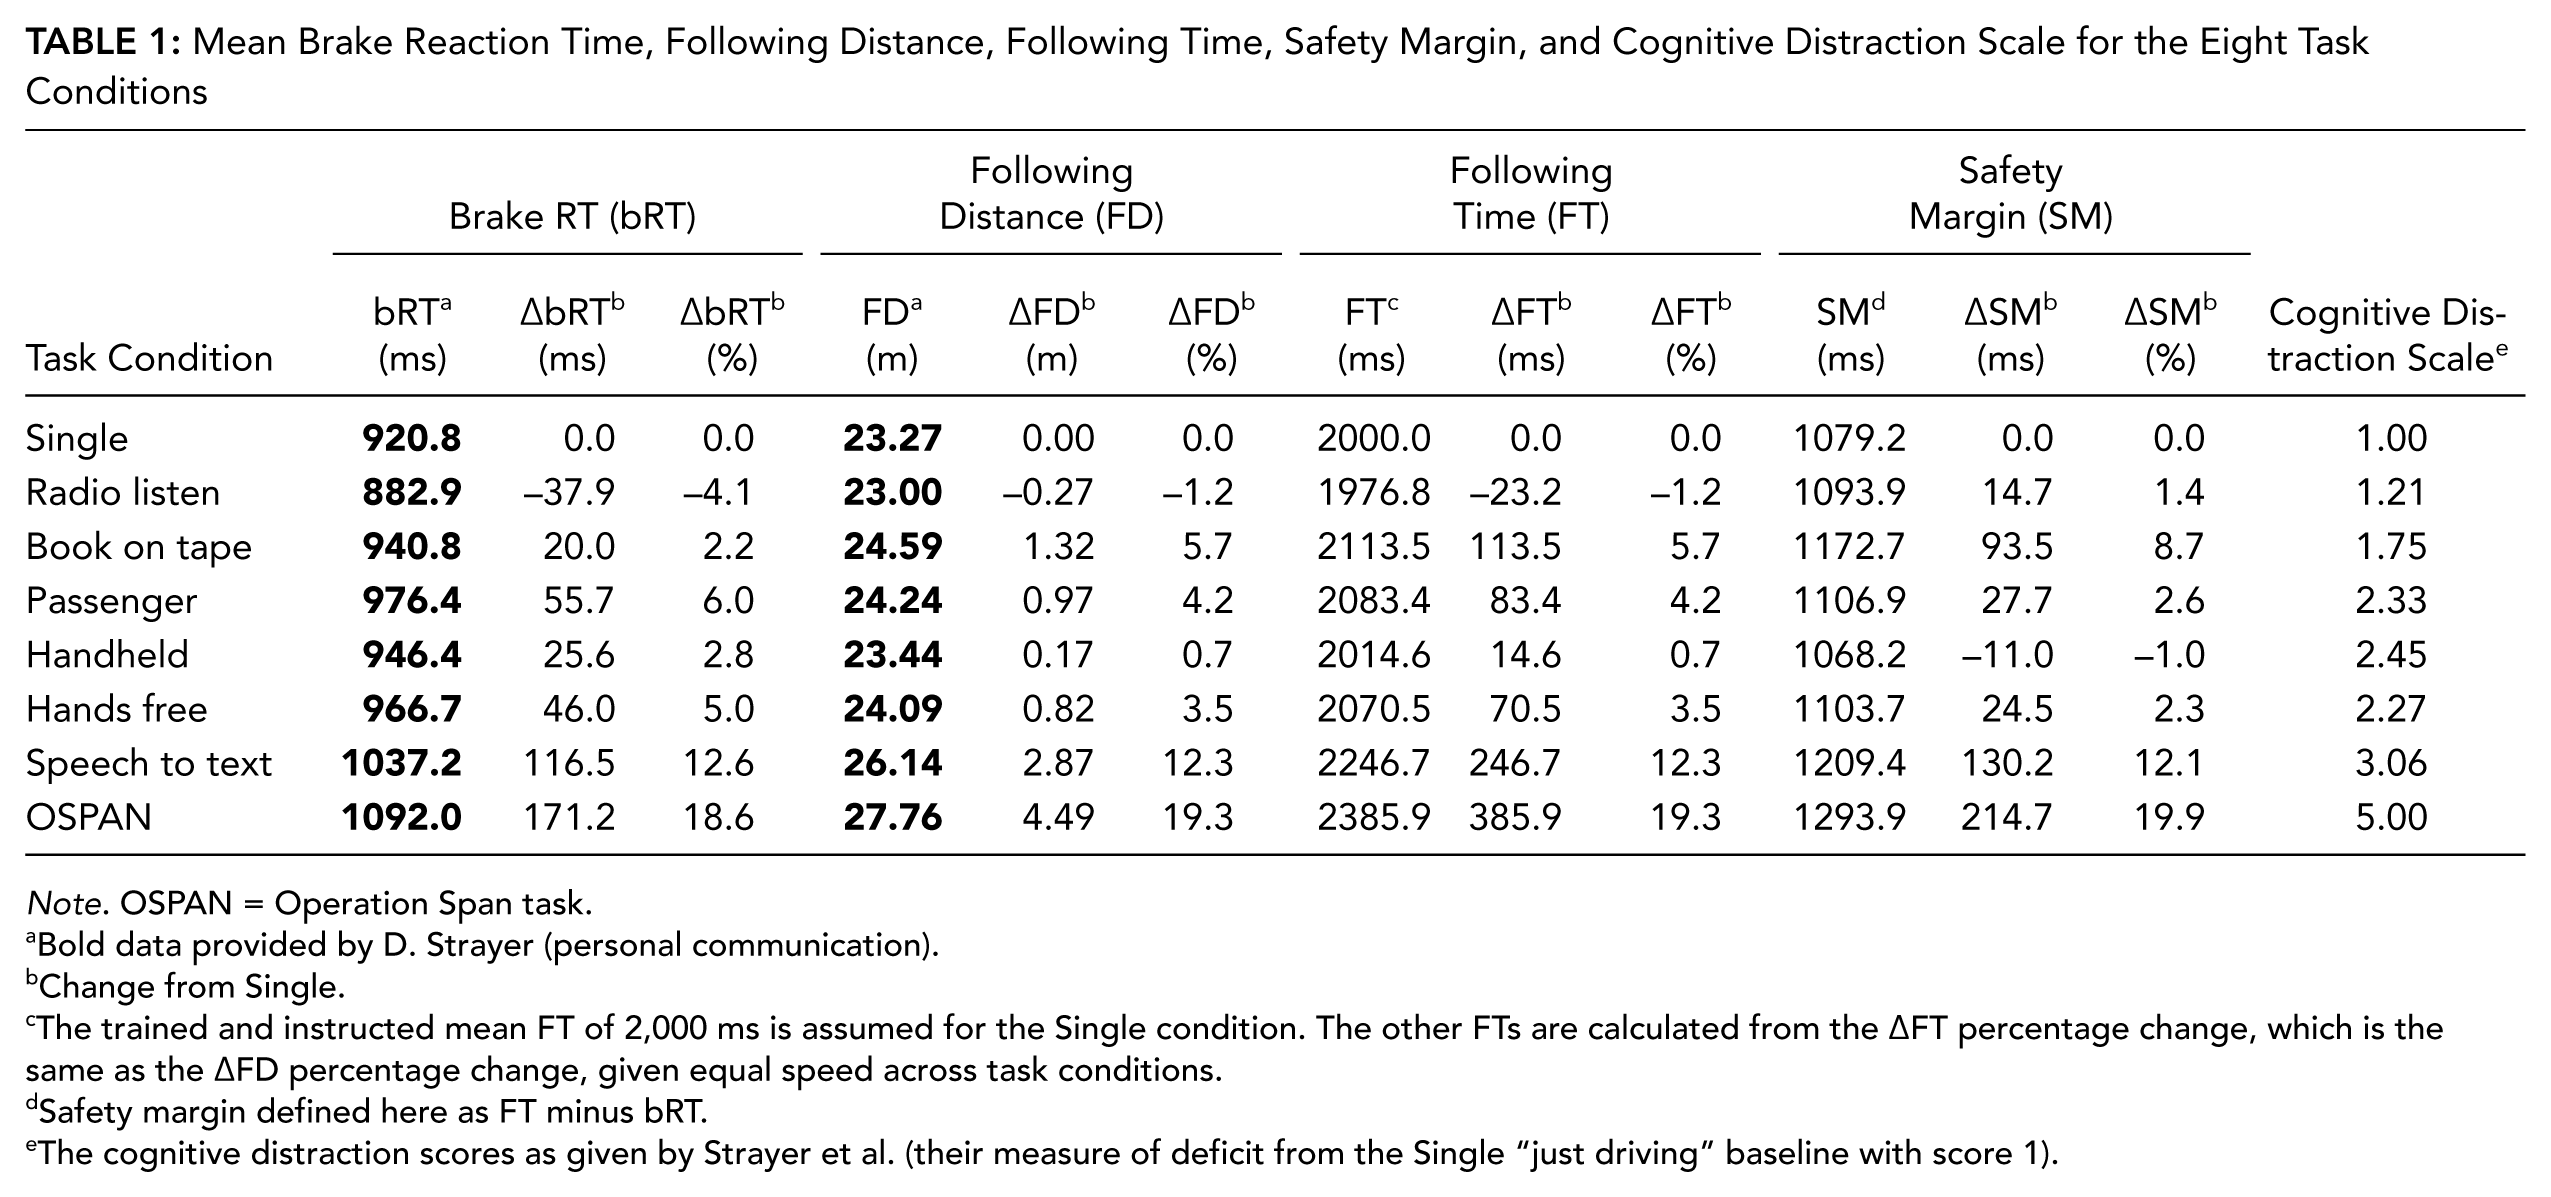
Note. OSPAN = Operation Span task.
Bold data provided by D. Strayer (personal communication).
Change from Single.
The trained and instructed mean FT of 2,000 ms is assumed for the Single condition. The other FTs are calculated from the ∆FT percentage change, which is the same as the ∆FD percentage change, given equal speed across task conditions.
Safety margin defined here as FT minus bRT.
The cognitive distraction scores as given by Strayer et al. (their measure of deficit from the Single “just driving” baseline with score 1).
To test compensation in the provided data, FD is divided by speed to convert to the bRT scale. The authors did not provide speed data, but their previous studies with the same simulator protocol (Drews, Pasupathi, & Strayer, 2008; Strayer et al., 2006; Strayer & Drews, 2004) found no significant differences in mean speed between task conditions. Assuming a similar situation here, the percentage changes in FD and FT are equal (Young, 2014a, Section 1.3.3), and FTs can be calculated (Table 1). The safety margin (SM) is the difference between FT and bRT, which was >1 s for all task conditions. Overall, during tasks with a longer bRT, drivers increased FT (r = .95, p = .0002), indicating that changes in FT (∆FT) fully compensated changes in bRT (∆bRT).
For example, Table 1 shows that from Single to OSPAN, FD lengthened from 23.27 to 27.76 m, or 19.3%. The corresponding 19.3% increase for FT was from 2,000 to 2,385.9 ms, or a ∆FT of 385.9 ms. The ∆bRT between Single and OSPAN was from 920.8 to 1,092.0 ms, or 171.2 ms. The SM change (∆SM) for OSPAN is then 214.7 ms (∆FT minus ∆bRT, or 385.9 ms − 171.2 ms), the largest SM improvement of any tested task and the opposite of the authors’ claim. Figure 1A illustrates these results. The SMs would be even larger if mean speeds declined rather than stayed equal for the dual-task conditions versus the Single condition.
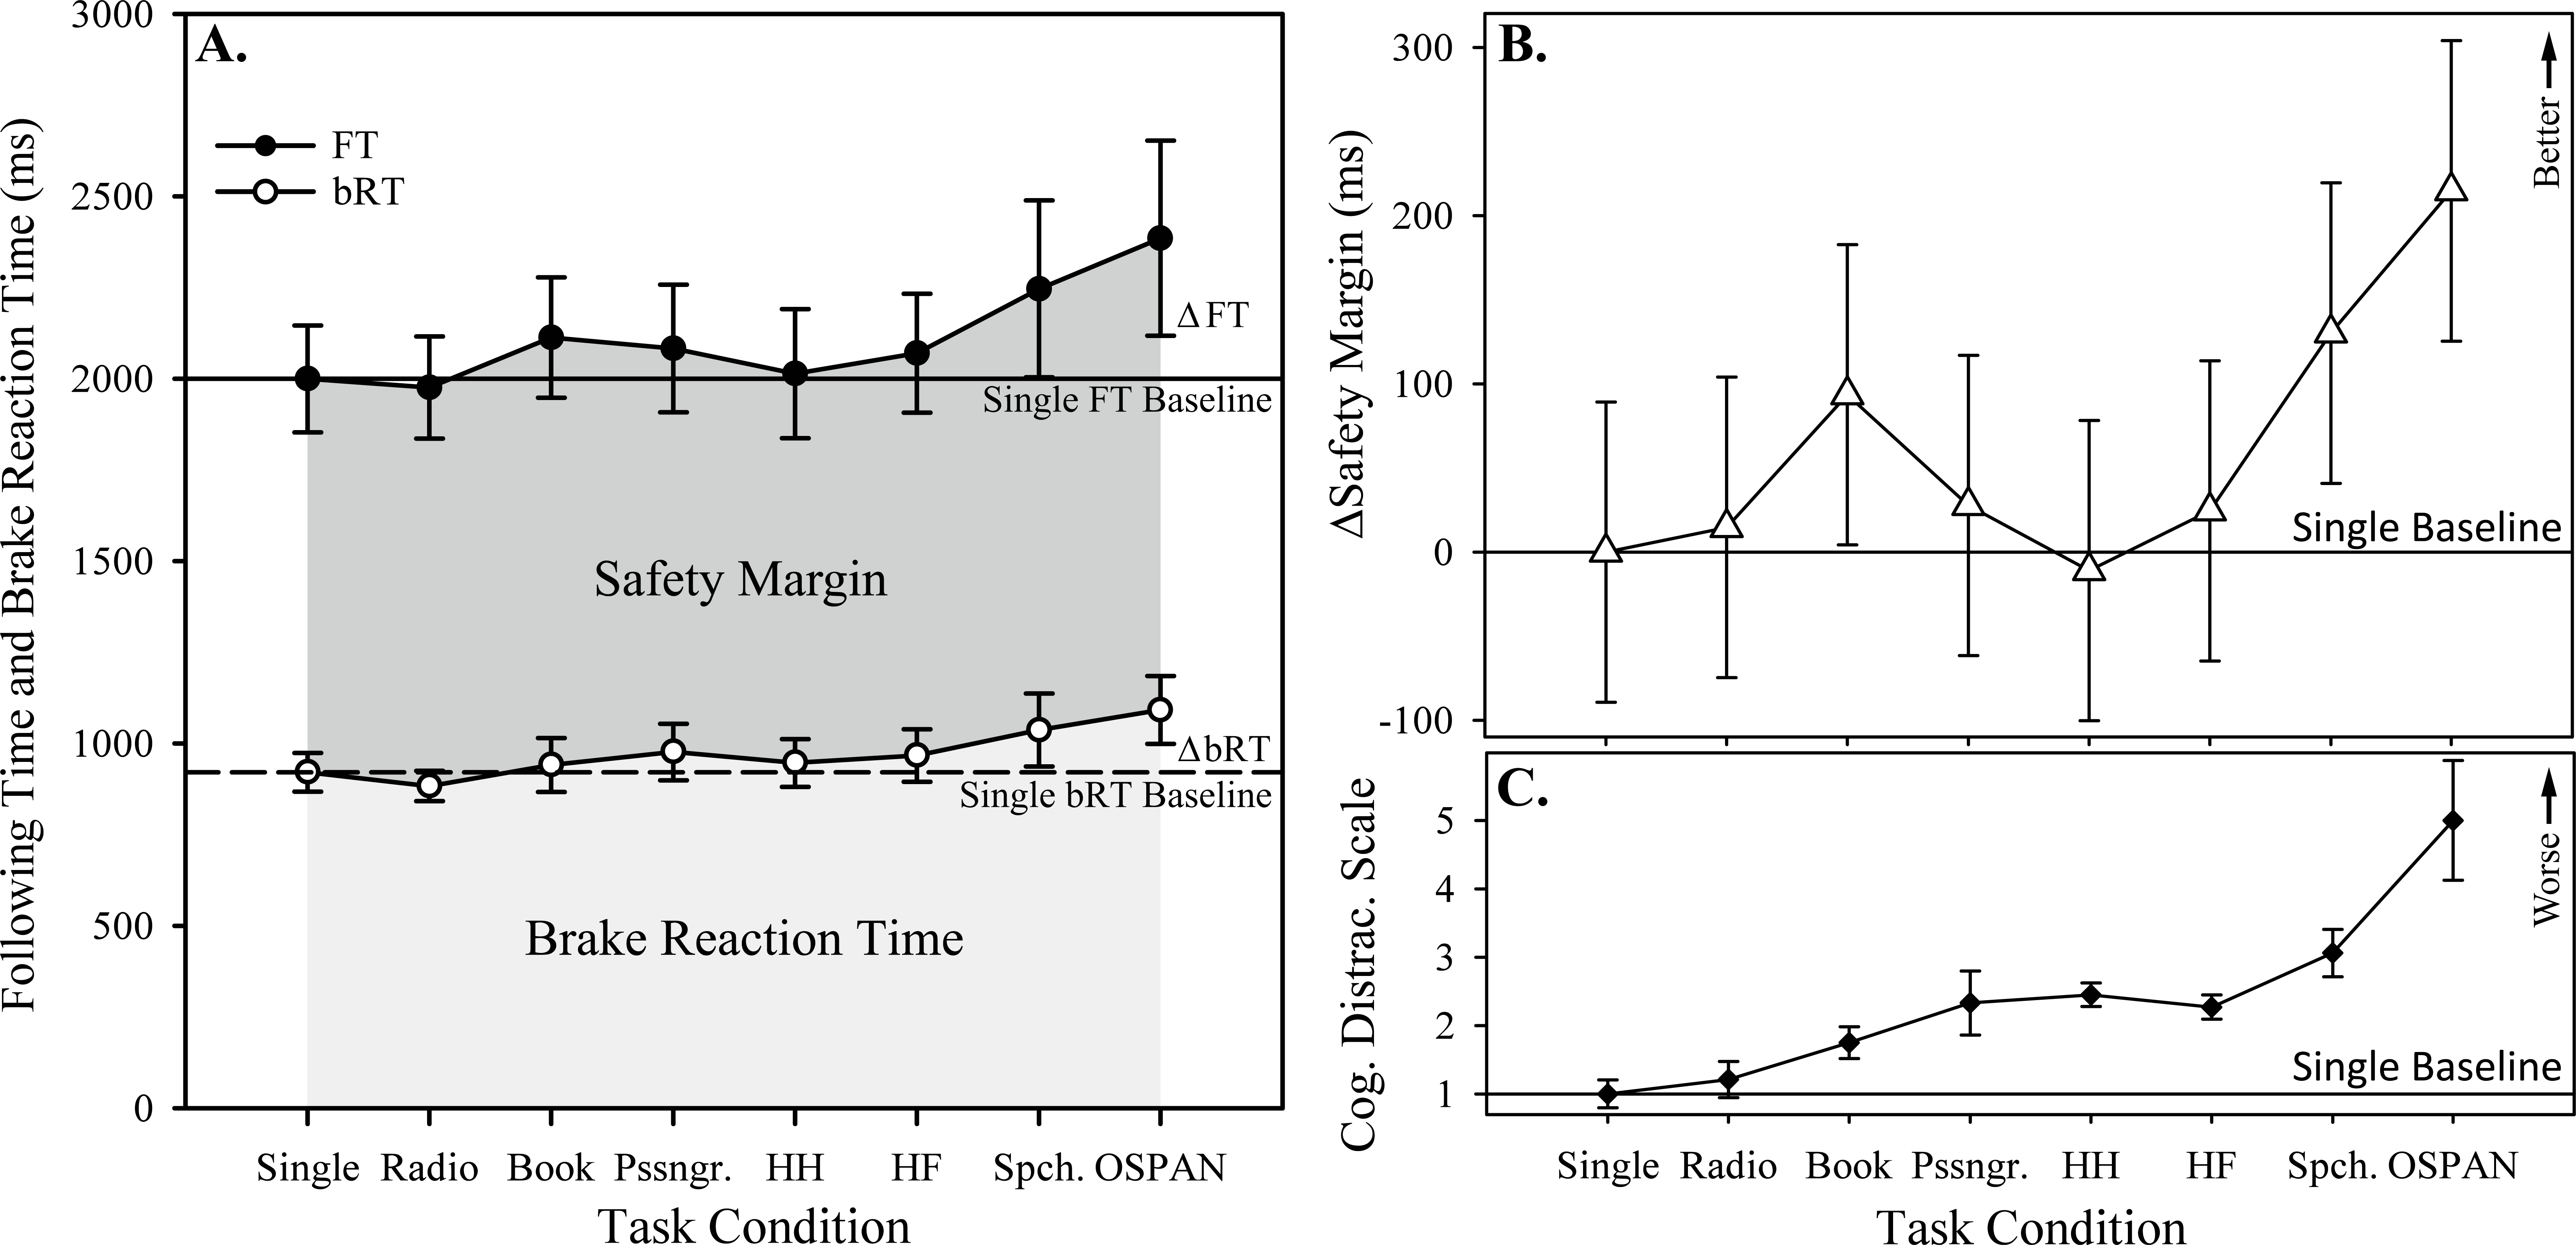
(A) Drivers compensate for the longer brake reaction time (bRT; open circles) by increasing their following time (FT; black circles), resulting in a larger overall safety margin for tasks with higher cognitive distraction scores. Error bars are 95% confidence intervals. (B) The change in safety margin (∆SM, the difference of ∆FT and ∆bRT in left graph) for the task conditions, compared to the Single baseline (horizontal solid line). Upward indicates a better safety margin. Error bars are pooled 95% confidence intervals. (C) The Strayer et al. cognitive distraction scale. Upward indicates worse “impairment” according to Strayer et al., compared to Single baseline (horizontal solid line). Error bars are pooled 95% confidence intervals.
Figure 1B plots the change in safety margin (∆SM, the difference of ∆FT and ∆bRT in Figure 1A) for the task conditions. Figure 1C replots the article’s scale. The SM improves as the “cognitive distraction score” gets “worse” (r = .83, p = .011). That is, the authors’ scale indicates improved and not impaired driving safety margins.
The authors assume their scale (Figure 1C) has a positive “monotonic relationship” with relative crash risk (RR). If so, cellular conversation should have an RR >1, but naturalistic studies indicate an RR <1 (Fitch et al., 2013; Young & Schreiner, 2009). After correction of errors and adjustment for biases in Redelmeier and Tibshirani (1997), McEvoy et al. (2005), and Klauer, Dingus, Neale, Sudweeks, and Ramsey (2006), the pooled RR estimate across the five cited studies is 0.61 (CI [0.51, 0.74]; Young, 2014b, Table 12). Victor et al. (2015) estimated an even lower RR of 0.1 (CI [0.01, 0.7]) for cellular conversation and rear-end crashes/near crashes.
Young and Schreiner (2009) invoked the compensation hypothesis to explain this protective RR, noting that drivers tend to engage in conversations during less-demanding driving situations (e.g., low traffic volume, non-intersections). Young (2015) extended the compensation hypothesis to include reduction of risk by possible displacement of illegal, reckless, or otherwise unsafe driving while performing secondary tasks. Because Strayer et al. (2006) did not consider such compensatory factors, their scale predicts impairments rather than the observed safety improvements.
The glances-at-intersections metric is also inconsistent with NDS data (Young, 2014a). Drivers scanned 74% of intersections during Single, declining to 61% during OSPAN (Figure 9). However, Fitch et al. (2013, p. xxvii) found that NDS drivers scanned intersections only 36% of the time while “just driving,” with no decline during cellular conversation. The scan percentages in the Strayer et al. (2015) article may therefore reflect drivers’ caution while being observed by in-car experimenters (an instance of the observer effect, in which participants aware of being watched behave differently than when not watched).
The authors also used a head-mounted light to measure another RT metric and a metric related to misses (A′). These RTs (their Figure 1) were even smaller than the bRTs in Table 1 and so were likewise fully compensated by FT. The A′ effects were small, consistent with the negligible miss rates during auditory-vocal tasks (Angell et al., 2006). Even with novel roadway events, with eyes on the road, the brain’s orienting attention network can alert the driver if the executive attention network is preoccupied (Foley, Young, Angell, & Domeyer, 2013; Young, 2012). The remaining electroencephalogram and subjective metrics in the scale do not measure driving performance and therefore cannot measure its impairment, so they need not be considered further.
In conclusion, the “cognitive distraction scale” fails to account for evidence for compensation exhibited in the data used to create it. As a result, the scale’s internal validity for measuring driving impairment is questionable in its present form. Its external validity is also made problematic by real-world driving studies demonstrating that cellular conversation decreases crash risk, the exact opposite of the scale’s prediction.
Footnotes
Acknowledgements
I thank K. Kircher, B. Papazian, M. Posner, and several anonymous reviewers for helpful comments, and A. Zeidan for research assistance.
Richard A. Young is a research professor in the Department of Psychiatry and Behavioral Neurosciences, School of Medicine, with a joint appointment in the Bioengineering Department and Automotive Safety Group, School of Engineering, Wayne State University, Detroit, Michigan. He received a PhD degree in experimental and physiological psychology from New York University in 1973, with postdoctoral fellowships at Harvard University and University of California, Berkeley, in cognitive neuroscience.