
Abstract
Objective:
The aim of this study was to evaluate the effects of secondary tasks on the driving performance of individuals with mild traumatic brain injuries (TBIs).
Background:
Studies suggest detrimental impacts of driving with TBI or while distracted but the impact of driver distraction on TBI drivers is not well documented.
Method:
Bayesian regression models were used to estimate the effect of relatively simple secondary tasks on driving performance of TBI and healthy control (HC) drivers. A driving simulator was used to develop prior distribution of task effects on driving performance for HCs. An on-road study was conducted with TBI and HC drivers to generate effect estimates for the posterior distributions. The Bayesian models were also compared to frequentist models.
Results:
During a coin-sorting task, all drivers exhibited larger maximum lateral acceleration and larger standard deviation of speed than in a baseline driving segment. There were no significant driving performance differences between the TBI and the HC drivers during the tasks. Across all tasks, TBI drivers spent more time looking at the tasks and made more frequent glances toward the tasks.
Conclusions:
The findings show that even drivers with mild TBI have significantly longer and more glances toward the tasks compared to the HCs.
Application:
This study demonstrates a Bayesian approach and how the results differ from frequentist statistics. Using prior distributions in a Bayesian model helps account for the probabilities associated with otherwise unknown parameters. This method strengthens the Bayesian parameter estimates compared to that of a frequentist model.
Introduction
Traumatic brain injuries (TBIs) can occur from a fall, assault, or vehicular crash or by the transfer of energy from some external source to the brain (Langlois, Rutland-Brown, & Wald, 2006; National Institute of Neurological Disorders and Stroke, 2007). In the United States, there are an estimated 1.4 million annual cases of TBIs (Langlois et al., 2006; Rudin-Brown & Noy, 2002). The symptoms of a TBI can impact all aspects of a survivor’s life, including performing administrative tasks, scheduling activities, and operating a motorized vehicle (Mazaux et al., 1997). In fact, driving following a TBI has been related to TBI survivors’ level of community integration (Rapport, Hanks, & Bryer, 2006), and those who drive following a TBI (hereafter, “TBI drivers”) are more likely to be consistently employed (Kreutzer et al., 2003). The prevalence of injuries and the impact on quality of life make driving following a TBI an important area of research.
For TBI drivers, cognitive impairments, such as impaired attention, information-processing speed deficits, and executive dysfunction, have been shown to significantly impact performance (Brooks, Hosie, Bond, & Aughton, 1986; Dikmen et al., 2009; Mathias & Wheaton, 2007). It has also been shown that TBI drivers are more likely to be involved in multiple crashes than are non-TBI drivers (Neyens & Boyle, 2012). However, individuals with a TBI who receive driving rehabilitation and evaluation appear able to compensate for their cognitive impairments and pass a driving evaluation at the same rate as their matched controls (Schultheis, Matheis, Nead, & DeLuca, 2002). Some TBI survivors who resume driving do not show significant differences in the number of traffic citations or crashes when compared to pre-injury rates (Dimarco & Cantagallo, 2001). Additionally, some licensed TBI drivers will even voluntarily restrict themselves from driving or stop driving all together (Priddy, Johnson, & Lam, 1990).
TBI drivers who are distracted while driving have been shown to crash more during incursion events compared to healthy control drivers (Cyr et al., 2008). By contrast, Lengenfelder, Schultheis, Al-Shihabi, Mourant, and DeLuca (2002) found that TBI drivers did not significantly differ from healthy controls in their driving performance (i.e., speed management) but instead made a greater number of errors in the secondary task. In general, distracting signals (e.g., nontarget stimuli) have been shown to increase reaction time for individuals with TBIs (Stokx & Gaillard, 1986). These studies underscore that additional work is still needed to clarify the effects of secondary-task performance and driving among individuals with TBI.
Multiple resource theory can be used to explain performance degradation for situations where multiple tasks (e.g., driving with a secondary task) compete for similar resources (Wickens, 2002). Driving is a heavily spatial task that can be impacted by another task that also demands spatial resources. The differences observed in driver performance may, therefore, be a result of differences in allocation of competing demands associated with secondary tasks that use similar resources (e.g., visual, spatial tasks) needed for driving. There are many secondary (nondriving) tasks performed while driving on a regular basis, such as adjusting climate controls, eating and drinking, and conversing with passengers (Stutts et al., 2003). However, these tasks have not received as much attention in the literature (Bayly, Young, & Regan, 2009) as other in-vehicle information systems (IVIS) even though they can affect driving performance (Jäncke, Musial, Vogt, & Kalveram, 1994; Jenness, Lattanzio, Raymond, O’Toole, & Taylor, 2002; Wikman, Nieminen, & Summala, 1998).
In fact, manual radio tuning has often been used as a comparison task for evaluating other distracting activities as it is considered socially acceptable (Bayly et al., 2009) and can compete for cognitive resources. Radio tuning has also been shown to increase eyes-off-road time when compared to navigation systems (Tijerina, Parmer, & Goodman, 1998) or even dialing a cell phone (Wikman et al., 1998). Other simple tasks such as interacting with CDs and listening to the radio have been associated with degraded lane-keeping ability (Jäncke et al., 1994; Jenness et al., 2002; Wikman et al., 1998). Hence, even though these secondary tasks have been recommended as benchmarks for examining future in-vehicle technology (National Highway Traffic Safety Administration [NHTSA], 2012), it is important to evaluate these tasks in the context of other clinical populations.
Drivers’ visual glances while driving are crucial for gathering information on the environment and the detection of safety-critical events. Research with nonclinical drivers has shown that the location, duration, and frequency of glances while engaged in distracting tasks provide drivers valuable information on their surroundings (Lee, 2009). There are also differences in how drivers visually sample the environment over time, and these differences are further delineated with varying age (Bao & Boyle, 2009). Healthy drivers tend not to glance away from the roadway for longer than 1.5 s, and it has been shown that when glances exceed 2 s, crash risk increases twofold (Klauer, Dingus, Neale, Sudweeks, & Ramsey, 2006; Wierwille, 1993). Hoffman, Lee, McGehee, Macias, and Gellatly (2005) found that the number of glances to an in-vehicle display can vary significantly compared to the duration of the glances; and Sodhi, Reimer, and Llamazares (2002) found that a radio-tuning task resulted in longer glances to the radio than to other in-vehicle systems and devices (e.g., rearview mirror, or odometer). Eye-glance data provide useful information for examining driver behavior while engaged in a secondary task.
The goal of this study was to evaluate the impact of secondary tasks on the driving performance of individuals with TBIs using an instrumented vehicle in an on-road study. Because there are constraints with testing a clinical population in real-world situations, a supplemental driving simulator study was also conducted with healthy drivers. The combined outcomes are used in a Bayesian analysis that uses prior distributions from the driving simulator to provide stronger inferences on the impact of distracting tasks on the on-road driving performance of drivers with TBIs. That is, the inferences from the Bayesian model is improved with the incorporation of the results from the driving simulator in terms of the precision of parameter estimates and a reduction in the variance, which generates tighter credible sets.
Bayesian Approach
A Bayesian statistical approach is used to provide a better understanding of the effects of secondary tasks on the driving performance for individuals with TBIs. This approach, based on Bayes’ theorem (Equation 1), computes a posterior probability distribution, P(θ | y), based on the normalized value of the multiplication of the prior probabilities, P(θ), and the likelihood function, P(y | θ) as follows:
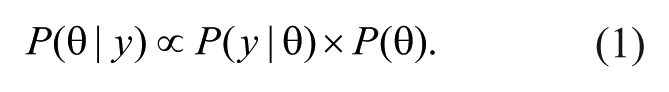
That is, our current knowledge is updated based on evidence obtained from prior studies. In this case, the priors are based on the distribution of the parameter estimates from the driving simulator study (Experiment 1).
Using this approach (graphically represented in Figure 1), unknown model parameters are treated as random variables, and the observed on-road driving data are fixed, known quantities (Martin, 2008). Bayesian methods include prior information (in the form of prior distributions) to improve the precision of the resulting posterior distributions (Ntzoufras, 2009).

In a Bayesian analysis, a prior distribution and the likelihood distribution from the data collected are used to calculate a more precise (narrower) posterior distribution.
The incorporation of prior distributions into Bayesian statistical models requires a different perspective and a different set of assumptions than a traditional frequentist approach, and there are decades of studies that compare the two methods (Bayarri & Berger, 2004; Birnbaum, 1977; Casella & Berger, 1987; Efron, 2006). In a frequentist approach, the model parameters are assumed to be fixed and unknown, and the observed data are treated as the random variable. In a Bayesian approach, the model parameters are still unknown, but they are treated as random variables, and the observed data are considered to be the fixed, known quantities (Martin, 2008).
The major benefits for using a Bayesian approach are rooted in the incorporation of prior distributions that allow for statistical analysis on data with restricted sample sizes and thus possibly small effect sizes. Whether the smaller sample sizes are a result of available participants or by study design, the formal inclusion of prior knowledge accounts for these restrictions. The value of the Bayesian approach was described by the U.S. Food and Drug Administration (2010) for researchers interested in this technique for clinical testing. Yet, the estimation of priors and identifying appropriate data for these estimates remain a challenge. Using prior distributions allows the precision of estimates to be improved by bringing more information into the analysis. The sources of the data for estimating prior distributions can come from effect sizes previously identified from previous experiments that can be identical or somewhat similar (e.g., there may be differences in subpopulations, study apparatus, and study designs).
Using Bayesian methods can minimize the impact of sample size, which is particularly useful for human factors studies in which participant recruitment for some at-risk populations is a challenge. For this study, there are limitations with recruitment from the targeted clinical population, and Bayesian methods allow us to use data from previous studies to strengthen the parameter estimates. Iterative analysis can also be conducted to determine if an appropriate stopping criterion (or effect size) is even feasible. That is, a Bayesian approach would facilitate preventing undue risk on future participants if the hypothesis could be either supported with fewer data or abandoned if the preliminary results do not show a convergence toward a significant effect. The results of a Bayesian approach are more intuitively interpreted. A 95% credible set is interpreted as an interval that contains the true parameter value with 95% certainty, given the data. A credible set is different from a confidence interval, which is interpreted as a long-run approximation that any sampled confidence interval from a given population will contain the true parameter estimate 95% of the time (Congdon, 2006).
Experiment 1: Secondary Tasks on Driving Performance
The first experiment involved a driving simulator study with the goal of generating effect estimates (i.e., model parameter estimates) for various driving performance measures given engagement in various secondary tasks using a healthy control (HC) group.
Participants
Twenty-five right-handed drivers were recruited from the University of Iowa undergraduate population. There were 13 males and 12 females with a mean age of 19.48 years (SD = 1.0). All participants held a valid driver’s license, had at least 1 year of driving experience, and were native English speakers. Participants also had no driving simulator experience within the previous 6 months. The participants were compensated for their time at $15 per hour. The study took about 1 hr to complete and was institutional review board approved through the University of Iowa.
Equipment
The simulator used a 1992 Mercury Sable cab with a functional radio. The simulator had a 50° visual field and was powered by Global Sim, Inc.’s DriveSafety™ Research Simulator. In addition to collecting driving performance measures from the driving simulator, four videos were recorded (three cameras placed around the simulator facing the participant and another facing the projection of the driving scene). The driving scenario was a rural two-lane highway with no other traffic and consisted of straight segments with an equal number of 400-m-radius left and right curves. The participants were asked to drive at a comfortable speed but to not exceed a speed of 45 mph (about 73 km/h). Prior to the start of the experiment, the participants drove for approximately 2 min to become accustomed to the driving simulator. The experimenter sat in the passenger seat of the simulator to provide the task instructions, to verify that the tasks were completed correctly, and to ensure consistency with the on-road study.
Secondary Tasks
The three secondary tasks were included in the study: selecting a CD from a set of CDs, tuning to a specific radio station, and selecting a monetary amount from an array of coins. These tasks are similar to those used in other studies (Jäncke et al., 1994; Jenness et al., 2002; Wikman et al., 1998).
Selecting a CD
There were eight CDs placed in a single-row CD case. The CD case was vertically attached to the center console above the radio. Each CD could be one of four colors (red, green, blue, yellow), and within each color, the CDs were labeled either A or B. Participants were asked (by the researcher) to select a specific CD from the case by color and letter (e.g., red A, green B) and hand it to the researcher.
Radio tuning
The vehicle’s factory-installed radio was set to AM frequencies and was designed to simulate the task required to tune to weather or traffic advisory stations commonly observed on U.S. interstates and highways. The radio was not actually able to receive AM stations, and only static noise was produced from different frequencies. However, the radio was able to consistently find specific frequencies. The radio was always positioned at 700 AM prior to the experiment. Participants were asked to turn the radio on and tune to a specific station using either the search or seek button. Once the radio station was reached, the experimenter turned off the radio.
Coin sorting
Sixteen coins (four quarters [$0.25], four dimes [$0.10], four nickels [$0.05], and four pennies [$0.01]) were placed in the coin tray within the vehicle. The participants were requested to make $0.85 from any combination of these coins.
Although these tasks appear to be relatively simple, there can be different levels of demand that would impact driving performance in different ways. Multiple resource theory suggests that the resources used for the secondary tasks may interfere with the primary driving task (Wickens, 2002). These tasks all contain different visual, manual, and cognitive components that could conflict with driving. Each of the secondary tasks used in this study has been used in other driving studies (e.g., Boer, 2001; Osswald, Meschtscherjakov, Wilfinger, & Tscheligi, 2011) and provides a way to assess varying levels of demands associated with competing resources while driving. The coin-sorting task in particular adds a level of cognitive complexity (adding coin amounts) that may result in additional performance decrements which is of interest in this study.
Each participant was shown how to use the radio, was shown where the coin tray was located, and was able to look at each CD prior to the start of the experiment. Each participant completed each of the tasks randomly to control for any order effect. Each task was conducted only on the straight segments of the road, and the curve segments were not included in the analysis. A baseline measure of driving performance consisted of a short interval (about 30 s) of driving on a straight road segment before the tasks were started but after the participants became comfortable with the control of the vehicle. No baseline measures of secondary-task performance were collected, as the primary goal was to evaluate the effect that the tasks had on driving performance measures.
Dependent Measures
There were two categories of dependent measures: driving performance related and eye gaze related. The driving performance measures included the mean speed (mph), the standard deviation of speed (mph), and maximum lateral acceleration (g). The variability in the speed has been shown to be an important measure of safety (Reed & Green, 1999). Maximum lateral acceleration has been used in other studies and relates to the lateral (steering) control of the vehicle (Classen et al., 2006; Reymond, Kemeny, Droulez, & Berthoz, 2001). Both the maximum lateral acceleration and the standard deviation of speed were linearly transformed by multiplying them by a constant in order to facilitate the statistical analysis.
For eye gaze–related data, several variables were coded by manually reducing videos of the participant’s face. These variables included the percentage of time that the participant looked at the secondary task, the frequency of glances to the secondary task, and the duration of the longest glance to the secondary task. A single researcher reduced the eye gaze data to ensure consistency in the reduction. The eye gaze–related variables have been used in other studies (Hoffman et al., 2005; Sodhi et al., 2002) and were applicable only for the conditions in which secondary-task engagement occurred and not for the baseline driving segment. Each task was defined as starting with the beginning of the instructions and ending when the participant returned his or her hands to the steering wheel following the task.
Separate one-way repeated-measures linear models were constructed using the lme function in R (Version 2.9.1) with dichotomous dummy variables indicating the task engagement or baseline driving for comparisons for each dependent variable.
Results and Discussion
Driving performance measures
There were four participants who had substantially larger maximum lateral acceleration than the rest of the participants (they were statistical outliers) during the coin-sorting task and were removed from the analysis for that dependent variable. No significant effect in mean speed was observed in the coin-sorting task. However, engagement in the coin-sorting task did result in larger standard deviation of speed, t(72) = 2.29, p < .05, and larger maximum lateral acceleration, t(68) = 3.47, p < .05 (Table 1). The CD selection task did not have a significant effect on the mean speed or the standard deviation of speed but did result in larger maximum lateral acceleration, t(68) = 3.48, p < .05). The radio-tuning tasks resulted in lower mean speed, t(72) = −2.23, p < .05; larger standard deviation of speed, t(72) = 2.86, p < .05; and larger maximum lateral acceleration, t(68) = 2.69, p < .05. The data for the standard deviation of speed and maximum lateral acceleration were relatively small quantities and were multiplied by a scalar quantity (1,000) in order to reduce the effects of rounding and make it easier for readers to interpret the results.
Parameter Estimates Used to Generate Prior Distributions From Nine Individual Repeated-Measures Linear Models From Study 1
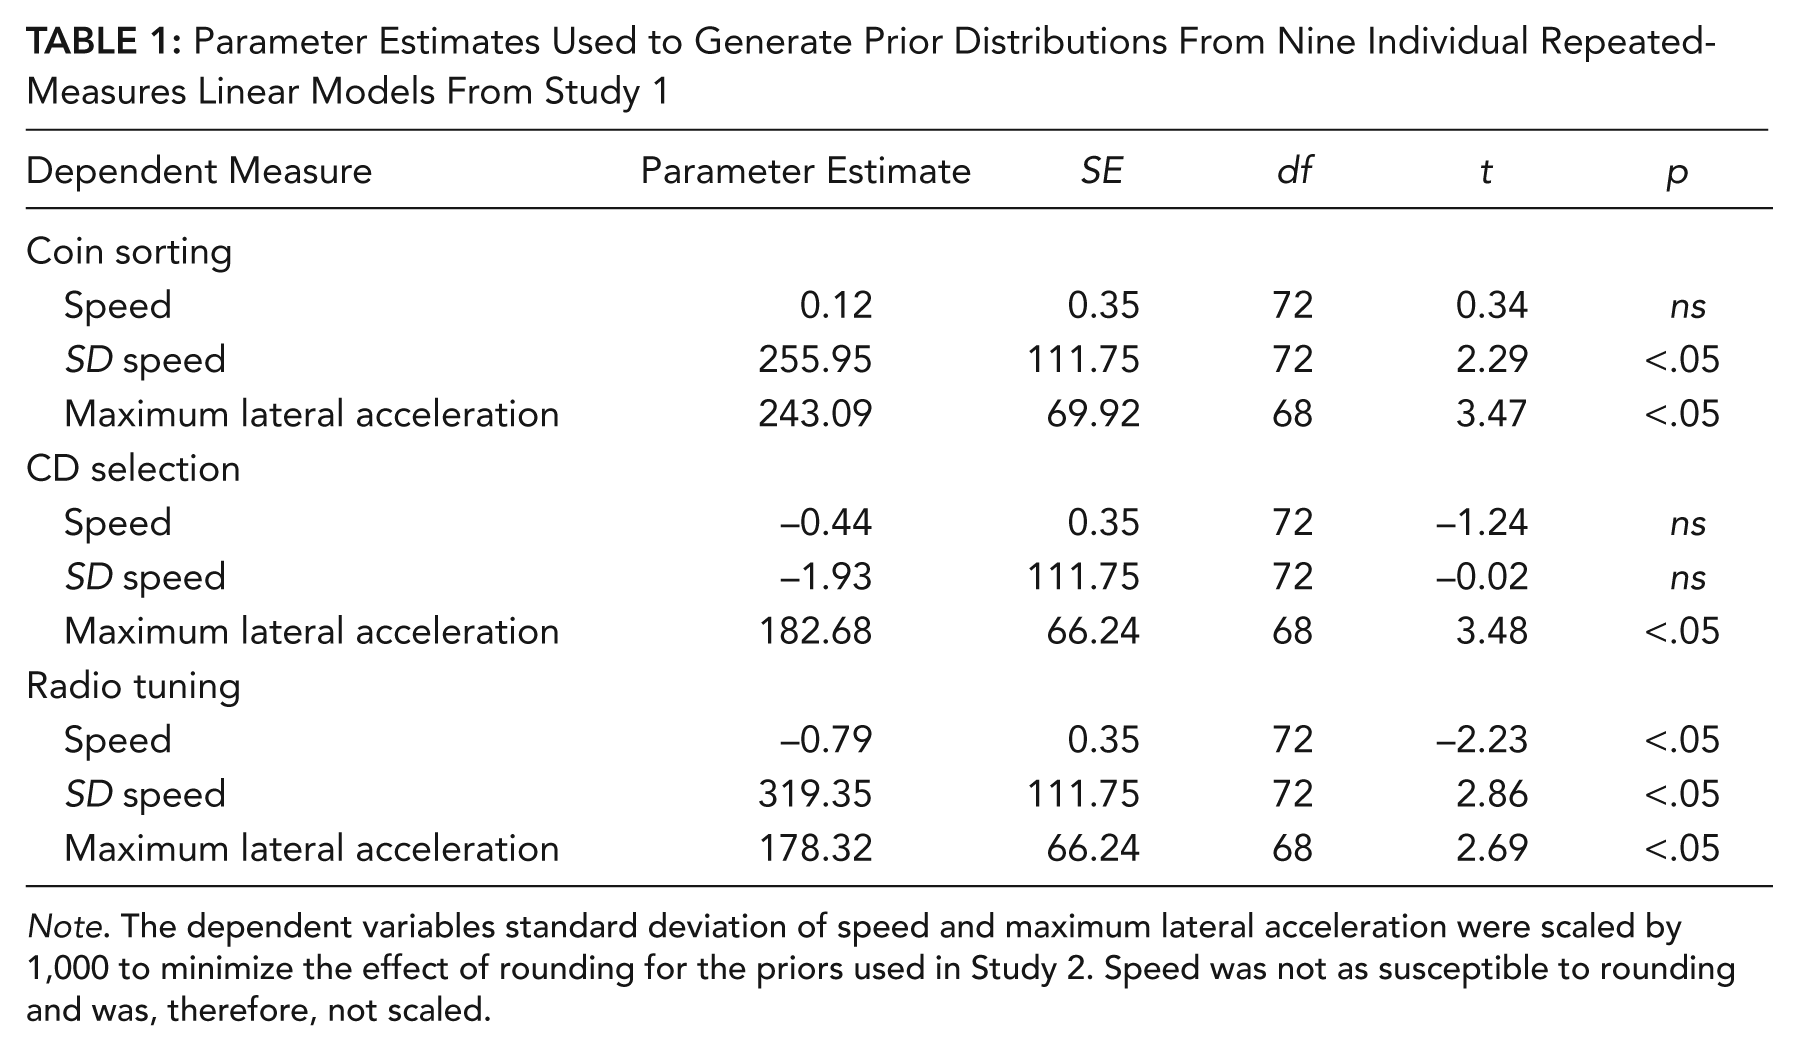
Note. The dependent variables standard deviation of speed and maximum lateral acceleration were scaled by 1,000 to minimize the effect of rounding for the priors used in Study 2. Speed was not as susceptible to rounding and was, therefore, not scaled.
Eye gaze measures
There were two participants whose eye data were not reduced due to occlusion from glasses and were therefore excluded from the analysis. There were significantly more glances toward the secondary tasks during the radio-tuning task (M = 7.32, SD = 3.26), t(46) = 5.27, p < .05, and the coin-sorting task (M = 8.72, SD = 5.79), t(46) = 4.00, p < .05, than during the CD selection task (M = 2.91, SD = 1.70) (see Table 2). Both the coin-sorting (M = 1.74, SD = 0.60), t(46) = 4.70, p < .05, and the radio-tuning task (M = 1.70 s, SD = 0.53), t(46) = 4.45, p < .05, resulted in longer glances to the secondary task than did the CD-selection task (M = 1.09 s, SD = 0.32). The radio-tuning task required that the participants spend a higher percentage of time looking at the secondary task than did the CD selection task, t(46) = 5.46, p < .05. The percentage of time that the participants glanced away from the road during the coin-sorting task did not significantly differ from that during the CD selection task.
Parameter Estimates for the Models Predicting the Eye Gaze–Related Dependent Variables

Note. Each task is compared to the CD selection task, which is used as the baseline task.
The results of this first study demonstrate that these simple tasks significantly impact driving performance and that there are differences in the eye gaze behavior among these tasks. The parameter estimates generated from the analysis of this experiment are used to generate informative prior distributions for use in the Bayesian analysis of the second experiment.
Experiment 2: On-Road Study Involving TBI and Non-TBI Drivers
The second experiment was an on-road study involving both TBI and HC drivers completing the same secondary tasks as the first experiment.
Participants
A total of 39 individuals participated in the study. Three participants were excluded from the study; one was unable to complete the secondary task, one participant encountered rain, and one experienced extraneous events during the baseline driving segment (i.e., festival parade in the other lane). The final sample for the analysis included 16 TBI drivers and 19 HC drivers.
All participants were required to have a valid driver’s license for at least 1 year prior to participating in the study; for TBI participants, this requirement had to include driving experience prior to injury. In addition, participants could not have a past history of reckless driving, have a suspended license, or be an expert or professional driver (e.g., truck driver or cab driver). Drivers who required adaptive driving control (e.g., steering wheel knob, adaptive mirrors, hand controls) were excluded from the study, as the instrumented vehicle did not have these modifications.
The 16 TBI participants were community-dwelling adults recruited through rehabilitation facilities in the Philadelphia metro area and from a database of individuals who had previously participated in other research studies. The TBI sample includes 11 males and five females, with 14 right-handed individuals and a mean of 38.6 years of age. Brain injury was defined as a result of trauma or stroke. Injury information was obtained by participant self-report, informant report where applicable, and medical records whenever possible. We used Veteran Affairs/Department of Defense guidelines for characterizing injury severity (Tanielian & Jaycox, 2008). One of the participants was classified as having sustained a mild TBI defined by (a) an initial loss of consciousness (LOC) of zero to 30 min, (b) an initial Glasgow Coma Scale (GCS) score between 13 and 15, and/or (c) post-traumatic amnesia (PTA) lasting from zero to 24 hr. Three of the participants were classified as having sustained a moderate TBI defined by (a) LOC >30 min and less than 24 hr, (b) an initial GCS of 9 to 12, and/or (c) PTA lasting longer than 24 hr but less than 7 days. Nine participants were classified as having sustained a severe TBI defined as (a) LOC for more than 24 hr, (b) an initial GCS score between 3 and 8, and/or (c) PTA lasting longer than 7 days.
One participant sustained injury as a result of aneurysm and another as a result of a tumor resection. The mean interval between onset of TBI and time of testing was 12.67 years (SD = 9.29, range = 5–23 years). There was no significant difference between the mean ages of the TBI participants (M = 37.5 years, SD = 11.4) and the HC participants (M = 38.7 years, SD = 12.4). Additional exclusionary criteria included history of strokes or seizures, having experienced more than one brain injury or other substantial neurological history, a history of psychiatric or substance abuse, or taking medication with sedating effects at the time of study.
Study Design and Procedure
The data used in this analysis were collected as part of a larger study that involved individuals with TBIs and HCs driving in an instrumented vehicle (Manning et al., 2009; Schultheis et al., 2012). The participants completed the same secondary tasks that were examined in the first experiment (i.e., CD selection, coin-sorting, and radio-tuning tasks) with two minor changes. The starting and target points for the radio station task were based on the stations available in the locale, and only one monetary value was used for the coin-sorting task ($0.65).
As part of the larger study, participants drove an on-road course in suburban Pennsylvania with a certified driving evaluator who sat in the front passenger seat of the vehicle. A separate researcher sat in the back seat, directly behind the driver. For safety reasons, the driving evaluator had the ability to take control of the vehicle if necessary (through either the steering wheel or a secondary brake on the passenger side). Throughout the drive, verbal driving instructions were provided to the participants, including when to make turns and when to start a specific secondary task. Each participant drove the set course twice; the first lap was to generate baseline measures and establish driving safety, and the second was for assessing driving performance during the secondary tasks. The tasks (CD selection, radio-tuning, and coin-sorting tasks) were conducted in a counterbalanced order across three predefined straight segments of rural roads with a speed limit of 40 mph (64 km/h). For comparison, baseline driving segments were selected from the first lap of the course by matching the exact beginning and starting points of the same straight road segments using GPS coordinates. The driving evaluator was blinded to participant group (TBI vs. HC), so each participant was evaluated consistently prior to engagement in any secondary task. The participants were compensated US$40 for their time during this part of the study (with US$120 for the whole study). The Office of Regulatory Compliance at Drexel University approved the study.
Equipment
The instrumented vehicle used in this study was a 2002 Ford Taurus and included seven cameras and sensors that collected information on brake and accelerator pedal forces, the vehicle’s longitudinal and lateral acceleration, steering wheel angle, GPS position, and the vehicle speed. Video data included a forward view, face view, foot view, two over-the-shoulder forward views (left and right), and two pavement-marking views (from both side mirrors outside of the vehicle). All performance and video data were collected at 5 Hz.
Data Analysis
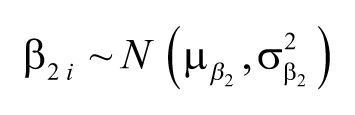
As noted earlier, Bayesian methods allow for the formal inclusion of prior beliefs, expert opinions, and past study results even though differences may exist in the apparatus, population, and protocols. Specifically, in this study, the prior distribution on the task parameters were assumed normal and distributed according to the mean of the effect estimate
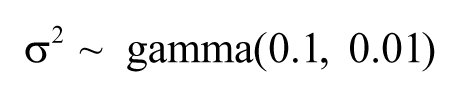
The prior distribution on the TBI parameter was assumed normal and uninformative (i.e., one that has a large variance and a mean of zero). Both the uninformative prior distribution for the TBI parameter and the informative prior for the task parameter were constructed as normal distributions, because when the data are assumed normal, the conjugate prior is also a normal distribution. The variance of yij, σ was assumed to be an uninformative gamma distribution, typically used for a variance parameter of a normal distribution. We used a Bayesian repeated-measures linear model with parameters β1 and β2 (as shown in Equation 2), which correspond to the two independent variables: the secondary task j (engaged in task or baseline driving) and the driver group i (TBI or HC driver).


The analysis was conducted using Windows Bayesian inference using Gibbs sampling (WinBUGS; Lunn, Thomas, Best, & Spiegelhalter, 2000), which uses Monte Carlo Markov chains (MCMC) methods (specifically the Gibbs sampling algorithm) to estimate posterior distributions for Bayesian models. For each model, three MCMCs of 100,000 iterations were run, the first 10,000 of which were discarded to ensure that the MCMCs had converged. Convergence was determined based on the Brooks-Gelman-Rubin plots (Brooks & Gelman, 1998) and history plots. History plots show the estimated value of the model parameters for the MCMC iterations. Statistical significance was determined using the posterior predicative probability as calculated using the step function within WinBUGS.
Results
Descriptive statistics
The HC and TBI groups did not significantly differ in the number of days they reported driving each week, with the HCs reporting driving 3.5 days per week (SD = 2.7) and the TBI drivers reporting driving 4.8 days per week (SD = 2.9), t(28.79) = −1.35, ns. As indicated by the reported number of miles driven during the last trip, driving exposure did not differ between the TBI and the HC drivers. Of the TBI drivers, 35.2% reported attending driver training following their injury. Changes in driving habits following their injury were reported by 41.2% of the TBI participants. Cognitive impairments following a TBI were reported by 58.8% of the TBI participants. The mean standardized scores based on several neuropsychological tests (i.e., Trail Making A and B, Stroop, Symbol Digit Modalities, Digit Span, Rey Complex Figure Copy Score, and Block Design from the Wechsler Abbreviated Intelligence Scale) were used to compute a global cognitive score for each participant. There was not a significant difference between the cognitive ability of the healthy controls (M = 48.6, SD = 5.16) and the TBI group (M = 44.5, SD = 11.8), z = −1.32, ns.
Task comparisons between groups
The TBI group took 45.4 s (SD = 21.0) and the HC group took 34.1 s (SD = 10.5) to complete the coin-sorting task. For the CD selection task, the TBI group took 23.0 s (SD = 7.5) and the HC group took 19.8 s (SD = 6.1) to complete. The TBI group took 34.0 s (SD = 12.6) and the HC group took 30.0 s (SD = 12.7) to complete the radio-tuning task. Across all tasks, there were no significant differences in time between the TBI group and the HC group to complete the secondary tasks. The mean and standard deviation for each of the driving performance measures collected in Experiment 2 are shown in Table 3 for the task and the associated baseline driving intervals for both the TBI and HC groups.
Summary Statistics of the Driving Performance Measures From Experiment 2 for Each Driver Group, Task, and Corresponding Baseline

Note. Means shown with standard deviations in parentheses. TBI = traumatic brain injury; HC = healthy control.
Coin-sorting task
The Bayesian repeated-measures linear models (Table 4) for the coin-sorting task showed no significant interactions, and as such, they were not included in the forthcoming analysis. There were no significant differences between the mean speed maintained by the TBI group and the HCs. However, the mean speed was generally higher in the baseline drive (M = 39.6 mph, or 63.7 km/h) than during the coin-sorting task (M = 38.2 mph, or 61.5 km/h). There was a significantly higher standard deviation of speed in the coin-sorting task when compared to the baseline drive, but no differences in standard deviation of speed were observed between driver groups. There were also significant differences with respect to the maximum lateral acceleration between the task and the baseline drive, with greater lateral acceleration during the coin-sorting task. Figure 2 compares the model parameters estimated (and 95% credible sets) for the Bayesian models using the prior distributions from Experiment 1 to the parameters estimated (and 95% confidence intervals) for the frequentist models, which used only data from Experiment 2. If the interval associated with a parameter estimate contains zero, then that parameter estimate is not significant. Because the intervals for the Bayesian and the frequentist models overlap for each parameter, there is relative consistency in the outcomes. The posterior credible set does, in fact, depend on the specification of the prior distribution. With some specific prior distribution, the same interval as the frequentist confidence intervals could be produced. For the mean speed (Figure 2A), the Bayesian parameter estimate for the task variable and the intercept are significantly different from zero, but the TBI group parameter includes zero and is not significant (Table 4).
The Parameter Estimates for the Repeated-Measures Bayesian Model Predicting Driving Performance Measures While Engaged in the Coin-Sorting Task

Note. CS = credible set; TBI = traumatic brain injury; HC = healthy control.
Significant with posterior predictive probability >.95.
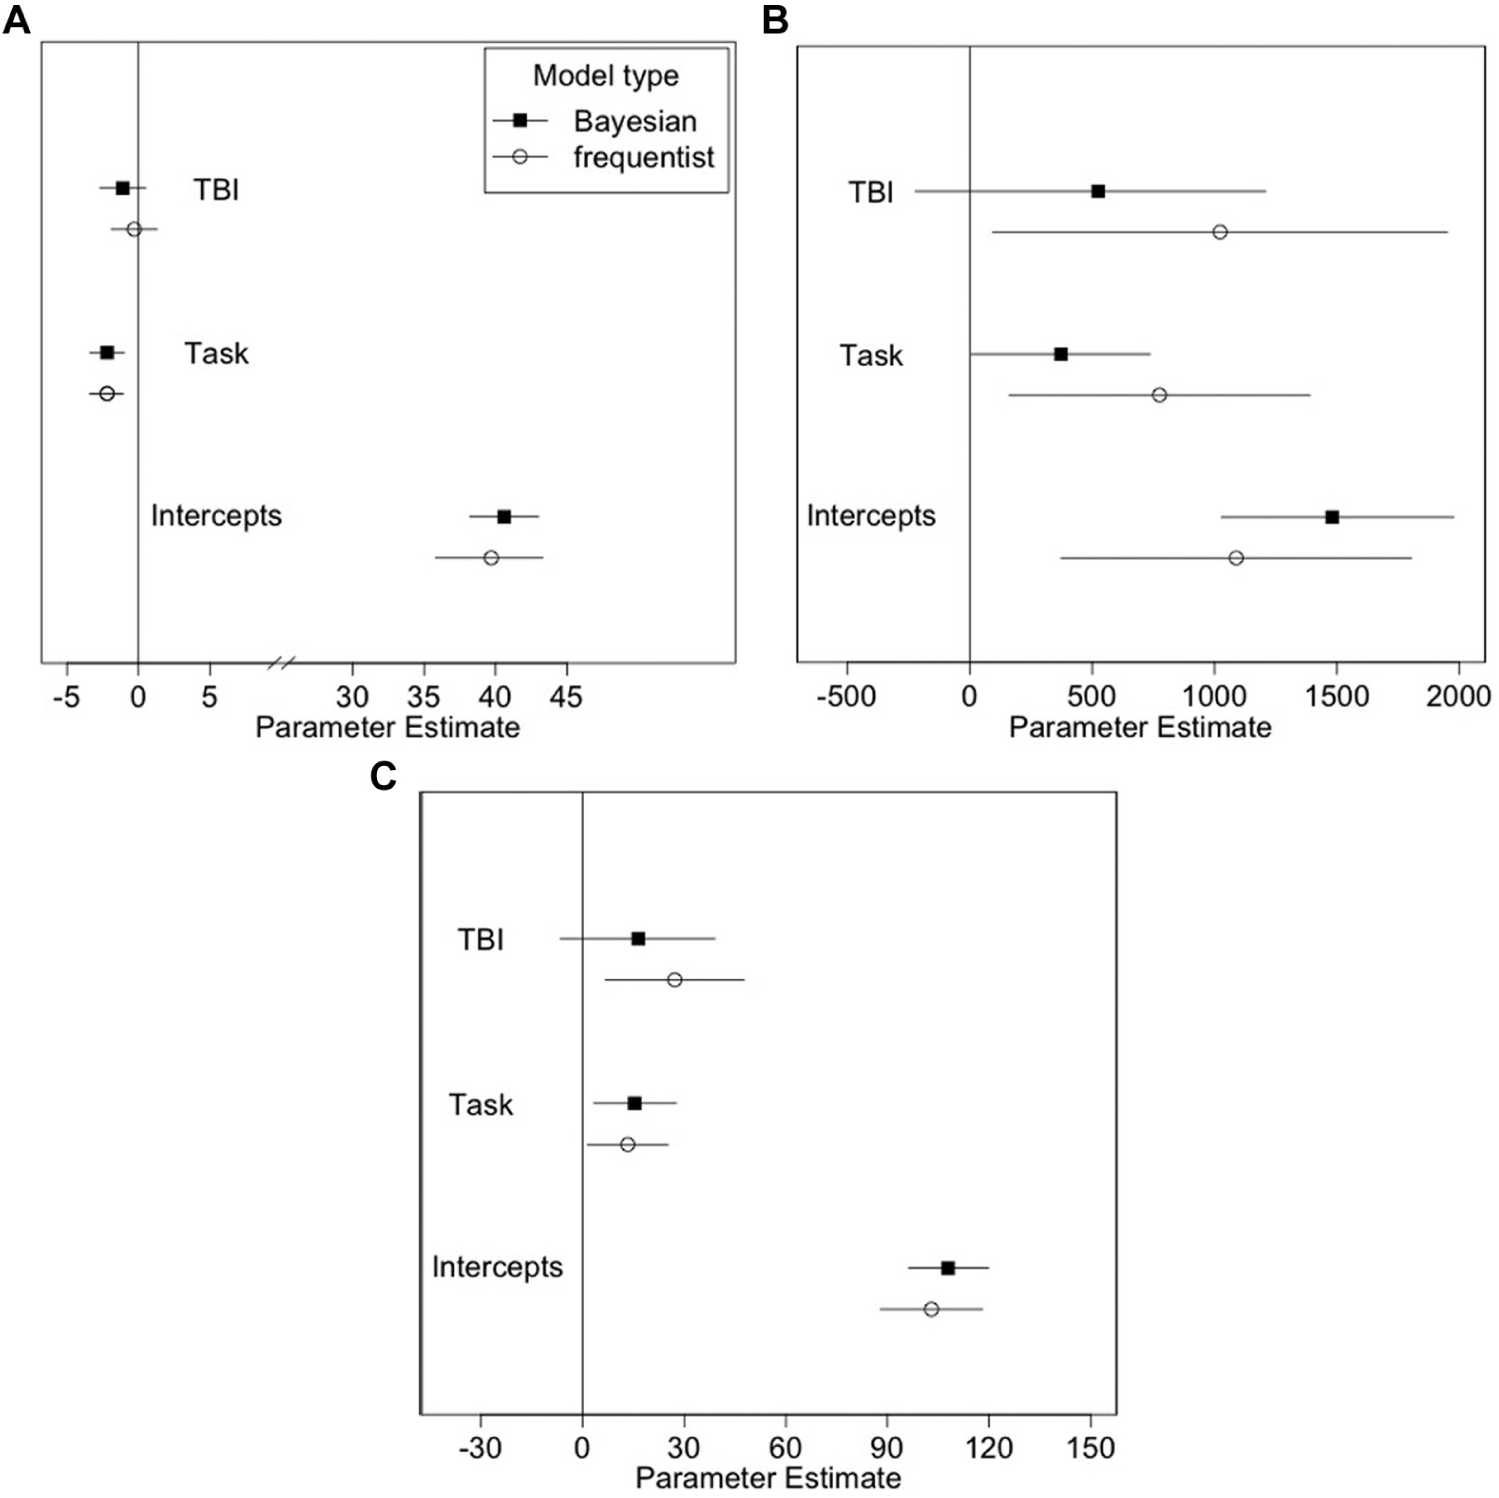
Comparing the parameter estimates and 95% credible sets for the Bayesian and the parameter estimates for the frequentist model with 95% confidence intervals predicting the (A) mean speed, (B) standard deviation of speed, and (C) maximum lateral acceleration while engaged in the coin-sorting task.
Radio-tuning task
The standard deviation of speed was significantly larger for drivers engaged in the radio-tuning task when compared to the baseline (see Table 5). Figure 3 shows the parameter estimates for models predicting the standard deviation of speed during the radio-tuning task for both the Bayesian model with the prior distributions from Experiment 1 and a frequentist model using just the data collected in Experiment 2. Incorporating the prior information tightened the intervals for parameter estimate (the credible sets) for the Bayesian model of the standard deviation of speed (see Figure 3). That is, the parameter estimate for the task is significant when we incorporate the prior distributions, but a significant effect was not observed in the frequentist model. No other significant main effects or interactions were observed for the mean speed or the maximum lateral acceleration for the task or baseline or between the TBI and HC groups.
Parameter Estimates for the Repeated-Measures Bayesian Model Predicting Driving Performance Measures While Engaged in the Radio-Tuning Task
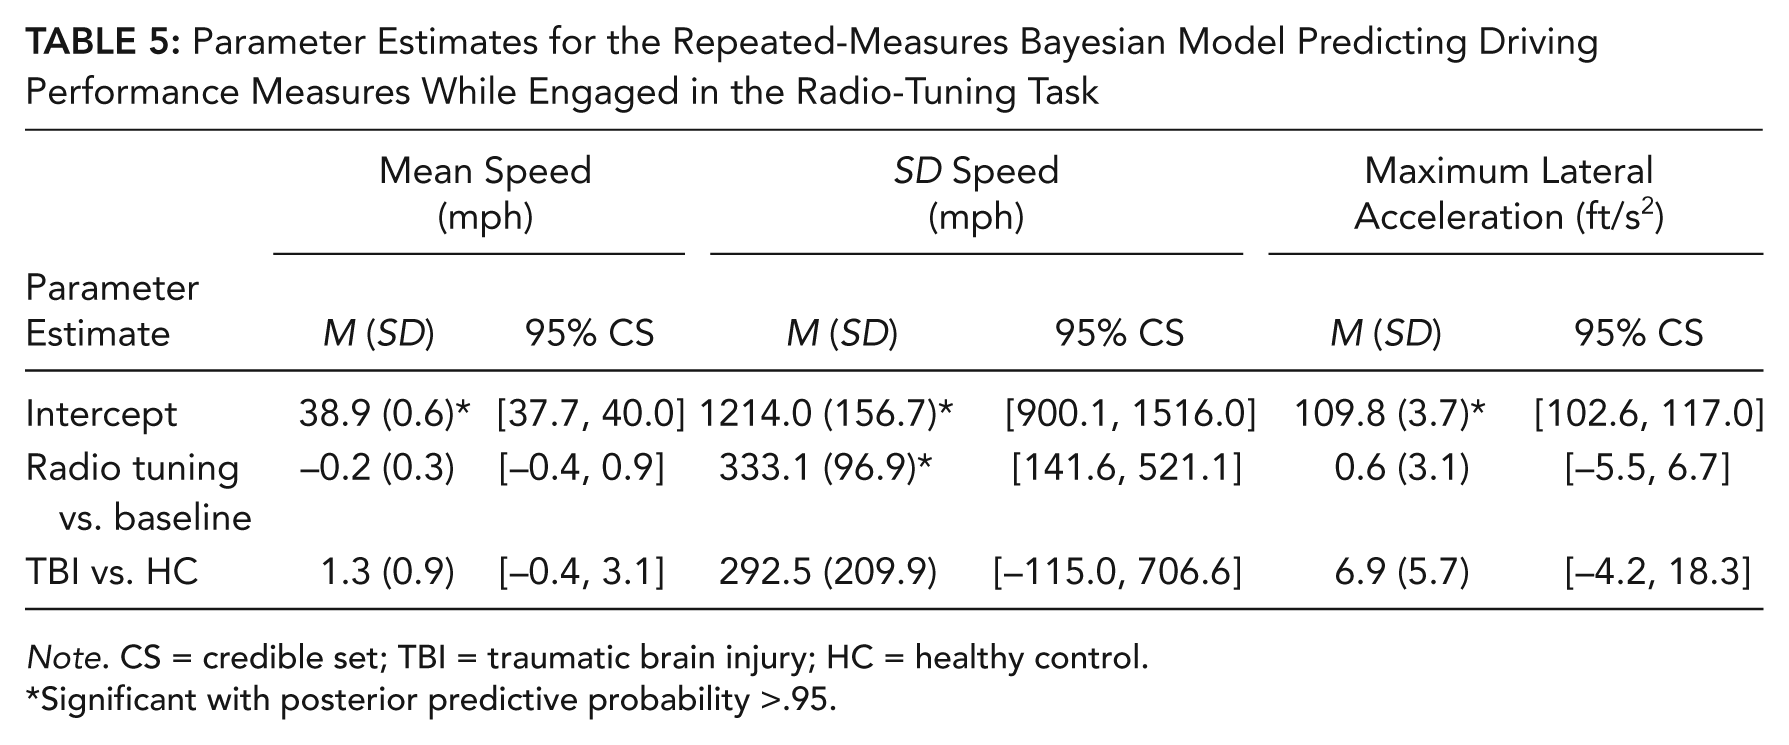
Note. CS = credible set; TBI = traumatic brain injury; HC = healthy control.
Significant with posterior predictive probability >.95.
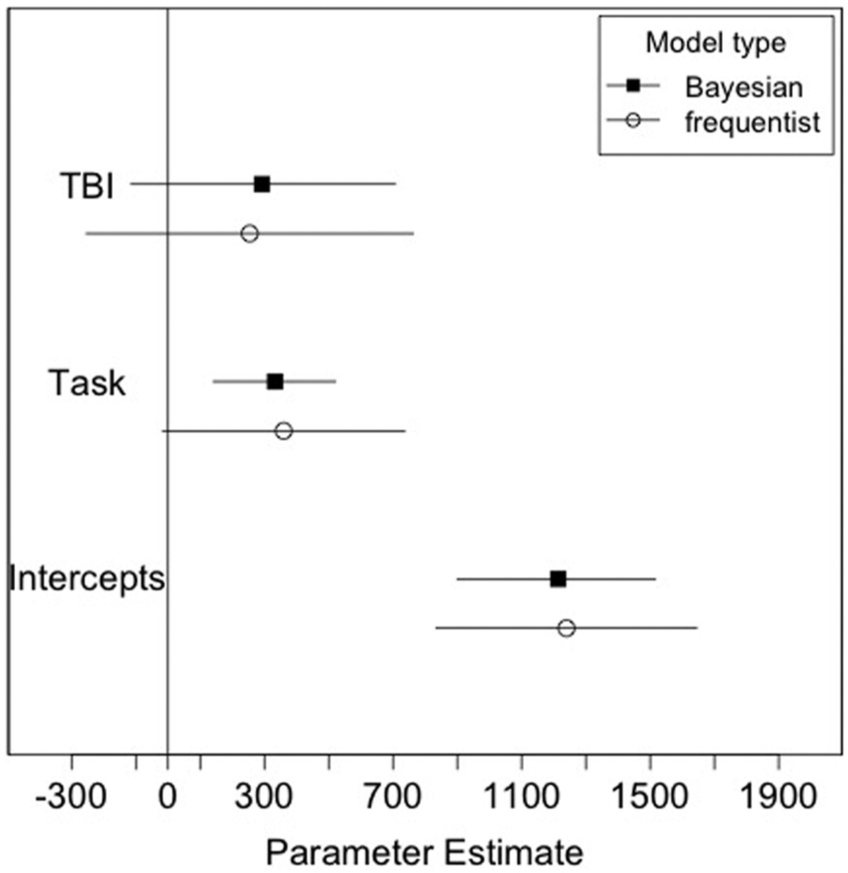
Model comparison between frequentist model estimates (with 95% confidence interval) and the Bayesian model estimates (with 95% credible set) predicting the standard deviation of speed during the radio-tuning task in Table 4.
CD selection task
There were no significant effects of the engagement in the CD-selecting task on the mean speed, the standard deviation of speed, or the maximum lateral acceleration. There were also no significant differences between the groups for any of the dependent variables, and the models are therefore omitted. This finding was observed for both the Bayesian and the frequentist approach.
Eye gaze behavior
Descriptive statistics for the percentage of time looking at the task, the number of glances, and the duration of the longest glance for each task and group are provided in Table 6. Across all tasks, all of the participants spent longer looking at the coin tasks, with more frequent glances and longer mean glance durations. The TBI drivers had an average longest duration glance toward the task of 2.21 s (SD = 1.17) during the coin-sorting task. The Bayesian parameter estimates for the percentage of time looking at the task, the number of glances, and duration of the longest glance to the secondary tasks are provided in Table 7. The CD selection task is used as the baseline task condition because there were no differences detected in the driving performance measures between engagement in this task and the baseline segment. The percentage of time looking at secondary tasks was significantly greater for the radio-tuning task than for the coin-sorting or the CD selection task. Across all secondary tasks, TBI drivers also spent a significantly longer time looking at the tasks compared to the HC drivers. The number of glances significantly differed between all three secondary tasks, with the coin-sorting task and the radio-tuning task having more glances to the task than the CD selection task. TBI drivers also consistently had more glances to the secondary tasks compared to the HCs. The duration of the longest glance to the radio-tuning task was significantly longer than the longest duration for the CD selection task. There was no difference between the duration of the longest glance during the CD selection task and that during the coin-sorting task. Additionally, there were no significant differences between the TBI drivers and the HC drivers for the duration of the longest glance to the secondary tasks. No interactions were significant between the main effects in these three models.
Descriptive Statistics of the Eye Glance Behavior–Related Dependent Measures During the Tasks for Both the TBI and HC Groups From Experiment 2
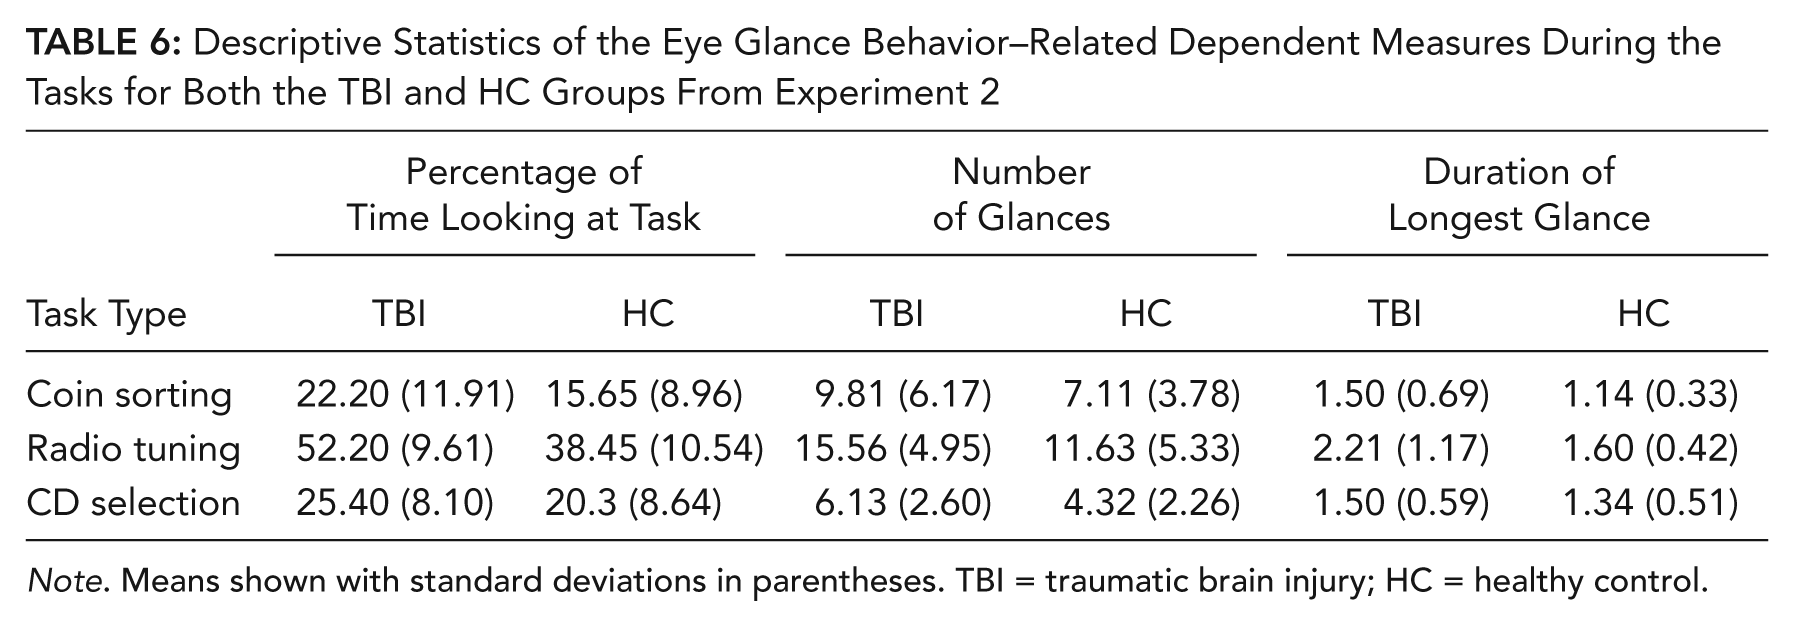
Note. Means shown with standard deviations in parentheses. TBI = traumatic brain injury; HC = healthy control.
Parameter Estimates for the Prediction of Eye Gaze Measures, Using Repeated-Measures Bayesian Model
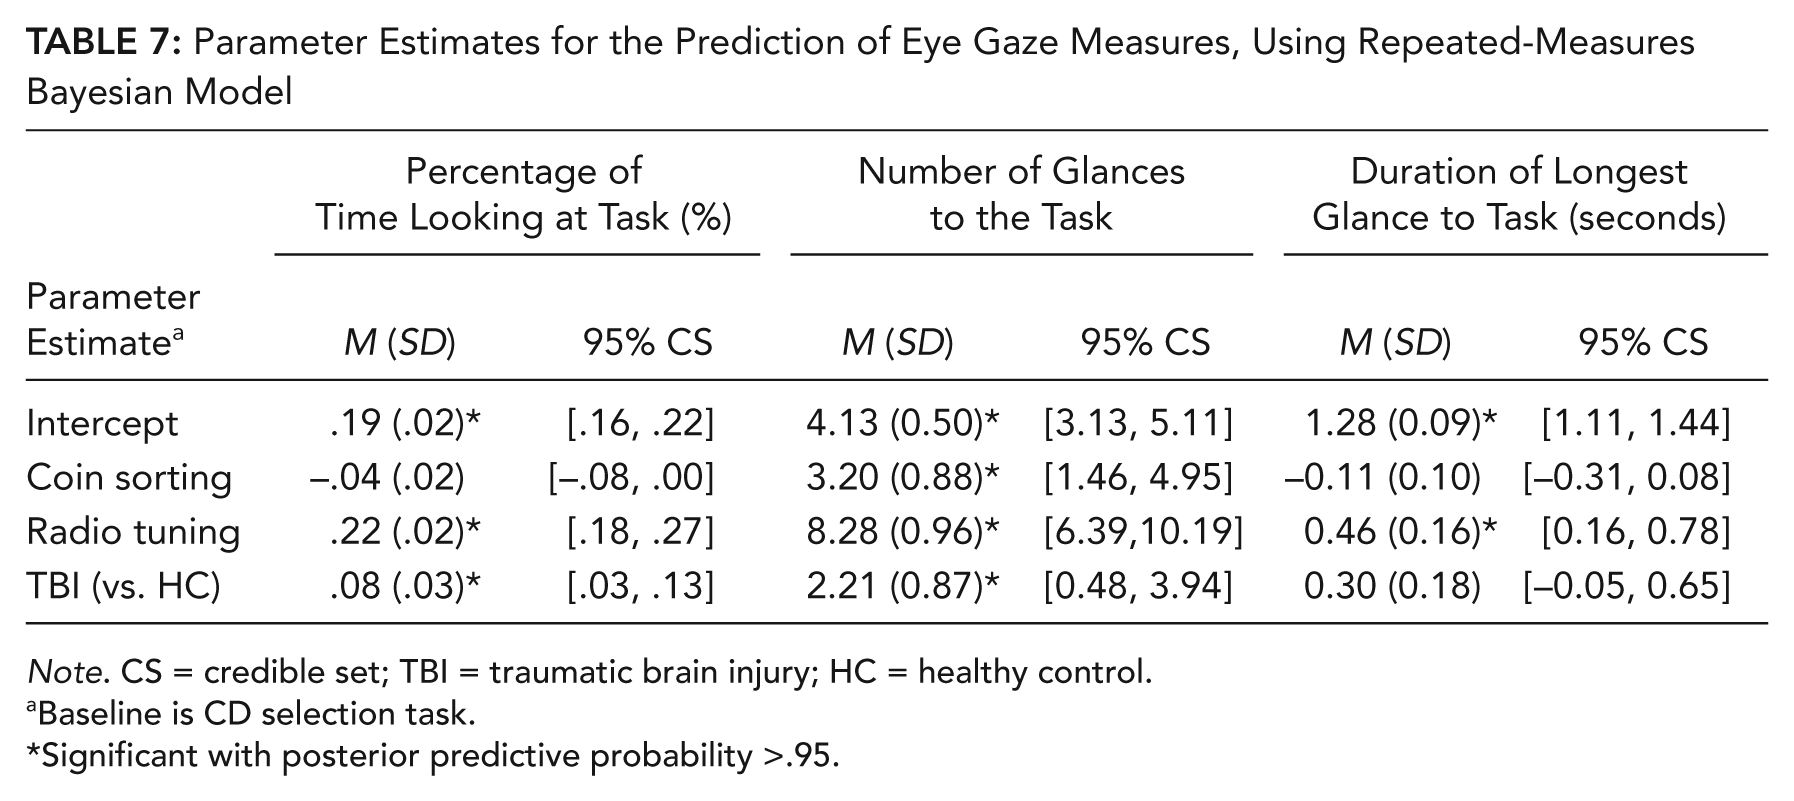
Note. CS = credible set; TBI = traumatic brain injury; HC = healthy control.
Baseline is CD selection task.
Significant with posterior predictive probability >.95.
Discussion
In the second experiment, an on-road study was used to examine differences in driving performance among driver groups and secondary-task engagement. There was a significant difference in the maximum lateral acceleration between the coin-sorting task and the baseline for all drivers. The coin-sorting and radio-tuning tasks also resulted in larger standard deviation of speed when compared to the baseline drive for all participants. The coin-sorting task also resulted in a lower mean speed than the baseline.
There were no significant differences in driving performance measures between the TBI and HC groups for any of the tasks. However, TBI drivers did spend a longer duration looking at the secondary task than did the HC drivers. TBI drivers also had more frequent glances toward the secondary tasks than did the HC drivers, which may be associated with deficits in cognition and information processing among people with TBIs (Mathias & Wheaton, 2007; Park, Moscovitch, & Robertson, 1999). TBI drivers may take longer to gather visual information from secondary tasks that compete with other resources needed for driving. This demand for increased resources may be further compromised in a cognitively impaired population, like people with a TBI. There were significant differences in the percentage of time looking at the task and in the number of glances between the CD selection and coin-sorting tasks and between the CD selection and radio-tuning tasks across all participants. However, there were no differences between the coin-sorting and the CD selection task in terms of percentage of time looking at the task and the duration of the longest glance.
General Discussion
We examined the impact of secondary tasks on driving performance between individuals with a TBI and HCs. The insights gained from healthy drivers in a simulator study were used to improve the estimated effects for a clinical population using Bayesian statistical methods. This approach is particularly useful for determining the distributions of parameter estimates that also account for knowledge and data from other studies or sources. Given the constraints with on-road data collection on TBI drivers, employing Bayesian statistics helps address some of the common limitation in clinical on-road studies.
The study of a clinical population in the real world limits our ability to assess some of the more risky distracting tasks. For example, it was not possible to include cell phone–based tasks because of the associated risks and also because they are illegal in several areas of the Philadelphia metro area (where the on-road study took place). More demanding secondary tasks (e.g., texting, interacting with navigation systems, complex cognitive distractions, or other examples of current or future technology usage) may have revealed other performance decrements in addition to differences among the driver groups. In this study, no differences were detected in the driving performance between the TBI and healthy drivers. The TBI population included in this study was relatively healthy (with mild TBI). However, there were differences between the groups with respect to the duration and frequency of glances toward the secondary tasks even though these tasks tend to be considered less risky and more socially acceptable distractions (Bayly et al., 2009).
The additional information from the prior distributions improves the confidence with which we can estimate parameter estimates. The intervals for the parameter estimates for the coin-sorting and radio-tuning tasks (Figures 2 and 3, respectively) do overlap between the frequentist and Bayesian models. This finding indicates that the models are not significantly different and are not overly influenced by the inclusion of the prior distributions. However, the intervals for the estimates with prior information tend to be tighter than with the frequentist models for the parameters with prior information (Figures 2 and 3). Using the prior distribution in a Bayesian model mitigates Type I error rates (Kruschke, 2011), which may be a concern for studies with smaller sample sizes. Additionally, a Bayesian approach can provide more credibility for not rejecting the null hypothesis (Rouder, Speckman, Sun, & Morey, 2009). The Bayesian approach is therefore well suited for studies in which prior distributions can help account for probabilities for otherwise unknown parameters.
There are concerns in the literature about the inferences that can be drawn from posterior distributions based on specified prior distributions (Greenhouse & Seltman, 2005). There are many sources of information that can be used for prior distributions, including expert opinions, existing data, and previous studies. In the current study, prior distributions were generated from data in a simulator and were then included in the analysis from an instrumented vehicle study. We have inflated the variances of the prior distribution from the simulator (that is, discounted the prior information) to include the information from the simulator in the analysis of the instrumented-vehicle study without assuming that they are exchangeable (Greenhouse & Seltman, 2005).
We recognize that there are several limitations to our study approach. The TBI and HC drivers reported driving between 3 and 5 days per week, and this frequency may be consistent with individuals living in relatively urban areas, but there may be different factors associated with more or less frequent drivers. There was also an inherent order effect since the baseline segment for each task always occurred prior to the task segment (30 min prior). But this order was necessary for the driving evaluator to determine if it was safe for the participants to even engage in the secondary tasks while driving. In fact, one participant (who was excluded from this analysis) was not able to successfully complete the tasks. It was also necessary to select secondary tasks that did not result in substantial increases in risk for clinical populations in an on-road study. Recruiting individuals with TBIs can be challenging, and those who participated in the study generally exhibited only minor cognitive difficulties. Those with severe TBIs either may not be active drivers (thus do not qualify for this study) or may be unwilling to participate due to the fear that their performance will be evaluated (or of negative impact on their driving status).
Another limitation associated with this study was the use of only three driving performance measures. Whereas other studies typically use several variables associated with driving performance, it was necessary to select variables that were consistent between the driving simulator and the on-road study and were available on both study apparatuses. In several circumstances, there were large but insignificant parameter effects that may demonstrate large variability in performance of the driving or secondary tasks within the groups, which suggests subgroups based on performance.
Previous studies on cognitively impaired drivers (e.g., those with Parkinson’s disease) show that clinical patients commit more driving errors during a distracting task than HC drivers using complex distracting tasks, such as a paced auditory serial additional test (Uc et al., 2006). The findings of our study suggest that even simple and minimal-risk secondary tasks impact engagement even though no differences in performance are detected between TBI and HC drivers. We extend the previous work on TBI drivers and distracting tasks (e.g., Cyr et al., 2008; Lengenfelder, et al., 2002) by considering several measures of driving performance and task engagement during secondary tasks. As noted earlier, the radio-tuning task used in our study is considered a benchmark task (NHTSA, 2012), but our study showed that this task as well as the coin-sorting task resulted in more frequent glances toward the secondary task. Hence, for drivers with TBI, these tasks may not be reasonable baseline tasks.
The clinical impact of these differences should be explored in future studies. The current study was restricted to those who maintained a license and were relatively healthy. However, an evaluation of fitness to drive could be conducted in a controlled setting with more diverse drivers in terms of cognitive abilities. Additionally, as the glances toward the secondary tasks suggest that there may be different strategies to engage and modulate between the secondary tasks and driving, future research should investigate if these differences in engagement hold for secondary tasks with stronger face validity (e.g., cell phone and other in-vehicle technology tasks). More demanding distracting tasks (e.g., texting) may have a larger disproportionate impact on TBI drivers than on HC drivers, especially if those drivers with more severe TBIs are considered.
Key Points
A Bayesian analysis was conducted to evaluate the effect of distracting tasks (CD selecting, radio tuning, and coin selecting) on the driving performance of traumatic brain injury (TBI) and non-TBI drivers in an instrumented vehicle study.
TBI drivers exhibited worse driving performance in terms of speed variability and when distracted in a coin-sorting task compared to non-TBI drivers.
Across all tasks, TBI drivers made more glances and spent more time looking at the tasks than did non-TBI drivers.
Footnotes
Acknowledgements
This work was partially supported by Grant No. 1R01HD050718-01A2 from the National Institute of Child Health and Human Development (NIH). The results and opinions expressed in this paper are those of the authors and do not necessarily reflect the views of NIH. The authors would like to acknowledge Carrie Monagle, the occupational therapist who conducted the data collection for the on-road study; Kevin Manning and Jocelyn Ang for collecting the on-road data; Cher Carney for reducing the video data; Joel Greenhouse for reviewing the statistical content; and three anonymous reviewers for their thoughtful comments.
David M. Neyens is an assistant professor of industrial engineering at Clemson University. He received his PhD in industrial engineering from the University of Iowa in 2010.
Linda Ng Boyle is a professor of industrial & systems engineering and civil & environmental engineering at the University of Washington. She received her PhD in civil engineering in 1998 from the University of Washington.
Maria T. Schultheis is an associate professor in the Department of Psychology and Biomedical Engineering at Drexel University. She received her PhD in clinical psychology in 1998 from Drexel University.