
Abstract
Objective:
Two experiments were conducted to determine whether detection of the onset of a lead car’s deceleration and judgments of its time to contact (TTC) were affected by the presence of vehicles in lanes adjacent to the lead car.
Background:
In a previous study, TTC judgments of an approaching object by a stationary observer were influenced by an adjacent task-irrelevant approaching object. The implication is that vehicles in lanes adjacent to a lead car could influence a driver’s ability to detect the lead car’s deceleration and to make judgments of its TTC.
Method:
Displays simulated car-following scenes in which two vehicles in adjacent lanes were either present or absent. Participants were instructed to respond as soon as the lead car decelerated (Experiment 1) or when they thought their car would hit the decelerating lead car (Experiment 2).
Results:
The presence of adjacent vehicles did not affect response time to detect deceleration of a lead car but did affect the signal detection theory measure of sensitivity d′ and the number of missed deceleration events. Judgments of the lead car’s TTC were shorter when adjacent vehicles were present and decelerated early than when adjacent vehicles were absent.
Conclusion:
The presence of vehicles in nearby lanes can affect a driver’s ability to detect a lead car’s deceleration and to make subsequent judgments of its TTC.
Application:
Results suggest that nearby traffic can affect a driver’s ability to accurately judge a lead car’s motion in situations that pose risk for rear-end collisions.
Introduction
In 2012, rear-end collisions represented 48.39% of crashes with other moving vehicles (National Highway Traffic Safety Administration, 2012). An important factor in such accidents is a driver’s ability to detect the deceleration of the car ahead (the lead car) early enough to apply the brakes (Lamble, Laakso, & Summala, 1999; Lee, 1976). Information that drivers potentially use to detect deceleration (other than brake lights) includes the lead car’s optical expansion pattern, that is, the increase in the visual angle subtended at the driver’s eye by the car being approached (DeLucia & Tharanathan, 2009; Lamble et al., 1999). When the optical expansion rate of a vehicle exceeds a threshold value, between 0.003 and 0.006 radians per second (rad/s), a driver putatively can determine that the relative velocity of the lead vehicle has changed and that it is getting closer (Hoffman & Mortimer, 1996; Muttart, Messerschmidt, & Gillen, 2005).
After detecting the lead car’s deceleration, a driver must apply the brakes according to the perceived urgency of the situation and presumably does so by estimating the time remaining until a collision would occur, that is, the time to contact (TTC; Lee, 1976). It has been suggested that TTC judgments and braking responses are based on the optical TTC information of tau, defined by an object’s instantaneous ratio of optical size to optical expansion rate (Lee, 1976; Li & Milgram, 2004; van Winsum & Heino, 1996). Tau is an elegant model of TTC perception because it provides accurate TTC information (assuming certain conditions are met) without requiring perceptual judgments of speed or distance (Lee, 1976; Lee & Young, 1985).
Previous studies suggest that observers use tau in a variety of tasks (e.g., Schiff & Oldak, 1990; Todd, 1981). However, increasing evidence indicates that other sources of information also can affect TTC judgments, including heuristics, such as optical size, expansion rate, and image velocity (e.g., DeLucia, 1991, 2004, 2008; DeLucia, Preddy, & Oberfeld, 2015; Kerzel, Hecht, & Kim, 1999; Levulis, DeLucia, & Jupe, 2015). Moreover, TTC judgments also are affected by limits in cognitive processing, such as memory and attention (Baurès, Oberfeld, & Hecht, 2010, 2011; DeLucia, 1991; DeLucia & Novak, 1997; Novak, 1998).
Authors of few studies examined whether TTC judgments are affected by the presence of additional moving objects, for example, vehicles in lanes adjacent to a lead car. Of particular relevance for the current study are the findings by Baurès, Oberfeld, Tournier, Hecht, and Cavallo (2014) and Oberfeld and Hecht (2008) that TTC judgments can be influenced by moving, task-irrelevant objects, that is, by objects that do not provide information germane to the task.
Baurès et al. (2014) used a driving simulator to position participants at a stop sign in front of a two-lane cross-street and asked them to make judgments about whether it was safe to cross the intersection in front of vehicles approaching from the leftward direction. Some scenes contained a single approaching vehicle, whereas others included an additional approaching vehicle in the adjacent lane. Only the first-arriving vehicle was relevant to the driver’s decision in the two-vehicle scenes. Nevertheless, participants were more likely to accept a gap when the second, irrelevant vehicle was present (compared with absent). The authors attributed their results to a perceptual averaging process in which participants based their responses on the average of the two approaching vehicles’ TTCs.
In Oberfeld and Hecht’s (2008) study, observers viewed computer simulations of an approaching target object (a vehicle or a geometric shape) and judged the target’s TTC when an approaching “distractor” object adjacent to the target was present or absent. Using a prediction motion task, observers judged when an approaching target would reach them after it disappeared from view. Distractor objects that arrived earlier than the target had the greatest effect on TTC judgments and led participants to underestimate the target’s actual TTC (compared to late-arriving distractors or none). These results have implications for driving: During car following, a driver’s detection of a lead car’s deceleration and judgment of its TTC may be affected by vehicles in nearby lanes, which may affect the driver’s ability to avoid rear-end collisions.
One limitation of Oberfeld and Hecht’s (2008) study was that the scenes simulated a stationary observer; only the approaching objects expanded optically. When drivers move through traffic environments, the entire visual field expands optically (Lee, 1976). Consequently, it is not clear whether the effect of distractors reported by Oberfeld and Hecht would generalize to real-world driving, that is, to self-motion conditions. Differences in perceptual judgments between conditions with and without self-motion have been demonstrated (Gould, Poulter, Helman, & Wann, 2013; Gray, Macuga, & Regan, 2004; Gray & Regan, 2000; but see DeLucia & Meyer, 1999). For example, responses to changes in the headway of a lead vehicle during self-motion were slower than responses to a simulated object during no self-motion (Probst, Krafczyk, & Brandt, 1987). In addition, TTC judgments of a simulated approaching object were 9% to 13% shorter during forward self-motion, compared with no self-motion (Gray & Regan, 2000). Moreover, the apparent speed of approaching and receding objects was affected by the presence of self-motion information (Gray et al., 2004). In light of these findings, it is important to determine whether Oberfeld and Hecht’s (2008) results generalize to self-motion conditions.
In the current study, car-following simulations were used to determine whether the presence of vehicles in lanes adjacent to a lead car affected a driver’s ability to detect the lead car’s deceleration (Experiment 1) and to judge the lead car’s TTC (Experiment 2). The lead car was presented alone or was accompanied by two adjacent vehicles. When present, the adjacent vehicles decelerated earlier than the lead car, decelerated concurrently with the lead car, or did not decelerate.
Possible Reasons for Effects of Adjacent Vehicles on Performance
We considered several reasons the adjacent vehicles would affect judgments of the lead car. First, the presence of the adjacent vehicles could influence the participant’s scanning of the scene and sensitivity to motion: The participant’s eyes could be drawn toward an adjacent vehicle, causing the lead car to fall at relatively greater retinal eccentricities than would occur when only the lead car is present. For example, our results from Experiment 1 indicated that the median headway at the moment the lead car began to decelerate was 199.81 ft (60.90 m). If participants were looking at the center of an adjacent vehicle at this time, the eccentricity of the lead car would be about 3° in scenes with concurrently and non-decelerating adjacent vehicles (and even greater during scenes with early-decelerating adjacent vehicles). At first glance, this may seem like a small eccentricity. However, Brown and Bowman (1987) demonstrated that detection threshold for changes in optical size increased rapidly (more than doubled) when eccentricity increased from just 0° to 4°. These authors noted the practical importance of eccentricity in driving, stating that vehicles (e.g., a lead car) falling even slightly eccentric to the fixation point (e.g., an adjacent car) must move at least twice as far to be detected compared to when they are located foveally.
The effect of eccentricity on visual perception is well established. For example, relatively greater eccentricities result in relatively higher thresholds for motion perception (Graham, 1965), longer time to detect motion, and slower apparent speeds (Tynan & Sekuler, 1982). Greater eccentricities also resulted in longer response times to a lead car’s braking—especially at relatively farther distances (Summala, Lamble, & Laakso, 1998)—and shorter TTC judgments (Li & Laurent, 2001; Manser & Hancock, 1996; Meyer, 2001; but see Stoffregen & Riccio, 1990). Accordingly, if participants in our study look at the adjacent vehicles, deceleration detection would be degraded and TTC estimates would be shorter when adjacent vehicles are present compared to absent.
Second, the adjacent vehicles occlude the participant’s view of stationary objects in the virtual environment that carry optical flow information and thus information about self-motion. This occlusion of optical flow information is important because the effectiveness of higher-order variables is influenced by such carrier elements (DeLucia, 2004, 2007; Hochberg, 1982). For example, although tau specifies TTC via the ratio of optical size to optical expansion rate, tau cannot be extracted by an observer if optical expansion is below threshold (Lee, 1976). Moreover, studies indicate that reducing the amount of optical flow information in displays can bias judgments in a direction consistent with slower perceived speeds and overestimates of TTC (Fajen & David, 2003; Kim, 2013; Rock & Harris, 2006). The implication is that a reduction in the number of carrier elements for optical flow due to occlusion by adjacent vehicles could result in degraded deceleration detection, decreased perceived speed of self-motion, and longer TTC estimates when adjacent vehicles are present compared to absent.
Third, the adjacent vehicles affect the pooled image velocities in the optical flow field that participants might use (e.g., through a weighted average or other integration process) to judge the speed of their (simulated) self-motion and TTC with the lead car. Image velocities contribute to heading perception (Andersen & Saidpour, 2002; Layton & Fajen, 2016; Warren & Saunders, 1995) and TTC estimation (Kerzel et al., 1999). Presumably, faster image velocities result in faster apparent self-motion (Gray et al., 2004; Gray & Regan, 2000), and thus enhanced deceleration detection and shorter TTC estimates, compared with slower image velocities.
Finally, the adjacent vehicles could increase cognitive demands because the participant processes information from more vehicles than just the lead car, resulting in shared attentional resources and thus less attention devoted to the lead car due to limits in cognitive capacity (DeLucia & Novak, 1997) and, potentially, a “bottleneck” analogous to the psychological refractory period (Baurès et al., 2010, 2011). Results of studies on the effects of cognitive load on gap acceptance judgments in driving and street crossing indicated that, in some situations, individuals accepted riskier gaps in front of approaching vehicles (suggesting overestimated TTC) under conditions of cognitive load (Cooper & Zheng, 2002; Cooper et al., 2003; Nasar, Hecht, & Wener, 2008) compared with conditions of no cognitive load. According to this account, the presence of adjacent vehicles would lead to degraded deceleration detection performance and result in longer TTC estimates (compared with when adjacent vehicles are absent).
The mechanism underlying the potential effect of adjacent vehicles has important practical implications, for example, in the design of technology to help drivers avoid collisions. We return to this topic in the General Discussion.
Experiment 1
The purpose of Experiment 1 was to determine whether adjacent vehicles affect the detection of a lead car’s deceleration during simulated self-motion. If observers rely on only information from the lead car and are not affected by vehicles in nearby lanes, detection of deceleration should be unaffected by the presence of these additional vehicles.
Method
Participants
Sixteen college students (eight male, eight female) at Texas Tech University received partial credit toward a psychology course. They were between 18 and 23 years of age (M = 19.31 years, SD = 1.20 years). All participants reported normal or corrected visual acuity and were licensed drivers. Years since licensure ranged from 1.5 to 7 years (M = 2.91 years, SD = 1.32 years).
Apparatus
Traffic scenes were created with a STISIM Drive driving simulator housed in a Dell Vostro 410 Intel Core 2.40 GHz computer with 3.00 GB of RAM and a NVIDIA GeForce 8800 GT video card with 512 MB RAM. The computer was equipped with a Logitech force-feedback steering wheel and floor-mounted pedals. Sound was used to produce road noise, engine acceleration and deceleration, and tire screeches. Scenes were shown on a Dell 2208 WFP (digital) flat-panel monitor with a 55.88-cm diagonal viewing area. Scenes were viewed from 41.13 cm, which resulted in a display with a 60° horizontal × 40° vertical field of view. The scenes were presented in 1280 × 1024-pixel resolution and 32-bit color at an update rate of 30 frames per second.
Displays
As represented in Figure 1, displays depicted car-following scenes, which contained six traffic lanes surrounded by mountain ranges. Each lane was 12 ft (3.66 m) wide, and trees were randomly interspersed alongside the road’s edge. The participant’s car was located in the center of three lanes behind a lead car. The three opposing lanes did not contain traffic. At the beginning of each trial, the lead car was located 100 ft (30.48 m) in front of the participant’s car, and the width of the lead car’s rear bumper subtended 3.20° of visual angle. The distance of the adjacent vehicles (when present) was also 100 ft (30.48 m). The lead car (and adjacent vehicles if present) began accelerating 1 s after scene onset and did so until it reached a cruising speed of 40 mph (17.88 m/s). There were 40-mph (17.88-m/s) speed limit signs on the side of the road.
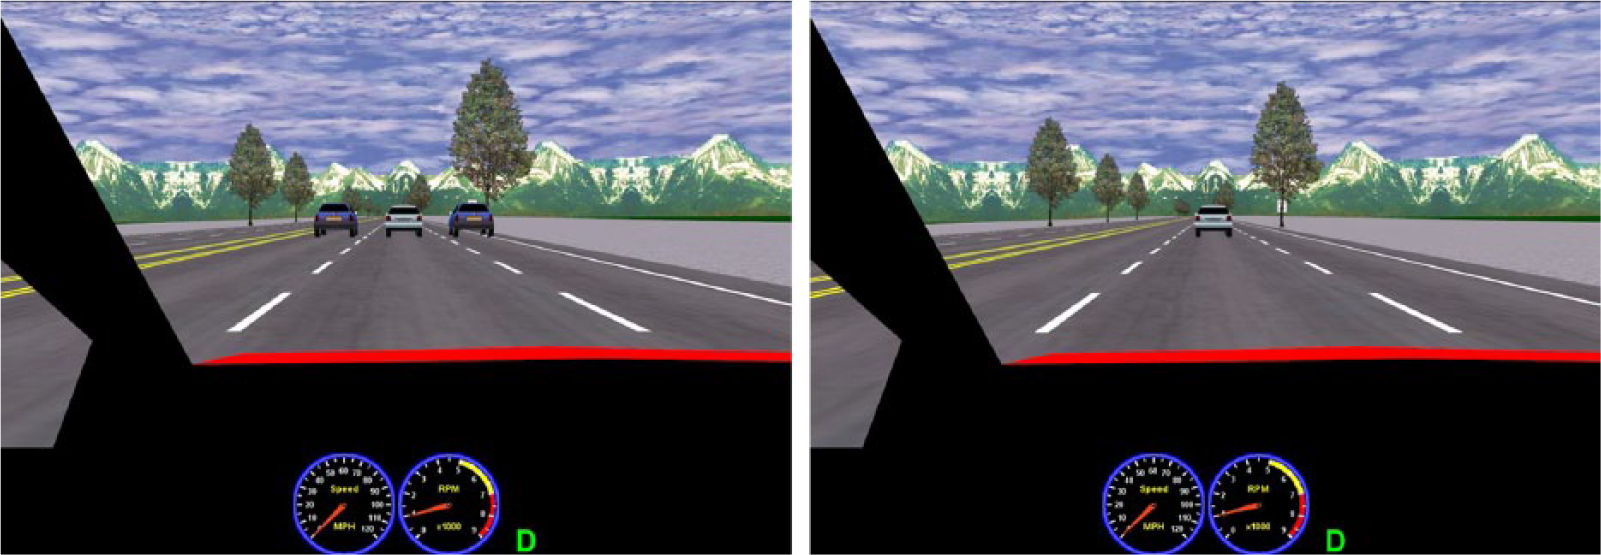
A screenshot of the lead car (center lane) with adjacent vehicles present (left) and absent (right).
To create a variety of scenes and to minimize the participant’s anticipation of the lead car’s deceleration, the lead car’s deceleration time and rate were manipulated. During the scenes in which the lead car decelerated, its deceleration time was randomly sampled from an exponential distribution with a minimum of 10 s and a mean of 14.5 s. Using an exponential distribution results in a constant hazard function, which means that the time since trial onset provides no information whatsoever about the onset of deceleration (e.g., Luce, 1991). These parameters produced deceleration times of the lead car ranging from 10.41 s to 40.28 s after the scene’s onset. Each scene ended 5 s after the onset of the lead car’s deceleration. The deceleration rate of the lead car was either 4 ft/s2 (1.22 m/s2; slow deceleration) or 10 ft/s2 (3.05 m/s2; fast deceleration). To minimize response biases that might result from expectations, half of the scenes were catch trials in which the lead car never decelerated.
We included deceleration rates that provided relatively slow and fast optical expansion rates because earlier work indicated that the visual information that observers use for deceleration detection depends on such rates (DeLucia & Tharanathan, 2009). The selected slow and fast rates correspond to two different braking scenarios—mild and moderately hard. The 4-ft/s2 (1.22-m/s2) rate has been characterized as “mild” braking (Lee, 1976) and approximates the 4.53-ft/s2 (1.38-m/s2) mean deceleration rate observed when passenger vehicles approached a stop sign at speeds similar to the lead car in our study (Wang, Dixon, Li, & Ogle, 2005). The 10-ft/s2 rate (3.05 m/s2) has been characterized as “moderately hard” braking (Lee, 1976) and corresponds to the upper end of comfortable braking rates used by drivers in non-emergency situations (e.g., stopping at a stop sign). The Institute of Transportation Engineers (1999) recommends deceleration rates of less than 3 m/s2 (10 ft/s2) as reasonably comfortable for occupants of passenger vehicles, and this value is used to determine stopping distances for traffic signals. This value also approximates the maximum deceleration rates observed for most drivers approaching stop signs (Wang et al., 2005): The maximum deceleration rates for 87.6% of the deceleration trips observed were lower than the Institute of Transportation Engineer’s recommended 3 m/s2 (10 ft/s2).
Two adjacent vehicles were either present or absent. When adjacent vehicles were absent, only the lead car was shown. When adjacent vehicles were present, they were located in lanes adjacent to the lead car (see Figure 1). The deceleration rates of the adjacent vehicles were always 7 ft/s2 (2.13 m/s2). However, the time at which the adjacent vehicles decelerated varied. The adjacent vehicles decelerated earlier than the lead car or concurrently with the lead car; alternatively, they did not decelerate. The deceleration times of early-decelerating adjacent vehicles were randomly sampled from an exponential distribution with a minimum of 0.5 s and a mean of 1.5 s, which produced differences in the deceleration times between the lead car and adjacent vehicles that ranged from 1.12 s to 3.27 s. Thus, the early-arriving adjacent vehicles always had a shorter TTC than the lead car. The brake lights of all vehicles were disabled.
Procedure
Participants completed five practice trials to learn how the steering wheel and pedals worked and to become familiar with the task. Participants were instructed to accelerate to, and to maintain, a speed of 40 mph (17.88 m/s), to stay in the lane behind the lead car, and to avoid collisions. They were told to press a button on the steering wheel as soon as the lead car decelerated and to respond as rapidly and as accurately as possible. Participants were informed that in some trials the lead car would never decelerate and to not press the button in such cases.
Design
The four adjacent-vehicle conditions (no adjacent vehicles, early-decelerating adjacent vehicles, concurrently decelerating adjacent vehicles, and non-decelerating adjacent vehicles) and two deceleration rates of the lead car (4 ft/s2 [1.22 m/s2], 10 ft/s2 [3.05 m/s2]) were factorially crossed to produce eight scenes. These scenes were replicated four times each to produce 32 scenes in which the lead car decelerated. In 32 catch trials, the lead car never decelerated. This design produced a total of 64 trials, which were divided into two blocks. The order of scenes was randomized, and half of the participants saw the reverse of this original order. A rest period was provided between the first and second block, and the entire experiment lasted approximately 45 min.
Analyses
To assess the various components of deceleration detection performance, we analyzed response time, the lead car’s optical expansion rate at the moment the participant responded, and signal detection theory (SDT) measures. One trial was removed from the analyses due to a programming error that caused the lead car to decelerate at an incorrect rate. Greenhouse-Geisser corrections were used to adjust the degrees of freedom when the assumption of sphericity was violated. Significant effects of the adjacent vehicles were followed up with paired-samples t tests. Hochberg’s (1988) sequential step-up Bonferroni procedure (with a familywise α of .05) was employed to control the Type I error rate.
Deceleration detection latency was assessed using measurements of response time and an associated measure of the lead car’s optical expansion rate at the moment the participant responded. Response time was defined as the time between the lead car’s onset of deceleration and the participant’s button press. Responses that occurred before the lead car decelerated were not included in the analyses (McIntyre, Gugerty, & Duchowski, 2012; Victor, Engström, & Harbluk, 2009); we report a separate analysis of these data. These early responses constituted 5.4% of the trials in which the lead car decelerated. Instantaneous optical expansion rate (Hosking & Crassini, 2011) at the moment the participant responded was calculated based on the width of the lead car’s bumper (Hoffman & Mortimer, 1994; Muttart et al., 2005), which represented the maximum horizontal extent of the lead car.
To assess sensitivity and response biases in deceleration detection, we calculated SDT theory measures of d′ and β (e.g., Green & Swets, 1966). We also analyzed data on two types of errors: misses (trials in which the participant did not respond to a deceleration event) and false alarms (responses made during scenes in which the lead car did not decelerate).
Results and Discussion
Analyses of the data indicate that participants were successful at maintaining the 40-mph (17.88-m/s) speed as instructed: The average velocity of the participants’ vehicles at the moment of response to the lead car’s deceleration was 39.31 mph (17.57 m/s; SD = 1.97 mph [0.88 m/s]); 90% of velocities fell between 35.67 mph (15.95 m/s) and 41.99 mph (18.77 m/s). Although all participants were able to accelerate to 40 mph (17.88 m/s) as instructed, not everyone did so quickly enough to maintain the initial 100-ft (30.48-m) headway to the lead car. Mean headway at the time of response was 190.78 ft (58.15 m) for the slow deceleration rate (4 ft/s2 [1.22 m/s2]) and 194.03 ft (59.14 m) for the fast deceleration rate (10 ft/s2 [3.05 m/s2]), corresponding to mean instantaneous optical expansion rates of 0.0027 and 0.0042 rad/s. The rate was higher when the participant’s car was programmed to maintain the 100-ft (30.48-m) headway to the lead car in Experiment 2.
Response time
Logarithmic transformations were performed on the response time data before conducting parametric tests (Victor et al., 2009), because repeated-measures analyses of variance (ANOVAs) can be sensitive to departures from normality (Oberfeld & Franke, 2013). The pattern of results was similar to analyses of untransformed data; we report the nontransformed results.
A 2 (deceleration rate of the lead car: 4 ft/s2 [1.22 m/s2], 10 ft/s2 [3.05 m/s2]) × 4 (adjacent vehicle condition: no adjacent vehicles, early-decelerating adjacent vehicles, concurrently decelerating adjacent vehicles, non-decelerating adjacent vehicles) repeated-measures ANOVA (rmANOVA) was conducted on mean response time. The main effect of the lead car’s deceleration rate was significant, F(1, 15) = 64.54, p < .0001, ηp2 = .81. Mean response time was shorter when the lead car decelerated at the fast rate (M = 2.18 s, SD = 0.43 s) compared with the slow rate (M = 3.02 s, SD = 0.57 s). This finding is not surprising because the lead car’s optical expansion rate was greater when it decelerated at the fast rate (DeLucia & Tharanathan, 2009). The main effect of adjacent-vehicle condition was not significant, F(3, 45) = 1.67, p = 0.1878, ηp2 = .10.
Optical expansion rate
Results are summarized in Figure 2. A 2 (deceleration rate of the lead car) × 4 (adjacent vehicle condition) rmANOVA indicated that the main effect of adjacent vehicle condition was significant, F(3, 45) = 3.30, p = .0287, ηp2 = .18. When participants responded, the optical expansion rate of the lead car was significantly greater in the presence of non-decelerating adjacent vehicles than it was during scenes with no adjacent vehicles or scenes with concurrently decelerating adjacent vehicles. Participants required the optical expansion rate to be greater before detecting deceleration when non-decelerating adjacent vehicles were present than when they were absent.
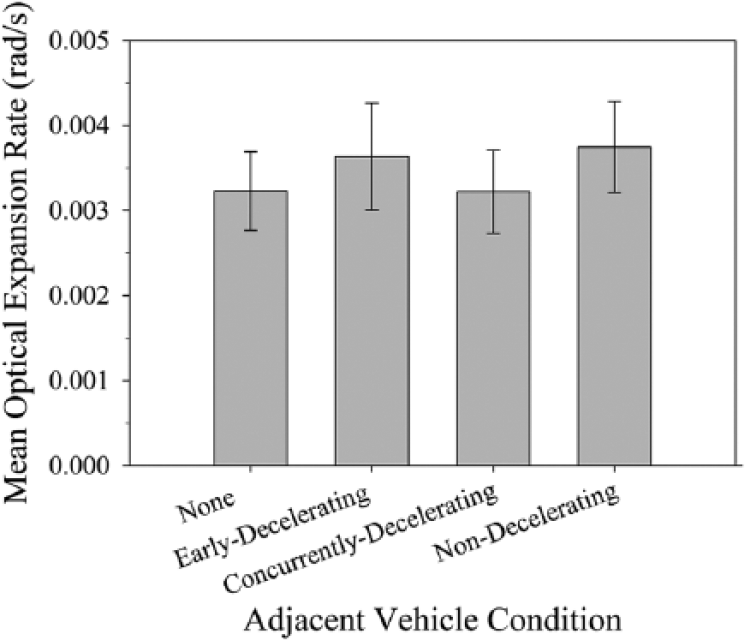
Experiment 1: The effect of adjacent-vehicle condition on the mean optical expansion rate (in radians per second) of the lead car’s rear bumper at the moment the participant pressed the button to report deceleration. Error bars represent ±1 standard error of the mean.
The main effect of the lead car’s deceleration rate was significant, F(1, 15) = 39.67, p < .0001, ηp2 = .73. The mean optical expansion rate (when participants detected deceleration) was greater for the 10-ft/s2 (3.05-m/s2) rate (M = 0.0042 rad/s, SD = 0.0028 rad/s) than for the 4-ft/s2 (1.22-m/s2) rate (M = 0.0027 rad/s, SD = 0.0021 rad/s).
SDT measures
To analyze the SDT measures, we combined the data from scenes that contained early-decelerating adjacent vehicles with those that contained concurrently decelerating adjacent vehicles. This combination was done because in the catch trials for both types of scenes, the adjacent vehicles decelerated at a random time after scene onset and the lead car never decelerated, rendering meaningless the distinction between early and concurrent deceleration. We also collapsed across the 4-ft/s2 (1.22-m/s2) and 10-ft/s2 (3.05-m/s2) deceleration rates when analyzing false alarms, d′, and β because deceleration rate was not manipulated during catch trials.
Misses
A limitation of the response time and optical expansion rate measures is that they provide information only about situations in which a driver successfully detects a lead car’s deceleration. However, participants did not always detect the deceleration event. Failure to detect deceleration has practical significance for traffic safety. Thus, we analyzed the percentage of trials in which misses occurred with a 2 (deceleration rate of the lead car: 4 ft/s2 [1.22 m/s2], 10 ft/s2 [3.05 m/s2]) × 3 (adjacent vehicle condition: no adjacent vehicles, decelerating adjacent vehicles, non-decelerating adjacent vehicles) rmANOVA.
There was a main effect of adjacent-vehicle condition, F(2, 30) = 45.84, p < .0001, ηp2 = .75. Participants exhibited significantly more misses during scenes that contained non-decelerating adjacent vehicles (M = 13.67%, SD = 2.52%) than they did for any other adjacent-vehicle condition (no adjacent vehicles, M = 4.74%, SD = 4.96%; decelerating adjacent vehicles, M = 5.47%, SD = 3.87%). The main effect of the lead car’s deceleration rate also was significant, F(1, 15) = 52.76, p < .0001, ηp2 = .78. There were more misses when the lead car decelerated at the slow rate (M = 14.75%, SD = 6.52%) compared with the fast rate (M = 1.17%, SD = 2.15%).
There was a significant interaction between adjacent-vehicle condition and deceleration rate of the lead car, F(2, 30) = 34.49, p < .0001, ηp2 = .70, shown in Figure 3. To break down this interaction, we evaluated the simple effect of adjacent-vehicle condition separately for the slow and fast deceleration rates. For scenes in which the lead car decelerated at the slow rate, the effect of adjacent-vehicle condition was significant, F(2, 30) = 52.38, p < .0001, ηp2 = .78. Participants exhibited a significantly greater percentage of misses during scenes that contained non-decelerating adjacent vehicles compared with the other adjacent-vehicle conditions. For scenes in which the lead car decelerated at the fast rate, the effect of adjacent-vehicle condition was not significant, F(2, 30) = 1.44, p = .2532, ηp2 = .09. This finding suggests that adjacent vehicles may be more detrimental when motion information from the lead car is less conspicuous due to its lower optical expansion rate.
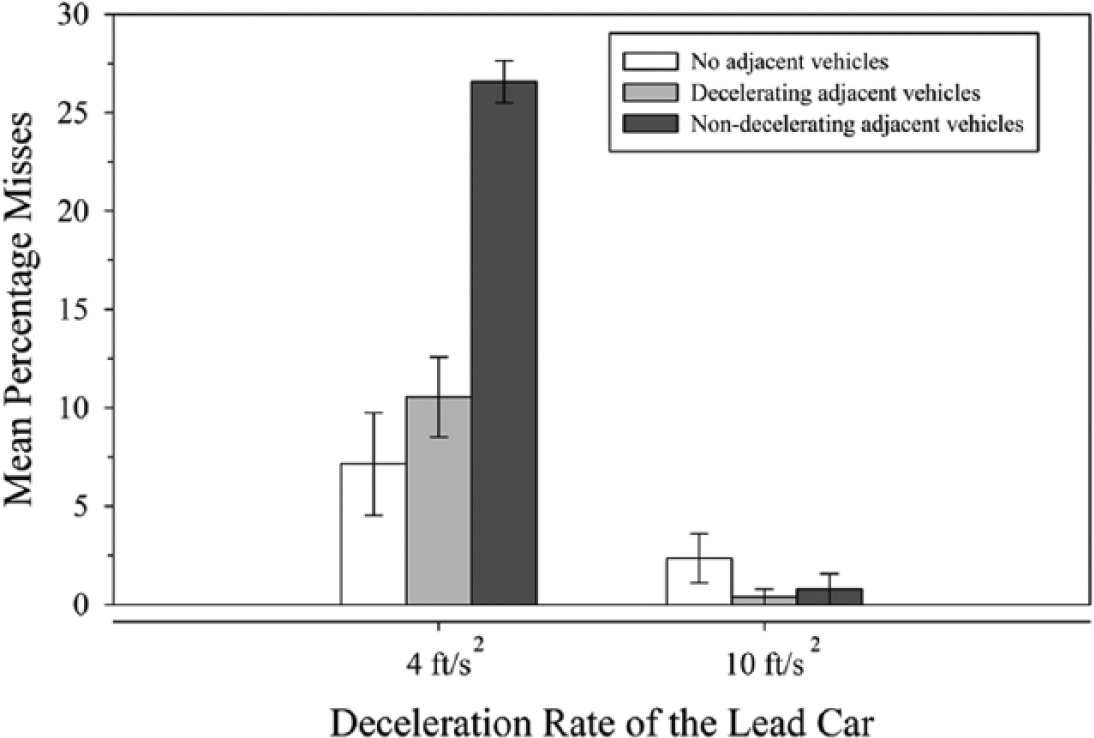
Experiment 1: The effects of adjacent-vehicle condition and deceleration rate of the lead car (4 ft/s2 [1.22 m/s2], 10 ft/s2 [3.05 m/s2]) on the mean percentage of misses. Error bars represent ±1 standard error of the mean.
False alarms
False alarms occurred when the participant reported that the lead car decelerated during scenes in which it actually did not decelerate. A one-way rmANOVA indicated that the effect of adjacent-vehicle condition was not significant, F(2, 30) = 0.99, p = 0.3851, ηp2 = .06.
We did not include early responses (before the lead car decelerated) in our computation of false alarms because we wanted the latter to be consistent with the false-alarm rate used to compute d′ and β. Specifically, we wanted a false alarm to represent only a response on a signal-absent trial (in which the lead car did not decelerate). A separate analysis of early responses indicated that the main effects of adjacent-vehicle condition and deceleration rate on the percentage of early responses were not significant (ps > .07).
We considered two reasons for the effect of adjacent-vehicle condition on the percentage of misses. First, participants missed more deceleration events when non-decelerating adjacent vehicles were present than when there were no adjacent vehicles (or when there were decelerating adjacent vehicles) because the additional vehicles reduced participants’ ability to discriminate between deceleration and non-deceleration events. That is, the adjacent vehicles reduced perceptual sensitivity. This explanation was examined with the sensitivity measure of d′. Alternatively, participants adopted a more stringent criterion for reporting deceleration when adjacent vehicles were present. For example, participants may have waited until they detected more optical expansion from the lead car before reporting deceleration because they were uncertain whether the relative motion between lead car and adjacent vehicles was due to acceleration of adjacent vehicles or deceleration of the lead car. This explanation was examined with the response bias measure of β.
In the context of SDT, a signal was either present (the lead car decelerated) or absent (the lead car did not decelerate) in each scene. Participants reported that the signal was either present (pressed the button) or absent (did not press the button). The corresponding hit rate and false-alarm rate were used to calculate d′ and β for each adjacent vehicle condition. A d′ value of 0 indicates an inability to discriminate between deceleration and catch trials, whereas larger values of d′ indicate greater sensitivity. A β value of 1 indicates that the participant did not favor either of the two response alternatives (they reported that the lead car decelerated as often as they reported that it did not decelerate). Smaller values of β indicate that the participant was biased toward reporting that the lead car decelerated (more liberal, less risky criterion). Larger values of β imply that the participant was biased toward reporting that the lead car did not decelerate (more stringent, more risky criterion). Hit rates and false-alarm rates of 0.0 and 1.0 were replaced with 1/(2n) and 1−1/(2n), respectively, where n is the total number of signal-present or signal-absent trials in a given cell (Macmillan & Creelman, 2005).
d′
Results are summarized in Figure 4. A one-way rmANOVA conducted on mean d′ values indicated that the effect of adjacent vehicle condition (no adjacent vehicles, decelerating adjacent vehicles, non-decelerating adjacent vehicles) was significant, F(2, 30) = 20.29, p < .0001, ηp2 = .57. Mean d′ was significantly lower for scenes in which non-decelerating adjacent vehicles were present than for scenes without adjacent vehicles as well as scenes with decelerating adjacent vehicles.

Experiment 1: The effect of adjacent vehicle condition on mean d′. Error bars represent ±1 standard error of the mean.
β
Due to violations of sphericity, a one-way rmANOVA with a Greenhouse-Geisser correction was conducted on mean β values. Results indicated that the effect of adjacent-vehicle condition was not significant, F(2, 30) = 1.39, p = .2617, εˆ = .64, ηp2 = .08 (no adjacent vehicles, M = 1.50, SD = 0.58; decelerating adjacent vehicles, M = 1.52, SD = 1.26; non-decelerating adjacent vehicles, M = 1.92, SD = 0.80).
In summary, the presence of adjacent vehicles did not affect the average time participants took to report the lead car’s deceleration. However, participants required a greater optical expansion rate, and were less sensitive, when detecting the lead car’s deceleration in the presence of non-decelerating adjacent vehicles. Additionally, when the lead car decelerated at the slow rate, participants exhibited more missed deceleration events when non-decelerating adjacent vehicles were present, putatively due to lower sensitivity to the lead car’s deceleration.
Experiment 2
Experiment 1 demonstrated that vehicles in lanes adjacent to a lead car can influence a driver’s ability to detect the lead car’s deceleration. Once drivers detect the lead car’s deceleration, they must assess the urgency of the situation and apply the brakes accordingly. This assessment putatively requires drivers to make judgments about the lead car’s TTC. Experiment 2 was conducted to assess the effect of adjacent vehicles on TTC judgments of the lead car.
Method
Participants
Sixteen Texas Tech University students (eight male, eight female) who did not participate in Experiment 1 received partial credit toward a psychology course. They were between 17 and 24 years of age (M = 19.38 years, SD = 1.75 years). All participants reported normal or corrected visual acuity and were licensed drivers. Years since licensure ranged from 1.5 to 8 years (M = 3.44 years, SD = 1.57 years).
Displays and design
The apparatus and design were as described in Experiment 1. To accommodate TTC judgments using a prediction motion task, a blank screen (black) was presented 3 s after the lead car began to decelerate. In addition, the participant’s vehicle was preprogrammed to travel at 40 mph (17.88 m/s); participants did not actively control the vehicle. This method allowed us to control the lead car’s TTC in each scene. As in Experiment 1, the lead car decelerated at either 4 ft/s2 (1.22 m/s2) or 10 ft/s2 (3.05 m/s2), the adjacent vehicles always decelerated at 7 ft/s2 (2.13 m/s2), and deceleration times for the lead car and early-decelerating adjacent vehicle were randomly sampled from exponential distributions. Scenes ended 8 s after the onset of the lead car’s deceleration, resulting in total scene durations that ranged from 18.41 s to 48.28 s.
At the beginning of each trial, the lead car (and adjacent vehicles if present) was located 100 ft (30.48 m) in front of the participant’s car. The visual angle subtended by the width of the lead car’s rear bumper was 3.20° until the lead car began to decelerate. At the moment before the display was blanked, the visual angle subtended by the lead car’s bumper was 3.84° and 5.50° for the slow and fast deceleration conditions, respectively. Corresponding TTC values for the lead car when it began to decelerate were 7.07 s and 4.47 s, and corresponding TTC values when the display was blanked were 4.07 s and 1.47 s. Importantly, the instantaneous rate of optical expansion of the lead car right before it disappeared was 0.009 rad/s in the slow deceleration condition and 0.046 rad/s in the fast deceleration condition. Both expansion rates are above Hoffman and Mortimer’s (1994) estimated threshold of 0.003 rad/s.
Procedure
Participants completed five practice trials to become familiar with the task. They were instructed to press a button when they thought that their car would hit the lead car had the cars’ motions continued in the same manner after the display was blanked. They were told that in some trials the lead car would never decelerate and to not press the button in such cases. TTC judgments were measured as the time between the disappearance of the lead car and the participant’s response.
Analyses
To facilitate a comparison of accuracy between the slow (4 ft/s2 [1.22 m/s2]) and fast (10 ft/s2 [3.05 m/s2]) deceleration rates, TTC judgments were converted to a percentage of actual TTC (Cavallo & Laurent, 1988; Kiefer, Flannagan, & Jerome, 2006; Schiff & Oldak, 1990), where percentage TTC = (judged TTC/actual TTC)*100. Percentage TTC values of 100 signify perfect accuracy, whereas values above or below 100 indicate overestimates and underestimates, respectively. This conversion allowed us to remove the effect of actual TTC on TTC estimates (error and variability increase as actual TTC increases; Tresilian, 1995) when comparing judgments for the slow and fast deceleration rates.
Results and Discussion
Results are summarized in Figure 5. Mean percentage TTC in the eight conditions used in this study ranged from 51.97% to 68.04%, which is consistent with that obtained during actual driving on a test track (Kiefer et al., 2006).
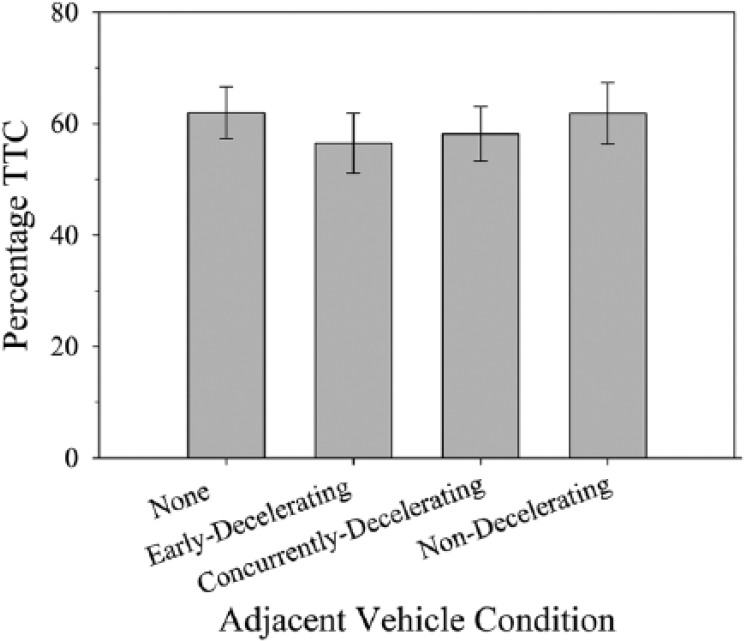
Experiment 2: The effect of adjacent vehicle condition on mean percentage time to contact. Error bars represent ±1 standard error of the mean.
A 2 (deceleration rate of the lead car: 4 ft/s2 [1.22 m/s2], 10 ft/s2 [3.05 m/s2]) × 4 (adjacent vehicle condition: no adjacent vehicles, early-decelerating adjacent vehicles, concurrently decelerating adjacent vehicles, non-decelerating adjacent vehicles) rmANOVA indicated a main effect of adjacent vehicle condition, F(3, 45) = 3.04, p = .0384, ηp2 = .17. Mean percentage TTC was significantly smaller for scenes in which early-decelerating adjacent vehicles were present than for scenes without adjacent vehicles. This pattern of means is consistent with Oberfeld and Hecht (2008, Experiment 5), who reported that early-arriving distractors produced shorter TTC judgments relative to distractor-absent trials. A significant main effect of the lead car’s deceleration rate, F(1, 15) = 13.27, p = .0024, ηp2 = .47, indicated that mean percentage TTC was smaller and less accurate (and more conservative) for scenes in which the lead car decelerated at the slow rate (M = 53.99%, SD = 19.73%) compared with the fast rate (M = 65.24%, SD = 21.71%).
In summary, results indicated that the presence of early-decelerating adjacent vehicles can affect judgments of a lead car’s TTC. These results contrast with those of Experiment 1, in which only non-decelerating adjacent vehicles affected performance. Thus, effects of adjacent vehicles may be task dependent. The pattern of results from Experiment 2 is consistent with Oberfeld and Hecht (2008, Experiment 5).
General Discussion
Two experiments were conducted to determine whether vehicles in lanes adjacent to a lead car affected drivers’ abilities to detect the onset of a lead car’s deceleration and to judge the lead car’s TTC. Such effects would indicate that Oberfeld and Hecht’s (2008) reported effect of “task-irrelevant” distractors on TTC judgments generalizes to conditions of self-motion and, potentially, to real-world driving. The current results partially replicate those of Oberfeld and Hecht.
Deceleration Detection
In Experiment 1, adjacent vehicles did not affect response time to a decelerating lead car. However, participants required a greater optical expansion rate, and were less sensitive to the lead car’s deceleration (reflected in lower d′ values), when non-decelerating adjacent vehicles were present compared with absent. Differences in d′ between these two conditions appeared to be driven primarily by differences in the frequency of missed deceleration events rather than by false alarms to non-decelerating lead cars. When the lead car decelerated at a slow rate and optical expansion rate was relatively less effective (DeLucia & Tharanathan, 2009), non-decelerating adjacent vehicles increased the number of missed deceleration events (compared with scenes without adjacent vehicles or those with decelerating adjacent vehicles). In contrast, when the lead car decelerated at a fast rate, adjacent vehicles did not affect missed deceleration events. The implication is that when the lead car’s optical expansion information was more robust, observers better attended to it and were not affected by vehicles in adjacent lanes.
We also found a robust effect of the lead car’s deceleration rate. Slower deceleration rates resulted in both longer response times to deceleration and a greater number of missed deceleration events. These effects are not surprising because slower deceleration rates result in relatively slower optical expansion rates (DeLucia & Tharanathan, 2009).
The findings from Experiment 1 are not consistent with Oberfeld and Hecht (2008). Our results showed that non-decelerating adjacent vehicles decreased the likelihood that participants reported the lead car as decelerating when it actually was decelerating, whereas Oberfeld and Hecht found that late-arriving distractors increased the likelihood that participants reported an approaching target as arriving earlier than a standard. Had our results been consistent with theirs, non-decelerating adjacent vehicles would have increased the likelihood that participants reported the lead car as decelerating when it actually was decelerating, which would have resulted in fewer rather than more missed deceleration events.
The discrepancy in findings could be due to the difference in tasks. In Experiment 1, we measured detection of deceleration. In contrast, Oberfeld and Hecht’s (2008) observers judged when a collision would have occurred (temporal estimation) but not whether deceleration occurred. Deceleration detection and TTC judgments may involve different mechanisms. Our results are consistent with those of Gould et al. (2013), who had participants judge whether target vehicles were approaching or static in a simulated city scene. Participants exhibited greater thresholds for detection of a target car’s approach when an additional foveally located car (late arriving) was approaching rather than stationary, supporting the notion that adjacent vehicles may have differential effects on the detection of approach motion (or deceleration) and the judgment of TTC. Furthermore, our finding that non-decelerating adjacent vehicles decreased sensitivity (d′) is consistent with those of Lemon and Andersen (2015), who reported lower d′ values when additional background scene objects were present (rather than absent) in a collision detection task that involved simulated self-motion.
TTC Judgments
In Experiment 2, the mean percentage TTC ([judged TTC/actual TTC]*100) value for scenes without adjacent vehicles was 61.96%, which is consistent with the ~60% found in typical prediction motion tasks (Tresilian, 1995). In contrast, mean percentage TTC in the presence of early-decelerating adjacent vehicles was 56.49%. Therefore, adjacent vehicles that decelerated earlier than the lead car produced shorter, and less accurate (but safer), judgments of the lead car’s TTC compared with conditions without adjacent vehicles. It has been suggested that the underestimations exhibited in prediction motion tasks are a result of estimating the moment of action (e.g., depress the brake pedal) rather than the moment of collision, or a result of drivers building a safety margin into their judgments (Kiefer et al., 2006). The implication is that early-decelerating adjacent vehicles caused drivers to perceive the moment of action as earlier or to build an additional safety margin into their judgments.
Results of Experiment 2 are consistent with those of Oberfeld and Hecht (2008, Experiment 5), in which early-arriving distractors resulted in shorter TTC estimates compared with a distractor-absent condition. Oberfeld and Hecht included distractors that arrived later than the target, and this condition also resulted in shorter TTC estimates compared with the no-distractor condition. Experiment 2 did not include late-arriving distractors, and we cannot determine whether Oberfeld and Hecht’s late-arriving results would generalize to conditions with self-motion.
Assessment of Possible Reasons for Effects of Adjacent Vehicles on Performance
We considered several reasons adjacent vehicles would affect performance. If the effect was due to participants fixating on the adjacent vehicles when the lead car decelerated (allowing the lead car to fall in less-sensitive retinal periphery), we expected degraded deceleration detection performance and shorter TTC judgments in the presence of adjacent vehicles. Results from Experiment 1 and 2 are partially consistent with this explanation: In Experiment 1, participants exhibited degraded detection performance when non-decelerating adjacent vehicles were present (compared to absent). The finding is consistent with the notion that participants alternated gaze among the three vehicles until one of the vehicles decelerated and then fixated on the lead car in anticipation of its deceleration. Hence, there was no degradation when the adjacent vehicles decelerated, but there was degradation when the adjacent vehicles did not decelerate (because participants were more likely to be fixating on an adjacent vehicle). In Experiment 2, TTC judgments were shorter when early-decelerating adjacent vehicles were present rather than absent. If participants fixated on an adjacent vehicle while the lead car was decelerating, it may have biased them toward shorter judgments (Li & Laurent, 2001; Manser & Hancock, 1996; Meyer, 2001). However, concurrently and non-decelerating adjacent vehicles did not significantly affect judgments, which is inconsistent with this interpretation.
If the effect of adjacent vehicles was due to their occlusion of stationary objects that provided information about self-motion, we expected degraded deceleration detection performance and longer TTC judgments when the vehicles were present compared with absent. Our results are not consistent with this interpretation. Although we observed degraded deceleration detection performance when non-decelerating adjacent vehicles were present (compared with absent), we did not see degraded performance with early- or concurrently decelerating adjacent vehicles. If the effect of adjacent vehicles was due to occlusion, we expected greatest performance degradation when early- and concurrently decelerating adjacent vehicles were present because they occluded more texture elements due to their greater proximity to the participant. Our finding that early-decelerating adjacent vehicles shortened TTC judgments in Experiment 2 also is not consistent with this explanation, because we anticipated longer TTC judgments in this and other adjacent-vehicle conditions.
If the effect of adjacent vehicles was a result of their effect on pooled image velocity, we anticipated enhanced deceleration detection performance and shorter TTC judgments in the presence of decelerating adjacent vehicles. Results from Experiment 1 are not consistent with this explanation. Non-decelerating adjacent vehicles resulted in the slowest pooled image velocity compared with the other adjacent-vehicle conditions and did result in degraded deceleration detection performance compared with when adjacent vehicles were absent. However, when adjacent vehicles decelerated early, detection performance was not better than when adjacent vehicles were absent. This finding was unexpected because when adjacent vehicles decelerated earlier than the lead car, they expanded faster and increased the pooled image velocities, putatively resulting in faster apparent self-motion (Gray et al., 2004; Gray & Regan, 2000). Results of Experiment 2 were consistent with the pooled image velocity explanation. When adjacent vehicles decelerated early in Experiment 2, TTC judgments were shorter than when adjacent vehicles were absent.
If adjacent vehicles increased cognitive demands, we expected degraded deceleration detection performance and longer TTC judgments. Results from Experiment 1 are partially consistent with this explanation: Detection performance was degraded when non-decelerating adjacent vehicles were present (compared with absent). In contrast, early-arriving adjacent vehicles in Experiment 2 shortened TTC judgments, which is inconsistent with this explanation.
In summary, in Experiment 1, the finding that non-decelerating adjacent vehicles decreased deceleration detection performance is most consistent with two of the proposed interpretations: (a) Adjacent vehicles affected participant scanning behavior, and (b) adjacent vehicles increased participants’ cognitive demands. Future research should employ eye-tracking measures to tease apart these possibilities. If drivers fixate on an adjacent vehicle when the lead car decelerates, the implication is that reduced sensitivity (and increased misses) to the lead car’s deceleration occurred because the lead car fell in the less-sensitive periphery of the retina. If drivers fixate on the lead car when it decelerates, but still demonstrate reduced sensitivity with non-decelerating adjacent vehicles, the implication is that another mechanism, such as limits in cognitive capacity, underlies degraded performance.
In Experiment 2, results are most consistent with the interpretation that the effect of adjacent vehicles on TTC judgments is due to changes the vehicles produced in the pooled image velocity: Additional expansion from early-decelerating adjacent vehicles presumably resulted in faster apparent self-motion and thus shorter TTC judgments (Gray et al., 2004; Gray & Regan, 2000). The pattern of means for percentage TTC from Experiment 2 (see Figure 5) was consistent with the notion that TTC judgments were directly related to the amount of optical expansion produced by adjacent vehicles. Scenes without additional expansion (no adjacent vehicles, non-decelerating adjacent vehicles) produced the greatest percentage TTC; lower values occurred when adjacent vehicles did decelerate. The results of Experiments 1 and 2, taken together, suggest that the mechanism underlying the effect of adjacent vehicles on performance depends on the task (deceleration detection vs. TTC estimation).
Limitations
We did not collect eye-tracking data, which might have elucidated the mechanism underlying effects of adjacent vehicles on judgments of the lead car. For example, if participants fixated an adjacent vehicle when the lead car decelerated, the lead car’s increased eccentricity may have reduced the participant’s sensitivity to its motion. This possibility may explain why participants required greater optical expansion, and exhibited more misses, when non-decelerating adjacent vehicles were present compared with absent. Authors of future research should investigate the extent to which drivers’ visual sampling behaviors change in the presence of adjacent vehicles.
Another limitation of our study was that the brake lights were disabled, making it unclear whether our results would generalize to actual driving. Disabling brake lights is common in driving simulation studies (e.g., Cassavaugh & Kramer, 2014; Fricke & Thüring, 2009; Ho, Reed, & Spence, 2006; Mohebbi, Gray, & Tan, 2009; Muttart, Fisher, Knodler, & Pollatsek, 2007). We disabled brake lights so that participants could not simply focus on the lead car’s tail lights, reducing our task to brake light detection. There are many actual situations in which vehicles decelerate without brake light illumination (Muttart et al., 2007), such as when drivers remove their foot from the accelerator or when drivers with manual transmissions downshift to decelerate. Moreover, there are many vehicles with one or more inoperative brake lights resulting from normal wear, lack of proper vehicle maintenance, or equipment defects. The Great Britain Department for Transport (2015) reported that 18.4% of the 27.7 million passenger vehicles tested for roadworthiness in Great Britain from 2014 to 2015 failed due to improper lighting or signaling. Even when brake lights are operational, the information they provide is unavailable or less effective when they fall in peripheral vision, which can occur when the driver looks at locations other than the lead car (Summala et al., 1998). It is important for drivers to accurately judge a lead car’s motion without brake lights or other discrete warnings.
Practical Implications
Results of Experiment 1 suggest that drivers may fail to detect a lead car’s deceleration in a timely fashion when vehicles are present in adjacent lanes. Results of Experiment 2 suggest that drivers may underestimate the actual time remaining before an impending collision with a lead car when vehicles are decelerating in other lanes. The differences between the absolute TTC judgments of the scenes without adjacent vehicles and the scenes that contained early-decelerating adjacent vehicles were 153 ms and 106 ms for the slow and fast deceleration rates, respectively. If a driver subsequently initiated his or her braking response this much earlier, it would result in 8.95-ft (2.73-m) and 6.21-ft (1.89-m) shorter stopping points (albeit drivers may adjust braking responses throughout the approach; Kiefer et al., 2006; Lee, 1976). Although this underestimation may help avoid hitting the lead car, early braking also could result in being hit from behind. It is important that drivers accurately estimate a lead car’s TTC to modulate their braking responses accordingly.
If effects of adjacent vehicles are due primarily to effects on a driver’s use of optical flow, such effects depend on the distance between the driver and the vehicles ahead (because optical expansion is slower at farther distances), rendering important collision-avoidance warning technologies that take distance into account (DeLucia & Tharanathan, 2009). In contrast, if effects of adjacent vehicles are due primarily to effects on a driver’s cognitive resources, it becomes more important to focus on reducing a driver’s competing cognitive demands, for example, reducing the use of cell phones or simplifying the menu structure and commands of voice-based, in-vehicle interactive systems.
Key Points
Previous research demonstrated effects of task-irrelevant objects on time-to-contact judgments of an approaching object in scenes that simulated a stationary observer.
Scenes that simulated self-motion in car-following scenarios were used to measure the effect of vehicles in lanes adjacent to a lead car on deceleration detection and judgments of time to contact.
The presence of adjacent vehicles resulted in more missed deceleration events, lower sensitivity, and less accurate judgments of time to contact.
Nearby traffic may affect a driver’s ability to accurately judge a lead car’s motion in situations that pose risk for rear-end collisions.
Footnotes
Acknowledgements
We are grateful to Jae In Lee for assistance with pilot scene development, to Neil Imbery and Jeffrey Payne for help with data collection, and to the Texas Tech University Human Factors Chat for feedback on earlier presentations of this work.
Samuel J. Levulis is a doctoral candidate in the Human Factors Psychology Program at Texas Tech University. He obtained his MA in experimental psychology from Texas Tech University in 2014.
Patricia R. DeLucia is a professor of psychological sciences, coordinator of the Human Factors Psychology Program, and associate vice president for research at Texas Tech University and an adjunct professor in the School of Nursing at Texas Tech University Health Sciences Center. She is a Fellow of the American Psychological Association, Human Factors and Ergonomics Society, and Psychonomic Society. She completed her PhD in experimental psychology from Columbia University in 1989.
Daniel Oberfeld is an associate professor in the Department of Psychology at Johannes Gutenberg-Universität in Mainz, Germany. He completed his PhD in psychology from Technische Universität Berlin in 2005.