




Abstract
Objective:
We investigated the effects of automatic target detection (ATD) on the detection and identification performance of soldiers.
Background:
Prior studies have shown that highlighting targets can aid their detection. We provided soldiers with ATD that was more likely to detect one target identity than another, potentially acting as an implicit identification aid.
Method:
Twenty-eight soldiers detected and identified simulated human targets in an immersive virtual environment with and without ATD. Task difficulty was manipulated by varying scene illumination (day, night). The ATD identification bias was also manipulated (hostile bias, no bias, and friendly bias). We used signal detection measures to treat the identification results.
Results:
ATD presence improved detection performance, especially under high task difficulty (night illumination). Identification sensitivity was greater for cued than uncued targets. The identification decision criterion for cued targets varied with the ATD identification bias but showed a “sluggish beta” effect.
Conclusion:
ATD helps soldiers detect and identify targets. The effects of biased ATD on identification should be considered with respect to the operational context.
Application:
Less-than-perfectly-reliable ATD is a useful detection aid for dismounted soldiers. Disclosure of known ATD identification bias to the operator may aid the identification process.
Keywords
Introduction
To be useful to a human operator, an automated detection system should provide a signal when a problem condition occurs in the world (an automation hit, or aH) and not respond when that condition has not occurred (an automation correct rejection, aCR). However, the system may fail to respond when a problem occurs (an automation miss, aM), or respond when the problem has not occurred (an automation false alarm, aFA). There has been a considerable effort to understand the effects of such automated system behavior on human operators (e.g., Hancock et al., 2013; Parasuraman, Molloy, & Singh, 1993; Wickens & Dixon, 2007). We make two general observations based on this literature. First, the reliability of the automation affects operator performance. Wickens and Dixon (2007) showed that diagnostic automation at reliabilities below about .70 provides little or no improvement to human performance. Second, whether the automation is more prone to aMs or aFAs affects reliance behavior. False alarms reduce the likelihood that the operator responds to the signal (the “cry-wolf effect”; Sorkin, 1989) whereas misses increase the likelihood that the operator monitors the raw data directly (Dixon, Wickens, & McCarley, 2007; Meyer, 2001, 2004).
Wang, Jamieson, and Hollands (2009) showed that disclosing automation reliability levels to an operator affects the operator’s reliance on that system (vs. no disclosure). Neyedli, Hollands, and Jamieson (2011) found that participants adjusted their reliance on an automated decision aid in rough correspondence with its disclosed reliability. Barg-Walkow and Rogers (2016) found that reliability disclosure affected perceptions of automation reliability. In summary, operator reliance is influenced by automation reliability.
Task difficulty (Aldrich, Szabo, & Bierbaum, 1989; Veltman & Gaillard, 1998) also affects reliance behavior. Operators are more likely to rely on an automated system that performs a task they find difficult (Dzindolet, Beck, Pierce, & Dawe, 2001). Maltz and Shinar (2003) had participants detect targets in aerial images with and without an automated detection aid and varied task difficulty by manipulating image type. For high task difficulty (blurred thermal images), the aid improved detection performance relative to the no-aid condition. However, for low task difficulty (color photographs), the aid provided no advantage. Kogler (2003) found that participants were more likely to rely on target identification automation as the visual transmissivity of ballistic goggles decreased. Dzindolet et al. (2001) refer to the gap between the perceived reliability of the automation and the human’s ability to perform the task as the perceived utility of automation. Users may rely on unreliable automation if the task is difficult or their skills are limited, or may neglect reliable automation if they believe that they can perform the task well enough.
Automatic Target Detection Systems for Soldiers
In combat missions, soldiers detect potential targets and seek to identify them, often using a rifle scope. Detection refers to the ability to distinguish a target from the background, and identification refers to the ability to distinguish friend from foe. Detection is necessary but not sufficient for identification. Uniform or weapon characteristics are often used to identify targets visually.
Automatic target detection (ATD) systems detect and cue potential targets to facilitate visual search (Ratches, 2011). These systems detect characteristics like thermal signature, shape edges, and motion to distinguish target from background using optical and thermal sensors along with image-processing algorithms (Bell, 2011; D’Agostino, McCormack, & Steadman, 2010). ATD systems overlay digital imagery (e.g., a rectangle) around a target to cue its location through a weapon scope. As with most forms of automation, ATD is imperfect and may incorrectly cue (aFA) or fail to cue (aM) targets.
Automatic cuing can aid target detection. Yeh, Wickens, and Seagull (1999) and Yeh and Wickens (2001) showed that when targets were cued with 100% reliability, participant detection performance improved. However, uncued targets (aMs) were more likely to be missed. Yeh and Wickens found that when targets were cued with 75% reliability, participant detection performance decreased relative to the 100% reliable condition, but participants detected more uncued targets (aMs).
Tombu, Ueno, and Lamb (2016) investigated the effects of ATD on target detection and identification. Participants were shown high-fidelity virtual scenes and instructed to detect and identify simulated human targets under time pressure. They compared reliable (i.e., errorless) ATD with ATD conditions with imperfect cuing (i.e., aFAs and aMs occurred) and a no-ATD condition. Although reliable ATD produced the best performance, most imperfect ATD conditions produced better detection and identification than no ATD, even when the ATD erred frequently (up to 33% aM and 20% aFA rate), which stands in contrast with the Wickens and Dixon (2007) results. When the physical variables are directly observable, as in target detection, automation reliability may be less important than when the physical variables are more difficult to observe, as in process control. This difference may account for the discrepant results.
Glaholt (2014) examined the effects of ATD on detection and identification using realistic imagery on a high-resolution display. Glaholt found that ATD reduced detection time and improved detection rate. Contrary to Tombu et al. (2016) though, cued targets were more likely to be misidentified, and the time to identify cued targets increased. Glaholt also found that larger cues and lower-contrast cues eliminated the identification penalty. It appears that ATD can help or hinder identification performance.
ATD highlights targets having certain physical characteristics; this automated detection will occur regardless of whether the target is hostile or friendly. However, ATD algorithms may cause targets of one affiliation to be cued more frequently than another. An enemy soldier could have a different shape than a civilian, or the thermal signature of a friendly soldier may differ from an adversary equipped differently. If the ATD is more likely to detect a friendly target than an enemy (or vice versa), then it becomes an implicit cue for identification.
ATD Performance and Signal Detection Theory
Earlier we described four detection outcomes for an ATD system. These are illustrated in Figure 1. Note that an aH is equivalent to a cued target, and an aM is equivalent to an uncued target. The target detection of a human observer can be classified in a similar way, as a hit (dH), miss (dM), false alarm (dFA), or correct rejection (dCR). Identification will depend on a target’s identity and whether it is classified as a threat: hit (iH; correctly classified hostile), miss (iM; hostile not classified as a threat), false alarm (iFA; friendly incorrectly classified as a threat), and correct rejection (iCR; correctly classified friendly).
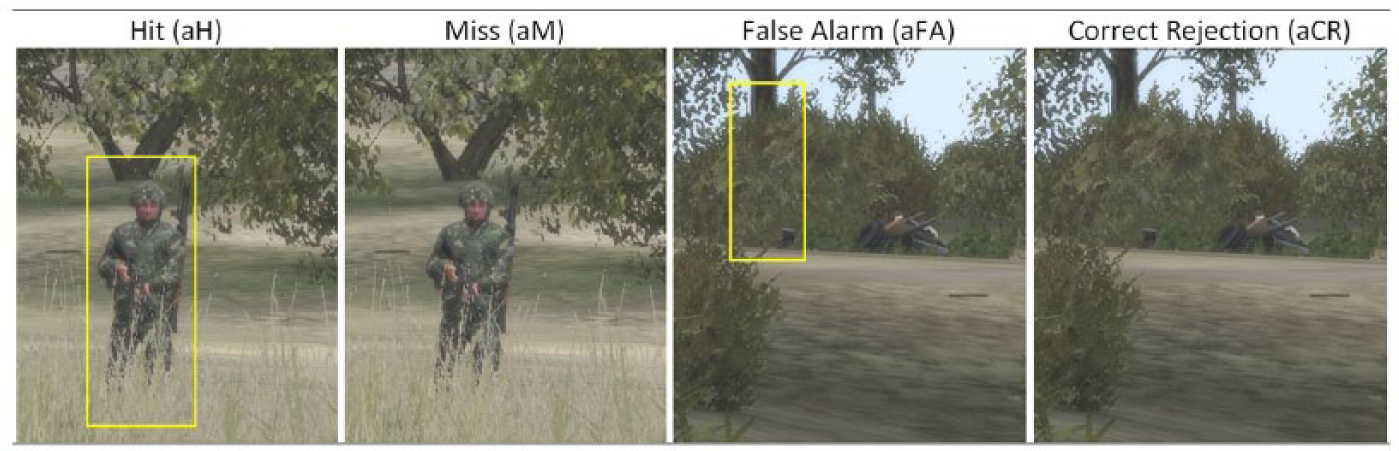
Automatic target detection (ATD) outcomes.
We treat reliance on an automated system as a signal detection problem (Botzer, Meyer, Bak, & Parmet, 2010; Sorkin & Woods, 1985), wherein the behavior of the ATD system may affect the detection and identification performance of the human operator. Signal detection theory (SDT; Green & Swets, 1966; Macmillan & Creelman, 2004) provides measures of identification sensitivity (the ability to distinguish friend from foe) and decision bias (using one response more often than another). Surprisingly, SDT is not often applied to human reliance on automated systems. Wang, Jamieson, and Hollands (2008) argue that sensitivity (d′) and the subjective decision criterion (β) provide insight into identification performance beyond conventional accuracy measures, like frequency of iHs.
Figure 2 depicts a situation in which an ATD system is more likely to detect a hostile than a friendly target. In the top half, the red S(H) + N [Signal(Hostile) + Noise] curve represents some level of ATD activation associated with the presentation of a hostile target. The N (Noise) curve represents the level of activation when no target is presented. If we define a criterion value (dashed vertical line), the part of the S(H) + N curve to the right of that line represents the probability of an automation hit, P(aH), whereas the part of the N curve to the right of the line represents the probability of an automation false alarm, P(aFA). We see that P(aH) > P(aFA).
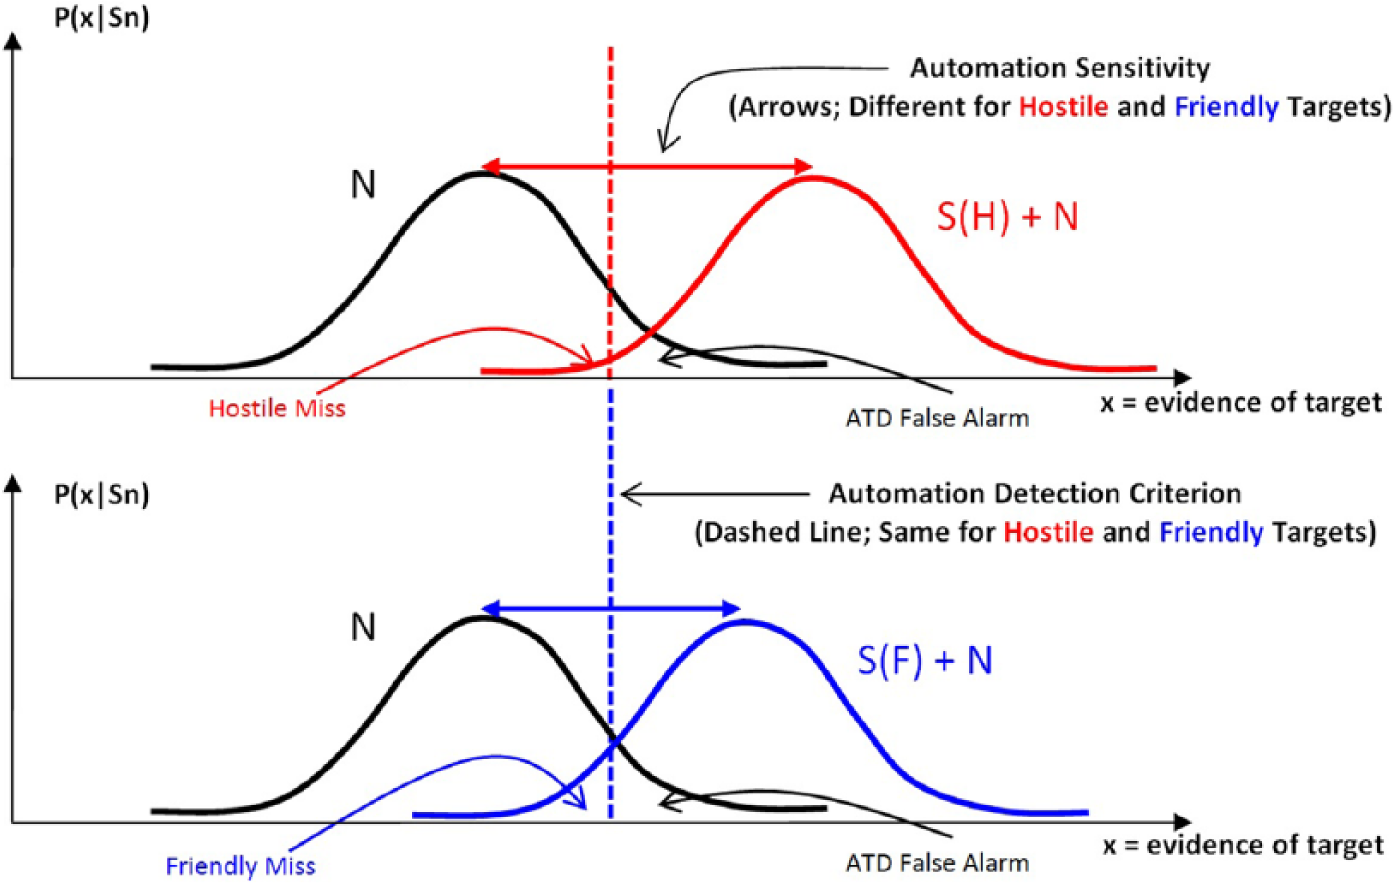
Signal detection distributions for automatic target detection of hostile and friendly targets (top and bottom graph, respectively).
In the bottom half of Figure 2, the blue S(F) + N [Signal(Friendly) + Noise] curve represents the level of activation associated with the presentation of a friendly target. Although the S(F) + N curve in the bottom graph is to the right of the N curve, it is not as far to the right as the S(H) + N curve in the top graph. Importantly, the greater separation of S(H) + N and N, relative to that of S(F) + N and N, indicates that the ATD system is more sensitive to S(H) + N than to S(F) + N targets. Thus, there will be fewer detections, that is, P(aH) will be lower, and the detection sensitivity will be lower for friendly targets than for hostiles (horizontal arrow in top graph longer than in bottom graph). All other factors held equal, this ATD system will be more likely to cue hostile targets than friendly targets.
A biased ATD system could improve identification performance if the ATD’s identification bias was disclosed to the soldier. In SDT, the optimal criterion can be defined by signal likelihood, βopt = P(N) / P(S), when each outcome is given the same decisional value (Macmillan & Creelman, 2004). With more friendlies than hostiles in the battlespace, the soldier should have a high decision criterion (identify target as hostile less often). Wilson, Head, de Joux, Finkbeiner, and Helton (2015) showed that the ratio of hostiles to friendlies affected identification performance in a simulated shooting environment. Similarly, if an ATD system cues hostiles more often than friendly targets, a soldier informed of this and then shown a cued target can assume that the target is more likely to be hostile. That is, the soldier can “take advantage” of the ATD identification bias. To investigate reliance on automation in a similar context, Wang et al. (2009) examined the difference in decision criterion values (lnβ difference) between conditions with and without automation (and between conditions with different automation reliabilities). These differences were compared with corresponding differences in optimal criterion values based on conditional signal probabilities.
Extending the Wang et al. (2009) approach, if we assume that a hostile target is a signal and friendly is noise, and if a target is cued by the ATD, then lnβopt = ln[P(friendly|cued) / P(hostile|cued)], where P(friendly|cued) and P(hostile|cued) are the probabilities that the target affiliation is friendly or hostile, given that the target was cued. When the target is not cued, then lnβopt = ln[P(friendly|uncued) / P(hostile|uncued)]. Thus, the optimal lnβ difference between cued and uncued targets is

Wang et al. had participants perform a combat identification task using automation identifying friendly targets at a given reliability level and returning an unknown response for unidentified targets. When automation reliability was disclosed, participants adjusted their decision criterion in the direction of the optimal difference. When automation reliability was not disclosed, the criterion did not reliably differ from a neutral value. Neyedli et al. (2011) also found that participants adjusted their criterion in the appropriate direction based on automation reliability information, but again, not optimally. This sluggish beta effect (Wickens, Hollands, Banbury, & Parasuraman, 2013) has been observed in other automation interaction research (e.g., Meyer, 2001).
Experiment Outline
Given the potentially lethal consequences in combat, it is important to understand how ATD affects soldiers’ target detection and identification performance. ATD has been shown to improve performance (Glaholt, 2014; Yeh et al., 1999; Yeh & Wickens, 2001), even when error prone (Maltz & Shinar, 2003; Tombu et al., 2016). Although authors of previous studies have examined how varying automation detection rates affect human performance, none considered how ATD identification bias affects target detection and identification.
We conducted an experiment with soldiers using simulated ATD in a realistic virtual battlespace. ATD identification bias was varied and disclosed to participants to investigate its effects on target detection and identification. Performance with ATD was compared with performance without. The effect of whether a specific target was cued or not was also examined. Additionally, the scene illumination (day, night) was manipulated to affect task difficulty. For target identification, we used SDT sensitivity and decision criterion measures, and compared the difference between observed decision criterion values and optimal values (Equation 1).
Hypotheses
Participants were expected to detect more targets with ATD than without (Tombu et al., 2016). Increases in task difficulty should result in increased reliance on ATD for both detection and identification (Kogler, 2003; Maltz & Shinar, 2003).
With ATD, we expected that cued targets would be detected at a higher rate than uncued targets (Glaholt, 2014; Maltz & Shinar, 2003; Tombu et al., 2016; Yeh et al., 1999). Importantly, we expected ATD identification bias to affect the decision criterion for target identification in the direction predicted by Equation 1 (Wang et al., 2009), but we also expected a sluggish beta effect (Neyedli et al., 2011; Wang et al., 2009).
Method
Participants
Thirty-four (34) Canadian Armed Forces soldiers served as participants. Eighteen (18) reservists were recruited through e-mails and posters at Defence Research and Development Canada (DRDC) Toronto Research Centre, and 16 regular-force soldiers were later recruited during an experimentation campaign. All participants were male, with a mean age of 31.2 years (SD = 9.8; range = 21 to 58) and a mean of 10 years of service (SD = 7.72; range = 1 to 34). Participants wore corrective eyewear if prescribed. Participants received a half day of pay at their regular salary plus compensation of CAD $25.44 in accordance with DRDC guidelines.
Data for six participants were dropped; one experienced simulator sickness and the other five failed to follow the experimental procedure. All analyses were conducted on data from the 28 remaining participants.
Apparatus and Stimuli
The experiment was conducted using the Virtual Immersive Soldier Simulator (VISS), a simulated tactical environment at DRDC. The VISS (Figure 3) showed the virtual scene on three screens (each 3 m diagonally) prescribing a 130° visual arc. The participant held an M4A1 Airsoft Rifle™; its position and orientation were tracked using the OptiTrack™ infrared system. A microdisplay was mounted on the top rail to simulate a rifle sight. The rifle’s direction determined the portion of the virtual scene shown on the microdisplay at 3.4x magnification. A yellow box (2 × 0.6 m at the target plane) was used to cue a target on the microdisplay (Figure 4). Cuing was not shown on the large screens. The microdisplay image was shown to the experimenter on an LCD display (not pictured). Participants were seated and had optional armrest support.
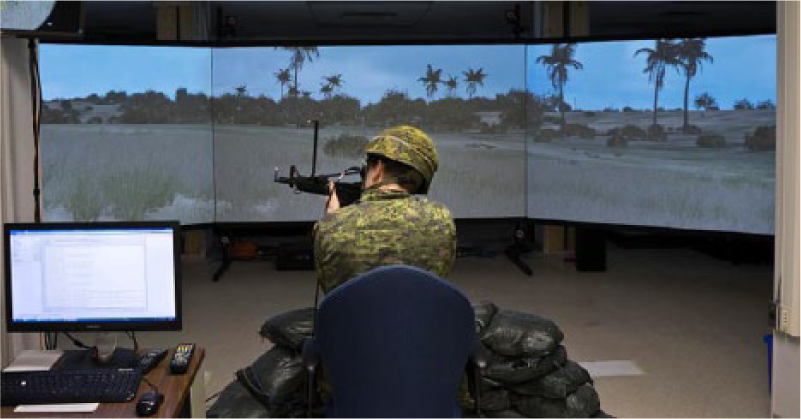
Virtual Immersive Soldier Simulator.
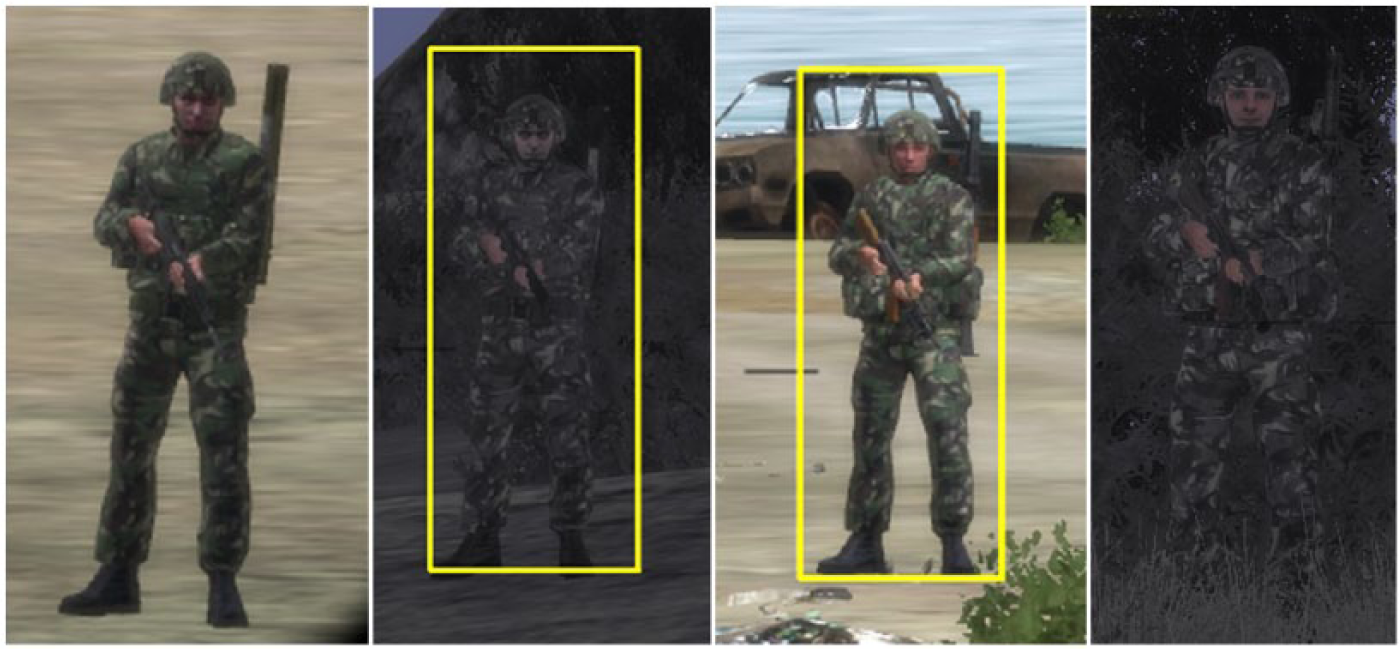
Target affiliations (from left to right): uncued friendly (day), cued friendly (night), cued hostile (day), uncued hostile (night).
Virtual Battlespace 2 (VBS2; Bohemia Interactive Solutions, 2007) was used to simulate 248 virtual scenes, each consisting of soldiers (targets) standing in a background containing foliage and buildings (Figure 3). Sixty-two (62) distinct backgrounds with four different target placements were used to create the 248 scenes. The number of targets in a scene was varied; this number was determined randomly, with the constraint that 120 scenes had four targets and the remaining 128 had five targets. There were thus 1,120 targets in total ([120 × 4] + [128 × 5] = 1120).
To determine target positions, each target was initially placed in a random location 10 to 250 m from the participant’s viewpoint. The position was then adjusted as necessary to ensure that the target (and weapon) was visible (e.g., not occluded behind a building) but also not standing in full view in an open area (which would be unrealistic). Once determined, these target positions did not change during a trial. The mean target distance across the 248 resulting scenes (and 1,120 targets) was 93.7 m (SD = 33.3).
Both friendly and hostile targets wore the same nonspecific military uniform. Identity was based on the target’s weapon: Hostile targets carried Soviet-style weapons with light-colored wood on stock and barrel, whereas friendly targets carried black, North Atlantic Treaty Organization–style weapons (Figure 4). For realism, other target characteristics (e.g., body armor, secondary weapons) also differed between friendly and hostile targets but not consistently (e.g., friendlies were slightly more likely to wear armor).
Design and Procedure
The experiment had a within-subjects factorial design with additional control conditions. There were eight experimental blocks, produced by the factorial combination of ATD (no ATD, ATD with hostile bias, ATD with no bias, and ATD with friendly bias), and illumination (day, night). Within blocks having ATD, we manipulated cuing (i.e., a target was either cued or uncued, an aH or an aM, respectively), but cuing could not be manipulated in the no-ATD conditions. Cuing was therefore not fully crossed with ATD, and the no-ATD day and night conditions served as control conditions (this design led to a specific analytic approach, described in the Results section). The order of the eight blocks was counterbalanced across participants, such that every ATD-illumination combination was performed equally often at each block position. Illumination was manipulated as a proxy for task difficulty and counterbalanced within ATD level (i.e., for a given ATD condition, the participant would perform consecutive blocks of day and night illumination trials).
Each participant performed 248 trials, using a different scene on each trial. The 248 scenes were divided among the eight blocks (i.e., 31 trials per block). There were 15 four-target scenes and 16 five-target scenes in each block, resulting in 140 targets per block (from the 1,120 targets in total). Scenes were randomly assigned within a block, with the constraint that the same background could not appear twice. The order of trials within a block was randomized. Because the number of targets per scene varied and the order of scenes were randomized, participants did not know how many targets would appear in a given scene.
Target identity was randomly assigned within each block, with the constraint that half of the targets were hostile and the remainder friendly (70 of each type within a block). This random assignment meant that in any given scene, the number of hostile (or friendly) targets could vary between zero and five.
In each block with ATD, there were 140 targets: 98 cued by the ATD and 42 not cued; therefore P(aH) = .70, and P(aM) = .30. There were also 28 aFA cases. To compute P(aFA) requires a specification of the number of correct rejections, but it was not possible to say when a nontarget was not detected by the ATD. The number of aFAs divided by the total number of cues (aHs + aFAs) was .22.
The identity of cued targets depended on the ATD identification bias condition. In the no-bias condition, the ATD was equally likely to detect hostile or friendly targets; in the hostile-bias condition, the ATD was more likely to cue a hostile target; in the friendly-bias condition, the ATD was more likely to cue a friendly target. Table 1 expresses these probabilities in two ways: the probability that a target was cued or not given its identity (top two rows) and the probability that a target had a particular identity given that it was cued or not. Otherwise, cues were randomly assigned to targets. For example, in the hostile-bias condition, 80% of the hostiles had to be cued, so 56 of 70 hostile targets in the block were randomly selected as cued.
Probability of Target Identity Based on ATD Identification Bias Conditions
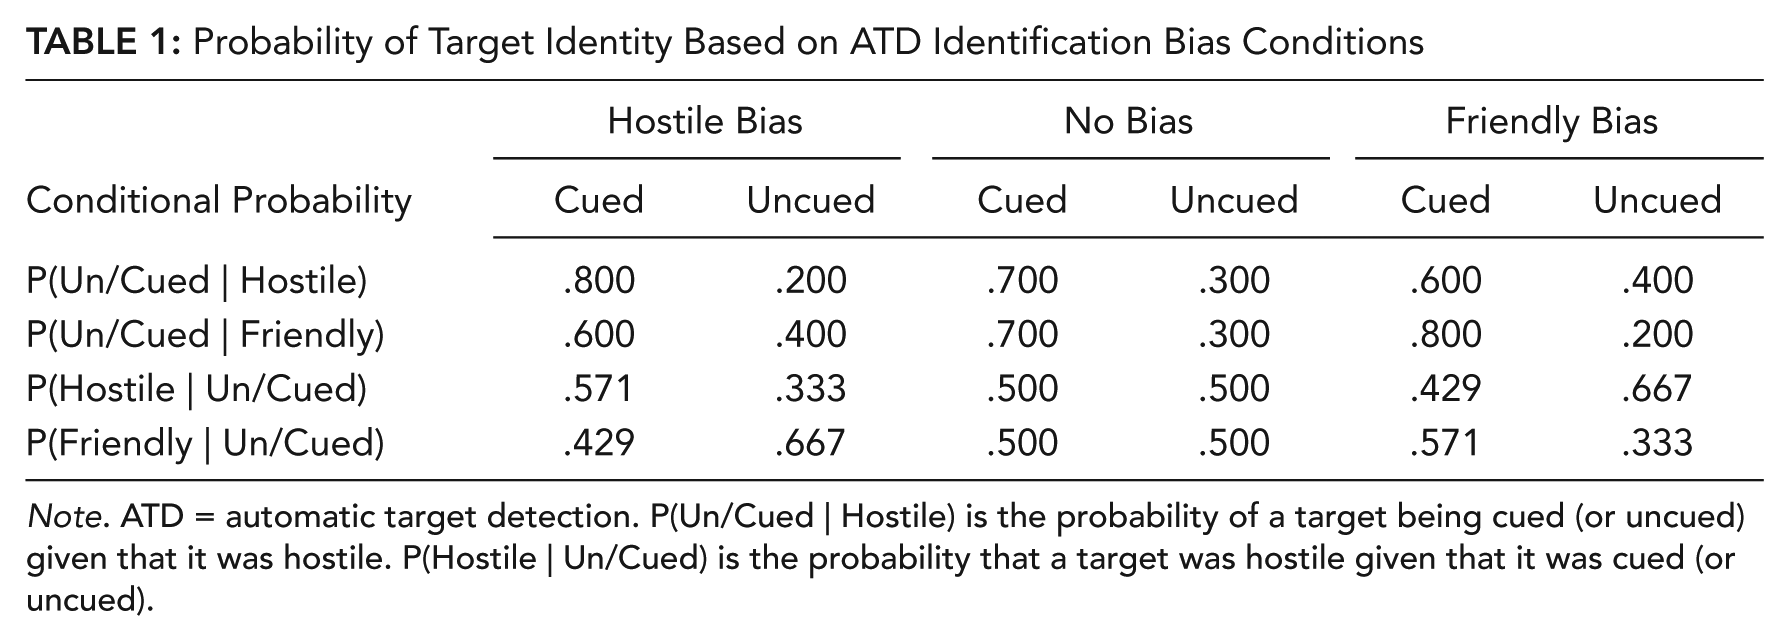
Note. ATD = automatic target detection. P(Un/Cued | Hostile) is the probability of a target being cued (or uncued) given that it was hostile. P(Hostile | Un/Cued) is the probability that a target was hostile given that it was cued (or uncued).
After completing a consent form and demographics questionnaire, participants were shown the VISS and given a brief explanation of the experiment. They were told that a terrorist group was planning an attack by mimicking militia uniforms (a “wolf-in-sheep’s-clothing” scenario), and that their objective was to detect all targets in each scene and identify the threats. They were informed that the positive identification cue was the target’s weapon and that target behavior would not indicate identity, nor would targets react to participant actions. Participants were told that they could use any scanning procedure they preferred, although they were required to confirm detection verbally when a target was acquired in the scope. Upon participant confirmation, the experimenter pressed a button to register the target present in the scope as detected. Participants were told to move on to the next target if a target was friendly or could not be identified but to press a designated button on the weapon if the target was hostile. The button presses were also used to confirm target detections (if the target was identified, it must have been detected).
After completing 16 practice trials, participants performed the eight experimental blocks. They were told that targets were randomly placed in the scene for each trial. They were also told that the number of hostile and friendly targets would be equal across a block but that on a given trial the numbers could vary, such that a scene could contain only hostiles or no hostiles. Prior to each block with ATD, the automation’s reliability and cuing bias were disclosed. For example, prior to a hostile bias block, participants were told that “ATD has been reported to detect an average of eight out of 10 hostile targets, but only about six out of 10 friendlies, so the ATD will miss about twice as many friendlies as hostiles.” Participants were told that for each trial they had 25 s to detect and identify as many targets as they could. After each trial, a feedback screen was presented for 2 s (showing the number of hostiles identified, friendlies identified, hostiles missed, and friendlies misidentified), followed by a 3-s countdown to the next trial. Participants were offered a short break at the end of a block. Each block required 15 to 20 min and the experiment took approximately 3 hr to complete.
Dependent Measures
For a target to be considered detected by the participant, it had to be in scope and then one of two participant behaviors had to occur: a verbal confirmation or a button press (indicating identification and therefore detection). The probability of a detection hit, P(dH), for each participant was calculated as the number of targets detected divided by the total number of targets in each condition. We could not compute P(dFA) since there was no way to determine the number of dCRs in our procedure, but we report the number of dFAs.
For computing identification measures, only detected targets were used. We computed P(iH) as the number of participant button presses for hostile targets divided by the total number of hostile targets detected in a condition. P(iFA) was defined as the number of button presses for friendly targets divided by the total number of friendly targets detected in a condition. The sensitivity and decision criterion parameters d′ and lnβ were calculated using the P(iH) and P(iFA) values for each condition. The inverse of the standard normal cumulative distribution was calculated for P(iH) and P(iFA), and then d′ = z(iFA) – z(iH), and lnβ = −0.5 × d′ × [z(iFA) + z(iH)] (Macmillan & Creelman, 2004).
Results
Following recommended practice for the analysis of designs having control groups separate from a factorial design (Keppel, 1982, pp. 253–254; see also Himmelfarb, 1975), we used partially overlapping analyses to test our hypotheses. In the first, we used a 2 × 2 within-subjects ANOVA with ATD presence (present, absent) and illumination (day, night) to determine whether performance with ATD was better than without ATD for high and low task difficulty conditions. In the ATD-present case, data were averaged over the relevant ATD conditions. In the second analysis, we looked only at conditions with ATD and used a 2 × 2 × 3 within-subjects ANOVA with cuing (cued, uncued), illumination, and ATD identification bias (hostile bias, no bias, friendly bias) to examine predictions about cuing and identification bias. We also compared observed bias to optimal values.
This analytical approach required m = 30 statistical tests in total. To address familywise error, we used the false discovery rate (FDR) procedure recommended by Benjamini and Hochberg (1995), which is a post hoc, step-down adjustment of α. The FDR protects against Type II error, which is often a concern when using the highly conservative Bonferroni-adjusted α for large numbers of tests. In the FDR procedure, the empirical p values for all effects p(i) are sorted in descending order and compared to (i / m) × .05 with i decreasing from m to 1 until it is found that p(i) ≤ (i / m) × .05. Our 13th smallest p value, .002, was found to be less than the FDR value; when i = 13, FDR = (13 / 30) × .05 = .0217. Therefore the FDR adjusted α threshold was .0217. All significant test results had p values smaller than .0217, with the exception of post hoc tests, which were calculated only after a significant F ratio was obtained, after correction for FDR. Importantly, the FDR procedure is valid for use with correlated (dependent) data, including the comparison of many treatments to controls (Benjamini & Yekutieli, 2001).
Generalized and partial η2 effect size statistics are reported (Bakeman, 2005). The values of .02, .13, and .26 should be used as the criteria for small, medium, and large effects, respectively (Bakeman, 2005, p. 383; Cohen, 1988, pp. 413–414).
Detection
Across all participants, there were only five dFAs. All occurred under night illumination and four of the five occurred after detecting an aFA. We therefore used the probability of a detection hit, P(dH), as the primary measure of detection. Table 2 summarizes the significant results. In the 2 × 2 ANOVA, there was a main effect for ATD presence: Participants detected a greater proportion of targets with ATD (M = .74) than without (M = .64). There was a main effect for illumination, with a higher detection rate under day (M = .79) than under night illumination (M = .59), and the interaction showed that the difference between ATD-present and ATD-absent conditions was larger under night illumination (Figure 5). P(dH) was greater for ATD present than ATD absent under day illumination, Newman-Keuls (NK), p < .05.
Statistically Significant Effects From ANOVAs for Probability of a Detection Hit, P(dH)
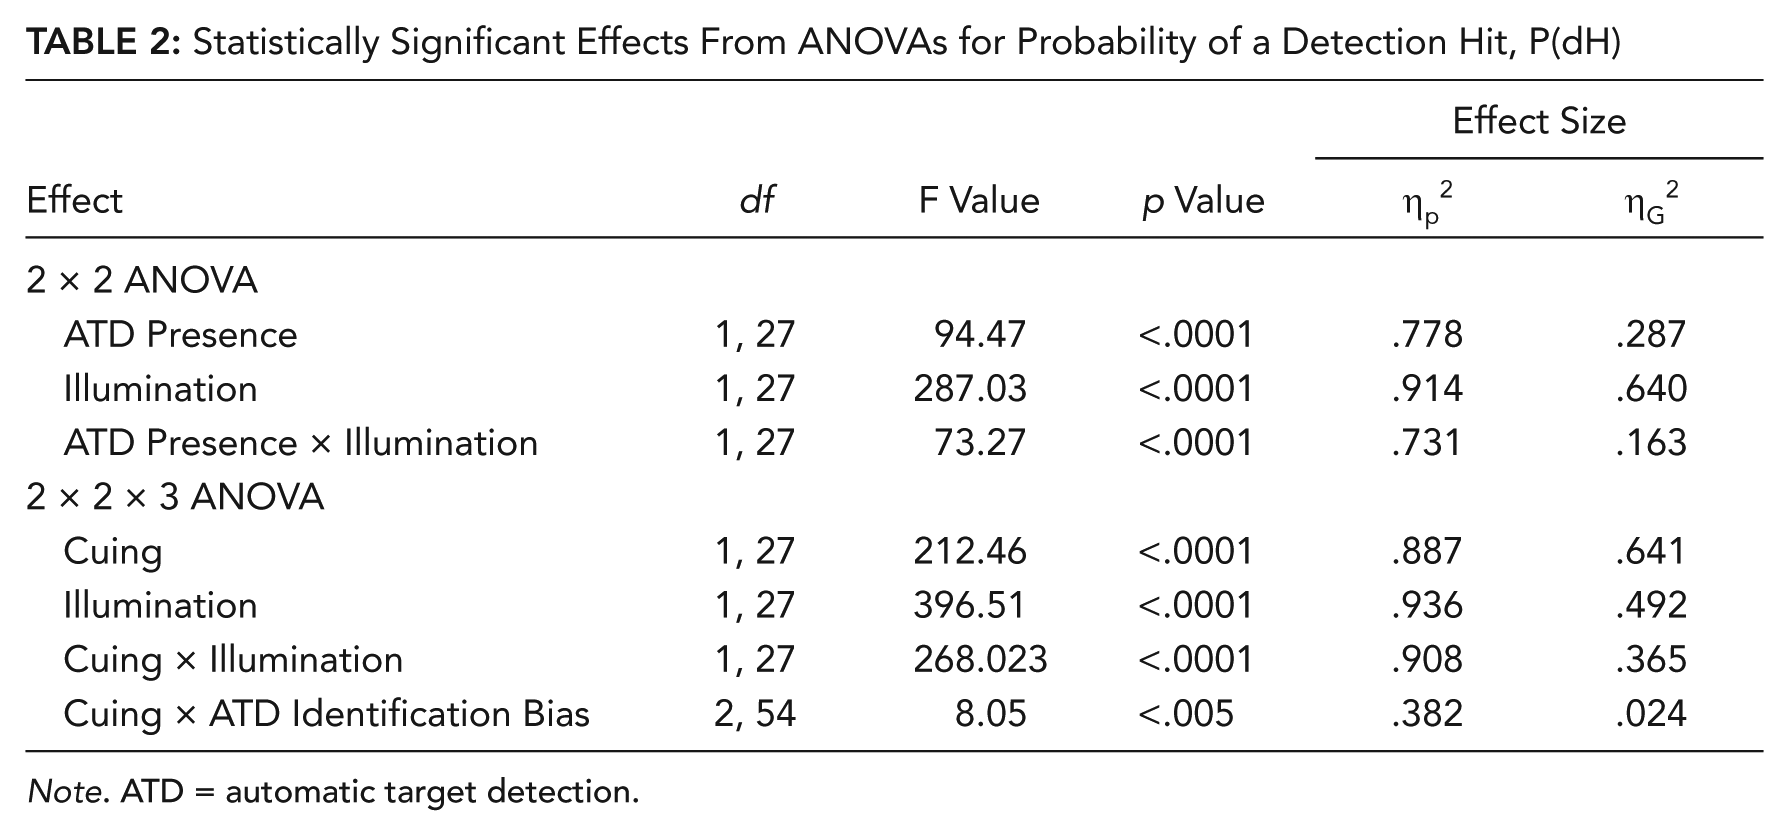
Note. ATD = automatic target detection.
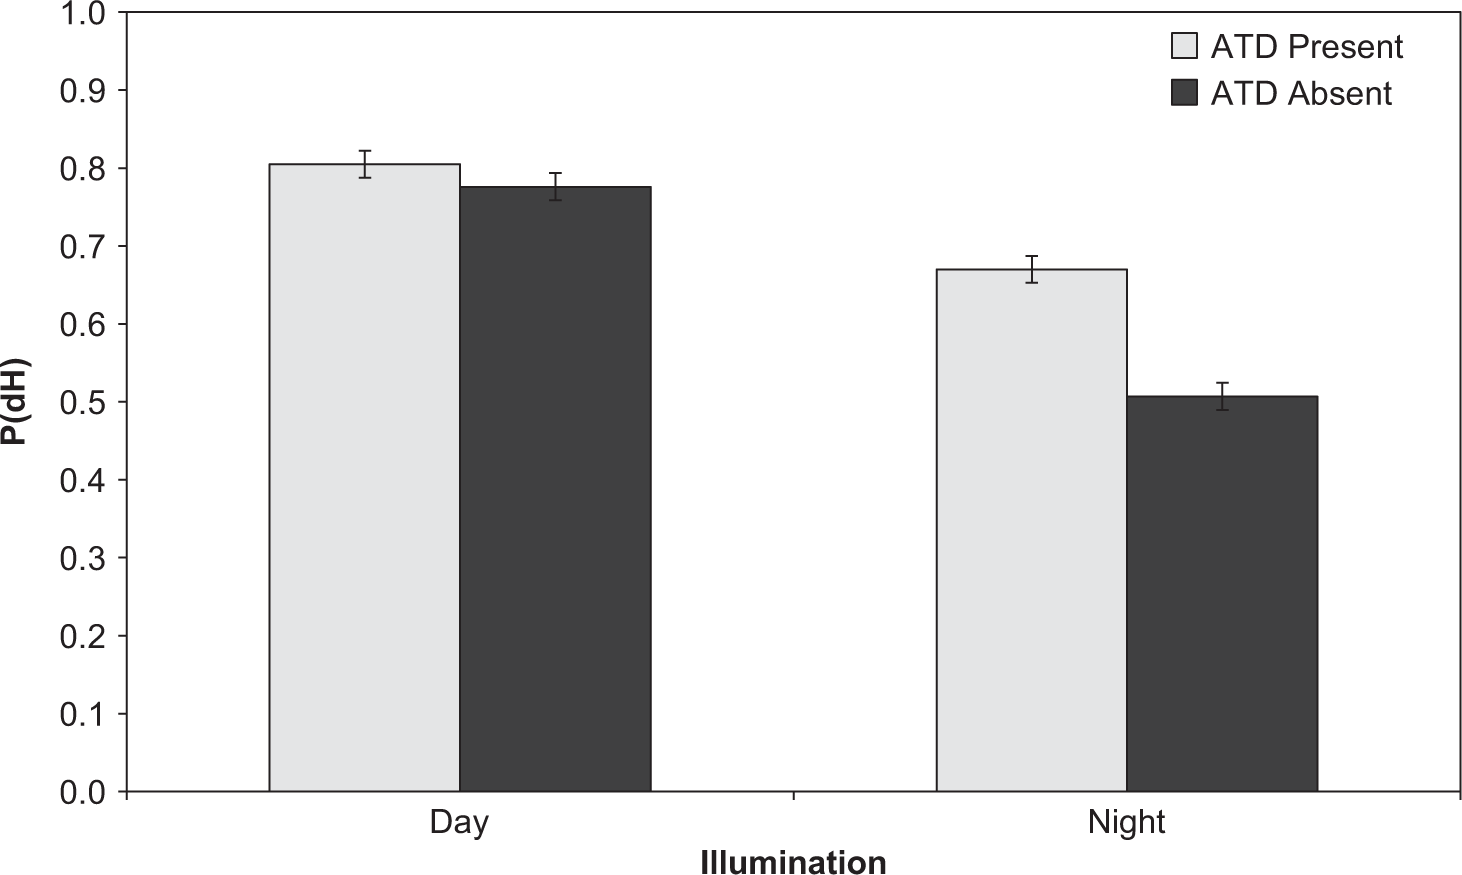
Probability of a detection hit, P(dH), as a function of automatic target detection (ATD) presence and illumination. Error bars indicate the 95% confidence interval in all graphs (Jarmasz & Hollands, 2009).
In the 2 × 2 × 3 ANOVA, there was a main effect for cuing: Participants detected a greater proportion of cued (M = .82) than uncued targets (M = .55). There was a main effect of illumination: With ATD, participants detected a greater proportion of targets under day (M = .78) than under night illumination (M = .59). A Cuing × Illumination interaction (Figure 6) showed that the difference between cued and uncued targets was greater at night, although a difference was still present under day illumination, NK, p < .05. Figure 6 also shows mean values from the control conditions (no ATD) to allow visual comparison. For day illumination, P(dH) increased for cued targets (M = .84) but decreased for uncued targets (M = .73), relative to the no-ATD (M = .78) condition. Under night illumination, the differences between no-ATD (M = .51) and the cuing conditions (M = .79 for cued and M = .38 for uncued targets) were larger. A Cuing × ATD Identification Bias interaction showed that the difference in detection rate between cued and uncued targets was greater for the hostile bias than for other bias conditions (Figure 7).
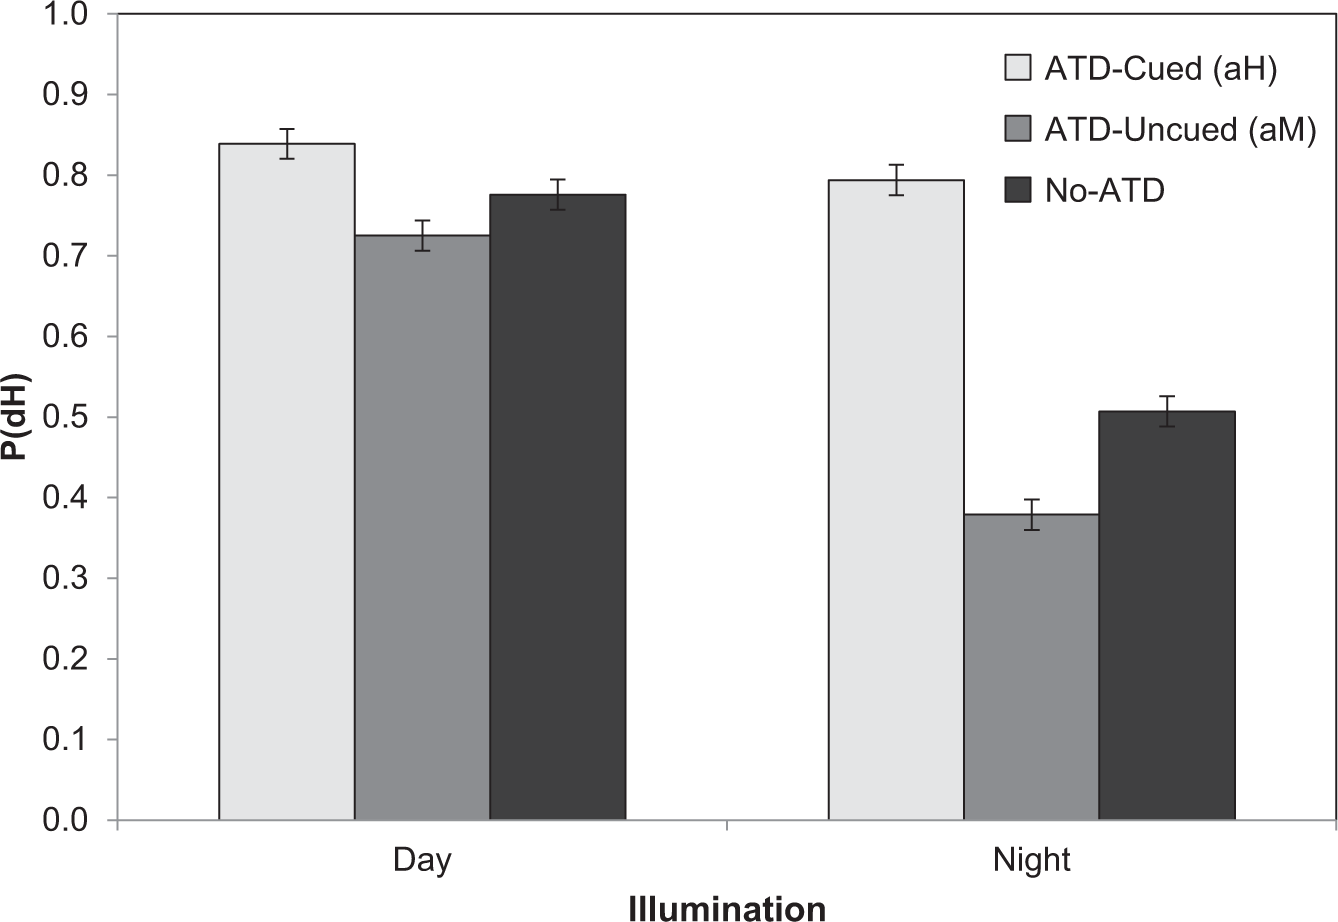
Probability of a detection hit, P(dH), as a function of cuing and illumination. No automatic target detection (ATD) was not part of the 2 × 2 × 3 analysis and is included in this graph to allow visual comparison of detection hit rate in the different ATD cuing conditions with the no-ATD conditions.
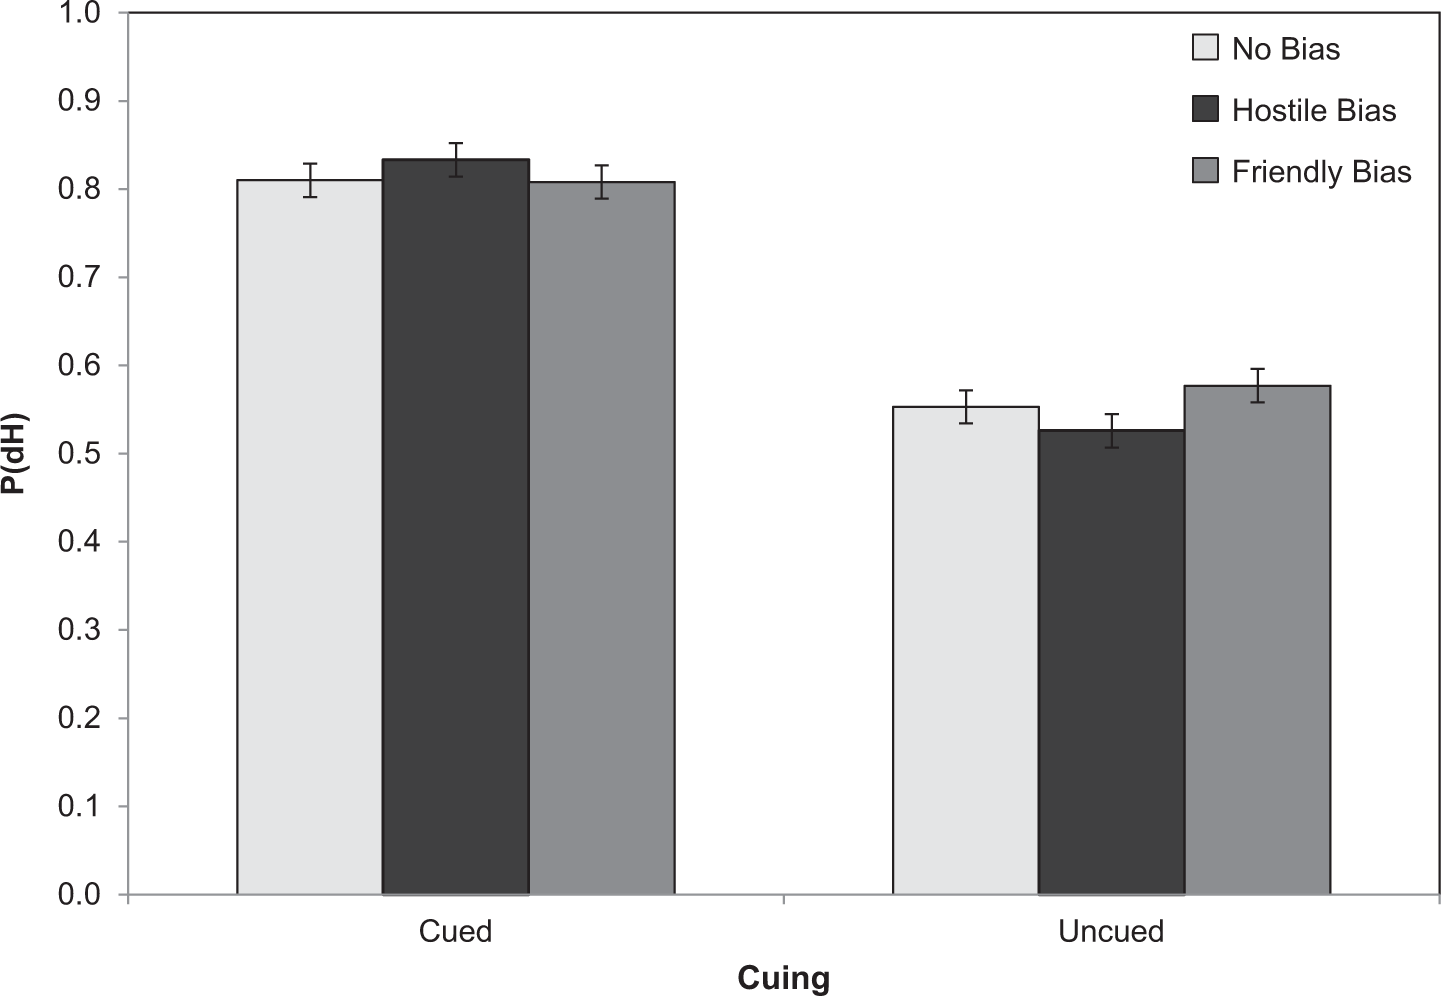
Probability of a detection hit, P(dH), as a function of cuing and automatic target detection identification bias.
Identification Sensitivity (d′)
Table 3 summarizes the sensitivity (d′) results. There was a main effect for illumination in the 2 × 2 ANOVA: Participants showed greater sensitivity during the day (M = 2.24) than at night (M = 1.66). This finding was true regardless of ATD presence; neither the main effect for ATD presence nor the interaction reached significance (both ps > .15).
Statistically Significant Effects from ANOVAs for d′
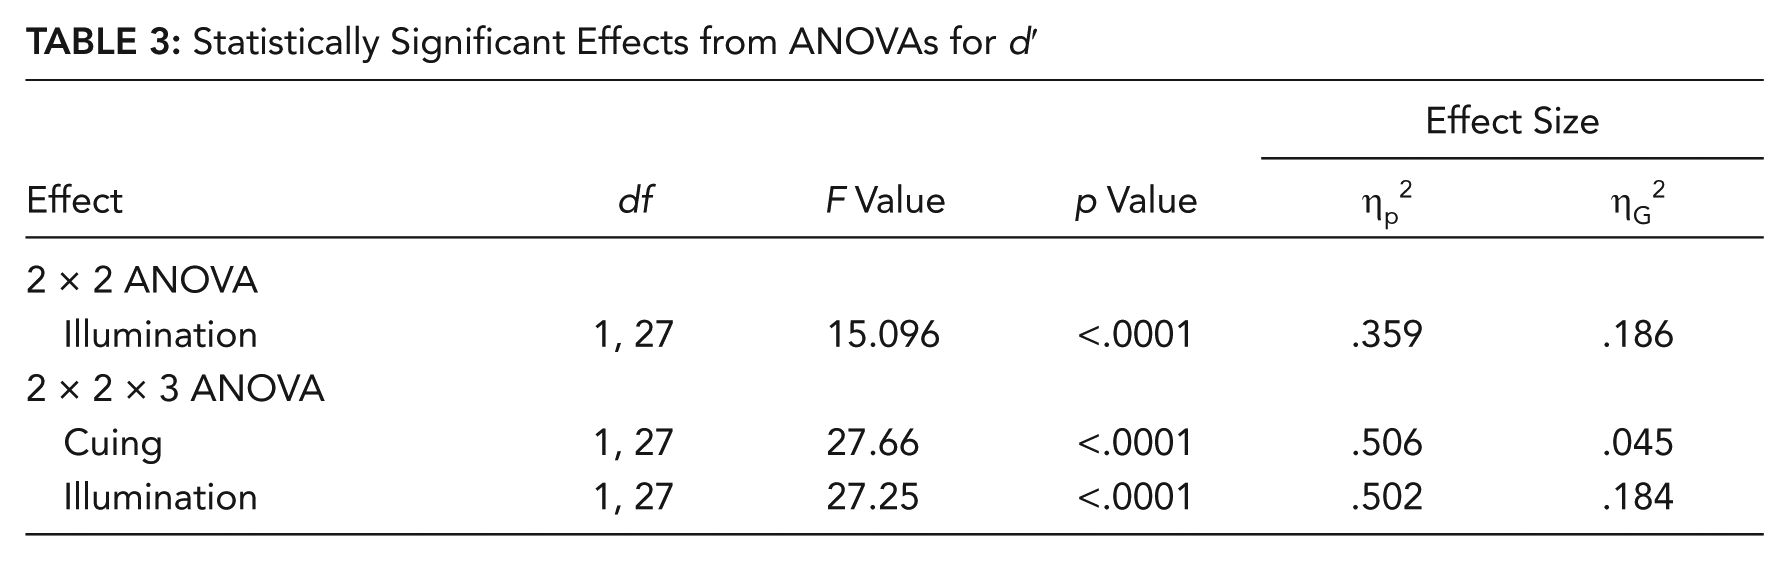
For the 2 × 2 × 3 ANOVA, there was a main effect for cuing: Participants had greater sensitivity for cued (M = 2.02) than for uncued targets (M = 1.69). There was a main effect for illumination such that, with ATD, participants showed greater sensitivity during the day (M = 2.22) than at night (M = 1.49). No other main effect or interaction was statistically significant. Average P(iH) and P(iFA) values for each condition are in the appendix.
Identification Decision Criterion (lnβ)
Table 4 summarizes the decision criterion (lnβ) results. There was a main effect for illumination in the 2 × 2 ANOVA: Participants were more conservative (less likely to classify a target as hostile) for night (M = .360) than for day illumination (M = –.173). There was no interaction between illumination and ATD presence, p > .05. There was also a main effect for illumination in the 2 × 2 × 3 ANOVA: When using ATD, participants were more conservative at night (M = .276) than during the day (M = –.129). A Cuing × ATD Identification Bias interaction showed that ATD identification bias had different effects on the decision criterion depending upon whether or not the target was cued (Figure 8). When the ATD was more likely to detect hostile targets and a target was cued, the decision criterion was more liberal (i.e., more likely to identify as hostile) relative to an uncued target. In contrast, when the ATD was more likely to detect friendly targets and a target was cued, the decision criterion was more conservative relative to an uncued target. When the automation was unbiased and a target was cued, participants were also more conservative relative to uncued targets. No other main effect or interaction was significant.
Statistically Significant Effects From ANOVAs for lnβ
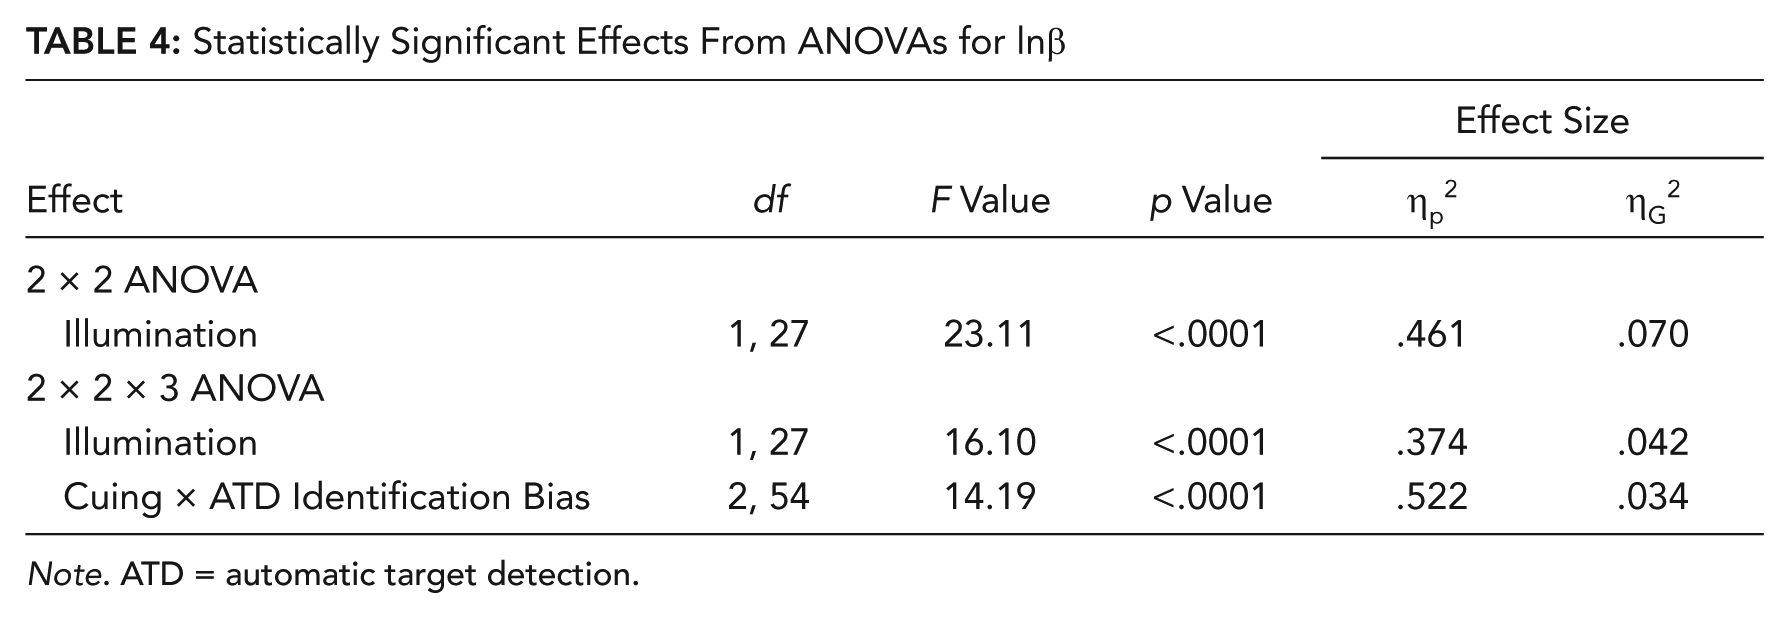
Note. ATD = automatic target detection.
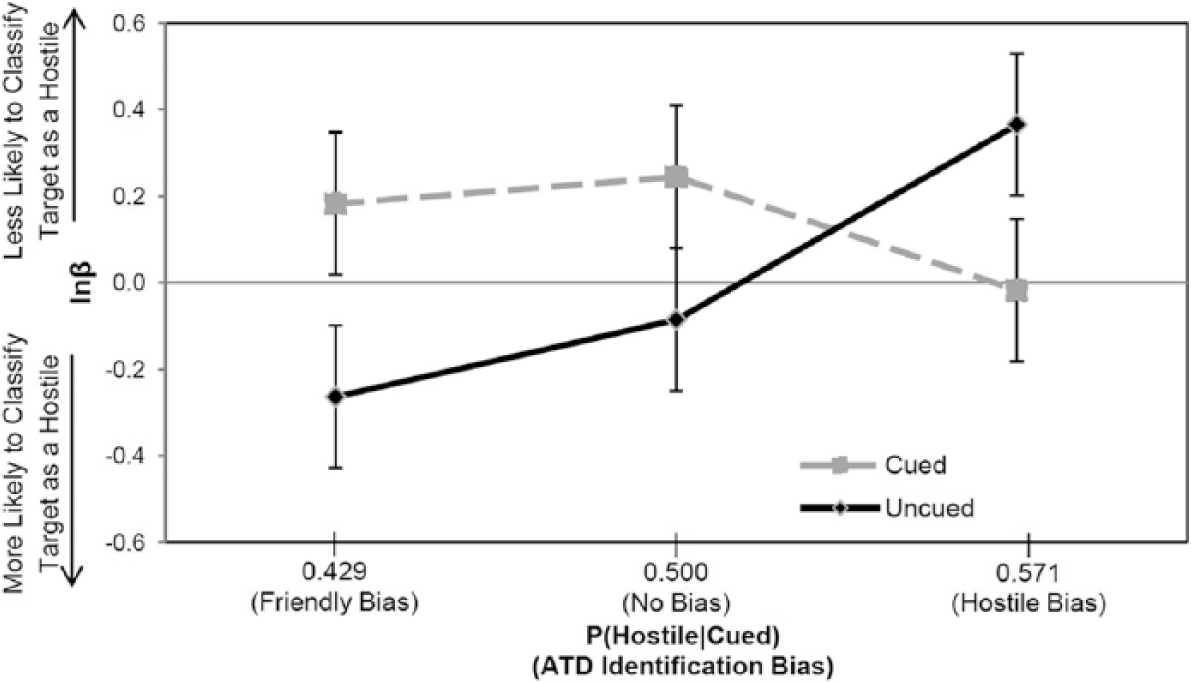
Identification decision criterion, lnβ, as a function of cuing and automatic target detection (ATD) identification bias.
Criterion Shift
The difference in lnβ between cued and uncued targets was calculated for each participant for the three conditions with ATD. A negative difference in lnβ between cued and uncued targets indicated that a participant held a more liberal criterion for a cued target than for an uncued one, whereas a positive difference indicated a more conservative criterion for cued than for uncued targets.
The optimal difference in lnβ values was calculated for each ATD bias condition using Equation 1 and the probabilities in Table 1. These optimal values were then compared to those obtained from the observed difference in lnβ between cued and uncued targets (Table 5). In each case, a 95% confidence interval (Jarmasz & Hollands, 2009) was computed around the observed difference in criterion. The relevant values are shown in Figure 9 and Table 5. The optimal difference value did not fall within the confidence interval in any of the three ATD conditions. In the no-bias ATD condition, participants showed a conservative deviation from the optimal value (which was zero in this case).
Criterion Shift Calculation

Note. ATD = automatic target detection.
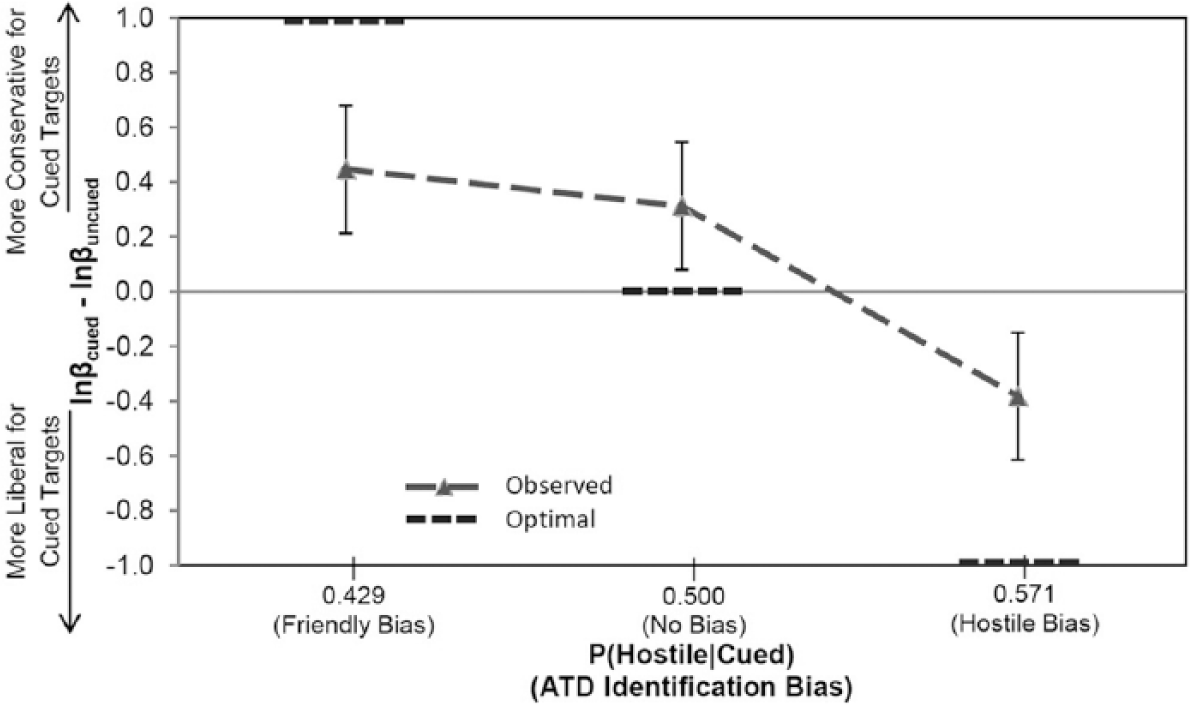
Shift in lnβ between cued and uncued targets, as a function of automatic target detection (ATD) identification bias.
Discussion
We sought to investigate the effects of less-than-perfectly-reliable ATD on detection and identification performance. Both ATD presence and cuing improved target detection, as predicted. As Yeh and Wickens (2001) observed, ATD increased the probability of a detection hit, even given a low automation hit rate, in our case, P(aH) = .70. Cued targets were detected more often than uncued targets (Glaholt, 2014; Maltz & Shinar, 2003; Tombu et al., 2016; Yeh et al., 1999). As hypothesized, ATD identification bias also affected the identification decision criterion: Participants were more liberal for cued targets when hostiles were more likely to be cued and more conservative for cued targets when friendlies were more likely to be cued. Although the identification criterion was adjusted in the right direction, participants showed a sluggish beta effect, such that the degree of adjustment was tempered relative to lnβopt.
Detection
ATD achieved its purpose: Participants detected a greater proportion of targets when ATD was available than when it was not. In the low task difficulty condition (day illumination), the human’s detection rate for the ATD-absent condition was better than the automation’s detection rate (aH = .70). Nonetheless, ATD presence increased the detection rate under day illumination (relative to ATD absence). This finding differs from the results of Maltz and Shinar (2003), who found that error-prone automation provided no target detection benefit over an unaided condition for low task difficulty (color photographs). Indeed, they found that error-prone automation produced a decrement in performance for conditions with high automation error rates. In their experiment, cues were always present and may have been distracting. In contrast, for our experiment, participants could scan the scene without the scope, and cues were presented only through the scope. The sequential scanning process may have reduced the likelihood of other potential targets interfering at any point in time (i.e., it enforced selective attention). This difference in task context (image analysis of aerial photographs vs. scanning across the azimuth of a forward field of view) may have led to the different results.
Participants detected more cued than uncued targets, suggesting that they relied on ATD aHs for detection at the expense of missing aM targets. Although participants relied on cues as aHs for detection, it appears that cues as aFAs had little negative impact and that ATD false alarms were easy to reject. Given the benefit of finding additional targets through cuing, the perceived utility of the automation (Dzindolet et al., 2001) was likely high. Although ATD aFAs were relatively frequent (averaging 0.9 aFAs per trial with ATD present), they produced only four dFAs across all trials and participants. The effect of automation error type on human performance (Wickens & Dixon, 2007) appears to depend on the task being performed. For ATD, a more liberal detection criterion (fewer aMs, more aFAs) might have improved P(dH) still further. As seen by the high dH rate given aHs and the near-zero dFA rate given aFAs, participants seemed to take advantage of ATD as a detection aid.
We also observed that the detection advantage for cued targets was greatest when the ATD was biased toward detecting hostile targets. The increased expectation of hostile identity when a target was cued appeared to increase the likelihood that the target would be detected.
Identification
Although ATD was successful as a detection aid, it also affected identification. Cued targets produced greater identification sensitivity than uncued, and ATD identification bias and cuing jointly influenced the identification decision criterion.
Tombu et al. (2016) found that cued targets were identified more accurately than uncued targets. Using an SDT approach, we found that identification sensitivity was greater for cued than for uncued targets. These advantages are inconsistent with the results obtained by Glaholt (2014), who found that cuing could negatively affect identification. Like Tombu et al., we used a scope to narrow and magnify the participants’ field of view, likely making identification easier, whereas Glaholt showed participants an unmagnified target in a background scene. Glaholt also found that when the contrast of the cues was decreased or their size was increased, identification speed increased and accuracy improved. These results suggest that differences in cue and scope characteristics affect identification performance. Although cuing improved identification sensitivity in the current study, ATD presence did not have a significant effect on d′. Thus we cannot say that ATD generally improved identification sensitivity. It is possible that more accurate ATD might have shown a main effect of ATD presence; Tombu et al. found that perfect ATD cuing improved identification accuracy.
The use of target likelihood information to adjust identification decision criterion is consistent with earlier results with decision aids for combat identification (e.g., Neyedli et al., 2011; Wang et al., 2009). The current study extended these findings, showing that the behavior of detection automation can affect identification. ATD aHs and aMs both influenced identification when ATD identification bias was considered. When aHs (cues) were more likely to occur for hostile or friendly targets, participants were more liberal (higher proportion of iHs and iFAs) or more conservative (higher proportion of iMs and iCRs), respectively. Similar adjustments to identification decision criterion also occurred for aMs.
More generally, these results imply that an automation aid for one task can affect performance on a related task. In the current study, those effects were positive, since the adjustments in identification decision criterion due to ATD bias were in the appropriate direction based on conditional probabilities. But negative outcomes are also possible. For example, Wilson et al. (2015) found that proportion of enemy targets influenced identification, with high enemy presence increasing friendly-fire incidents. Although ATD was not used in the Wilson et al. study, a biased automation aid would change the perceived proportion of hostile or friendly targets, which could have similar adverse results.
Optimal signal detection performance depends not only on signal likelihood but also on the costs and values of each outcome. Different outcomes and their relative costs and values (e.g., friendly fire compared to missing a threat) will depend on the operation and its rules of engagement (ROEs). Optimal bias as defined in the current experiment may not be considered optimal in an operational sense, since each outcome was assumed to have the same weight. If those values and costs can be quantified for a given set of ROEs, the optimal criterion can be defined to take them into account (Wickens et al., 2013). Nonetheless, the disclosure of system reliability should lead to more appropriate reliance (Wang et al., 2009) and may therefore improve the effectiveness of ATD in operations.
Task Difficulty
In this experiment, ambient illumination was used as a proxy for task difficulty, with day and night illumination representing easy and difficult conditions, respectively. Although, not surprisingly, participants detected fewer targets under night illumination, the more interesting result was that ATD reliance increased with task difficulty. For example, the effects of ATD presence and cuing were greater under night illumination, as seen in Figure 6, consistent with greater reliance on automation. Although participants relied on the cued aHs in both conditions, reliance increased with task difficulty. For high task difficulty, reliance on ATD resulted in a greater improvement to P(dH) when a target was cued but also a greater decrement when a target was not cued. When compared with no ATD, the night condition therefore resulted in a greater increase in dHs with aHs and a greater decrease in dHs with aMs than during the day. This finding is similar to results obtained by Maltz and Shinar (2003).
Task difficulty also affected identification performance: Participants showed reduced identification sensitivity and a more conservative decision criterion under night illumination. Presumably, participants were less able to distinguish friend from foe under night illumination and thus were more conservative. This finding is in keeping with doctrine and training that emphasizes the need for positive identification. We predicted increased automation reliance for identification with increased task difficulty, but this prediction was not supported. Neither cuing nor ATD identification bias interacted with illumination for either identification measure. The setting of the identification decision criterion appeared independent of sensory characteristics of the scene and scope (illumination and cuing, respectively).
Limitations
The experimental setting could not capture the rich task context faced by dismounted infantry. Soldiers in combat share information and typically have more detail about their mission than was the case here. The ratio of hostiles to friendlies will not be directly known (although is estimated) and may not reflect the 1:1 ratio used in the current experiment. Our investigation of automation reliability used equiprobable target types so that target identity likelihood would not influence the effects of the ATD bias conditions. Target likelihood and reliability information was disclosed to participants, which is similar to mission briefing information provided to soldiers prior to operations (e.g., number of enemy in area). Nonetheless, the results serve to illustrate the effects of detection automation on identification performance and show that soldiers will adjust their decision criterion for identification based on information about ATD performance.
Conclusion
Imperfect ATD improved detection accuracy, even under conditions where unaided participants performed the task better than the automation. Although ATD merely detects targets, if its identification statistics are disclosed to the observer, target identification can be improved. The decision criterion adjustments are in a direction consistent with (but not equal to) optimal bias in signal detection terms.
Key Points
Automatic target detection (ATD) is an imperfect automation aid that highlights human targets with varying reliability. We conducted an experiment in a high-fidelity combat simulator with soldiers as participants to test the effect of ATD on detection and identification performance. ATD aided detection performance and had the highest net benefit under simulated night illumination, although there were still positive effects to cuing targets under day illumination. ATD bias affected identification bias. Participants adjusted their decision criterion based on cuing likelihood.
Footnotes
Appendix
Acknowledgements
This work was supported by a Discovery Grant from the Natural Science and Engineering Research Council of Canada to the University of Toronto, titled “Design and Evaluation of Automated Decision Aids for Tactical Awareness.” The Defence Research and Development Canada (DRDC) Future Small Arms Research project supported the work conducted at DRDC. We thank Michael Tombu, Ken Ueno, and Matthew Lamb for their help in coordination of the laboratory setup and useful discussions about the methods.
Adam J. Reiner is a PhD student in the Cognitive Engineering Laboratory at the University of Toronto. He earned his MASc in mechanical and industrial engineering from the University of Toronto in 2015.
Justin G. Hollands is a defense scientist in the Human Systems Integration Section at Defence Research and Development Canada (Toronto Research Centre). He obtained a PhD in psychology from the University of Toronto in 1993.
Greg A. Jamieson is an associate professor of mechanical and industrial engineering at the University of Toronto. He received his PhD in mechanical and industrial engineering from the University of Toronto in 2002.