
Abstract
Objective:
The objective is to propose three quantitative models of trust in automation.
Background:
Current trust-in-automation literature includes various definitions and frameworks, which are reviewed.
Method:
This research shows how three existing models, namely those for signal detection, statistical parameter estimation calibration, and internal model-based control, can be revised and reinterpreted to apply to trust in automation useful for human–system interaction design.
Results:
The resulting reinterpretation is presented quantitatively and graphically, and the measures for trust and trust calibration are discussed, along with examples of application.
Conclusion:
The resulting models can be applied to provide quantitative trust measures in future experiments or system designs.
Applications:
Simple examples are provided to explain how model application works for the three trust contexts that correspond to signal detection, parameter estimation calibration, and model-based open-loop control.
Keywords
Introduction
Trust in automation has been of significant interest in the human factors/ergonomics profession in recent years. It is generally acknowledged that trust plays a major role in the use, misuse, abuse, and disuse of automation (Parasuraman & Riley, 1997). In 1988, Sheridan, in questioning whether trust in automated command-and-control systems is justified, suggested seven qualitative attributes of a trust relationship. Five of these might be deemed trustworthiness of the automation rather than properties dependent on a particular human user (reliability, robustness, explication of intent, understandability, and usefulness). Two of the trust attributes would seem to be properties of the particular human user of the automation (familiarity and dependence). Muir and Moray (1996) later proposed a somewhat similar set of six terms (reliability, competence, predictability, responsibility, and dependability) that seem likely properties of the automation, and faith as an apparent property of the human truster. Some authors would not distinguish (subjective) trust (of the automation) from trustworthiness, regarding trustworthiness to be a subjective judgment of automation trustworthiness by a particular user, whereas trustworthiness as used earlier is meant to be an objective property of the automation. The distinction need not demand further quibble, though as an aside, in the next section (and not necessarily related to the proposed model extensions), a two-dimensional plot is proposed to suggest the extremes of both variables.
Lee and Moray (1992) used a simulated orange juice pasteurization plant to study the relation between two kinds of trust (in the operator’s own manual control and in automatic control). They developed an “autoregressive moving average vector” to model continuous time-series data relating trust to performance as well as to model choice between manual and automatic control. Lee and See (2004) provided an extensive literature review as well as a qualitative model or framework. They made the important point that the notion of trust encompasses many human properties of affect. In a related vein, Sheridan (in press) suggested that because automation is steadily becoming more “intelligent,” it is reasonable to apply criteria of morality to trust in automation as well as to entertain questions of how the automation (computer) might engage in trusting or distrusting the human user. Gao and Lee (2006) presented a quantitative model of trust in automation using decision field theory to describe multiple sequential decisions for reliance in automated supervisory control situations. Hoffman et al. (2009) and Hoffman (2018) defined trust as a process rather than a state.
Hancock et al. (2011) devised an extensive scale of trust-related factors and antecedents and obtained correlations of judgments on how these related to differing classes of robots. Lyons, Stokes, Eschelman, Alarcon, and Barelka (2011) concluded from a factor analysis experiment that trust and distrust might be orthogonal properties and are independent from judged validity of trust in automation, what they call “IT suspicion.” However, when trust is analyzed in binary (two-choice trust/distrust) contexts, as in the current article, this conclusion cannot be true. Chancey, Bliss, Proaps, and Madhaven (2015) used a secondary signaling task in a flight simulator to find that measures of trust mediated poorly between system characteristics and operator response performance. Hoff and Bashir (2015) reviewed 101 papers that include 127 studies on trust in automation with the aim of sorting out factors that they then categorized with respect to the truster’s disposition, the situation, and the aspect of learning. They provided a useful taxonomy of design recommendations based on various authors’ findings that include the following design features: appearance, ease of use, communication, transparency, and level of control.
Castelfranchi and Falcone (2010) used a decision theoretic approach to characterize trust, which they claimed applies to any agent capable of having goals, beliefs, and behavior corresponding to what the truster desires. The truster’s degree of trust is modeled as a function of the truster’s belief about the credibility of the agent’s opportunity, competence, intention, performance, and persistence in executing the desired behavior (considered separately), together with utility functions for success/failure in delegation and success/failure in performance.
Trust calibration is a central issue in research on trust. Yet further quantitative models are needed for system design. McBride and Morgan (2010) provided an excellent review of trust calibration. Yeh and Wickens (2001) investigated how cue reliability and image realism affect attention allocation and trust calibration.
There is no current consensus as to how the various attributes named or used in the aforementioned articles combine into a single vector. In an organizational context, Mayer, Davis, and Schoorman (1995) defined trust as a willingness to be vulnerable to the actions of another person, based on the expectation that that person will perform a desired action. Applied to a machine, this definition would probably be as good a unitary characterization of trust in automation as currently exists. Researchers to date have typically used either rating scales or discrete (trust vs. no trust) criteria, often in dynamic judgment situations.
The purpose of this article is to propose three novel approaches to analyzing trust, based on models long available in the literature of human factors and decision science to characterize other aspects of human performance. One is a signal detection model that can be used to derive relative operating characteristic (ROC) curves for sequential binary (trust/no trust) predictions on whether automation will succeed according to given criteria. Another is a statistical parameter estimation calibration model that applies where a human supervisor must keep track of multiple variables. The revealed prior estimates of statistical properties of those variables in either training or operation are then compared with the actual measurements to give an overall quantitative representation of both bias and under- or overconfidence of (the trustworthiness of) the operator’s judgment. Finally, a Kalman estimation model is useful in supervisory control situations and can characterize how the repetitive trust-action-verify cycles determine control performance and trust as a function of loop time delays.
The Trust–Trustworthiness Relationship
The Introduction posits attributes of both trust and trustworthiness. If we assume that trust is a subjective judgment by a human, whereas trustworthiness is an objective property of the automation, we can generate cross-plots as in Figure 1. The intention here is mainly to suggest four extremes that occupy each corner of the plot. For example, “missed opportunity” is merely a qualitative result when distrust and hence disuse are followed by automation being found to be working perfectly.
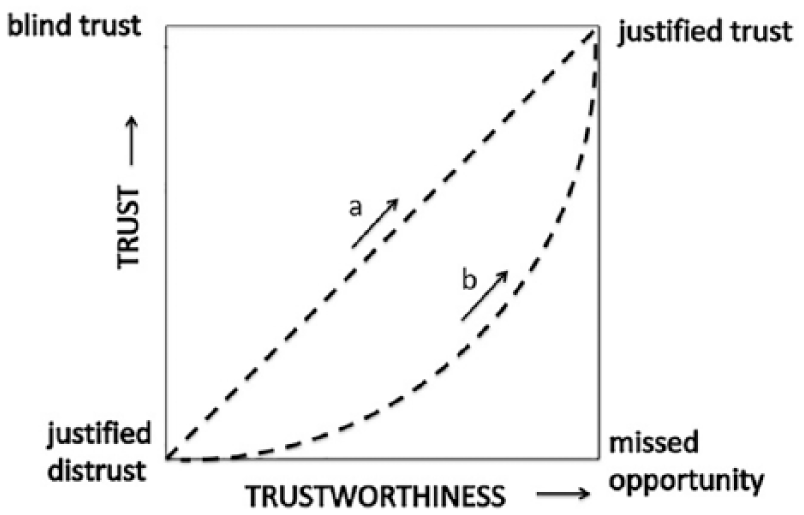
Hypothetical qualitative relations of subjective trust to objective trustworthiness.
The two hypothetical curves suggest that poorly calibrated trust (curve b) is not a linear function of automation trustworthiness (linear as in curve a) but rather is smaller than is justified for lesser and intermediate levels of trustworthiness (risk aversion) and approaches what is justified for greater levels of trustworthiness (risk and vulnerability acceptance). This hypothesis accords with the well-established risk aversion of subjective-utility judgment (Sheridan, 2017, p. 46). As calibration improves, it would become more linear (assuming some reasonable scaling, for example, probability based on repetitive binary trials). Lee and See (2004, Figure 2) provide a different but related two-dimensional plot.
Model 1: A Signal Detection Paradigm for Binary Trust Judgments
First, a summary review of the elements of signal detection theory is in order to explain how this theory relates to trust. This theory has long been used in sensory threshold tests and is the basis for radar detection of aircraft and sonar detection of submarines.
The theory assumes two probability density functions: noise alone (N) and signal-plus-noise (SN), both plotted along an axis e that is monotonic with the likelihood ratio p(e|SN)/p(e|N), where the vertical bar means “given” (Figure 2). The noise and signal are regarded to be of fixed intensity but occur under different arbitrary circumstances arrayed on the e-axis and ordered by increasing ratio of p(e|SN)/p(e|N). The decision maker is assumed to decide “signal” if e is greater than some ratio e* of signal to noise, with the expectation of rewards for true negative (TN) and for true positive (TP), and costs for missed signal (MS) and for false alarm or false positive (FA). The accepted term for available discriminability between SN and N is d′, which is the standard deviation of the distance between means of the two distributions. There is no requirement that the probability functions be Gaussian and no metric for e other than the order of the ratio p(e|SN)/p(e|N).
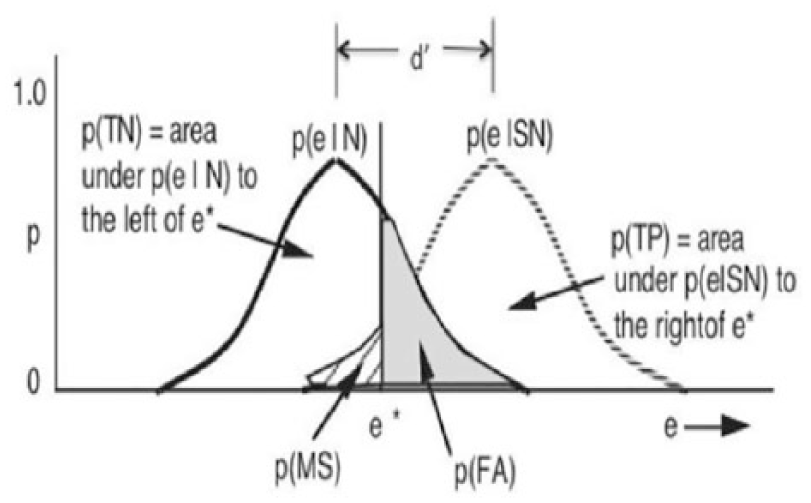
Basic assumptions of signal detection theory.
Algebraic manipulation reveals an optimum operating point e* along the e-axis beyond which one should judge “signal,” that is,
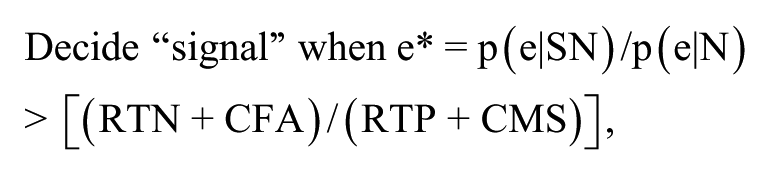
where RTN means reward for true negative, CFA means cost of false alarm, RTP means reward to true positive, and CMS means cost of a miss. See Sheridan (2017, p. 140) for the derivation. This criterion point e* is often called β (beta).
The so-called ROC curve (Figure 3) is the cross-plot, as e changes, of (vertical axis) the TP outcome probability, which is the area under p(e|SN) to the right of e* in Figure 2; and (horizontal axis) the FA probability, the area under p(e|N) to the right of e*. The ROC upper left corner represents an ideal where FA never occurs (because this perfect level of discrimination is possible only when d′ is infinite). When d′ is finite, the ROC resembles curve A. When d′ is 0, the two distributions completely overlap and there is no possible discrimination. Beta can be optimal (as noted earlier) or can be the degree to which the criterion e* is set by the decision maker according to implied subjective criteria.
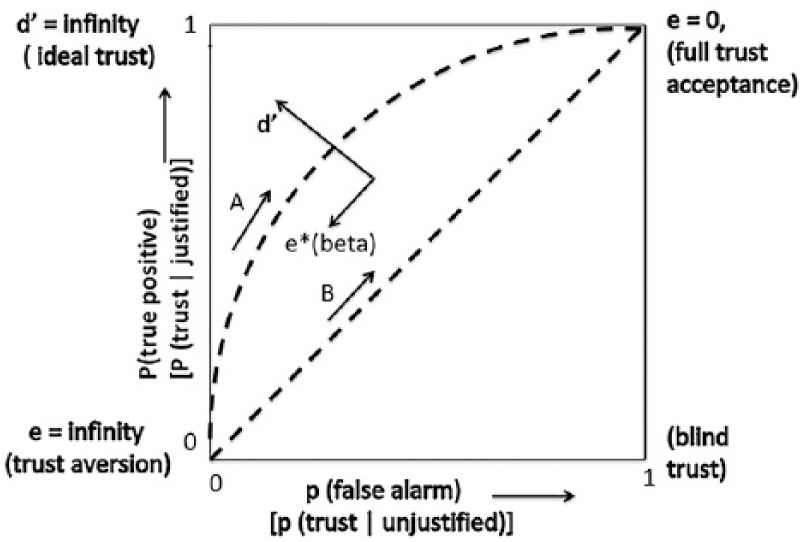
Relative operating characteristic curves of signal detection theory, with axes and corner points identified both with respect to Figure 2 and with regard to trust (lower line of labels; see text).
By examining Figures 2 and 3, one can see that setting e* toward the right of e in Figure 2 and toward the lower left corner of the ROC (independently of the optimal e*) indicates taking less FA risk but also less TP gain (because one decides “SN” for e > e*). Setting e* toward the left of e in Figure 2 and the upper right in Figure 3 incurs greater probability of TP but also greater chance of FA. In experiments with two-choice situations, one can determine where subjects set points along an ROC curve and infer where they tend to place the e* criterion.
Now perhaps the reader can sense the direct bearing of two-choice signal detection theory on the question of trust in binary (success/failure) automation situations. Verified trust (subsequent success) is the equivalent of p(TP), whereas unverified trust (subsequent failure) is the equivalent of p(FA). If you wondered what happened to MS and TN, note that p(MS) = 1– p(TP), and that p(TN) = 1 – p(FA).
From measurements over repeated trials, the ROC curve indicates the subject’s ability to calibrate trust. In Figure 3, line A indicates some trust calibration. Line B indicates zero trust calibration. Arrows on the lines A and B indicate the direction of greater trust.
Especially note that trust calibration depends on both d′ and e* (beta). With respect to trust calibration, the magnitude of d′ indicates how well the situations that lead to p(signal) are easily discriminated along the e-axis from situations that lead to p(noise). Translated to trust calibration, large d′ means that situations that lead to trust verification in automation success are easily discriminated from situations that lead to failure. And note the term situations. As stated earlier, and not always appreciated even by users of signal detection theory, the e-axis is simply an ordering of events, trials, or “situations” in terms of the ratio p(SN)/p(N). Aside from being a ratio of probabilities, the e values have no physical meaning.
While parameter d′ designates a single ROC curve and indicates discriminability, where a subject places e* (beta) along an ROC curve indicates how the subject calibrates trust with respect to the reward for automation trust-then-success (RTP), reward for distrust-then-failure (RTN), cost for trust-then-failure (CFA), and cost for distrust-then-success (CMS). These payoff values can be subjective elements within some unexpressed mental model that cannot be directly observed but can only be inferred, or can be objectively specified a priori. In the case of no objective (known) payoffs, where the beta set point occurs is a measure of level of trust.
As an example of application, such a model was employed in a trust situation by Cohen and Ferrell (1969), though at the time they did not consider it a model of trust (there was nothing called “trust research” in human factors). They conducted an experiment where car drivers made predictions of success or failure (signal or noise), corresponding to trusting or not trusting in their ability to maneuver through a narrow gate bounded by traffic cones (where knocking one down constituted failure). Subjects made such prejudgments both as passive observers and as active drivers. When monetary rewards for success were added, significant differences in ROC curves occurred between passive and active conditions, active drivers becoming more optimistic. This result accords with early research suggesting that humans trust their own abilities more than they do others’ for the same tasks (Starr, 1969).
This model can be applied whenever binary trust/no-trust judgments can be obtained followed by automation success/failure results for a series of trials sufficient to suggest the ROC curves. It provides quantification of (a) trust calibration relative to objective benefit/cost as well as (b) the ease or difficulty of making the trust decision. The two dimensions of level and ease of trust are determined by the positioning of the beta criterion on the ROC. If the payoffs are available, trust calibration relative to an ideal level of trust (objective e* or beta) can be determined. Otherwise, trust level is the position of average e* over experimental trials.
Model 2: Calibration of Trustworthiness of the Operator Based on Bias and Variability Deviations From Truth in Assessing Statistics
Calibration is a term proposed by Mendel and Sheridan (1989) as a way to summarize how the statistics parameter estimations across a variety of continuous quantitative scales compare with actual true values. The comparisons are made between both the median and statistical confidence estimates of estimated data sets, as compared with the true values of those parameters. (The 1989 work did not have “trust” in mind.)
In the context of supervising complex automation, such as a chemical process or nuclear plant, an operator must continuously keep track of multiple variables and mentally estimate their values between opportunities to make actual measurements. The proposed technique can provide an objective evaluation (calibration) of the operator’s trust in himself or herself (which could be of use during operation or in training) or be used as a measure of the operator’s judgment trustworthiness, as might be useful to the operator’s manager or trainer.
As an example, consider Figure 4, which shows how a single operator might set 5th, 50th and 95th points for a subjective probability distribution for each of three independent measures of pressure, temperature, and flow, respectively, three typical variables that must be kept track of in process automation. The gray dots represent the measured true values on each of these scales. At the bottom is a single scale that is normalized across all three variables with respect to the 5th, 50th, and 95th percentile points, as shown by the 5th and 95th bounding lines. The corresponding true values are also shown on this scale.
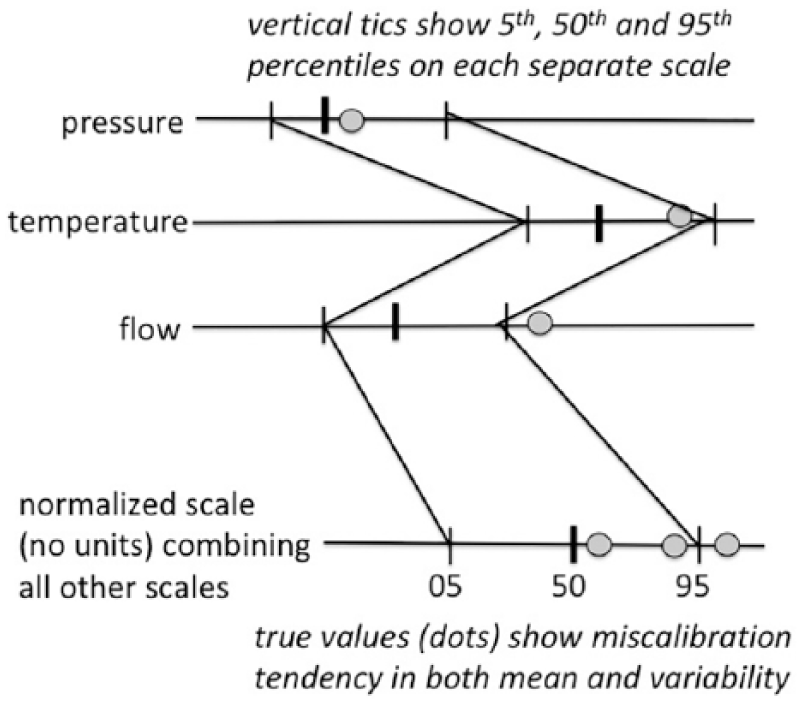
Example of calibration model of trustworthiness. Gray dots are true values.
From the normalized scale, it is seen that the subjectively judged median is consistently biased toward smaller values than the true median. (Here only three points make up that “true distribution,” but many more such judgments would build up a smooth distribution.) It is also seen that the 5th and 95th judged confidence limits are spaced wider than the distribution of the true values. In other words, this particular operator reveals an underconfidence in setting the confidence bounds. These results would thus constitute a calibration of the operator in making quantitative parameter estimates, determining both bias and overconfidence or underconfidence. There is nothing special about using 5th and 95th confidence bounds; that choice is arbitrary.
How does this procedure apply to modeling trust of the automation? Obviously, if the automation usually maintains variables close to fixed values, the operator’s confidence bounds are a simple measure of trust in the automation. But, given significant actual variability, and given that true values can ultimately be obtained for all the variables on repeated tests, the more interesting capability of the model is the normalized comparison of mean and confidence boundaries judged by the operator in comparison with the mean and variability of the true measures—thus revealing overall bias of the median and under- or overconfidence of the operator. This comparison provides a basis for a trustworthiness rating of that individual for management or training purposes.
This author has not seen such a model applied in the human factors arena. But application should be easy wherever continuous subjective estimates as well as true value data are available on a number of variables. Data can also be for time-series statistics for a single variable over different periods (as though they are different variables). Best performance is when the subjective and objective medians as well as confidence limits of the subjective and objective distributions match on the normalized scale, with no bias and neither under- nor overconfidence in estimating the statistics of the data. This result would also reflect the operator most trustworthy in assessing statistical parameters.
Model 3: Trust and Open Loop Action Justification Based on an Internal (Computer or Mental) Model, the Kalman Estimation/Control Paradigm
The Lee and See (2004) model posits a closed loop consisting of six elements (blocks): the automation itself, a display of same, information analysis and belief, trust evolution, intention formation, and reliance action (the “muscle” to make changes on the automation). Their descriptive terms are shown in bold format in the blocks in Figure 5. With verbal modification, the blocks are analogous to elements in the Kalman estimator technique common to automatic control engineering and other analyses of open-loop control (Sheridan, 1972).
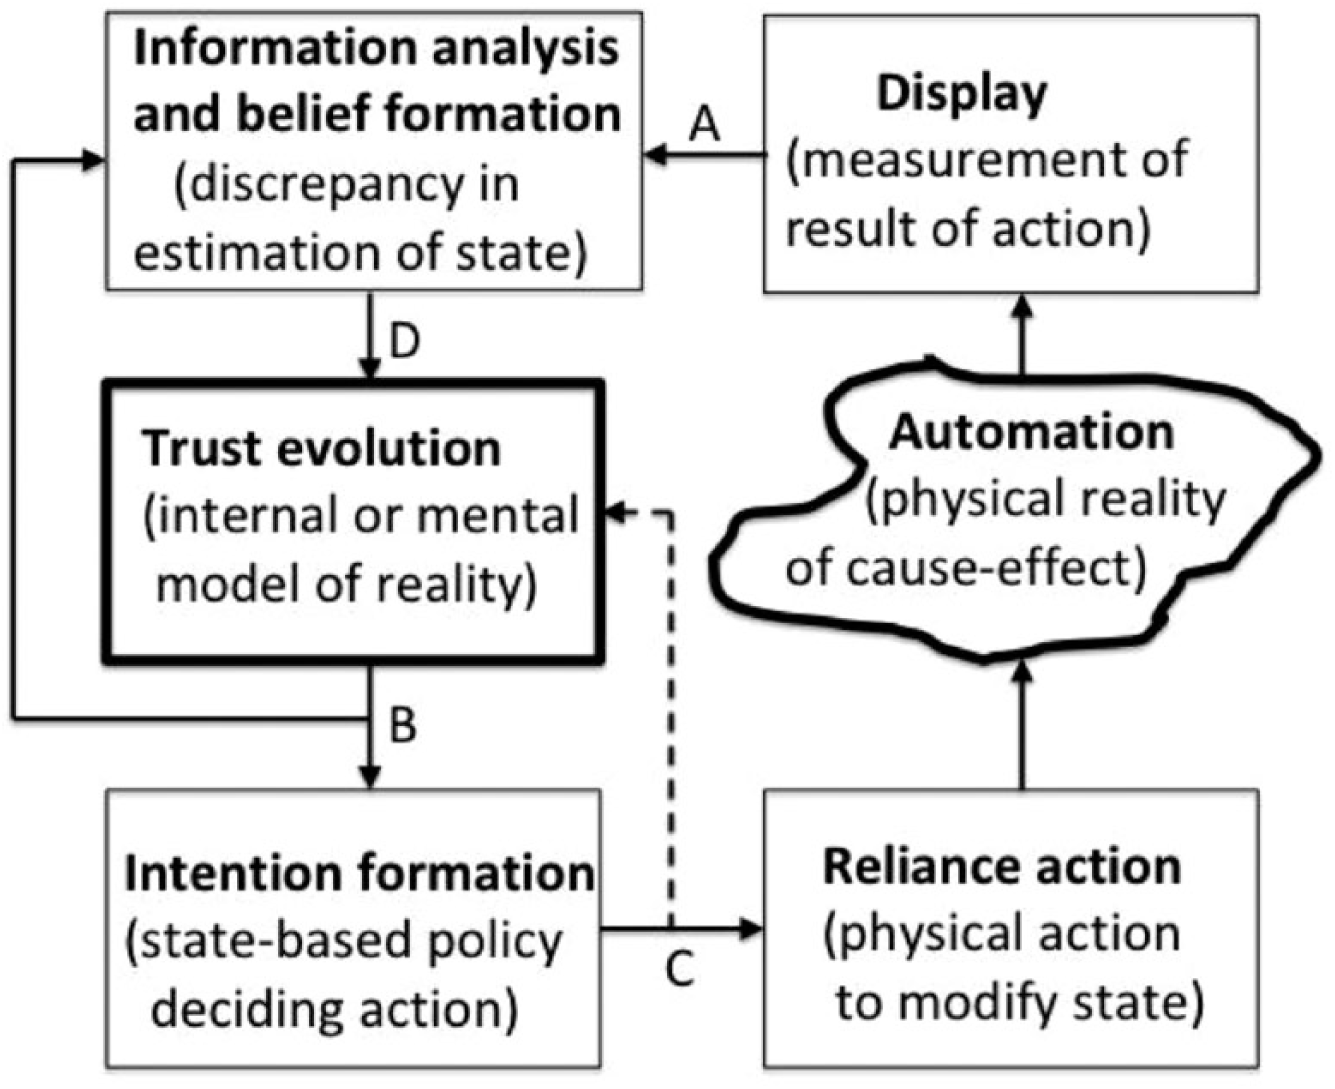
Kalman estimation/control model of trust. Shown in parentheses are modifications of terms in bold taken from Lee and See’s (2004) model.
Underneath each block in Figure 5 are words that this author has used elsewhere (Sheridan, 2017) in describing the functioning of a now-common internal-model-based control system (Kalman, 1960). Application of the Kalman system to human control is reviewed in Kleinman, Baron, and Levison (1971) and Sheridan and Ferrell (1974). Lee and See (2004) did not say so explicitly, but they may have had in mind something like the Kalman paradigm when framing their model of trust. However, I propose to make the analogy explicit. The dashed arrow is the only addition I have made to the Lee and See diagram—to make it consistent with the Kalman approach and for reasons mentioned next.
First consider how such a system performs either mechanical or human control tasks. In control theory, the blocks are instantiated with mathematical or rule-based logic (Kleinman et al., 1971). Such a system can then effect continual quantitative refinement of the internal (mental) model and resulting quantitative control of a given real process (in this case, the “automation”).
How does the Kalman system work to effect control? The bold “trust evolution” or “internal/mental model” block on the left is the best current representation of the actual automation’s “cause-effect” or input-output characteristics at any point in time (squiggly block). Based on the output of this modeled representation of the current actual automation, a set of rules (intention formation) determines what incremental action to take in adjusting (or supervising) the automation. In control theory, this set of rules is called a “control law.”
Note that there are two intermediate feedback loops: The loop from B feeds the estimated automation output state back to the upper left block, which measures the discrepancy from what the actual automation’s displayed information (A) tells (the latter may be incomplete or noisy). This A–B discrepancy forms a basis for “tweaking” (D) the internal “if–then” trust evolution model to better represent reality. The dotted loop from C (missing in Lee and See’s [2004] model) allows the internal mental model of the actual automation to anticipate based on an extrapolation estimation how the new action will modify the automation state.
Thus the internal model is continually modified based on both the anticipated effects of intention (dotted loop C) and the discrepancy (A–B) between the modeled state B and the actual (displayed) state A. To see how this model is realistic with human behavior, think of walking down stairs with one’s arms full. One cannot quite see one’s feet, so placement of one’s foot on each succeeding step is to some extent an open-loop extrapolation estimate or “dead reckoning” (C) based on trust, with the dotted feedback to update the internal model to mediate how far to trust. But from time to time, one also needs real-world confirmation (closed-loop validation, justification), requiring feedback of the discrepancy between where one thinks one’s feet are (B) and where they actually are (A).
Now consider how this model can be applied to trust in automation. Degree of trust in this case is equivalent to the size of the open-loop commitment (C) and to making this part of the modeled plan (dotted loop), where trust verification is then equivalent to how close to zero is A–B, the eventual measurable deviation from what is desired for that open-loop step. In this trust model, the control law determines whether or how far to commit to open-loop action, based on the internal model of the current state of the automation trustworthiness and in consideration of one’s vulnerability.
When applying this paradigm to modeling trust in automation, it certainly cannot be claimed that enough is known to posit differential equation transfer functions in the blocks (as is common in continuous control theory). However, what might be more realistic is to assert that there are computer-based heuristics about trust that can be determined though research. Thus, implementation of this model would require a computer to implement the actions of the various blocks (other than the squiggly automation block, or the display). The display itself can mean perfect transfer of information or can made to be noisy (e.g., to represent inattention), as is typically assumed in control theory.
In control systems, the time delays for measuring, updating, and extrapolating are normally quite short. But consider the situation where the whole operation is updated only at significantly long intervals of time. For a longer T, a longer open-loop or “dead reckoning” (trusting) decision C is taken, based on a best-available model of the automation. After T, the feedback A eventually becomes available. To the extent that B matches A, we have trust verification. The longer is T, the lower the expectation that A and B will match. This is like the child’s “game” of closing one’s eyes and trusting that one will not collide with something as one keeps walking.
One experiences this phenomenon in operating any dynamic system with either a delay T in the loop or long inertial time constants (lags). The steersman of a large ship makes discrete open-loop movements trusting that they will produce a desired result, getting verification only after significant delay because of the ship’s slow response. The same is true for operators of robots in space: Open-loop trust actions and waits for closed-loop verification (after seconds from earth orbit or hours from deep space—with hopes that the system does not overshoot with disastrous results). This situation amounts to an iteration of trust-action-verify, that is, trust-action-verify in “move-and-wait” fashion (Ferrell, 1965, who in the author’s laboratory coined that phrase in conjunction with teleoperation of lunar robots).
The Kalman system might seem more relevant to modeling trust as T gets larger and there is more time for cognitive consideration of trust criteria. Many real automation systems supervised by human operators involve this kind of iterated trusting and verification updating. In semicontinuous control of automated tools, such as saws, drills, and so on, the operator is intermittently checking visually to make sure the guidance of the cut is going properly. Aircraft pilots making waypoint settings or chemical plant operators making mixture settings may not see results for minutes or hours, and trusting criteria are far more complex. It is envisioned that this model would be useful to characterize a variety of supervisory control systems to study how trust affects sequential open-loop control actions.
Conclusion
Human subjective trust in automation, objective automation trustworthiness, and trustworthiness of operator judgment are clearly determined by many factors. Several existing human performance models appear to be applicable in different trust analysis contexts. For binary trust/no-trust judgments in binary success/failure situations, signal detection theory can be reinterpreted to model trust calibration relative to payoffs as well as difficulty in trusting. In supervisory control situations, estimates of statistical parameters, when compared with actual statistics of data sets, provide a model of the trustworthiness of the individual doing the judging. The Kalman estimation model as used in open-loop control provides a means to measure operator trust of success in planned control actions. Some examples of application are given for each model.
Key Points
Three existing models previously employed for other problems in human factors and systems engineering, namely signal detection, statistical parameter estimation calibration, and model-based control, can be used to provide quantitative modeling of trust in automation in three very different contexts.
Examples of application are provided.
Footnotes
Thomas B. Sheridan is a professor emeritus in the Departments of Mechanical Engineering and Aeronautics/Astronautics at the Massachusetts Institute of Technology. He received his ScD from MIT, and honorary doctorate from Delft University, Netherlands.