



Abstract
Objective
A method for detecting real-time changes in team cognition in the form of significant communication reorganizations is described. We demonstrate the method in the context of scenario-based simulation training.
Background
We present the dynamical view that individual- and team-level aspects of team cognition are temporally intertwined in a team’s real-time response to challenging events. We suggest that this real-time response represents a fundamental team cognitive skill regarding the rapidity and appropriateness of the response, and methods and metrics are needed to track this skill.
Method
Communication data from medical teams (Study 1) and submarine crews (Study 2) were analyzed for significant communication reorganization in response to training events. Mutual information between team members informed post hoc filtering to identify which team members contributed to reorganization.
Results
Significant communication reorganizations corresponding to challenging training events were detected for all teams. Less experienced teams tended to show delayed and sometimes ineffective responses that more experienced teams did not. Mutual information and post hoc filtering identified the individual-level inputs driving reorganization and potential mechanisms (e.g., leadership emergence, role restructuring) underlying reorganization.
Conclusion
The ability of teams to rapidly and effectively reorganize coordination patterns as the situation demands is a team cognitive skill that can be measured and tracked.
Application
Potential applications include team monitoring and assessment that would allow for visualization of a team’s real-time response and provide individualized feedback based on team member’s contributions to the team response.
Introduction
Teams consist of two or more people with interdependent roles, who come together to accomplish a shared goal (Salas, Dickinson, Converse, & Tannenbaum, 1992). When teamwork is effective, people accomplish goals that would be impossible working alone. We argue that the ability to adaptively reorganize team coordination processes, in response to novel or challenging events, is key to team effectiveness in dynamic environments (Gorman, 2014; Gorman, Cooke, & Amazeen, 2010; Gorman, Grimm, & Dunbar, 2018). The antithesis of this, the inability to adapt, is at least partially to blame for coordination difficulties on 9/11 (Kean & Hamilton, 2004), delayed response to Hurricane Katrina (Leonard & Howitt, 2006), failed emergency communications during the campus shooting at Virginia Tech (Urbina, 2007), and delays getting doctors to patients following the 2010 earthquakes in Haiti (Cable News Network, 2010; Gorman, Cooke, & Salas, 2010). Thus, methods and metrics are needed to identify real-time adaptive team reorganization to support team effectiveness in dynamic, uncertain environments. In this paper, we identify reorganization as significant changes in the pattern of communication turn-taking dynamics among team members. However, these methods allow for the analysis of team reorganization using any sequential or time series observation of team behavior.
When coordinating effectively, teams make decisions, plan, think, and act as a cognitive system (Cooke & Gorman, 2009). According to Interactive Team Cognition (ITC), team cognition resides in the coordination of information across team members through interaction (Cooke, Gorman, Myers, & Duran, 2013). ITC proposes that team cognition (1) is an activity, not a property or product; (2) must be measured and studied at the team level; and (3) is inextricably tied to context. This has led us to take a systems perspective on team cognition, wherein models and metrics are primarily focused at the level of team interaction, and individual cognition and behavior are interpreted in the context of team interaction.
By ITC Proposition 3, team cognition should be contextual and responsive to task-induced environmental contingencies. Hence, teams with high cognitive skill achieve their goals even as the environmental context varies and roadblocks to team effectiveness are encountered. Many approaches to understanding team effectiveness in dynamic environments do not address this proposition directly, often reducing team dynamics to survey responses, observer ratings, knowledge elicitation, and/or innate characteristics (e.g., Mohammed, Hamilton, Tesler, Mancuso, & McNeese, 2015; Schecter, Pilny, Leung, Poole, & Contractor, 2017; Srikanth, Harvey, & Peterson, 2016). Recently, authors such as Kozlowski and Chou (2018) have called for more bottom-up, objective, and dynamic measures of team performance to address these limitations. Along these lines, one theoretical and methodological contribution of this paper is to objectively measure the dynamics of team cognition through a team’s “general adaptive response” to unexpected perturbations during challenging training events.
The idea of a general adaptive response is that it is not ontologically committed to a particular nomological network (e.g., Burke, Stagl, Salas, Pierce, & Kendall, 2006; Marks, Mathieu, & Zaccaro, 2001) but rather a general set of characteristics regarding what it means to be skilled. Extending Thelen’s (2000) developmental theory of skill acquisition into the team domain, teams with high cognitive skill should exhibit the following characteristics:
Be adept at behaving in similar but nonidentical ways in choosing an action that fits the current situation. This requires a flexible response, perhaps similar to, but not identical with, responses used in the past.
Have consistent behavior in similar (routine) situations but be adept at reorganizing coordination patterns rapidly and appropriately in novel, nonroutine situations.
Have a repertoire of adaptive mechanisms (e.g., leadership emergence; Guastello, 2009, 2010a, 2010b; Luria & Berson, 2013; dynamic role restructuring; LePine, 2005) through which Characteristics 1 and 2 are expressed.
In this paper, we present a method to track a team’s general adaptive response in the form of communication pattern reorganization in response to training event perturbations (Characteristic 2), and we explore the method’s potential to indicate the presence of underlying reorganization mechanisms (Characteristic 3). We will demonstrate the method by tracking real-time reorganization of communication turn-taking dynamics in experienced versus less experienced medical teams and submarine crews.
There are two interpretations of “real-time” we use in this paper: (1) the processing of data as it occurs (i.e., real-time signal processing; Kuo, Lee, & Tian, 2013) and (2) the genesis of a general adaptive response as team members reorganize their interaction patterns in situ during a critical event. The latter interpretation implies the analysis can be performed after data collection, so long as interaction data are analyzed in the context of how they actually unfolded. We focus on the second interpretation in the following sections but return to the signal processing interpretation during methods and discussion.
Theoretical and Measurement Underpinnings of Team Cognition in Dynamic Environments
The dynamics of individual-level inputs and team-level responses has been a central issue in team cognition research. Team cognition has traditionally been modeled as a linear relationship linking inputs (e.g., team-member knowledge), processes (e.g., team interaction), and outputs (e.g., team products, team outcomes) (Cooke, Gorman, & Winner, 2007). This approach is rooted in social psychological theories that hypothesize individual → group process models that transform individual-level inputs into group-level outputs (Davis, 1973; Steiner, 1972). Input → process → output (Hackman & Morris, 1975) and, more recently, input → mediator → output → input (Ilgen, Hollenbeck, Johnson, & Jundt, 2005) frameworks extend this perspective into the team domain, where iterating the input → process → output framework over sequential and overlapping team goals is thought to capture temporal dynamics (Marks et al., 2001). It has been proposed, however, that the dynamics of individual-level behavior under team-level constraints, which distinguishes team cognition from other forms of cognition, are better characterized using nonlinear dynamical systems (Gorman, Dunbar, Grimm, & Gipson, 2017; for example, complex adaptive systems; Arrow, McGrath, & Berdahl, 2000; Ramos-Villagrasa, Marques-Quintero, Navarro, & Rico, 2018). According to this approach, a priori knowledge of the parts (i.e., inputs, processes, and outputs) does not equate to knowledge of system-level (i.e., team level) performance in dynamic environments because systems (teams) continuously self-organize new arrangements of parts as they adapt to the changing environment.
At issue is the question of how individuals coordinate their knowledge and behavior to perform effectively as a team in dynamic environments. Shared cognition approaches (DeChurch & Mesmer-Magnus, 2010; Healey, Vuori, & Hodgkinson, 2015) derive from input → process → output and organizational psychology theories of team cognition. Shared cognition combines inputs such as mental models (Cannon-Bowers, Salas, & Converse, 1993; Rouse, Cannon-Bowers, & Salas, 1992), assertiveness (Wilson, Burke, Priest, & Salas, 2005), and self-efficacy (Marks, 1999) with process factors, such as implicit coordination (MacMillan, Entin, & Serfaty, 2004), backup behaviors (Smith-Jentsch, Kraiger, Cannon-Bowers, & Salas, 2009), mutual performance modeling (Wilson et al., 2005), and leadership (Burke, Stagl, Klein, et al., 2006), and emergent states, such as motivational and affective team states (DeChurch & Mesmer-Magnus, 2010) using the iterated input → mediator → output → input framework. In this light, team cognition is somewhat reducible to understanding how these factors, among others, combine to predict team performance. This does not solve the complex adaptive systems problem, however, that team cognition is not reducible to its parts or factors. Due to the inherent complexities of these systems, changing one factor can impact other aspects of team cognition in unforeseen ways (Gorman, Demir, Cooke, & Grimm, 2019). Therefore, we must consider how team cognition emerges from the simultaneous organization of individual-level inputs, team-level constraints, and environmental contingencies.
In dynamic environments, the environment, in no small part, drives team cognition, such that team member cognition and behavior must be interpreted in the context of both the changing task environment and team dynamics (Cooke et al., 2013; Gorman, Amazeen, & Cooke, 2010). We take the perspective that the coordination of individual-level inputs during a team-level response can take innumerable forms, including the various mechanisms cataloged by shared cognition (e.g., backup behaviors, assertiveness, leadership). This necessitates a generative, bottom-up modeling approach capable of capturing all forms of team reorganization, whatever the underlying mechanism, by simultaneously tracking individual-level inputs and team-level dynamics in response to the changing task environment.
Measuring Real-Time Team Cognition
At the individual level, team cognition involves being able to mentally simulate and predict another person’s thoughts, actions, and perhaps attitudes without having to explicitly ask or be told about them (Espinosa, Lerch, & Kraut, 2004). For example, if Beth works with Joe and Bill preparing meals in a restaurant, over time they develop knowledge and expectations that allow them to coordinate effectively by anticipating each other’s actions (implicit coordination; Butchibabu, Sparano-Huiban, Sonenberg, & Shah, 2016). This aspect of team cognition traditionally focuses on knowledge and processes contained in the head of the individual and builds on shared cognition (Cannon-Bowers & Salas, 1990; Cannon-Bowers et al., 1993), joint action theory (Sebanz, Knoblich, & Prinz, 2003), and macrocognition in teams (Fiore et al., 2010), but we will focus on measuring how individual-level inputs dynamically contribute to a team response (e.g., Guastello & Guastello, 1998) by modeling how they unfold in real time.
At the team level, team cognition is the cognition that occurs while a team is interacting (Gorman et al., 2017; Guastello & Guastello, 1998), which is manifested in team-member interaction (Cooke, 2015). From this perspective, when Beth performs a task with Joe, their thoughts, actions, and attitudes are continuously shaped by their interactions. However, Beth’s thoughts, actions, and attitudes would have been shaped differently if she performed the same task with Bill rather than Joe. Thus, team interaction introduces psychological constraints on the individual that cannot be known by studying the individual in isolation, but only as they interact with others (compilational emergence; Kozlowski & Klein, 2000). Moreover, because teams must continuously alter their interaction patterns and/or team members to address changing task demands, the team-level aspects of team cognition are inherently dynamic (Dooley, 1997; Gorman, Grimm, & Dunbar, 2018; Guastello, 2010a).
Real-time team cognition is concerned with understanding how the individual-level inputs and team-level dynamics become intertwined by tracking how teams reorganize in response to changing task demands and unexpected perturbations. In this paper, we describe methods for tracking these dynamics and further propose that by tracking individual-level inputs and filtering them from team-level responses post hoc, the method differentiates the individual-level inputs that account for team reorganization. For example, if a fire breaks out in the kitchen, Beth might emerge as a leader by verbally coordinating the team response. In our approach, this would be detected first as a significant communication reorganization at the team level in response to the fire and subsequent filtering at the individual level would indicate that Beth’s inputs accounted for the reorganization.
The Current Studies
The purpose of the current set of studies was to analyze communication patterns using a nonlinear prediction algorithm to detect significant reorganizations in response to training event perturbations. We hypothesized that teams reorganize their interaction patterns in real time to deal with threats to team effectiveness, such that training event perturbations would cause significant communication reorganization, but routine training conditions would not. To test this hypothesis, we analyzed communication turn-taking data from experienced neurosurgical and medical student teams and experienced and less experienced submarine crews that were confronted with unexpected challenges during training scenarios. Based on Characteristic 2 from the introduction, we predicted that more experienced teams would have more timely and effective responses.
When we detected a significant reorganization, we filtered the team response based on the mutual information between team member’s communication inputs to identify the individual(s) whose inputs most substantially accounted for the reorganization. The method automatically detects significant reorganizations and individual-level inputs using objective speech (turn taking) data, which is content free. Therefore, to qualitatively analyze the nature of reorganization, we relied on transcript content to infer potential individual-level mechanisms underlying reorganization (e.g., leadership emergence; see Characteristic 3 from the introduction).
Study 1: Medical Teams
Method
Participants
Communication transcripts were obtained from medical simulations using four experienced neurosurgical teams (three-to-five members each) and four medical student teams (two-to-three members each). Sample size was limited by the requirement for participants with appropriate levels of education and experience. Experienced teams consisted of practicing surgeons, anesthesiologists, nurses, and standardized participants (i.e., paid actors who play the role of medical team members). Medical student teams consisted of third and fourth year medical students with no a priori specialization (e.g., surgeon vs. anesthesiologist) who had completed their internal medicine clerkship. Teams were recruited to perform training simulations at the JUMP Simulation Center in Peoria, IL. This research complied with the American Psychological Association Code of Ethics and was approved by the Georgia Institute of Technology institutional review board (IRB).
Medical simulations
JUMP Simulation Center is a high-fidelity medical training facility that contains a surgical suite and other clinical spaces. In simulations involving experienced teams, the simulated operating room (OR) was equipped for neurosurgical and anesthesia care. The simulation space was equipped with state-of-the-art equipment for resuscitation and emergency care during medical student simulations. Each simulation was composed of briefing, scenario, and debriefing. Simulations focused on aspects of the surgical and emergency care process, and scenarios were designed to test technical and teamwork skills (details provided later in results).
Measures
We used discrete recurrence plots (Dale, Warlaumont, & Richardson, 2011; Gorman, Cooke, Amazeen, & Fouse, 2012; Webber & Zbilut, 2005) to calculate determinism (%DET; Webber & Zbilut, 2007), which ranges from 0 %DET (completely random pattern) to 100 %DET (perfectly repeating pattern), and has been used successfully in the past to detect system transitions (Marwan, Schinkel, & Kurths, 2013), including changes in team communication dynamics (Gorman et al., 2012). Figure 1 shows an example recurrence plot of a time series of length N = 23. The numerical symbols in Figure 1 are meant to correspond to a symbolic time series sampled at 1 Hz, as in the current studies. The time series is first lined up against itself along the columns and rows of a symmetric matrix, similar to a correlation matrix, and then a recurrent point is filled in whenever a symbol repeats. Note that the main diagonal is completely filled in, because it is the time series plotted against itself at time n = n. More interestingly, recurrent points forming diagonals off the main diagonal correspond to patterns, which form when data segments at one time match data segments taken from earlier and later times (March, Chapman, & Dendy, 2005). There are two patterns in Figure 1, 4→ 7 → 2 → 0 → 12 and 3 → 1 → 5 → 4. %DET is calculated as the number of recurrent points forming patterns (diagonals off the main diagonal) divided by the total number of recurrent points times 100 (Equation 1). Because the matrix is symmetric, only the upper triangle is analyzed. In Figure 1, %DET = 9/14 × 100 = 64, which quantifies the amount of patterning in the example time series:


Example recurrence plot: Recurrent points are plotted whenever a numeric symbol at one time matches a symbol at another time. Because the matrix is symmetric, only the upper triangle is analyzed. Diagonals of recurrent points off the main diagonal correspond to patterns that repeat in the time series. For example, the pattern 4 → 7 → 2 → 0 → 12 occurs early in the time series and then repeats at the end of the time series.
Discrete recurrence is simpler than classic recurrence quantification analysis (Webber & Zbilut, 2007), because it assumes that the embedding dimension (i.e., the number of dynamical degrees of freedom [position, velocity, acceleration, etc.] underlying time series observations; Abarbanel, 1996) equals 1 (i.e., only position is needed), and the distance for identifying points similar enough to be classified as recurrent points is 0 (i.e., only exact symbol matches are counted; Webber & Zbilut, 2005). Because embedding dimension is always 1, the method does not require attractor reconstruction, which is a computationally intensive procedure for finding the embedding dimension of the dynamical system that generated the time series (Abarbanel, 1996). These features make discrete recurrence computationally efficient for real-time signal processing in the future.
Each medical team transcript, comprised of briefing, scenario, and debriefing, was first represented as a turn-taking time series of who was speaking at each second (1 Hz). Each team member and the instructor were identified by a unique numerical symbol, and a null value (0) identified times when no one was speaking. There were no speaker overlaps in the transcripts. Each time series was analyzed by sliding a centered moving window (size N = 120 s; step size = 1 s) across the time series and recomputing %DET with each window update (Figure 2). The concept of windowing and window size is analogous to taking successive samples of data points (here, N = 120 consecutive data points) and computing a new value of %DET for each new sample until you reach the end of the time series, and this technique has been successful in identifying phase transitions in team collaboration (Wiltshire, Butner, & Fiore, 2018). This resulted in a moving window %DET time series that was 120 s shorter than the original turn-taking time series (there were 60 zero-padded observations at the beginning and 60 observations truncated from the end due to the centered windowing procedure). Previous research revealed the method to be robust across a range of window sizes but that window sizes smaller than the size used here tend to reduce the temporal precision of perturbation detection (Grimm et al., 2017).
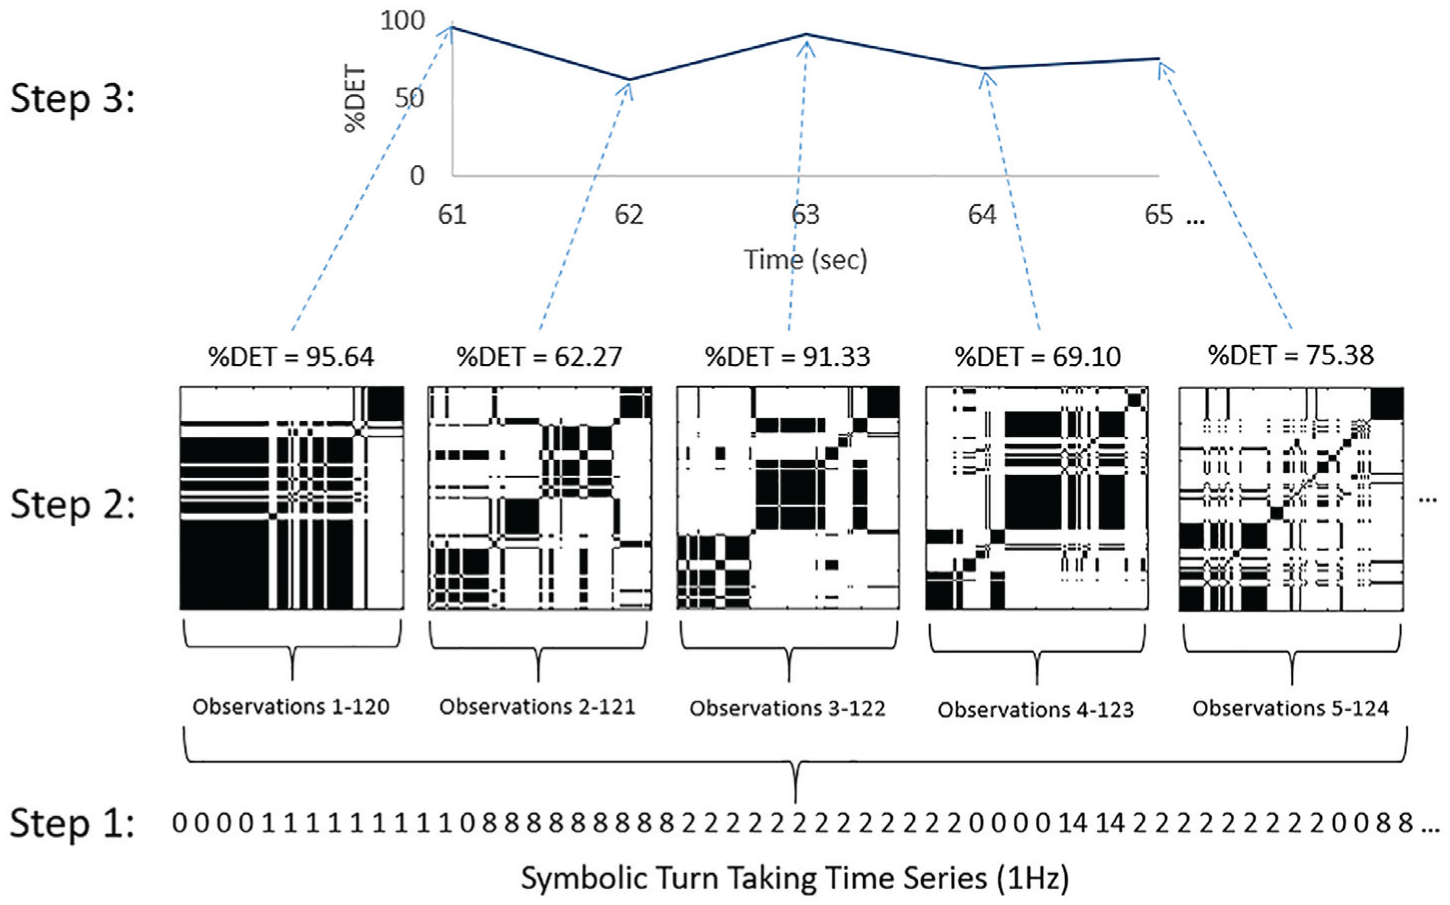
Illustration of the steps for obtaining a communication reorganization time series. Step 1: Collect speaker turn-taking time series (1 Hz), where each team member is represented by a unique numerical symbol (0 = no one speaking). Step 2: Continuously update the discrete recurrence plot by sliding a centered moving window over the time series and recompute percent determinism (%DET) with each window update. Step 3: Plot moving window %DET to obtain the reorganization time series.
The %DET time series tracks communication reorganization, as teams transition from a previously stable communication pattern (higher %DET), to a new, unstable pattern (lower %DET), and settle into the new pattern over time (return to higher %DET; see Hollis, Kloos, & Van Orden, 2009, and Van Orden, Moreno, & Holden, 2003, for similar concepts at the individual level and Scheffer et al., 2009, for a general review of critical phenomena at phase transitions). We calculated another measure, speech activity, as the percent nonnull values at each window update (i.e., number of nonnull observations/120 at each window update) to ensure communication reorganizations coincided with actual speech activity and not periods of silence (i.e., sequences of null values).
We then used Kantz and Schreiber’s (1997) nonlinear prediction algorithm to measure the statistical significance of communication reorganizations in terms of nonlinear prediction error (NLPE). This method operates directly on the %DET reorganization time series and does not require attractor reconstruction. In essence, this method takes the current observation, scans all prior observations to find similar values, and then forms a prediction of what the current trajectory of the system should look like based on prior observations. Prediction error measures the degree to which the observed trajectory is different from the predicted trajectory. If the prediction error is large enough with respect to a statistical significance criterion, then we say that the system has undergone a significant reorganization.
For a communication reorganization time series, the algorithm assumes that future states are deterministically related to past states plus noise, such that communication reorganization is a continuous dynamical system. Using this approach, we took a point of reference in the time series, xN, and identified all previous points xn (n = 1, 2, . . ., N– 1) that fell within a distance ε of xN, where ε represents the noise factor. For all xn within ε of xN, we formed a prediction window, xn+Δn, to be compared with the current evolution of the process, xN+Δn. Rather than randomly choosing one of the xn+Δn, we calculated the ensemble average, ‹xn+Δn›, for comparison (a minimum number of neighbors is not required). We then calculated the root mean square error (RMSE) between the current trajectory, xN+Δn, and the predicted trajectory, ‹xn+Δn›, where higher RMSE values correspond to higher prediction error and, hence, greater reorganization. We continuously updated RMSE using the same sliding window technique as for %DET to track significant reorganizations over time. Figure 3 illustrates the NLPE method.

The left panel illustrates the calculation of NLPE based on prior observations (xn; n = 1, 2, . . .) that fall within a distance ε of the reference point (xN), peaks in RMSE between the observed trajectory (xN+Δn), and predicted trajectory (‹xn+Δn›) indicate system reorganization. The right panel illustrates these concepts using actual data. NLPE = nonlinear prediction error; RMSE = root mean square error.
Assuming a normal RMSE distribution, mean skew = .70, mean kurtosis = .18, χ2(2) = .52, p > .05, for medical teams; mean skew = .81, mean kurtosis = .17, χ2(2) = .68, p > .05, for submarine crews (D’Agostino & Stephens 1986), we defined significant communication reorganizations as RMSE values that fell either 1.65 (α = .05) or 2.33 (α = .01) standard deviations beyond the mean RMSE value (one-tailed). We used the mean RMSE value over the whole time series because it allows us to detect “globally” rather than “locally” significant reorganizations; however, a continuously updated, sliding window criterion will be necessary for real-time signal processing in the future. We set ε = 3 %DET to maximize perturbation detection (Grimm et al., 2017) and Δn = 20 s to match the functional timescales of behavior observed in these studies (i.e., tens-of-seconds to minutes).
To determine which individual-level inputs drove team-level reorganization, we used average mutual information (AMI; Abarbanel, 1996; Cover & Thomas, 2006). AMI is calculated between symbols xi from series (set) X and symbols yj from series (set) Y. If a symbol from X is independent from a symbol from Y, then PXY(x,y) = PX(x)PY(y), and mutual information is 0. The average over all symbols is AMI (Equation 2), which becomes larger as symbolic time series become more dependent. In information theoretic terms, AMI quantifies the average amount of uncertainty in one pattern (one team member’s time series) is reduced by having knowledge of another pattern (another team member’s time series) measured in bits:

We isolated each team member’s turn-taking time series, paired it with each of the other team member’s turn-taking time series, calculated AMI between pairs using the same sliding window technique described previously (size = 120 s; step size = 1 s, lag = 0, bin size = 10), and summed the results over all pairs. This resulted in a total AMI time series for each team member relative to all other team members that tracks how much each individual’s turn-taking behavior tells us about all other team member’s turn-taking behavior (Gorman et al., 2012). We analyzed total AMI to determine which team members accounted for the most mutual communication information during significant reorganizations. Similar to speech activity at the team-level, we calculated individual speech activity as the percent nonnull values in each team member’s turn-taking time series at each window update to ensure that total AMI peaks coincided with actual speech at the individual level.
Guided by the AMI results, we identified which team member inputs drove significant communication reorganizations using post hoc filtering. In theory, real-time team cognition is a continuous top-down, bottom-up interaction between team-level and individual-level processes (Hollis et al., 2009; Van Orden et al., 2003), such that controlling for one side of the relationship (individual level) reveals organizational details of the other side (team level). To accomplish this, we selectively filtered team members from the overall turn-taking time series by replacing their unique numerical code(s) with the null value (0) and then recomputed communication reorganization. We used total AMI peaks to guide filter selection to ensure that filtering was informed by a holistic analysis of team communication information. The logic behind filtering is that if removing a team member (or team members) eliminates the significant reorganization, then those team member inputs accounted for the reorganization.
Procedure
Team members arrived, were presented with information about the simulation, and provided informed consent. Although communication data are reported, another purpose of the project was to examine team neurodynamics (Stevens & Galloway, 2017; Stevens, Galloway, Halpin, & Willemsen-Dunlap, 2016; Stevens, Galloway, & Willemsen-Dunlap, 2018). Thus, team members wore electroencephalography headsets throughout participation (neurophysiological data are not reported here). Team members then entered the simulation space and were briefed by the instructor on patient status and other scenario-specific information. The simulated patient was a mannequin capable of speech, breathing movements, and sounds, which also provided scenario-specific information. Teams then performed their scenario. During this time, the instructor was present to provide supporting information concerning physical exam findings that could not be exhibited by the mannequin. Following the scenario, the instructor debriefed the team using a standardized good judgment approach (Rudolph, Simon, Dufresne, & Raemer, 2006) and thanked them. Participation lasted 45 min or longer.
Results and Discussion
Experienced teams had significantly lower communication reorganization (%DET) variability (mean SD = 9.55) than medical student teams (mean SD = 12.13), t(6) = 5.52, p < .01, d = 3.89, but did not differ in terms of mean reorganization. However, our primary analyses focus on communication reorganization time series graphs and how significant peaks in RMSE coincided with perturbations. We determined reorganization significance by plotting a confidence line on each RMSE graph; when RMSE extended above the line, the reorganization was significant. The value at which confidence lines were plotted were found using a one-tailed t distribution at the α = .05 (tcritical = 1.65) and α = .01 (tcritical = 2.33) levels using the upper confidence limit (UCL) formula, UCL = MRMSE+ (tcritical) (SDRMSE). Given that all RMSE time series had N > 900 observations (i.e., df≈∞), we held tcritical values constant across graphs. Total AMI’s for each team member are graphed below reorganization and RMSE to inform post hoc filtering. We used transcript content to contextualize the reorganization outcomes in each graph, including potential reorganization mechanisms, which we present in narrative format in the description of each graph. Following the presentation of each team’s reorganization graph, we present a table that summarizes the findings across all graphs.
Figure 4, top (first experienced team), shows a significant peak in RMSE (p < .01) starting at 1,061 s. This significant communication reorganization corresponded to a fire in the OR that occurred at 1,051 s. During this time, the surgeon and registered nurse (RN) localized the source of the fire (electrosurgical cautery machine) and coordinated patient evacuation. Figure 4, bottom, illustrates that the surgeon and RN accounted for communication patterning during this time, such that filtering their inputs from the overall turn taking time series eliminated the significant reorganization (Figure 4, top).

Top: Communication reorganization (%DET) and RMSE for the first experienced team showing a significant communication reorganization (p < .01) in response to a fire in the OR. The bold black trace from 895 to 1,139 s shows the team response after filtering the surgeon and RN. Bottom: Total AMI scores indicate that the surgeon and RN accounted for communication patterning during the perturbation (dashed lines are individual speech activity). In both plots, vertical dashed lines indicate scenario beginning (larger dashes) and ending (smaller dashes). RMSE = root mean square error; OR = operating room; AMI = average mutual information; RN = registered nurse.
Figure 5, top (second experienced team), shows a significant peak in RMSE (p < .01) at 650 s. This significant communication reorganization corresponded to a change in team members to simulate team members coming and going. The instructor first notes there is an extra team member (a practicing anesthesiologist) at 645 s, which is followed by another team member (a standardized participant portraying an anesthesiologist) complaining of illness at 742 s, after which the practicing anesthesiologist replaces her. Figure 5, bottom, indicated that the instructor, standardized participant, and surgical technician, who was interacting with the instructor concerning another matter, accounted for communication patterning during this time. However, filtering the instructor and standardized participant indicated that the instructor contributed largely to the initial part of the reorganization, and the standardized participant contributed to the latter part of the reorganization. Another perturbation occurred at 977 s, when the patient seized, and ended at 1,228 s, when the team stabilized the patient. However, the method did not detect a significant reorganization in response to this event. Figure 5, bottom, shows high speech activity for the anesthesiologist; however, that speech carried little information, in terms of total AMI, about the team’s communication patterns.

Top: Communication reorganization (%DET) and RMSE for the second experienced team showing a significant communication reorganization (p < .01) in response to changing team members. The bold traces from 630 to 800 s show the team response after filtering either the instructor or standardized participant. The horizontal dashed line is an undetected patient seizing perturbation. Bottom: Total AMI scores indicate that the instructor, standardized participant, and surgical technician accounted for communication patterning during the reorganization (dashed lines are individual speech activity). In both plots, vertical dashed lines indicate scenario beginning (larger dashes) and ending (smaller dashes). RMSE = root mean square error; AMI = average mutual information.
Figure 6, top (third experienced team), shows two significant RMSE peaks. The first significant peak started at 546 s (p < .01). It corresponded to the instructor and team members discussing the simulation environment and team-member introductions during the transition from briefing to scenario. This reorganization was unexpected, because it corresponded to introductions and scenario planning, rather than a perturbation. Filtering team member inputs indicated that the instructor contributed more strongly early in the reorganization, and the circulating nurse and anesthesiologist contributed more strongly later in the reorganization. The second significant RMSE peak (p < .01) starting at 1,354 s was in response to a fire in the OR at 1,353 s. During this time, the anesthesiologist noticed the fire, shut down the oxygen, called for an alarm, and coordinated patient evacuation. Figure 6, bottom, confirms that the anesthesiologist accounted for communication patterning during this time, such that filtering the anesthesiologist eliminated the significant reorganization (Figure 6, top).

Top: Communication reorganization (%DET) and RMSE for the third experienced team. The first significant peak in RMSE (p < .01) was a false positive due to a nonprocedure-related conversation at the beginning of the scenario. The bold traces from 467 to 673 s show the team response after filtering either the instructor or the circulating nurse and anesthesiologist. The second significant communication reorganization (p < .01) is in response to a fire in the OR. The bold black trace from 1,286 to 1,467 s shows the team response after filtering the anesthesiologist. Bottom: Total AMI scores indicate that the instructor, standardized participant, and anesthesiologist accounted for communication patterning during the first reorganization and the anesthesiologist accounted for communication patterning during the second reorganization (dashed lines are individual speech activity). In both plots, vertical dashed lines indicate scenario beginning (larger dashes) and ending (smaller dashes). RMSE = root mean square error; OR = operating room; AMI = average mutual information.
Figure 7, top (fourth experienced team), shows a significant peak in RMSE (p < .01) starting at 920 s. This significant reorganization corresponded to tachycardia following a local anesthetic (Lidocaine) injection at 908 s. During the reorganization, the surgeon directed the team to stop the procedure and shifted the team’s focus to restoring a normal pulse. Figure 7, bottom, indicates that the surgeon, scrub nurse, and anesthesiologist accounted for communication patterning during the reorganization. However, the high levels of AMI for the scrub nurse were due to assisting the anesthesiologist in administering a drug (Dantrolene) for the remainder of the scenario rather than coordinating the initial response. Indeed, as shown in Figure 7, top, filtering the surgeon, rather than the anesthesiologist or scrub nurse, more fully accounted for the significant reorganization.

Top: Communication reorganization (%DET) and RMSE for the fourth experienced team showing a significant communication reorganization (p < .01) in response to a tachycardia. The bold traces from 870 to 970 s show the team response after filtering either the surgeon, anesthesiologist, or scrub nurse. Bottom: Total AMI scores indicate that the surgeon, anesthesiologist, and scrub nurse accounted for communication patterning during the reorganization (dashed curves are individual speech activity). In both plots, vertical dashed lines indicate scenario beginning. RMSE = root mean square error; AMI = average mutual information.
Figure 8, top (first medical student team), shows a significant peak in RMSE (p < .01) at 56 s. This significant communication reorganization corresponded to the patient’s allergic reaction to a tetanus shot prior to arriving in the emergency room for the briefing (i.e., at 1 s). During this time, the medical students discussed potential diagnoses but were unable to determine the cause until the mannequin revealed it had just received a tetanus shot. Figure 8, bottom, indicates that all three medical students accounted for communication patterning during the reorganization, such that filtering any (or all) of the students eliminated the significant reorganization (Figure 8, top).

Communication reorganization (%DET) and RMSE for the first medical student team showing a significant communication reorganization (p < .01) in response to an allergic reaction. The bold black trace from 61 to 108 s shows the team response after filtering the medical students. Bottom: Total AMI scores indicate that all three medical students accounted for communication patterning during the reorganization (dashed curves are individual speech activity). In both plots, vertical dashed lines indicate scenario end. RMSE = root mean square error; AMI = average mutual information.
Figure 9, top (second medical student team), shows a significant peak in RMSE (p < .05) starting at 539 s, a delayed response to a patient seizing perturbation at 423 s. During the communication reorganization, a simulated RN and Medical Student 2 first tried to determine the proper medication, which was followed by Medical Student 1 assisting by attempting to call Neurology for help. This corresponds to Figure 9, bottom, which indicates that simulated RN and Medical Students 1 and 2 accounted for communication patterning during the reorganiza-tion. Hence, this team demonstrated difficulty deciding an appropriate course of action. In agreement with the sequence of events in the transcript, separately filtering team member inputs indicated that the simulated RN and Medical Student 2 contributed more strongly early in the reorganization, and Medical Student 1 contributed more strongly later in the reorganization.

Top: Communication reorganization (%DET) and RMSE for the second medical student team showing a significant communication reorganization (p < .05) as a delayed response to the patient seizing. The bold traces from 490 to 697 s show the team response after filtering either the simulated RN and Medical Student 2 or Medical Student 1. Bottom: Total AMI scores indicate that the simulated RN, Medical Student 1, and Medical Student 2 accounted for communication patterning during the reorganization (dashed curves are individual speech activity). In both plots, vertical dashed lines indicate scenario beginning (larger dashes) and scenario ending (smaller dashes). RMSE = root mean square error; RN = registered nurse; AMI = average mutual information.
Figure 10, top (third medical student team), shows a significant peak in RMSE (p < .05) starting at 465 s. This is a delayed response to respiratory depression that occurred at 413 s. During the first reorganization, the team members were trying to wake the patient to determine the cause of the problem. Subsequently, the team began manually pumping oxygen but were unable to determine the cause of respiratory depression. The second significant peak in RMSE (p < .05) occurred at 1,135 s when the team discovered that oxygen tubing on the respirator had been disconnected and reconnected the tubing. Thus, the team successfully overcame the perturbation but, as the reorganization time series shows, the response was somewhat delayed, spanning two significant reorganizations 720 s from perturbation onset. Figure 10, bottom, indicates that both medical students accounted for communication patterning during the reorganizations, such that filtering any (or all) of the students eliminated the significant reorganizations (Figure 10, top).

Top: Communication reorganization (%DET) and RMSE for the third medical student team. The two significant communication reorganizations (p < .05) correspond to a respiratory depression perturbation caused by disconnected oxygen tubing. The bold black traces from 443 to 590 s and 1,110 to 1,257 s show the team response after filtering both medical students. Bottom: Total AMI indicates that both medical students accounted for communication patterning during the reorganizations (dashed curves are individual speech activity). In both plots, vertical dashed lines indicate scenario beginning (larger dashes) and scenario ending (smaller dashes). RMSE = root mean square error; AMI = average mutual information.
Figure 11, top (fourth medical student team), shows two significant communication reorganizations across two scenarios. The first significant peak in RMSE (p < .05) at 60 s occurred after the team was informed by the instructor that the patient was unresponsive as the scenario began at 41 s. This training event involved determining which drug(s) the patient ingested. During this time, the team applied a bag valve mask to the patient while trying to counteract the unknown drug(s) until the instructor ended the scenario at 415 s. The second significant peak (p < .05) started at 1,372 s, after the team injected the patient with Flumazenil at 1,367 s, and the patient began seizing. During this time, the team again applied a bag valve mask to the mannequin and requested medication from the pharmacy to counteract the seizure. The team was able to stabilize the patient by the end of the scenario at 1,655 s. Figure 11, bottom, indicates that both medical students accounted for communication patterning during the reorganizations, such that filtering the students eliminated the reorganizations (Figure 11, top). Note that by providing additional patient information (e.g., patient’s name), the instructor also contributed to communication patterning at the beginning of the first scenario. However, post hoc filtering (Figure 11, top) indicated the medical students contributed more strongly to that reorganization.

Top: Communication reorganization (%DET) and RMSE for the fourth medical student team. The first significant communication reorganization (p < .05) corresponds to the patient ingesting an unknown drug. The second significant communication reorganization (p < .05) corresponds to a patient seizing perturbation. The bold traces from 60 to 173 s and 1,316 to 1,670 s show the team response after filtering either the instructor (first reorganization) or both medical students (both reorganizations). Bottom: Total AMI indicates that both medical students accounted for communication patterning during the reorganizations, with the instructor also contributing to the first response (dashed curves are individual speech activity). In both plots, vertical dashed lines indicate scenario beginning (larger dashes) and scenario ending (smaller dashes). RMSE = root mean square error; AMI = average mutual information.
Table 1 summarizes the findings across reorganization graphs for experienced and medical student teams. Experienced teams’ reorganizations appeared to occur more rapidly following an event. We are hesitant to overestimate the direct cause-and-effect nature of this relationship, however, because some reorganizations reflect cascading difficulties following the perturbation (i.e., Medical Student Team 3). Based on the instructor’s judgment, experienced teams overcame more training events than medical student teams. Over all training event perturbations, the method detected 10/11 significant reorganizations. This proportion was significantly greater than chance (i.e., .50), binomial p = .01. We detected one false positive out of 11 reorganizations and failed to detect one reorganization (false negative) out of 12 training events. However, both proportions were not significantly greater than chance (i.e., .50), binomial p = .01. We address the issue of false positives and false negatives during the discussion.
Training Event Onset Time, Time of Significant Reorganization (RMSE Significance), Appropriateness of Response (Overcame), and Figure Number for All Training Events for Experienced and Medical Student Teams (All Times Are in Seconds)

Note. RMSE = root mean square error.
Study 2: Submarine Crews
The purpose of Study 2 was to generalize the findings of Study 1 to a more complex submarine navigation simulation. As in Study 1, we hypothesized that teams reorganize their coordination patterns in real time to deal with threats to team effectiveness, such that challenging training events would result in significant communication reorganizations and that more experienced teams would be more timely and effective in their responses. In Study 2, we analyze communication turn-taking data from submarine piloting and navigation (SPAN) simulations during which teams experienced man overboard (MOB) perturbations, instrument failures, and unexpected navigation difficulties. SPAN teams included experienced crews (crews that had recently returned to port) and less experienced crews (crewmembers who have spent 1 year at sea and are now training to become ship’s drivers and navigators).
Method
Participants
Communication transcripts were obtained from SPAN simulations using three experienced crews and three less experienced crews enrolled in the Submarine Officer Advanced Candidacy class at the U.S. Navy Submarine School in Groton, Connecticut. Sample size was limited by the requirement for highly specialized participants. All teams consisted of 10 to 12 crewmembers: Quartermaster (QM), Navigator (NAV), Officer on Deck (OOD), Assistant Navigator (ANAV), Contact Coordinator (CC), Radar (RAD), Helmsman (HELM), Recorder (REC), Periscope (SCOPE), Captain (CAP), Fathometer (FTH), and Crewmember (CREW). Experienced crews were more experienced both with SPAN and working together as a team. The study protocol was approved by the Naval Submarine Medical Research Laboratory IRB in compliance with all applicable Federal regulations governing the protection of human subjects. The study protocol of The Learning Chameleon, Inc., for the collection, processing, archiving, and dissemination of the neurodynamic and communication data, was approved by Biomed IRB, Inc. (San Diego).
SPAN simulations
As in Study 1, these simulations consisted of three segments: briefing, scenario, and debriefing. During the briefing, teams planned task coordination and reviewed scenario goals and team member responsibilities. During the scenario, teams coordinated novel and evolving information to navigate the submarine in a high-fidelity simulation environment. Scenarios contained training events including MOB perturbations, challenging encounters with ship traffic, changing weather conditions, and instrument failures. Debriefings included a review of the team’s performance and discussions of alternative actions that could have been taken.
Measures
Communication reorganization (%DET), NLPE (RMSE), total AMI, and speech activity measures were calculated in the same way as in Study 1. Post hoc filtering was performed in the same manner as in Study 1.
Procedure
Team members provided informed consent upon arrival. As in Study 1, all participants were outfitted with electroencephalography headsets, which they wore throughout participation. However, we report only communication data in this paper (see Stevens & Galloway, 2015; Stevens & Galloway, 2017; Stevens, Galloway, & Willemsen-Dunlap, 2018, for the neurodynamics results). Teams then performed the SPAN simulation, including briefing, scenario, and debriefing segments. After the debriefing segment, an experimenter debriefed crews on the purpose of the study. Participation lasted 1.5 hr or less.
Results and Discussion
Experienced and less experienced crews’ mean communication reorganization and reorganization variability did not significantly differ. However, as in Study 1, we focus on the communication reorganization time series graphs and how significant peaks in RMSE coincided with perturbations. The procedure for statistical significance testing using a confidence line based on critical t values was identical to Study 1, and again we used total AMI to inform post hoc filtering. As in Study 1, we used transcript content to contextualize the reorganization outcomes in each graph, including potential reorganization mechanisms, which we present in narrative format in the description of each graph. Following the reorganization graph analyses, we present a table that summarizes the findings across all graphs.
Figure 12, top (first experienced crew), shows a significant peak in RMSE (p < .01) starting at 787 s. This was an unexpected communication reorganization prior to scenario start during which the QM, NAV, and ANAV ensured their visual navigation aids were properly calibrated. The second significant reorganization (p < .01) starting at 3,345 s corresponds to a training event at 3,271 s, during which the crew experienced a close contact involving confusion about right of way to avoid collisions. Figure 12, bottom, indicates that the QM, NAV, and ANAV accounted for communication patterning during the reorganizations, such that filtering these crewmembers eliminated the significant reorganizations (Figure 12, top).

Top: Communication reorganization (%DET) and RMSE for the first experienced crew. The first significant communication reorganization (p < .01) was a false positive and corresponds to the navigation crew calibrating visual navigation aids prior to the start of the scenario. The second significant communication reorganization (p < .01) corresponds to the crew confronting a difficult contact situation involving right of way to get around other vessels. The bold black traces from 700 to 908 s and 3,068 to 3,448 s show the team response after filtering the navigation crew. Bottom: Total AMI scores indicate that the QM, NAV, and ANAV accounted for communication patterning during both reorganizations (dashed curves are individual speech activity). In both plots, vertical dashed lines indicate scenario beginning (larger dashes) and scenario ending (smaller dashes). RMSE = root mean square error; AMI = average mutual information; QM = Quartermaster; NAV = Navigator; ANAV = Assistant Navigator.
Figure 13, top (second experienced crew), shows a significant peak in RMSE (p < .01) starting at 2,633 s, which corresponds to a training event during which the crew had to reorganize following a near miss before encountering multiple vessels at 2,493 s, which was coordinated by the OOD. Figure 13, bottom, indicates that the OOD accounted for communication patterning during this reorganization, such that filtering the OOD component eliminated the significant reorganization (Figure 13, top). The second significant peak in RMSE (p < .01) starting at 4,273 s was in response to an MOB perturbation at 4,251 s. The crew brought the man in range and dispatched a boating party to rescue the man. Figure 13, bottom, indicates that the QM, OOD, NAV, HELM, and ANAV accounted for communication patterning during this reorganization. In agreement with the sequence of total AMI peaks in Figure 13, bottom, filtering indicated that the OOD, NAV, and ANAV contributed strongly throughout the reorganization, and QM and HELM contributed to the latter part of the reorganization (Figure 13, top).

Top: Communication reorganization (%DET) and RMSE for the second experienced crew. The first significant communication reorganization (p < .01) corresponds to a training event during which multiple vessels were encountered following a near miss. The second significant communication reorganization (p < .01) corresponds to a man overboard perturbation. The bold black trace from 2,529 to 2,703 s corresponds to the team response after filtering the OOD, and the bold traces from 4,187 to 4,622 s show the team response after filtering either the OOD, NAV, and ANAV, or QM and HELM. Bottom: Total AMI scores indicate that the OOD accounted for communication patterning during the first reorganization and the QM, OOD, NAV, HELM, and ANAV during the second reorganization (dashed curves are individual speech activity). In both plots, vertical dashed lines indicate scenario beginning (larger dashes) and scenario ending (smaller dashes). RMSE = root mean square error; OOD = Officer on Deck; NAV = Navigator; ANAV = Assistant Navigator; QM = Quartermaster; HELM = Helmsman; AMI = average mutual information.
Figure 14, top (third experienced team), shows a significant peak in RMSE (p < .05) starting at 584 s. This is in response to the ship losing GPS at 533 s and the crew having to shift the primary fix source to radar, resulting in difficulty reporting “rounds,” which are the regular updating of ship position every 3 min (Stevens & Galloway, 2015). During this time, the REC and RAD experience difficulty communicating coordinates, resulting in a round being scrubbed. Figure 14, bottom, indicates that the REC and RAD accounted for communication patterning during this reorganization, such that filtering their components eliminated the significant reorganization (Figure 14, top). The next significant reorganization (p < .05) started at 2,186 s when the instructor paused the simulation at 2,152 s to address issues with bearings recording using radar (rather than GPS). During the pause, the ANAV guided the REC through the proper sequence for bearings recording using radar. Figure 14, bottom, indicates that ANAV and REC accounted for communication patterning during the reorganization, and filtering their components eliminated the significant reorganization (Figure 14, top). The third significant reorganization (p < .05) starting at 2,850 s was in response to an MOB perturbation at 2,804 s. The crew continued to bring the man in range for the remainder of the scenario. As indicated in Figure 14, bottom, there were multiple communication threads during this time, with seven crewmembers accounting for communication patterning. Filtering their components eliminated the significant reorganization (Figure 14, top).

Top: Communication reorganization (%DET) and RMSE for the third experienced crew. The first significant communication reorganization (p < .05) corresponds to difficulty reporting rounds after the ship lost their global positioning system and the crew shifted the primary fix source to radar. The second significant communication reorganization (p < .05) occurs when the simulation is paused to coordinate bearings recording using radar as the primary fix source. The third significant communication reorganization (p < .05) corresponds to a man overboard perturbation. The bold black traces from 488 to 755 s, 2,124 to 2,304 s, and 2,804 to 3,097 s correspond to the team response after filtering the crewmember components described in the figure. Bottom: Total AMI scores indicate that the REC and RAD accounted for communication patterning during the first reorganization, the REC and ANAV for the second reorganization, and QM, SCOPE, OOD, NAV, HELM, CC, and ANAV for the third reorganization (dashed curves are individual speech activity). In both plots, vertical dashed lines indicate scenario beginning (larger dashes) and scenario ending (smaller dashes). RMSE = root mean square error; AMI = average mutual information; REC = recorder; RAD = radar; ANAV = assistant navigator; QM = quartermaster; SCOPE = periscope; OOD = officer on deck; NAV = navigator; HELM = helmsman; CC = contact coordinator.
Figure 15, top (first less experienced crew), shows a significant peak in RMSE (p < .01) starting at 1,617 s in response to the ship losing GPS and having to shift to radar as the primary fix source at 1,450 s. This is followed by another significant peak in RMSE (p < .01) starting at 1,988 s, during which range to vessels becomes difficult to track due to reduced visibility caused by difficult weather at 1,822 s. During this time, crewmembers continuously updated range and visibility conditions. Figure 15, bottom, indicates that the REC, OOD, and NAV accounted for communication reorganization during the first reorganization, and RAD, NAV, and CC accounted for the second reorganization, such that filtering those components eliminated the significant reorganizations (Figure 15, top). The last significant peak in RMSE (p < .01) starting at 3,265 s was a delayed response to an MOB perturbation at 2,874 s. This reorganization involved rapid back and forth communication as the crew encountered difficulty bringing the man in range for the remainder of the scenario. Figure 15, bottom, indicates that the OOD, NAV, and HELM accounted for communication patterning during the reorganization, such that filtering their components eliminated the significant reorganization (Figure 15, top).

Top: Communication reorganization (%DET) and RMSE for the first less experienced crew. The first two significant communication reorganizations (p < .01) correspond to a shift of the primary fix source from global positioning system to radar and limited visibility due to difficult weather. The third significant reorganization (p < .01) corresponds to a man overboard perturbation. The bold black traces from 1,484 to 1,897 s, 1,973 to 2,115 s, and 3,188 to 3,345 s show the team response after filtering the REC, OOD, and NAV from the first reorganization, RAD, NAV, and CC from the second reorganization, and the OOD, NAV, and HELM from the third reorganization, respectively. Bottom: Total AMI scores indicate that the REC, RAD, OOD, NAV, and CC accounted for the first two reorganizations, and the OOD, NAV, and HELM accounted for the third reorganization (dashed curves are individual speech activity). In both plots, vertical dashed lines indicate scenario beginning (larger dashes) and scenario ending (smaller dashes). RMSE = root mean square error; REC = recorder; OOD = officer on deck; NAV = navigator; RAD = radar; CC = contact coordinator; HELM = helmsman; AMI = average mutual information.
Figure 16, top (second less experienced crew), shows a significant peak in RMSE (p < .01) starting at 409 s. This reorganization was unexpected. During this time, the NAV, RAD, and CC practiced coordinating a round prior to scenario start, because some aspects of the process were new to these participants. The filtering (Figure 16, top) and total AMI (Figure 16, bottom) results confirm that these crewmembers accounted for the significant reorganization. The second significant peak in RMSE (p < .01) occurred around 1,777 s in response to a self-induced training event involving confusion about the proper course to avoid other vessels after turning right (rather than left) at 1,658 s. As shown in Figure 16, bottom, OOD and CC accounted for the beginning of the reorganization by reorienting the crew to the nature of the emerging situation, and RAD and SCOPE accounted for the latter part of the reorganization by visually recording and verbally reporting ship traffic to minimize risk of collision. As shown in Figure 16, top, filtering these components eliminated those aspects of the significant reorganization. The third significant peak in RMSE (p < .01) starting at 2,469 s was in response to loss of GPS and shift to radar as primary fix source at 2,371 s. This resulted in increased communication activity as the crew had to restructure how it visually and verbally coordinated rounds. Figure 16, bottom, indicates that RAD, SCOPE, OOD, NAV, and CC accounted for communication patterning during the reorganization, such that filtering their components eliminated the significant reorganization (Figure 16, top).

Top: Communication reorganization (%DET) and root mean square error (RMSE) for the second less experienced crew. The first significant communication reorganization (p < .01) was a false positive and corresponds to the crew planning how to visually coordinate a round prior to the start of the scenario. The second significant reorganization (p < .01) corresponds to the crew having difficulty avoiding contact with other vessels. The third significant reorganization (p < .01) is in response to loss of their global positioning system and shift to radar as the primary fix source, after which the team restructured how they coordinated rounds. The bold black traces from 344 to 507 s, 1,679 to 1,867 s, and 2,371 to 2,596 s show the team response after filtering RAD, NAV, and CC from the first reorganization, the RAD, SCOPE, OOD, and CC from the second reorganization, and the RAD, SCOPE, OOD, NAV, and CC from the third reorganization, respectively. Bottom: Total AMI scores indicate that the RAD, NAV, and CC accounted for communication patterning during the first reorganization, the RAD, SCOPE, OOD, and CC during the second reorganization, and the RAD, SCOPE, OOD, NAV, and CC during the third reorganization (dashed curves are individual speech activity). In both plots, vertical dashed lines indicate scenario beginning (larger dashes) and scenario ending (smaller dashes). RMSE = root mean square error; RAD = radar; NAV = navigator; CC = contact coordinator; SCOPE = periscope; OOD = officer on deck; AMI = average mutual information.
Figure 17, top (third less experienced crew) shows a significant reorganization starting at 2,173 s. There are three distinct peaks, drawn out over the same training event, when the crew had a problematic depth sounding followed by loss of GPS and shift to radar as primary fix source for taking rounds at 1,462 s and continued to encounter navigation troubles during the significant reorganizations. During this time, the NAV, OOD, and RAD negotiated the best route under these conditions, the QM monitored the situation, and SCOPE helped coordinate rounds. Figure 17, bottom, indicates that RAD, QM, SCOPE, OOD, and NAV accounted for communication patterning during the reorganization, such that filtering these components eliminated the significant reorganization (Figure 17, top).

Top: Communication reorganization (%DET) and RMSE for the third less experienced crew. The significant communication reorganization (p < .01) corresponds to sounding and equipment difficulties in response to loss of their global positioning system and shift to radar as the primary fix source, presenting a challenging navigation situation to the crew. The bold black trace from 2,120 to 2,675 s shows the team response after filtering RAD, QM, SCOPE, OOD, and NAV from the reorganization. Bottom: Total AMI scores indicate that the RAD, QM, SCOPE, OOD, and NAV accounted for communication patterning during the reorganization (dashed curves are individual speech activity). In both plots, vertical dashed lines indicate scenario beginning (larger dashes) and scenario ending (smaller dashes). RMSE = root mean square error; RAD = radar; QM = quartermaster; SCOPE = periscope; OOD = officer on deck; NAV = navigator; AMI = average mutual information.
Table 2 summarizes the findings across reorganization graphs for experienced and less experienced submarine crews. As in Study 1, experienced crews’ reorganizations appeared to occur more rapidly following a training event. Again, however, we are hesitant to overestimate the direct cause-and-effect nature of this relationship, because some less experienced crew reorganizations reflected cascading difficulties following the perturbation (i.e., Less Experienced Crews 1 and 3). As in Study 1, experienced crews also overcame more training events than less experienced crews. Over all training perturbations, the method detected 12/14 significant reorganizations. This proportion was significantly greater than chance (i.e., .50), binomial p = .01. We detected two false positives out of 14 reorganizations. However, this proportion was not significantly greater than chance (i.e., .50), binomial p = .01. We address the issue of false positives during the discussion.
Training Event Onset Time, Time of Significant Reorganization (RMSE Significance), Appropriateness of Response (Overcame), and Figure Number for All Training Events for Experienced and Less Experienced Crews (All Times Are in Seconds)

Note. RMSE = root mean square error.
Figure 18 shows how filtering can be used to understand how individual inputs become temporally intertwined in a team-level response. In this example (third less experienced crew; Figure 17), filtering the NAV, OOD, and RAD (1) accounts primarily for the first peak of the reorganization. Filtering the QM (2) helps account for the second and third peaks, and filtering SCOPE (3) fully accounts for the third peak. These filtering results can be somewhat inferred from the temporal patterning of total AMI results (Figure 17, bottom), but filtering provides a more integrated picture of what the team response would look like with and without selected individual-level inputs.

The sequential reduction in reorganization for the third less experienced crew, showing the temporal nature of individual communication inputs and how successive filtering can be used to visualize what the team response would look like with and without selected individual-level inputs. NAV = navigator; OOD = officer on deck; RAD = radar; QM = quartermaster; SCOPE = periscope.
General Discussion
We hypothesized that teams reorganize their interaction patterns to deal with unexpected challenges and perturbations; in this case, threats to patient outcomes and submarine navigation during simulation training. This hypothesis was largely supported. When confronted by challenging training events such as fire in the OR or MOB perturbations, teams in our studies demonstrated significant communication reorganization. For experienced teams, reorganizations were timely and effective; however, some of the medical student teams and less experienced submarine crews showed delayed reorganizations that either did not overcome the perturbation or failed to coincide directly with the perturbation. Detecting variation and adaptation in real-time team cognition using the methods described in this paper appears promising.
Characteristic 2 from the introduction posited that skilled teams have consistent behavior in familiar (routine) situations but are adept at changing their coordination patterns rapidly and appropriately as the situation requires. With the exception of the seizure perturbation in Figure 5, experienced teams exhibited this characteristic. Indeed, for experienced teams, we detected significant communication reorganizations that precisely corresponded to perturbations and coincided with high speech activity. The picture was more complicated for medical student teams and less experienced submarine crews. Although they exhibited significant reorganizations triggered by challenging training events, some of these responses were delayed or drawn out (Figures 9, 10, 15, and 17) and, in some cases, were not effective in overcoming the training perturbation (Figures 8, 9, 10, 11, 15, and 16).
Another aim of this research was to objectively identify individual-level inputs underlying significant reorganizations. Specifically, we identified which team members most substantially contributed to significant communication reorganizations using AMI-guided post hoc filtering. AMI calculations (an established technique) corresponded well with the filtering results (a novel technique), providing some criterion validity for filtering. We further explored the filtering results in the context of transcript content by attempting to infer underlying reorganization mechanisms such as leadership emergence (Guastello, 2010b) and role restructuring (LePine, 2005).
In line with Characteristic 3 from the introduction, which posited that skilled teams have a repertoire of adaptive mechanisms through which reorganizations occur, we were able to more readily infer potential reorganization mechanisms from experienced teams, whereas less experienced teams (particularly medical student teams) exhibited behaviors akin to trial-and-error problem solving. As described in the results section, the surgeon and RN in Figure 4 who verbally coordinated the response, the anesthesiologist in Figure 6 who took over the response, the surgeon in Figure 7 who commanded the response, the OOD in Figure 13 who coordinated the response, and the ANAV who clarified coordination roles during the pause in Figure 14 demonstrated leadership during these reorganizations. We were also able to successfully detect changing team membership (role restructuring) in Figure 5, when one anesthesiologist (standardized participant) became ill, and another anesthesiologist took over. We detected reorganizations related to role clarification in Figure 14 and coordination restructuring in Figure 16, which we suggest are also forms of role restructuring.
We caution that these results are based on our own inferences and require more validation, perhaps using observer assessments of leadership and role restructuring. However, these results begin to suggest the utility of the method described in this paper for identifying team reorganization mechanisms such as leadership emergence and role restructuring in the context of real-time team cognition. We further caution that leadership and role restructuring are just two examples of reorganization mechanisms. There could be innumerable mechanisms through which a team reorganizes, especially as teams become larger, the environment more complex, and the team more skilled. Nevertheless, the point of our method is to automatically direct the researcher’s attention to significant team-level events that can be further investigated to identify specific reorganization mechanisms. On this count, the method appears promising.
Our methods help bridge individual-level and team interaction-based aspects of team cognition. The detection of significant reorganizations at the team level embodies the interaction-based conceptualization of team cognition (Cooke, 2015; Cooke et al., 2013) and adds to the repertoire of interaction-based methods for detecting real-time team responses to unexpected perturbations. In a complementary way, AMI tracking and post hoc filtering detects key individual-level inputs in the context of real-time team cognition. We think individual-level sources of team adaptation have been difficult to measure in real time because many of these sources (e.g., leadership emergence) have been investigated in terms of relatively static or innate properties of team members (e.g., cognitive ability, personality traits; Kickul & Neuman, 2000; Luria & Berson, 2013). What the real-time approach suggests is that concepts such as leadership emergence can be operationalized in terms of a team member’s real-time contribution to a team response in addition to a priori traits or abilities (Guastello, 2009; Guastello, 2010b).
Practical Implications
How can we use these methods to support feedback and training for team effectiveness? Simulation has become deeply integrated into the practice of medical and nursing education (Aebersold & Tschannen, 2013; McGaghie, Issenberg, Petrusa, & Scalese, 2010), where the use of simulations is beginning to mitigate adverse outcomes in community hospitals and medical specialty programs (Riley et al., 2011), and simulation has been a mainstay of training in the military for decades (Salas, Wilson, Priest, & Guthrie, 2006). For teams, one of the goals of simulation is to improve team coordination and communication, as difficulties in these interactions have been associated with poorer health care outcomes (Sutcliffe, Lewton, & Rosenthal, 2004) and military incidents and accidents (Gorman, Cooke, & Winner, 2006). High-fidelity simulations provide opportunities for skill acquisition and maintenance, team training, and high-stakes testing, but methods for tracking the development of real-time team cognitive skill in these environments are lacking.
During simulation training, the structure and process dynamics of teams continually shift in response to changing task demands. Currently there are few objective metrics for representing these reorganization dynamics to support either (1) understanding and predicting real-time shifts in team coordination processes or (2) individualized feedback on participation in the team coordination process (see Stevens & Galloway, 2017, for a neurodynamic perspective; see Salas, Rosen, Held, & Weissmuller, 2009, for a review). The methods presented in this paper provide one approach for (1) detecting changes in coordination processes that are central to maintaining team effectiveness in dynamic environments as they occur and (2) localizing individual-level sources of team reorganization through AMI analysis and post hoc filtering. Ideally, these methods provide objective real-time team cognition feedback that can be tailored to address individual and team training goals.
Limitations and Future Research
The medical student teams in Figures 8 to 11 and the less experienced crew in Figure 16 demonstrate that significant communication reorganizations are not always effective, such that the method is not diagnostic with respect to the quality or outcome of reorganization; the method only detects that a significant reorganization occurred and the team members that contributed to it. As noted earlier, we relied on transcript content and instructor feedback to determine the outcome of reorganizations and to generate a hypothesis for what individual-level mechanism(s) (e.g., leadership emergence) drove the reorganization. Thus, although the method is objective, it is content-free, and currently requires the researcher and/or instructor to provide the context of reorganization. In the future, incorporating objective content analysis metrics and performance prediction (Foltz & Martin, 2009) might provide the needed context without requiring the researcher to provide it post hoc. Even with this limitation, it is important to be able to automatically detect when a significant transition or change in team coordination occurs, and these methods tell the researcher where to look in a data stream to investigate whether and how a team adapted effectively or ineffectively.
Next is the issue of false positives. The false positive ratio for the medical simulations was .09 (one out of 11 significant reorganizations), and the false positive ratio for the submarine simulations was .14 (two out of 14 significant reorganizations). Questions surround the nature of these false positives and how to account for them. As shown in Figures 6, 12, and 16, we picked up significant reorganizations that were not triggered by training events but by planning behaviors before the team transitioned into task performance. Although planning enhances team effectiveness (Stout, Cannon-Bowers, Salas, & Milanovich, 1999), it is not the type of real-time team cognitive skill we set out to track. In hindsight, however, characterizing these reorganizations as “false positives” could be misleading. Future research should examine a wider range of team reorganizations, including planning and replanning, that matter for team cognition.
As shown in Figure 5, we failed to detect a significant reorganization in response to a patient seizing perturbation. The false negative ratio for the medical simulations was .08 (one out of 12 training events, zero for the submarine simulations). It is possible that this false negative occurred because the team adapted through implicit coordination mechanisms, wherein team members mentally simulate each other’s actions (e.g., run a mental model) to anticipate informational needs without overt communication (Entin & Serfaty, 1999; MacMillan et al., 2004). Although the anesthesiologist had high speech activity, those communications carried little mutual information with other team members’ speech activity, supporting the notion that coordination occurred through mechanisms other than mutual verbal information exchange. This result suggests that signals other than verbal communication might be needed to track real-time implicit coordination. For instance, we detected the patient seizing perturbation in Figure 5 using neural and heart rate synchronization but not speech (Stevens, Galloway, Willemsen-Dunlap et al., 2018) and have observed that neural synchronization and speech are mutually entraining (Gorman et al., 2016). Thus, we think aligning communication dynamics with neurodynamics, heart rate variability, and other less overt coordination markers could help address the false negative observed in Figure 5. Ultimately, turn taking in speech does not form the entirety of coordination behavior. Nonverbal cues, physiological indicators, and neural dynamics could contribute to a multidimensional space of coordination variables (Afkari, Bednarik, Makela, & Eivazi, 2016) in addition to overt speech acts for tracking real-time team cognition.
We made the assumption that filtering provides a behavioral basis for an individual’s awareness to “be a good team member,” such that filtering identifies individual team member’s inputs into a team response. This assumption can be challenged in several ways. First, the assumption that team member inputs to a team response are explicit ignores the possibility that some aspects of team cognition are implicit (as described earlier). Filtering, as implemented here using communication, does not address implicit coordination (as addressed earlier). Second, ontogenetically it might be impossible to extract a team member’s influence on team cognition by subtracting that team member out after the process has already occurred. That is, the behavior of the other team members, after subtraction, might still show the influence of the subtracted team member(s). We argue, however, that basing filter selection on holistic total AMI results alleviates this concern. Third, on its own, filtering does not tell you whether the subtracted team member was a positive or negative influence on team cognition. As with the first limitation regarding diagnosticity of reorganization outcomes, we think incorporating objective metrics of communication content (Gorman, Foltz, Kiekel, Martin, & Cooke, 2003) could help fill this gap.
Most of our results indicate a direct relationship between perturbation and reorganization. However, we caution that this should not be interpreted as the general rule. For some of the less experienced teams, training events introduced multiple branching paths and cascading difficulties making the locus of reorganization more difficult to identify. In Figures 15 and 17, for example, the situation was compounded by encountering inclement weather and navigation difficulties based on actions taken subsequent to the training event. In those situations, the problem became so complex that reorganization resulted from a complex mix of difficulties, some introduced by the trainees themselves, rather than a single training event, making mechanisms of reorganization harder to pin down.
Finally, although all teams need to coordinate, we focused on action-based decision-making teams (Sundstrom, De Meuse, & Futrell, 1990), whose communication patterns tend to be more procedurally structured compared with advisory or project development teams (e.g., committees; research groups), whose communication patterns might be less structured. It is possible that communication reorganizations contrast more against a backdrop of consistent, procedural interactions, compared with less structured interaction, such that the method might not be suitable for certain team types. However, further research is needed to resolve this issue.
Conclusion
The ability to maintain team effectiveness and achieve a shared goal in the face of unexpected crises and evolving situations is a fundamental team cognitive skill, and methods are needed to track this skill. Ideally, these methods (1) track the real-time dynamics of this skill, (2) are domain-independent, with constructs and measurement concepts (e.g., general adaptive response; reorganization) that generalize across a variety of team domains, and (3) potentially detect the presence of mechanisms (e.g., leadership emergence; dynamic role restructuring) underlying team reorganization. In practice, the methods reported here can inform debriefing of team members following simulation training, including after-action reviews and detection of events for critical decision interviews to identify specific reorganization mechanisms (Klein, Calderwood, & MacGregor, 1989), and, in the future, detection of team reorganization in real-time operational environments. It is reasonable to expect that in the future, such methods could be used to assess team cognition and team effectiveness, and how individuals dynamically contribute to them in real time.
Key Points
From a dynamical perspective, team cognition involves intertwined individual- and team-level processes as teams formulate responses to challenges in the team environment, and methods are needed to track this team cognitive skill.
Communication reorganizations in medical teams and submarine crews suggest this skill can be measured as a team’s real-time response to perturbations that threaten team effectiveness.
Post hoc filtering informed by mutual information calculation indicates that individual-level inputs can be linked to team reorganization mechanisms (e.g., leadership emergence; dynamic role restructuring) that can be assessed as team member’s real-time contributions to a team-level response.
The methods presented in this article allow for visualization of a team’s real-time response to unexpected crises and individualized feedback based on team members’ contributions to the team response.
Footnotes
Acknowledgments
The medical simulation research was funded by a subcontract to Georgia Tech from JUMP Simulation and Education Center through The Learning Chameleon, Inc. The submarine training research was supported by Defense Advanced Projects Agency Contract W31P4Q-12-C-0166 and NSF SBIR Grant IIP 121215327 to The Learning Chameleon, Inc. Additional funding was provided by the Illinois Neurological Institute Research Program. Preliminary versions of Figures 4, 5, and 8 were reported in Grimm et al. (2017). Ronald H. Stevens is also affiliated with The Learning Chameleon, Inc., Los Angeles, California, USA.
Jamie C. Gorman is an associate professor in engineering psychology at Georgia Tech. He received his PhD from New Mexico State University in psychology in 2006.
David A. Grimm earned his BA in psychology and BS in statistics from the University of California, Davis in 2011. His current research interests include team resilience, dynamical systems theory, and real-time analysis.
Ronald H. Stevens earned his PhD in molecular genetics from Harvard University in 1971. He is professor (emeritus), University of California, Los Angeles (UCLA) School of Medicine, and a member of the UCLA Brain Research Institute. His current research interests include using electroencephalography (EEG) to model team neurodynamics in complex, real-world training settings.
Trysha Galloway received her EFDA from Oregon Health and Sciences University in 1995. She is director of EEG research for The Learning Chameleon laboratory. Her current research interests include the population-based advantages of probabilistic performance modeling with the detection of neurophysiologic signals to help personalize individual and team learning processes.
Ann M. Willemsen-Dunlap is the director of interprofessional education at JUMP Simulation, an assistant professor (clinical) at the University of Illinois College of Medicine-Peoria, and practices clinically as a certified registered nurse anesthetist. She received her PhD from the University of Iowa in 2004 in science education with concentrations in physiology and measurement.
Donald J. Halpin earned his Executive MBA from Washington University in 2016. His current research interests include leadership and team dynamics, patient safety, and the intersection of aviation and healthcare cultures.