
Abstract
Objective
We measured how long distraction by a smartphone affects simulated driving behaviors after the tasks are completed (i.e., the distraction hangover).
Background
Most drivers know that smartphones distract. Trying to limit distraction, drivers can use hands-free devices, where they only briefly glance at the smartphone. However, the cognitive cost of switching tasks from driving to communicating and back to driving adds an underappreciated, potentially long period to the total distraction time.
Method
Ninety-seven 21- to 78-year-old individuals who self-identified as active drivers and smartphone users engaged in a simulated driving scenario that included smartphone distractions. Peripheral-cue and car-following tasks were used to assess driving behavior, along with synchronized eye tracking.
Results
The participants’ lateral speed was larger than baseline for 15 s after the end of a voice distraction and for up to 25 s after a text distraction. Correct identification of peripheral cues dropped about 5% per decade of age, and participants from the 71+ age group missed seeing about 50% of peripheral cues within 4 s of the distraction. During distraction, coherence with the lead car in a following task dropped from 0.54 to 0.045, and seven participants rear-ended the lead car. Breadth of scanning contracted by 50% after distraction.
Conclusion
Simulated driving performance drops dramatically after smartphone distraction for all ages and for both voice and texting.
Application
Public education should include the dangers of any smartphone use during driving, including hands-free.
Introduction
The advice to “keep your eyes on the road!” remains as valid in this day of smartphones, heads-up displays, and complicated radio controls as it was when drivers had to hand-crank their windows, interpret gages, and tune an analog radio. At the same time, complete attention to the road is neither practical nor even the best strategy since drivers should look around at, for example, other cars, their dashboard, and even the scenery (California Driver Handbook, 2021). Such shifts of attention come at a cost of a finite time to return to the important task of looking at the road ahead (Strayer & Fisher, 2016). However, this “distraction hangover,” the time required to shift attention between complicated tasks like driving and answering a phone call, is an emerging measure with some recent estimates indicating a dangerously long 25 s or more (Strayer et al., 2017). The purpose of this study was to determine the scale and duration of the distraction hangover induced by smartphone distraction on the driving performance of active adult drivers during and after the distraction, measured across age.
Sources of distracted driving can be visual, manual, or cognitive, such as eating, drinking, talking with passengers, adjusting equipment in the car (e.g., radio), or using smartphones. Smartphone use in cars is highly prevalent (Smith, 2017), including texting (Tison et al., 2011), increased between 2012 and 2015 (Schroeder et al., 2018), and is readily introduced to simulated driving scenarios (Drews et al., 2009). Studies have shown that smartphone use, regardless of whether hands-free or handheld, (Just et al., 2008; Strayer et al., 2006), increases crash risk through a variety of mechanisms (Caird et al., 2018), though the exact risk has been challenging to determine, and is influenced by many variables, including type of driver, age of driver, and type of phone use, depending on the task (Atwood et al., 2018; Huisingh et al., 2019; McEvoy et al., 2005; Redelmeier & Tibshirani, 1997). Smartphone tasks that require dedicated attention, such as texting, emailing, or web browsing, remain common while driving (Schroeder et al., 2018; Tison et al., 2011). Other distractions that take eyes, hands, and mind off driving have been shown to increase crash risk, including the use of navigation devices (Knapper et al., 2016), even if they are voice-controlled (Strayer et al., 2017). Of concern are common misperceptions of the risk of multitasking while driving. Ninety-three percent of respondents to the National Survey of Distracted Driving reported safety concerns if they were a passenger in a car of someone who was driving and sending texts, and 86% were concerned if the driver was reading texts (Tison et al., 2011).
Despite the growing body of legislation over the last several years limiting handheld cell phone use while driving that have been associated with a reduction in fatalities (Flaherty et al., 2020), they do not address the role of cognitive distraction with hands-free use. In addition to the immediate effects of manual, visual, and cognitive distractions on driving safety, there is evidence that cognitive distractions persist after the call or text has ended (Strayer et al., 2015). Additionally, there is growing evidence that the cognitive loads associated with phone use are associated with hazardous driving behavior (Borowsky et al., 2015, 2016; Savage et al., 2020; Strayer et al., 2015). A distraction hangover longer than a few seconds has implication for traffic safety, with drivers checking texts and making calls when stopped, or in heavy traffic, more often than when the car is moving, presumably because they feel phone use is safe when stopped (Bernstein & Bernstein, 2015).
The potential mechanisms for the deleterious effects of cognitive, hands-free distraction include inattention blindness, tunnel vision, and work load, resulting in delayed reaction time, speeding, speed variability, poorer lateral control, and changes in following (Harbluk et al., 2002, Caird et al., 2018; Caird et al., 2014; Harbluk et al., 2002; Vegega et al., 2013). The delayed reaction time involved with cell phone usage (both hands-free and handheld) is the equivalent of driving with a blood alcohol content of .04–.12 (Leung et al., 2012; Strayer et al., 2006). In a workplace simulated study by Mark et al. (2008), interruptions to tasks resulted in increased stress, increased frustration, and increased perception of workload. These distractions impair driving performance, but for how long? Stress and fatigue persist for days, alcohol metabolizes over the course of hours, but little is known about the time course of distractions after looking at a smartphone. Here, we contribute to filling that gap with a simulator study of the distraction hangover.
Methods
Participant Recruitment and Eligibility
Participants were recruited from existing contacts and advertisement in the local university community and screened for eligibility. Inclusion criteria were active CA driver’s license, at least 20 years old, drive at least once a week, own and use a smartphone, text at least once a week, and fluent in English. Participants were excluded if they had a caregiver or reported a diagnosis of cognitive impairment, dementia, or Alzheimer’s disease. This research complied with the tenets of the Declaration of Helsinki and was approved by the Institutional Review Board at UC San Diego. Informed consent was obtained from each participant and participants were paid a small amount for their time.
A total of 101 participants were recruited, and 97 participants completed the study protocol. Two dropouts did not meet eligibility criteria, and two experienced hardware failures. Average participant age was M = 50.8, SD = 21.1, range = 58.60 (Table 1).
Sociodemographic Characteristics of Participants (N = 97)

Ninety-one of the 97 participants completed both the hands-free and text drives. Six participants requested to end early due to fatigue or nausea (four completed hands-free and two text); where possible, single drive participants are included. Seventy-one participants started with the hands-free drive, and 26 with text. The age distributions for participants who started with hands-free (M = 52.74 years, SD = 21.61) and text (M = 45.43 years, SD = 18.54) are not significantly different (t(95) = −1.52; p = .13), but the unbalanced order is a potential confounder.
Driving Simulator
Participants sat approximately 1 m in front of a 24” monitor and controlled a first-person view of a virtual car using a gaming steering wheel, accelerator, and brake (Logitech). STISIM Drive software presented a preprogrammed drive (Systems Technology, Inc.) that was 10 virtual miles long with evenly spaced gentle curves, trees, buildings, and sporadic oncoming cars to encourage immersion, but unrelated to the task. There were no programmed stops or sharp turns; virtual signage indicated participants should drive 40 mph. During the drive, the simulator triggered 8-bit synchronization pulses on an external digital-analog device (Measurement Computing USB 200) that was read in by an Arduino compatible analog digital converter (Teensy 3.1) connected with USB to a recording computer. The recording computer forwarded coded pulses indicating a text or call message to a Wi-Fi-connected 5” Android phone with custom software written in Unity 2017.3.1f1 that included preprogrammed text and voice messages in a fixed order (Unity code available at https://github.com/oldstylejoe/fakephone).
Driving Tasks
In a single testing visit, participants completed two 30-min simulated driving sessions (one with hands-free and one with texting smartphone distractions). Summarizing written participant instructions, an experimenter described the task and hardware to each participant who then practiced to comfort on each aspect. Participants were instructed to “Be sure to answer/respond the [PHONE/TEXT] … ,” but successful response/failure had no effect on the drive. Each session consisted of two approximately 15-min segments in consistent, noncounterbalanced order: (1) a dual task that required divided attention with responses to visual cues in the left and right periphery while driving, and (2) a car following task in which the lead car used a variable sinusoidal acceleration and braking pattern. Each task segment had an initial period with no distraction (baseline), lasting approximately 2.5 min, followed by a period of distraction.
In the STISIM divided attention task, red diamond symbols were displayed at the edges of the screen by default during the drive. Participants were asked to respond to a change in the symbol on the left or right, from diamond to triangle, by pressing the corresponding paddle on the steering wheel (Figure 1). The paddles were located on the back of the steering wheel and pulled with the fingers. The changed symbol remained on the screen for 5 s or until the participant responded. Where space is limited, we refer to the divided attention task as “dual” task. There were 30 trials spaced unpredictably along the drive, 46–3191 feet (average 810) apart. The dual task is similar to the ISO 17488 DRT task but requires attention to detect the subtle change in symbol shape (Standardization, 2016).
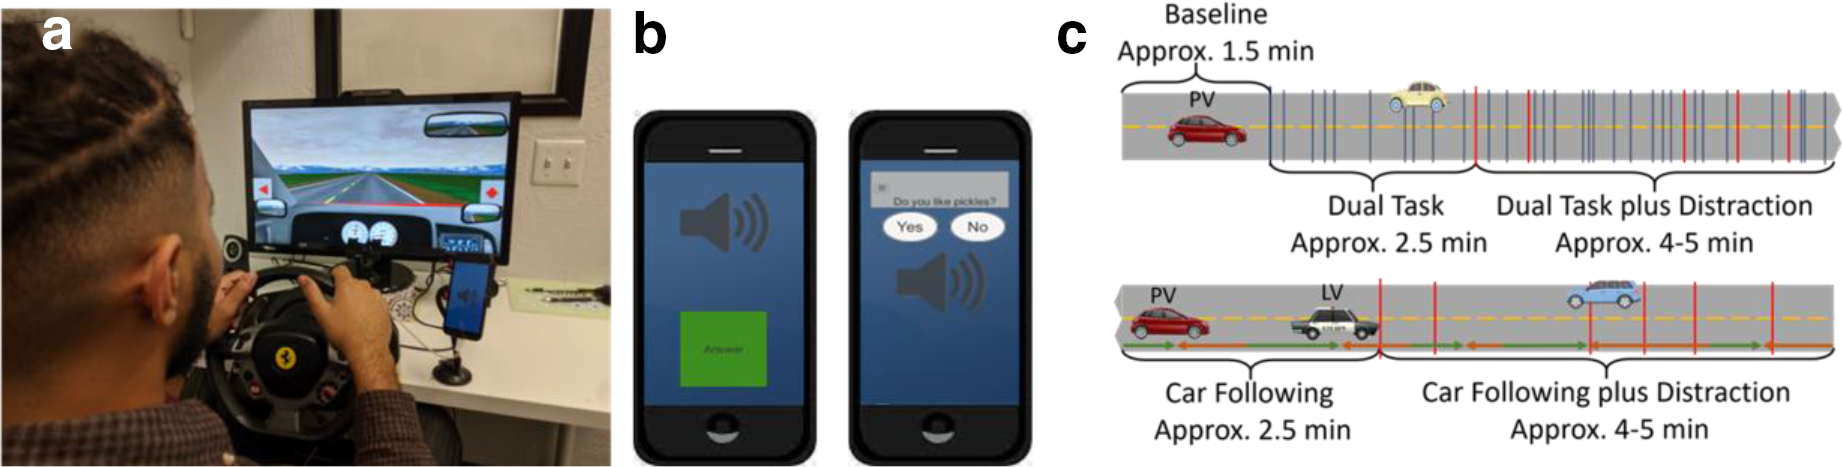
(a) Example setup of a participant seated in front of the driving simulator controls—a first-person car view with a steering wheel and pedals (not shown). A small eye tracker is located at the bottom of the screen and the smartphone is placed easily in reach of the right hand. (b) Example display for each of the phone distractions; hands-free voice call (left) and text message (right). (c) The drive begins with a short baseline period, where there are no tasks or distraction. Dual task comes before the car following task. PV = participant vehicle; LV = lead vehicle.
In the STISIM car following task, participants were asked to match their speed as closely as possible to a police vehicle that was altering its speed sinusoidally (47–67mph), so as not to be predictable.
Distraction Events
Hands-free calls and texting served as distracting events. The phone rang to indicate a handsfree call or chimed to indicate a text (Figure 1). Participants answered the hands-free calls by pressing a large green button on the phone to hear a brief audio message, for example, “Hello, I am calling from your alma mater doing a survey on graduates, what is your current occupation?” [pause for response] “Thank you. Goodbye.” In the texting distraction, texts popped up on the phone. Simple questions such as “Do you drink coffee?” were followed by a yes/no response button on the phone that the participant touched. Participants were encouraged, but not required, to respond to all audio and text messages.
After the initial baseline, distraction events were placed randomly in each task segment to avoid predictability. Some distractions occurred simultaneously with a task event, while others occurred between task events. There were five distraction events during the divided attention task and six during the car following task in the hands-free distraction drive. There were nine distraction events in each segment of the texting distraction drive.
Measures
The first set of measures are intended to evaluate overall driving performance to evaluate how the different groups approached the driving task.
Total drive time is the time to complete the drive.
Lane excursions are crosses of the center line or shoulder line.
Lane variability is the standard deviation of lateral lane position.
Average speed is the average simulated speed during the drive.
Speed variability is the standard deviation of the simulated speed.
The second set of measures are intended to reflect hypothesized changes in behavior linked with the phone events, for example, the distraction hangover.
Swerve speed is the lateral speed of the car in the lane, |Δx/Δt| where x is the distance of the virtual car from the left side of the road and t is the simulation time. The participant controls lane position with the steering wheel.
Time to recover is calculated from the swerve speed for each participant averaged over trials by binning the swerve speed into 100 ms bins, time locked to the event. It is the time to return to 10% of the baseline subtracted peak swerve speed after the distracting event. Starting at the distraction time, we first find the maximum swerve speed, subtract the baseline, and calculate 10% of that difference. The 10% value is considered “recovered,” and we find the first time after the peak when the swerve speed returns to 10%.
Coherence is a unitless measure of speed matching. If speeds are unrelated, then coherence is zero. If speeds are perfectly matched, up to a phase shift, then coherence is one. For example, sine and cosine functions are identical, up to a phase shift: you can slide a plot of sine over to perfectly overlap a plot of cosine, so sine and cosine have coherence 1 (Porges et al., 1980).
Breadth of scanning is the spread in gaze locations near the center of the screen, away from mirrors, console, and phone. We isolate a window on the screen of the middle 60% by 30% (horizontally vertically) and calculate the interquartile range of the horizontal coordinate of the gaze position.
Dwell time-on-phone is calculated from the gaze data as the total time spent looking toward the phone (Society of Automotive Engineers, 2017). Since the phone is in a different plane than the screen, it appears anomalously large, and we use range: horizontal between [0.8, 2] and vertical [−.7, 0.2] in viewport coordinates where the screen is [0,1] by [0,1]. Note that this window extends beyond the screen.
Eye Tracking
Gaze point relative to the screen was tracked with a Tobii 4C (Tobii, Inc; licensed for research use). The eye tracker and simulator were temporally aligned with a custom synchronization pulse (Snider et al., 2013). Custom plugins for the LabRecorder software (https://github.com/sccn/labstreaminglayer) recorded the synchronization pulse from the simulator and the data stream from the eye tracker. The synchronization pulses were also recorded in the frame-by-frame data from the simulator and then used to align the simulator and eye tracking data, post hoc.
Before starting their drive, participants calibrated with the built-in eye tracker calibration routine: seven points, one central, three equally spaced at the top, and three equally spaced at the bottom. Eye tracking failed in n = 10 participants, but age distribution did not change significantly (t(182) = −.016, p = .987).
Statistics
For display purposes, ages are broken into age groups with, for example, 26.3 included in the 20–26 age group, but 26.7 included in the 27–55 age group. For testing statistical significance, we used the age, including fractions of a year, at experiment time in linear mixed models with maximal fixed effects and minimal random effects (Bates et al., 2015). This allowed us to analyze unbalanced groups without dropping data. To estimate significance, we use Satterthwaite’s method (Kuznetsova et al., 2017). Where noted, we use alternate tests for simple comparisons between groups, for example, t-tests. Means and standard errors of measures are reported as M(STD) with the value in parenthesis representing the error in the last digit of the mean. Further, 95% confidence intervals are used to visualize spread in plots and are bootstrapped (10,000 iterations) using the HMisc package (Harrell Jr & Harrell Jr, 2015). All statistics and data analysis are done in R (R Core Team, 2014).
Results
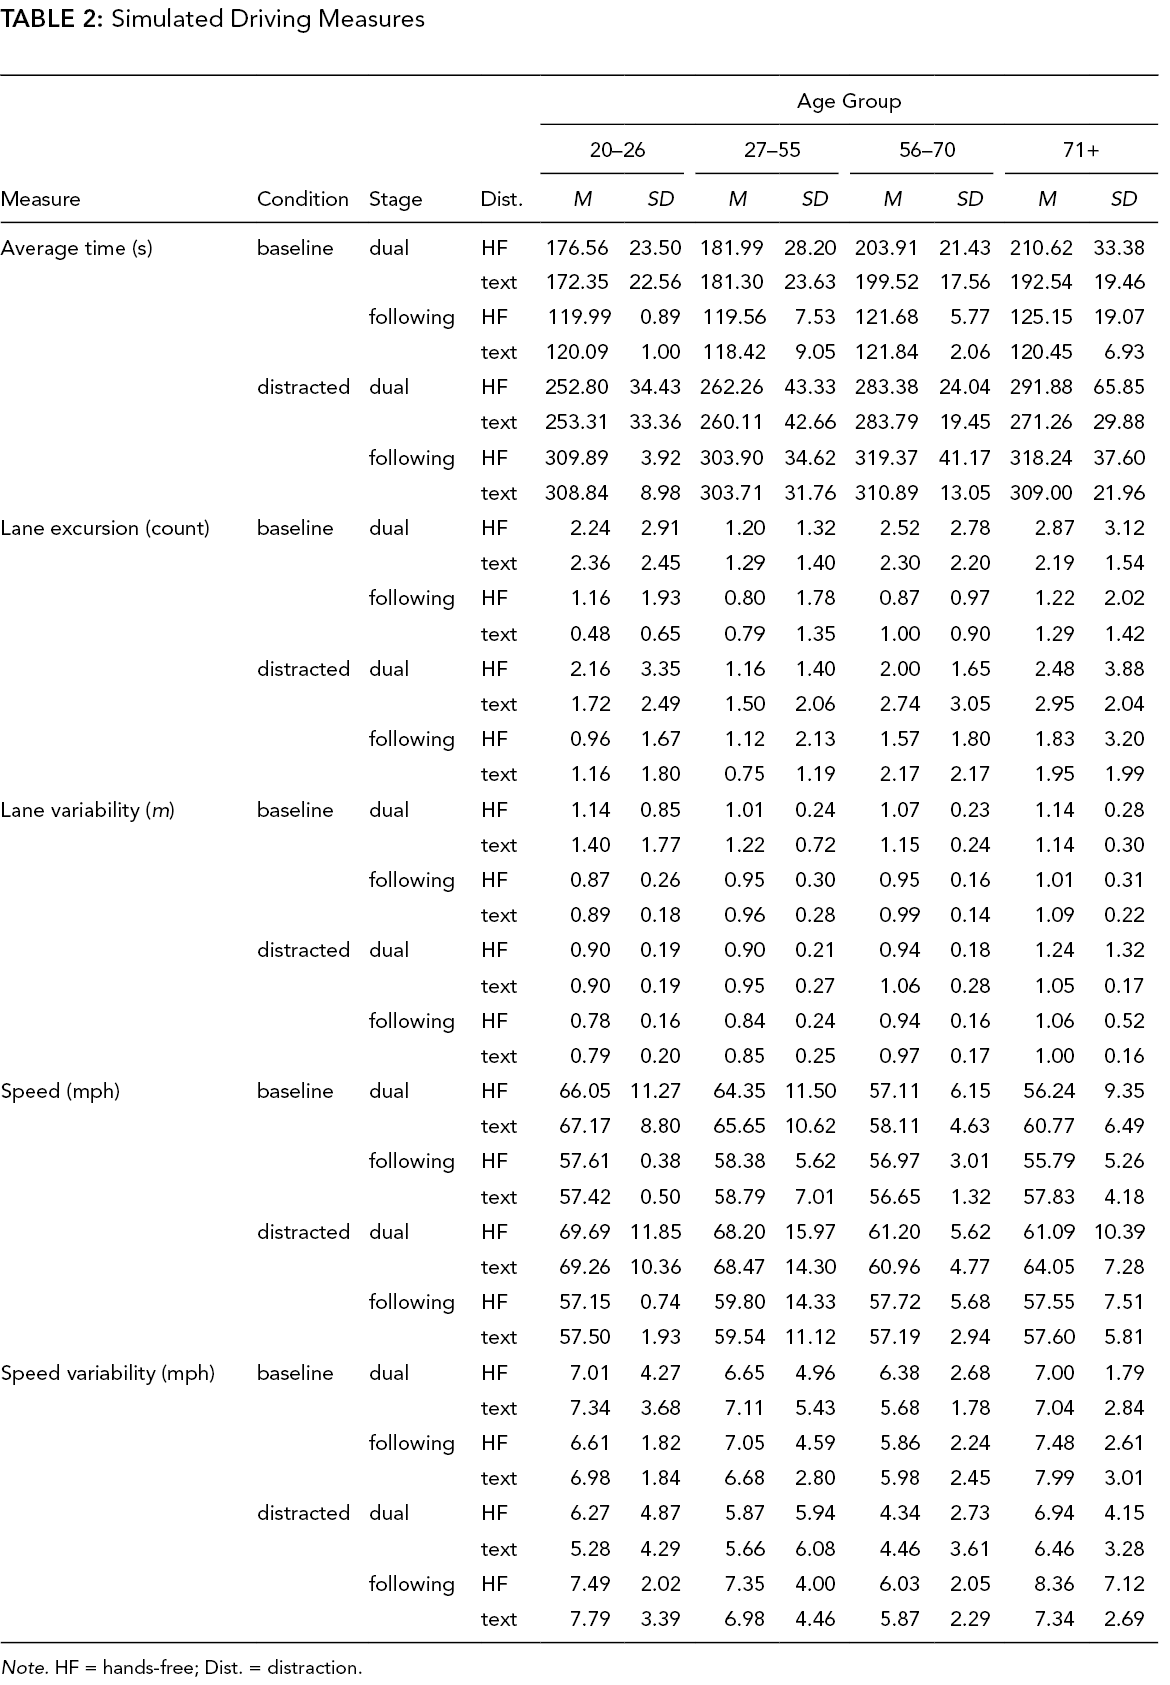
To compare performance on the simulated driving task, standard driving measures are presented: total drive time, lane excursions (crossing the center or shoulder line), lane variability (standard deviation of lateral road position), average speed, and speed variability (standard deviation of speeds). There were no statistically significant differences between text and hands-free distraction. During the dual task portion of the drive, speed was freely controlled by the participants, and older participants drove more slowly (−2.2(4) mph per decade of age, F(1, 95.72) = 12.16, p < .001) and took longer to complete the trial (7(1) s per decade of age, F(1, 90.57) = 15.70, p < .001). Participants were able to maintain a constant speed in the car following stage when the lead car set the speed. During following, there was a statistically significant interaction between age and stage, reflecting decreasing average speed with age only during the dual task stage (Table 2, age × stage interaction F(1, 657.84) = 78.37, p < .001). Similarly, the total time for the tasks normalized in the car following stage (Table 2, age × stage interaction F(1, 652.40) = 61.80, p < .001).
Simulated Driving Measures
Note. HF = hands-free; Dist. = distraction.
With the presence of the lead car and pressing the paddles on the wheel, the two stages are different tasks, so we considered them separately. During the car following stage, the number of lane excursions increased with distraction 0.18(9) events faster per decade of age (F(1, 265.53) = 4.55, p = .034) and with the text distraction 0.18(9) events faster per decade of age (F(1, 269.09) = 4.46, p = .036). Similarly, lane variability increased faster during distraction 0.03(1) m per decade, but in both the dual and following stages of the task, the overall lane variability decreased with distraction (dual: −.3(2) m, F(1, 257.38) = 1.23, p = .0016; following: −.20(4) m, F(1, 275.04) = 13.52, p < .001). Speed also increased 3(2) mph during the distraction interval in the dual stage (F(1, 280.18) = 5.24, p = .023), although speed was 0.8(9) mph less variable during distraction (F(1, 280.73) = 6.57, p = .011).
Swerve Speed
Swerve speed, the lateral speed in the lane, was stable around ~.3 m/s in the 5 s before the distraction (Figure 2). After the distraction, it rapidly increased to a peak of about .5 m/s, before slowly decaying back to baseline. The participant rarely recovered all the way to baseline before the next distraction event (vertical gray lines in Figure 2). To characterize this interval across participants, we created a histogram of each participant’s swerve speed with respect to the distraction event, then found the time between the first peak in swerve speed and recovery to 10% of that value (Figure 2b). Participants took longer to recover during the text condition, 20.6(6) s, versus 15.1(6) s during hands-free (F(1, 374) = 45.7, p < .001). Note that there were more text events than hands-free because of the construction of the drive. The time when participants started swerving varied in the hands-free distraction, so the swerve speed distribution (Figure 2a, top) is spread out. Individual participants’ recovery times were faster in hands-free than in texting (Figure 2b) but more variable in the swerve starting point.
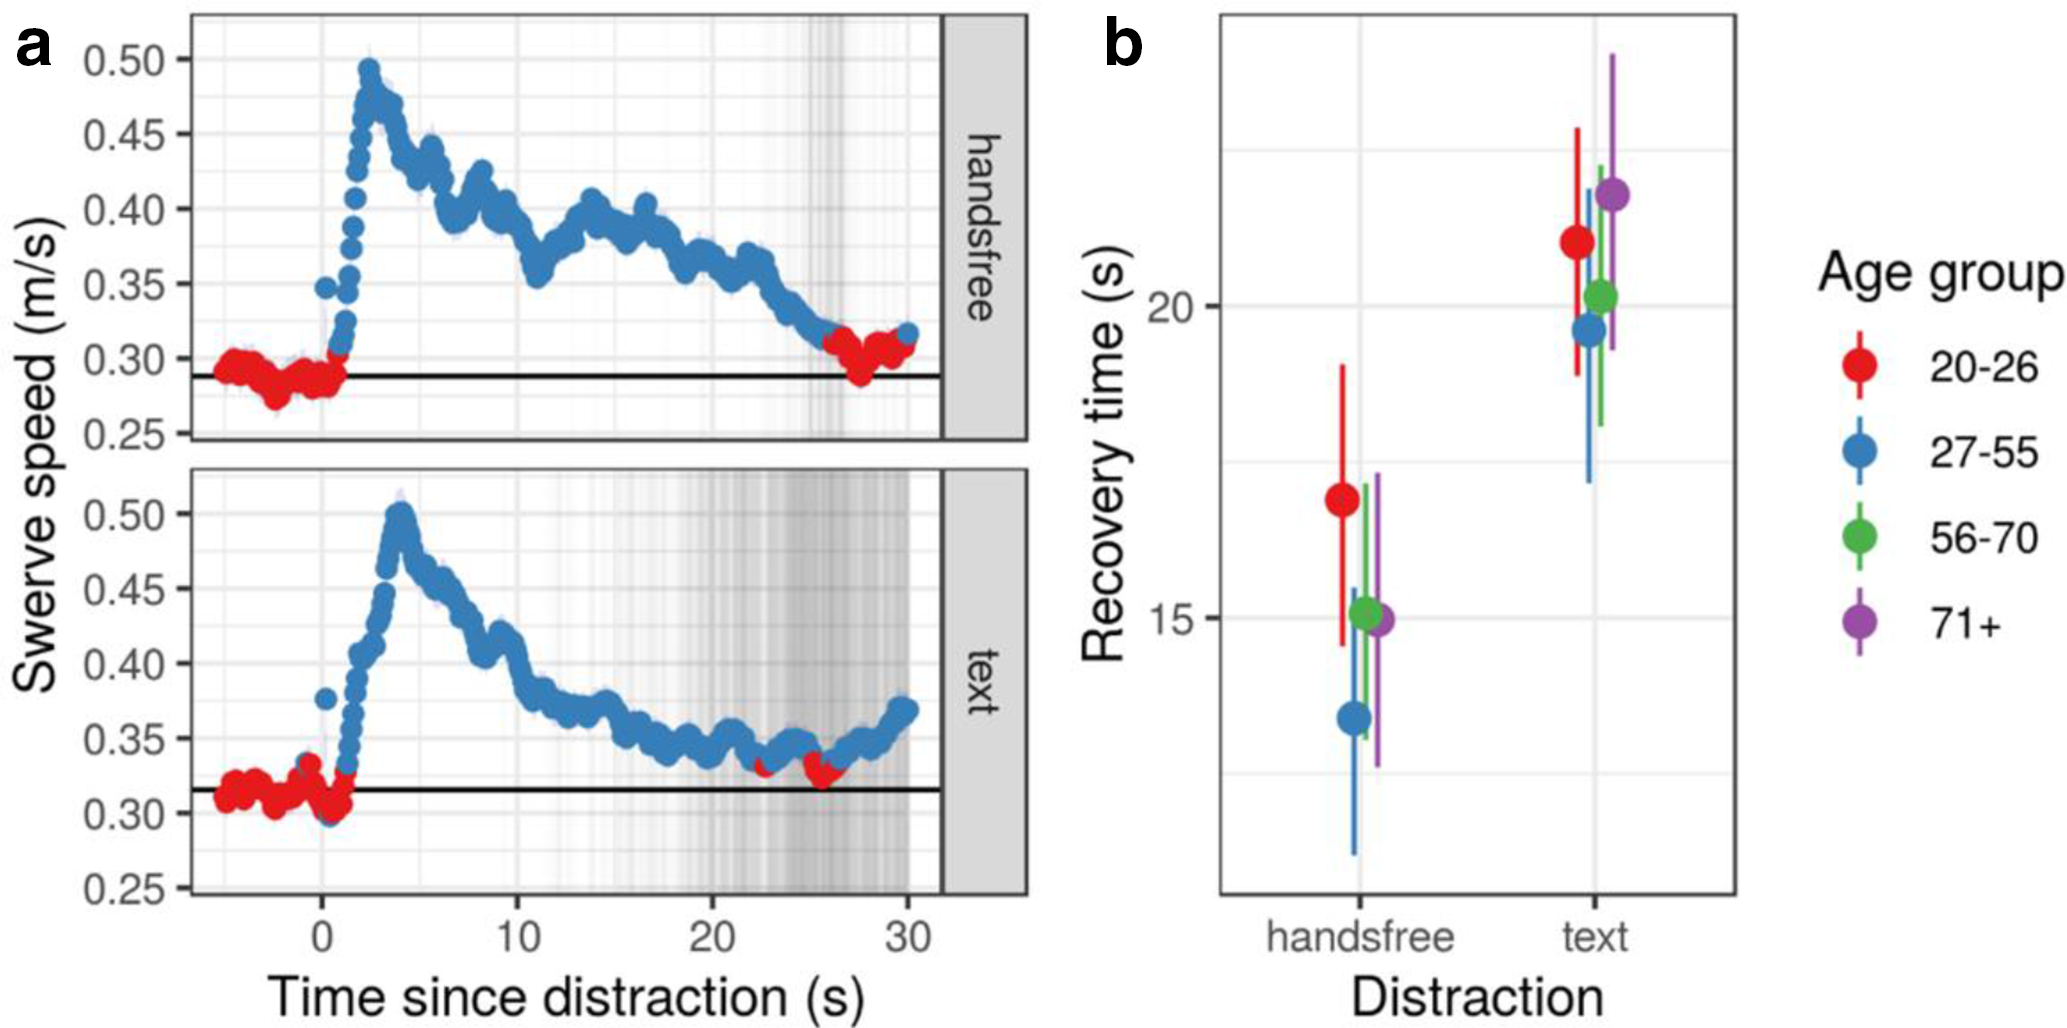
(
Recovery time increased slightly for the youngest group, and if we compare the youngest and second youngest groups, recovery time for the 20–26-year-olds was 4(2) s longer (F(1, 194) = 4.57, p = .034).
Dual Task
The peripheral dual task probed attentional resources. For the whole cohort, there are only 28 errors out of 4639 total chances, but there are 500 instances where a participant failed to respond within 5 s; they did not see the cue in time. The overall success rate, including timeouts, decreased with age (1.7(7)% drop per decade, F(1, 94.4) = 12.78, p < .001, Figure 3a). Success rate remained the same with or without distraction (F(1, 281.11) = .67, p = .41). Similarly, reaction time slowed 120(30) ms per decade of age (F(1, 95.49) = 26.91, p < .001), but reaction time did not change with distraction (F(1, 281.76) = 1.24, p = .27).
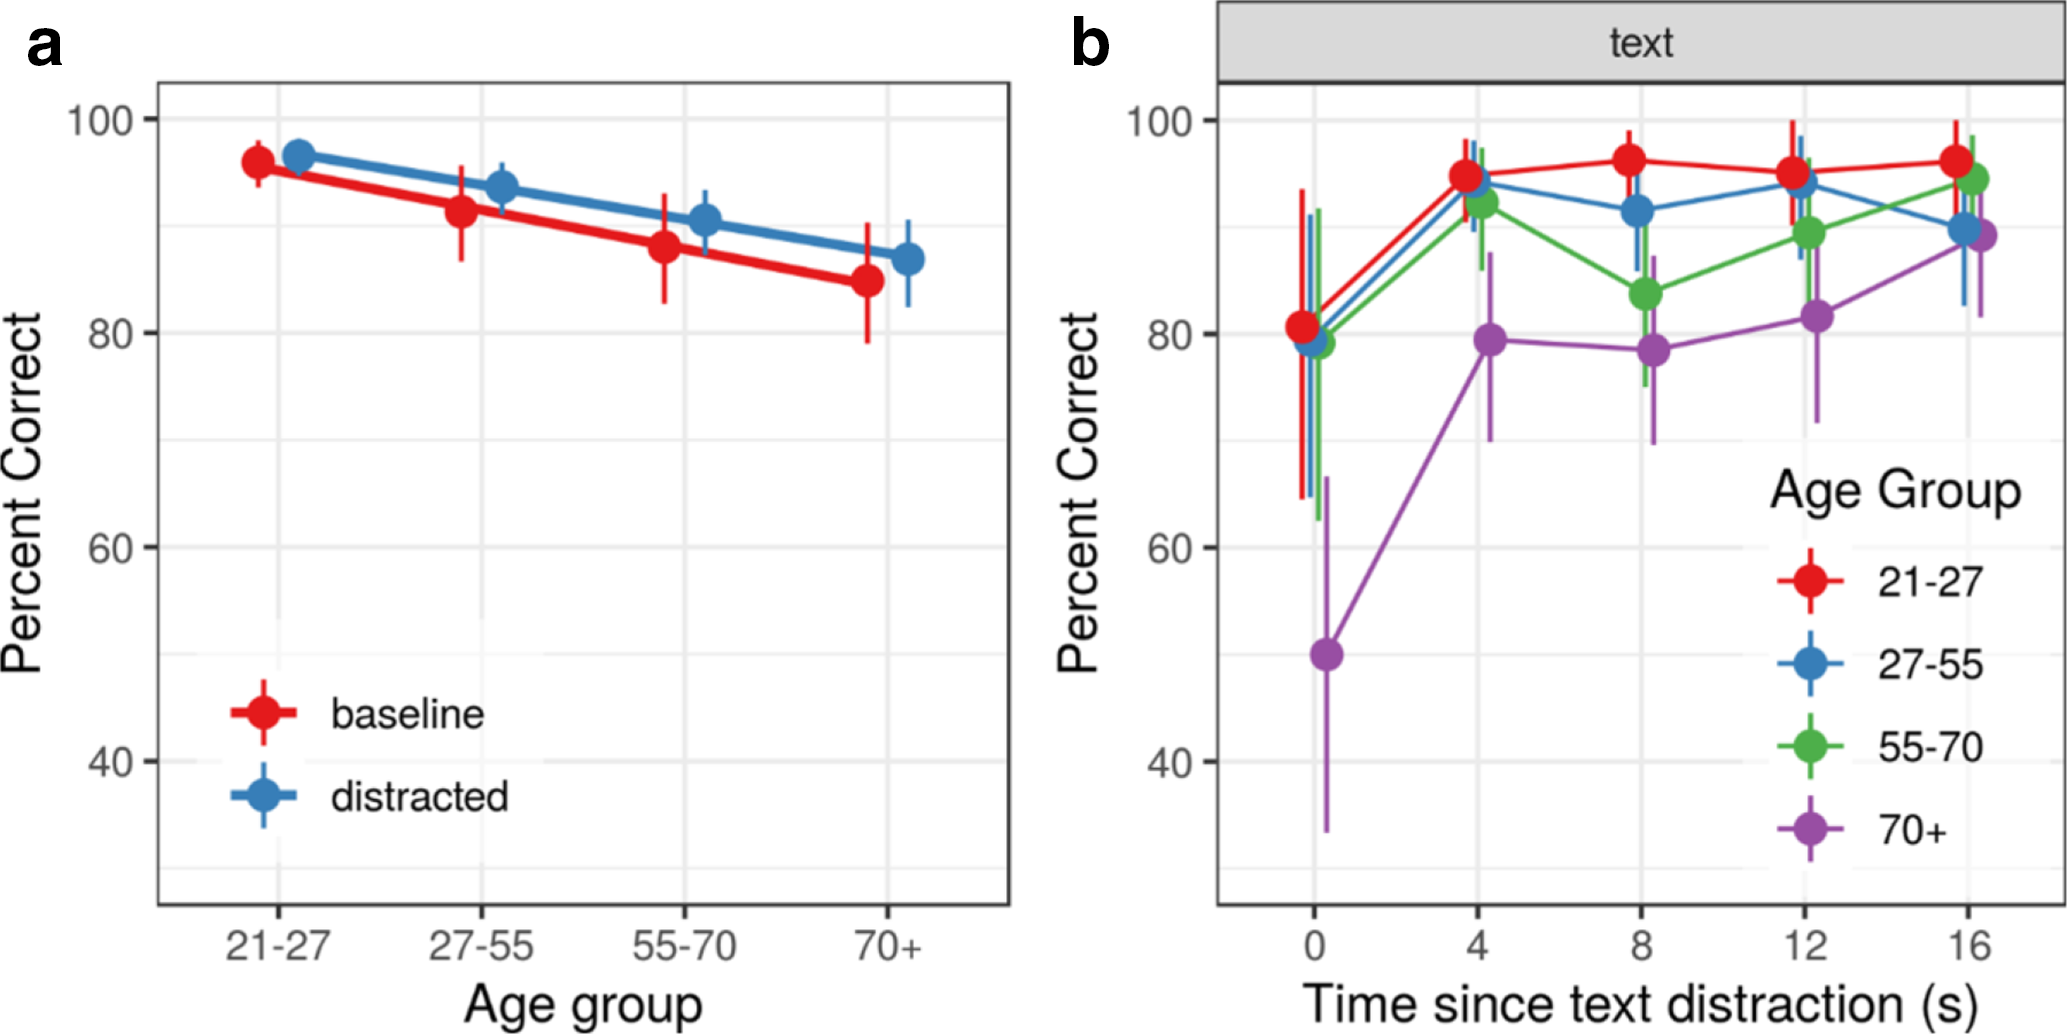
(
There are 119 text distractions within 4 s before a peripheral cue appeared across all participants. Averaged within age groups, the oldest age group missed approximately half of the peripheral cues that occurred within the first 4 s after the text (M = .50, CI = [0.33, 0.70], n = 30, Figure 3b), and there was a significant drop in correct response to the peripheral cue of 5(2)% per decade of age (F(1, 79.77) = 5.72, p = .019).
Car Following
Participants followed a lead car whose speed oscillated sinusoidally between 47 and 67 mph (Figure 4). Of the N = 97 participants, n = 7 drove through the virtual lead car, effectively passing it without noticing they had done so. In real driving, these would have been rear-end collisions with the lead car. Participants who passed the lead car (n = 7) no longer saw the cue and were removed for this analysis (no significant change in age distribution, t(185) = 0.0331, p = .97). For the undistracted part of the drive, the participants averaged a reasonably high 0.56(2) coherence, but that dropped precipitously to a very low 0.045(4) coherence after the first phone event (F(1, 253.87) = 227.64, p < .001). This decoherence with the lead car is readily apparent in Figure 4 where for the baseline, the participant accurately matches the lead car, but as soon as the phone rings, the participant’s speed is unrelated to the lead car.
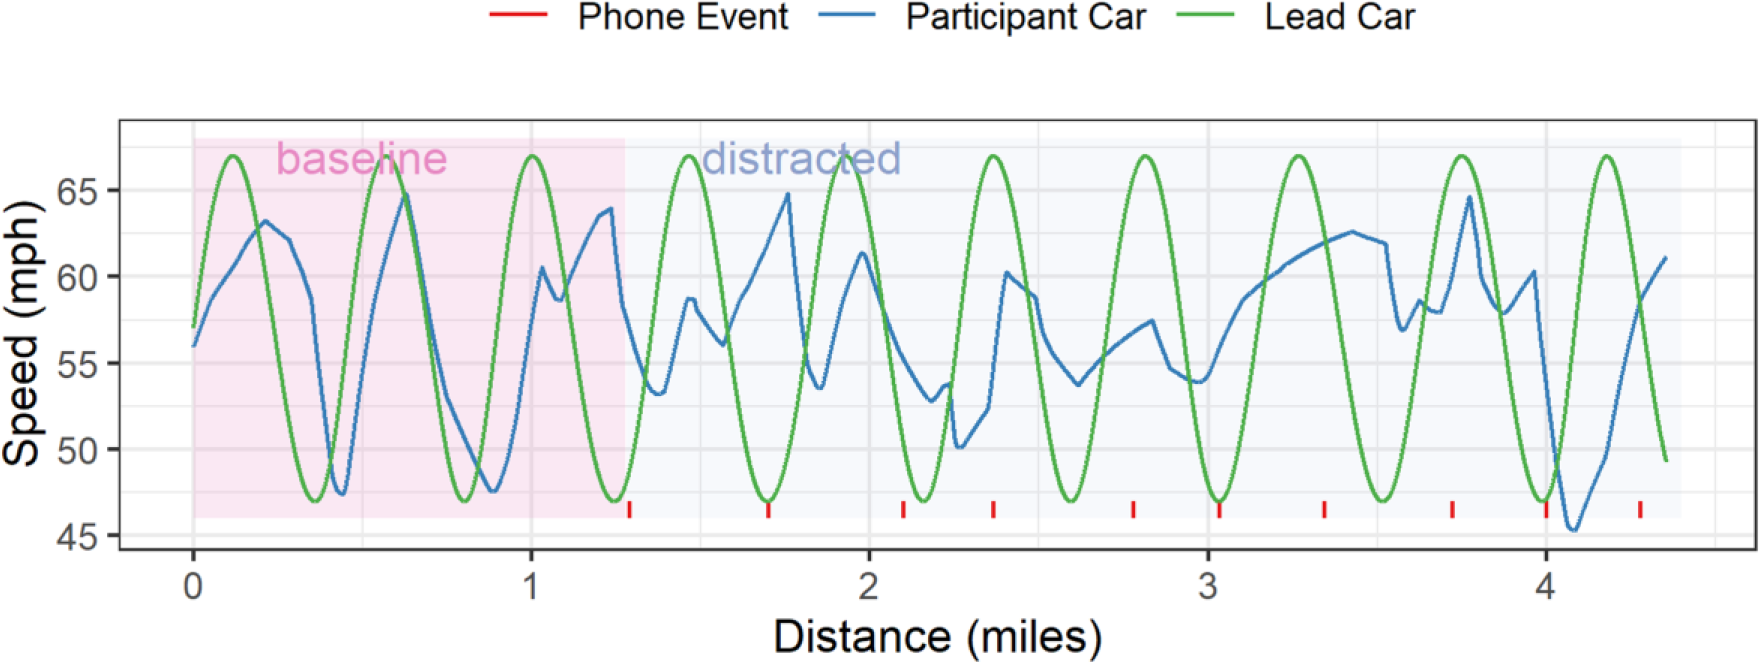
Car following raw data from a single trial. The lead car’s speed is indicated in green (light), and the participant’s speed in blue (dark). The red tick marks indicate text events. During the first 1.3 miles of the drive, the participant matched the lead car speed (coherence = .77), but as soon as the phone distracted the participant (red vertical lines), their speed decohered with the lead car (coherence = .009).
Overall, there was a significant drop in coherence of 0.04(1) units per decade of age (F(1, 85.98) = 9.47, p = .0028). Also, there was a significant interaction between age and baseline/distracted condition (F(1, 253.87) = 29.69, p < .001). For the baseline condition, participants showed a decrease in performance with age of 0.04(1) units of coherence per decade of age (F(1, 86.65) = 13.36, p < .001), but coherence increased 0.008(2) units per decade of age (F(1, 171) = 14.26, p < .001). Also, five of the 70 plus-year-old group and a single 41-year-old maintained 0.2 coherence during the distracted part of the drive.
Eye Movements
Gaze position was recorded with a Tobii 4C mounted at the bottom of the screen. Eye tracking was employed as a post hoc observation tool and participants received no feedback about their eye position. The eye tracker calibration included some distance beyond the screen and covered the phone at the lower right (Figure 5). Participants spent most of their time looking at the center of the screen; their rearview mirrors to the left, right, and above right; and their speedometer console.

A heatmap of the eye position during the entire baseline, hands-free, and text drives. The black square is the screen, and the smaller gray square is the phone to the lower right of the screen. Participants mostly look in the center of the screen at the road, and at their mirrors and speedometer. The phone events pull the eyes off the driving task to the phone. Note that the phone appears artificially large because it is closer to the participant than the screen.
Participants looked at the phone only briefly during the baseline: Mhands-free = .55 s, SDhands-free = .75 s; Mtext = 1.08 s, SDtext = 1.29 s, but spent more time looking at the phone during the distraction condition: Mhands-free = 7.94 s, SDhands-free = 4.52 s; Mtext = 39.36 s, SDtext = 16.38 s. The baseline condition was shorter in overall duration, so we eliminated it from the statistical comparison. The total time available to look at the phone, however, was approximately the same across the two types of distraction, so we were able to compare the total time as a proxy for phone looks. Participants spent 27(3)s more looking at their phone during the approximately 9-min text distraction than the hands-free distraction (F(1, 85.23) = 35.86, p < .001).
The central part of the screen had most of the task-related stimuli, for example, oncoming traffic or lane markers. In addition to pulling gaze away from the central part of the screen, distraction may cause a form of tunnel vision, where the scan path of the central region shrinks. To isolate the tunnel vision effect, we looked only at the central region visible in the heatmap (Figure 5, horizontal range [0.2, 0.8] and the vertical range [0.4, 0.7]), and excluded the mirror, speedometer, and phone regions. The width is the interquartile range of the horizontal eye position, conditioned on being in the central region. Over the six decades of participant age that we sampled, fixation variability increased with age. To compensate for that increase, we measured the percent change in breadth of scanning within each subject between baseline and distracted conditions (Figure 6). There was an overall significant drop on the screen from 5.9(6) cm to 3.8(6) cm, or 50(20)% (F(1, 558.49) = 688.67, p < .001). Also, the width during following was 47(5)% more compressed than during the dual task (F(1, 230.10) = 130.49, p < .001).

Percent decrease in the breadth of scanning, the interquartile range of the central part of the screen. Distraction type, age, and stage are all represented, but only stage is a significant difference. Bars are the percent change from baseline, and the errors are 95% confidence intervals across participants.
Discussion
We asked 97 participants who drive weekly and use smartphones regularly to perform two simulated driving tasks: dual, responding to a peripheral cue; and following, matching a variable speed lead car. During both conditions, a smart phone mounted just to the right of the steering wheel rang 5–10 times with 30–60-s gaps to indicate a hands-free call or a text message similar to a short conversation that might happen in normal driving. After the ring, participants tended to speed up a little, stiffen their foot on the accelerator, swerve dramatically, and exhibit tunnel vision. These behavioral changes persisted for 15–25 s after the distracting event, enough time to travel nearly half a mile at highway speeds.
Distraction Hangover
This study demonstrated a distraction hangover effect up to 25 s for swerve speed for both hands-free and texting, but with a longer recovery time for texting. The distraction hangover impaired the ability to process peripheral information for up to 16 s after a text in the oldest group. These findings are compatible with those of Strayer et al. (2015) in a 2015 study showing residual effects up to 27 s from distraction. The ongoing effects of distraction on driving safety has implications for the habits of driving, checking emails and texts at traffic lights or in heavily congested and stopped traffic. Surveys of drivers have revealed that up to 50% of drivers check their phones at traffic lights (Hill et al., 2015).
The distraction hangover extended so long that in some cases the next smartphone distraction came before the participants were able to recover all the way to baseline. This appeared most impressively with seven drivers (about 7% of the total) colliding with the lead car. Of the remaining 90 drivers who managed to avoid colliding with the lead car, a measure of how well they matched the lead car’s speed, coherence, dropped almost to zero. To put that in context, normal driving has a coherence of approximately 0.5–0.7, as our participants had without the phone distraction. Baseline coherence is known to drop with age, but only by a few percent (Doroudgar et al., 2017). Moderate alcohol levels have limited effect on coherence (Jongen et al., 2016). Chronic marijuana users on tetrahydrocannabinol (THC) have a measured coherence in a similar paradigm of about 0.44 (Doroudgar et al., 2018). The decrease in coherence to nearly zero that we observed in all groups indicates that the distraction events prevent the participants from performing the following task.
Age Effects
Driving behavior in the simulator was similar across age as has been observed in previous studies (Doroudgar et al., 2017). During the dual task, when speed was self-selected, the most consistent age-related change in driving was a general slowing of about 2 mph per decade of life: when given the choice, the oldest individuals in their seventh decade drove nearly 15 mph slower than the youngest, in their second decade. However, the oldest individuals performed as well as the youngest, in terms of lane excursions and lane and speed variability, even during the car-following portion of the task, when speeds were normalized. Driving slower did not help their dual task performance that worsened with age, and the oldest individuals missed approximately half of the peripheral cues that came within 4 s of a text message. This means the oldest group failed to detect 50% of the salient information in their visual periphery while driving.
While peripheral cue and baseline car following performance worsened with age, car-following ability during distraction improved slightly, although it did not normalize. The score for car following bottomed out for the youngest groups, indicating that increased age provides some protection to following ability. This is surprising since younger individuals are almost always better at the driving tasks, with their faster reaction times and steadier movements (Doroudgar et al., 2017). Another indication of the protective effect of driving experience is that the youngest individuals take the longest time to stabilize their lane position after a distraction event, and they are almost 4 s slower than the next oldest age group.
Hands-Free Versus Texting
Hands-free devices are generally assumed to degrade driving performance less than hands-held (Ishigami & Klein, 2009), though there is evidence to the contrary (McEvoy et al., 2005), and texting, and increased availability of connected-car technology makes hands-free ever more appealing (Drews et al., 2009; Hosking et al., 2009; Libby et al., 2013). Shorter recovery times for hands-free than text distractions as well as less time spent looking at the phone would seem to bear this out. However, at about 15 s, the recovery time may be faster during hands-free driving, but that is still enough time to drive a quarter mile at highway speeds.
For most of the driving behaviors we measured, we found no difference between the hands-free and text distraction, including speed, lane excursions, and lane variability. Hands-free and text distractions increased swerve speed to almost the same peak value, and the longer recovery time for texting may be an artifact of the participants touching the phone a second time to respond to the text. Also, while participants gazed at the phone for about half the time when distracted by hands-free rings versus texts, when they returned gaze to the driving screen, their breadth of scanning was similarly reduced following both types of distraction. After a distraction, the driver must focus some of their limited attention on the phone, either to read a text or listen to a message. As they shift attention away from the road, their eyes focus on a narrower area, and they may miss important driving events, like oncoming traffic or events in their visual periphery.
Cognitive Mechanisms
Decisions, be they perceptual, cognitive, or motor, have usefully been considered in the framework of bounded integrator models that consider the quality of the sensory information, the motivational and cognitive context, and the urgency of the needed decision (e.g., Reddi & Carpenter, 2000). Crossing the threshold in these models results in a decision, but the quality of information contributes to the rate of accumulation, and factors such as urgency contribute to the criterion. The models explain error rates and reaction time for motor decisions on the timescale of seconds, and networks of bounded integrators model a capacity-limited system (Gallivan et al., 2018; Resulaj et al., 2009). Recent variants of these models also explain speed-accuracy trade-off data where each bounded integrator tunes itself by a yet unknown cognitive mechanism over a few hundred milliseconds to respond to changing conditions (Cisek et al., 2009). Here, to switch from checking the smartphone to driving and back again, the motor plan and associated bounded integrators for each eye movement, each manual movement, as well as each evaluation of the incoming sensory information must update. One can see how a driving distraction can lead to a prolonged return to “normal” driving behavior—a distraction hangover. The cumulative time to retune a network of bounded integrators may account for the 10 s of seconds we observe, but further work to understand the long persistence length is needed from physiological, behavioral, and theoretical studies.
Strengths and Limitations
This study spanned the ages of drivers from 21 to 80, and though we had 64% white/non-Hispanic participants, we were able to recruit 36% participants from more diverse groups. While the study methodology necessitated the use of a simulator and not a naturalistic driving setting, the demonstrated long-lasting effects of distractions across ages have implications for on-the-road safety. The brief distractions in the simulator mimic the reported checking of texts and talking on cells phones, even with hands-free cell phone use. We were able to monitor multiple components of reactions to distractions, from eye gaze to coherence (following), improving our understanding of the safety implications of distractions. We recognize the challenges of both simulator and naturalistic driving studies in the study of distraction risks (Simmons et al., 2016; Wijayaratna et al., 2019).
Policy Implications
From a safety perspective, our study highlights the risks of using smartphones on driving behaviors, and from a public health standpoint, our study showcases the burden of the degree of cognitive load on drivers with distractions, both during and for a significant period of time after the distracting event. Most importantly, while our study did indicate some mitigation of these risks with hands-free over texting behaviors, these differences are of little public health significance or practical importance. Stakeholders of road safety, including drivers, policy makers, pedestrians, and the public alike, should be informed of the true risks of distraction while driving, including the concern of the hangover effects of cognitive loads. The marked changes in driving performance during cognitive distraction (hands-free) demonstrated in this study may explain the worrisome trends in crash risk. Traffic laws should reflect the science of driving safety, reflecting the risks of hands-free driving, including distraction hangover, in addition to the current bans on handheld phone use. As technology continues to become engrained through our daily tasks, including increasingly sophisticated automobiles and cell phones, policy makers should better align available evidence regarding in-vehicle technology and the science of distraction. We need effective public education programs to increase appreciation of the dangers of distraction, including hands-free, and the risks of even short distractions that nonetheless are associated with hangover effects.
Key Points
In a simulated environment, texts and calls on a smartphone distracted drivers for as long as 25 s after the text or call completed, a long distraction hangover.
Hands-free talking and automated texting both had similar behavioral consequences for drivers.
The central region of the road where drivers look shrank almost 50% after a smartphone distraction.
Footnotes
Acknowledgments
NIH Grant U01AG062371; This work was supported by a grant from the UC Institutes for Transportation Studies. This material is based upon work supported by the National Science Foundation under Grant No. 1640909.
Author Biographies
Joseph Snider received his PhD in physics in 2004 from UC, Irvine. He is an associate project scientist at UC San Diego, where he is the technical director of the Motion Capture and Brain Dynamics lab at the Institute for Neural Computation and codirects the Power of NeuroGaming Center.
Ryan J. Spence received his bachelor's degree in physiology and neuroscience from UC San Diego, and is a staff research associate at the Research on Autism and Development Lab at UC San Diego.
Anne-Marie Engler completed her undergraduate studies at Muhlenberg College where she double majored in English and Media and Communications. She received her Master in Public Health with a concentration in community public health from New York University. She has been with UC San Diego since 2013.
Ryan Moran received his MD degree from the University of Maryland in 2012. After completing his training in internal medicine and general preventive medicine, he is an assistant clinical professor at UCSD Health.
Sarah Hacker earned her BA in psychology at the University of California, Riverside. She is currently the staff research associate at Research on Autism and Development Laboratory at UC San Diego, assisting in recruiting for and developing new studies that help us understand the cognitive performance of individuals with ASD.
Leanne Chukoskie graduated from the University of Pennsylvania as a dual Biological Basis of Behavior and Anthropology major. She continued studying neural science for her PhD at New York University, followed by a postdoctoral fellowship at the Salk Institute for Biological Sciences. She has held a full-time academic appointment at UC San Diego since 2010.
Jeanne Townsend received her PhD in clinical psychology from UC San Diego in 1992 (SDSU/UCSD Joint Doctoral Program). She is a professor in the UCSD Department of Neurosciences and director of the Research on Autism and Development Laboratory.
Linda Hill received her MD from University of Ottawa, and her MPH from San Diego State University. She is a professor in the School of Medicine and interim assistant dean in the Herbert Wertheim School of Public Health at UC San Diego.