
Abstract
Objective
Examine the effects of decision risk and automation transparency on the accuracy and timeliness of operator decisions, automation verification rates, and subjective workload.
Background
Decision aids typically benefit performance, but can provide incorrect advice due to contextual factors, creating the potential for automation disuse or misuse. Decision aids can reduce an operator’s manual problem evaluation, and it can also be strategic for operators to minimize verifying automated advice in order to manage workload.
Method
Participants assigned the optimal unmanned vehicle to complete missions. A decision aid provided advice but was not always reliable. Two levels of decision aid transparency were manipulated between participants. The risk associated with each decision was manipulated using a financial incentive scheme. Participants could use a calculator to verify automated advice; however, this resulted in a financial penalty.
Results
For high- compared with low-risk decisions, participants were more likely to reject incorrect automated advice and were more likely to verify automation and reported higher workload. Increased transparency did not lead to more accurate decisions and did not impact workload but decreased automation verification and eliminated the increased decision time associated with high decision risk.
Conclusion
Increased automation transparency was beneficial in that it decreased automation verification and decreased decision time. The increased workload and automation verification for high-risk missions is not necessarily problematic given the improved automation correct rejection rate.
Application
The findings have potential application to the design of interfaces to improve human–automation teaming, and for anticipating the impact of decision risk on operator behavior.
Humans are increasingly using automation that is designed to enhance productivity and safety in complex work systems. For example, automated decisions aids are used in defense settings to make recommendations regarding the management of unmanned vehicles (UVs; Calhoun et al., 2018), and in other work domains such as air traffic control and health care. Automation in such work contexts is usually highly reliable but not perfect due to the inherent uncertainty in complex work systems. In deciding how to use automated advice, the human operator must detect and comprehend the significance of contextual information potentially not accounted for by the automation. The goal is to minimize the probability of enacting incorrect automated advice (automation misuse) or not enacting correct advice (automation disuse; Lee & See, 2004; Parasuraman & Riley, 1997). The provision of automated advice can reduce operator problem evaluation and situation assessment (Parasuraman & Manzey, 2010; Smith et al., 1997). In addition, to manage workload, it is often strategic for operators to rely on automation in order to minimize the need for manual verification of automated advice (Madhavan & Wiegmann, 2007; Moray, 2003). Increased verification of advice may well decrease automation disuse and misuse, but can potentially increase workload and decision time, making automation use counterproductive. Ideally, when aided by automation, operators should manually verify automated advice to a necessary and reasonable extent to achieve the most accurate outcomes possible in a given task context (optimal information sampling; Moray & Inagaki, 2000). In terms of optimal verification behavior, verification is most required when there is uncertainty in automated advice and a reasonably high probability of identifying disconfirming evidence (Cohen et al., 1998).
Several factors that decrease verification of automation have been identified. These include increased reliability of automation (Muir, 1987), increased operator self-confidence relative to operator trust in automation (de Vries et al., 2003), and the anticipated workload associated with verifying automation (Ezer et al., 2008). Another factor is the consequence of an incorrect decision, known as decision risk (Cohen et al., 1998). In defense contexts, incorrect decisions may have low risk such as minimal damage to equipment or high risk such as the loss of civilian life (Knighton, 2004). There is evidence that automation verification increases with increased decision risk (Ezer et al., 2008; Satterfield et al., 2017).
A further factor that may decrease the accuracy of automation use and increase the perceived need for automation verification is that operators may find it difficult to understand the reasoning underlying automated advice and what they should expect to happen if that advice is followed. One solution is to increase the transparency of automation (Chen & Barnes, 2014; Lyons et al., 2017; Roundtree et al., 2019; also historically referred to as automation visibility, observability, or representation aiding, for example, Dorneich et al., 2017; McGuirl & Sarter, 2006; Woods, 1995, 1996). Chen et al.’s (2014) situation awareness-based agent transparency (SAT) model of automation transparency incorporates Endsley’s (1995) theory of situation awareness and Lee and See’s (2004) theory regarding trust in automation. The first level (Level 1) of transparency provides the operator with information about the automation purpose and intent. Level 1 + 2 additionally provides information about the rationale behind the advice. Level 1 + 2 + 3 further provides information regarding the projected outcomes if automation advice is followed and the uncertainty (if any) associated with these projections. Several research groups have had success reducing automation disuse and misuse in simulations of UV management, vehicle convoy dispatching, and dismounted soldier management, by designing transparent automation based on the SAT model (e.g., Mercado et al., 2016; Stowers et al., 2020; see Bhaskara et al., 2020 for a review). However, to our knowledge, no prior research has examined the impact of transparency on the probability of an operator verifying automated advice.
The current study extends the literature by examining the effect of decision risk and automation transparency on the accuracy and timeliness of operator decisions, automation verification rate, and subjective workload. Participants were trained to select the optimal UV to complete missions. Participants were presented UVs and received automated advice recommending Plan A (automation’s top UV choice) and Plan B (back-up UV). Participants were told that the automation would not always be accurate because it was not privy to intelligence (Intel), and that in some cases, Plan B should be selected. Participants were required to evaluate the relative importance of the mission attributes, the UV capabilities, and the impact of Intel, to decide between Plans A and B.
We provided participants with either Level 1 + 2 or Level 1 + 2 + 3 transparency. Level 1 + 2 provided the formulae that the automation used to combine the UVs’ properties to calculate capability, thereby communicating how the automation was analyzing the data to provide advice. Level 1 + 2 + 3 additionally provided a projected outcome, that is, an integrated visualization of how the UVs for Plans A and B would perform relative to each other (i.e., what would happen if the advice was followed). We did not include Level 1 transparency because this has typically produced poorer outcomes than Level 1 + 2 across a variety of paradigms, including in a similar version of the current UV task (see Bhaskara et al., 2020, 2021). Further, in our prior study, contrary to predictions we found that decision accuracy was poorer with Level 1 + 2 + 3 compared with Level 1 + 2 transparency due to an increased bias toward agreeing with automation (Bhaskara et al., 2021). In the current study, we designed a more intuitive visualization of projected outcomes for Level 1 + 2 + 3 transparency in order to facilitate comparison between Plans A and B—a point of difference with Bhaskara et al. (2021) that we outline further in the Discussion section.
We also manipulated decision risk and measured automation verification by including a task feature that participants could use a calculator that would precisely determine which UV was optimal based on task conditions and Intel. This design reflects situations in which UV operators are likely to spend time checking automated advice with auxiliary information, and participant interaction with the calculator provided a proxy measure of automation verification. We discouraged calculator use (and decision errors) with financial penalties (Satterfield et al., 2017). Participants lost more money for failing (i.e., selecting the suboptimal UV plan or not responding) on high- compared to low-risk missions, and calculator use always cost money, but less than failing a mission. These costs were designed to emulate an important feature of many work settings—the need to maintain manageable workload whilst optimizing decision accuracy as a function of task context.
We anticipated that decision accuracy would increase for high- compared with low-risk missions, that participants should take longer to make high-risk decisions to attain increased accuracy, and that subjective workload should increase if more cognitive capacity is deployed for high-risk decisions. In addition, any increase in decision accuracy for high- compared to low-risk missions should come at the cost of increased automation verification. Level 1 + 2 + 3 transparency should lead to more accurate decisions than Level 1 + 2, without increasing decision time or workload. In a best-case scenario, Level 1 + 2 + 3 would also decrease automation verification compared to Level 1 + 2. This seems plausible, as presenting a visual integration of how the two UV plans will perform relative to each other (projected outcomes; Level 1 + 2 + 3) should be more useful for estimating the impact of Intel, and for deciding if the calculator is required, compared with Level 1 + 2, in which only the automation formulae are provided. For completeness, we also measured whether transparency impacted trust in automation and perceived system usability.
Method
Participants
One hundred and eighteen undergraduate students (64.4% female; M = 23.53 years) at the University of Western Australia participated for course credit, and a performance-based financial incentive (up to AUD $15). Participants were randomly assigned to the Level 1 + 2 (n = 59) or Level 1 + 2 + 3 (n = 59) condition. The research was approved by the Human Research Ethics Office at the University of Western Australia. Informed consent was obtained from each participant.
Unmanned Vehicle Task and Procedure
The UV task was run on desktop computers. Mission information was presented in panels on the mission window (left display), and the tactical map (right display) included a side panel that displayed UV properties (Figure 1: image left). Forty-eight unique missions were developed, presented on either urban, rural, or ocean terrains. Participants were instructed to deploy the optimal UV to complete each mission. Each trial started with a familiarization phase, followed by a mission phase (one mission was presented per trial). Participants completed 12 training trials (with feedback). After a short break, they then completed 36 test trials without feedback. There was a 60-s break after 18 test trials.

The left image depicts a participant completing the UV task with left and right monitors showing the mission window and tactical map respectively, and a sheet of paper containing the printed formula (magnified in right image). The printed formula was present on the wall above the two monitors (as seen the left image) in both transparency conditions. Reprinted from Bhaskara et al. (2021) with permission by Elsevier.
Familiarization phase
Participants prepared for each upcoming mission by reviewing the four UVs (combination of aerial [UAV], ground [UGV], or surface [USV] vehicles) and Intel (Figure 2). The tactical map showed the UVs’ call signs (e.g., UAV1), location, speed, and fuel efficiency. Three Intel message notifications were presented in the Intel panel sequentially at 3, 6, and 9 s. Participants clicked on each notification to open and read the Intel. Each new Intel message was added to the window, and the Intel presented at the top was the most recent one; the content of Intel remained available after being opened. Each familiarization phase had a duration of 15 s.
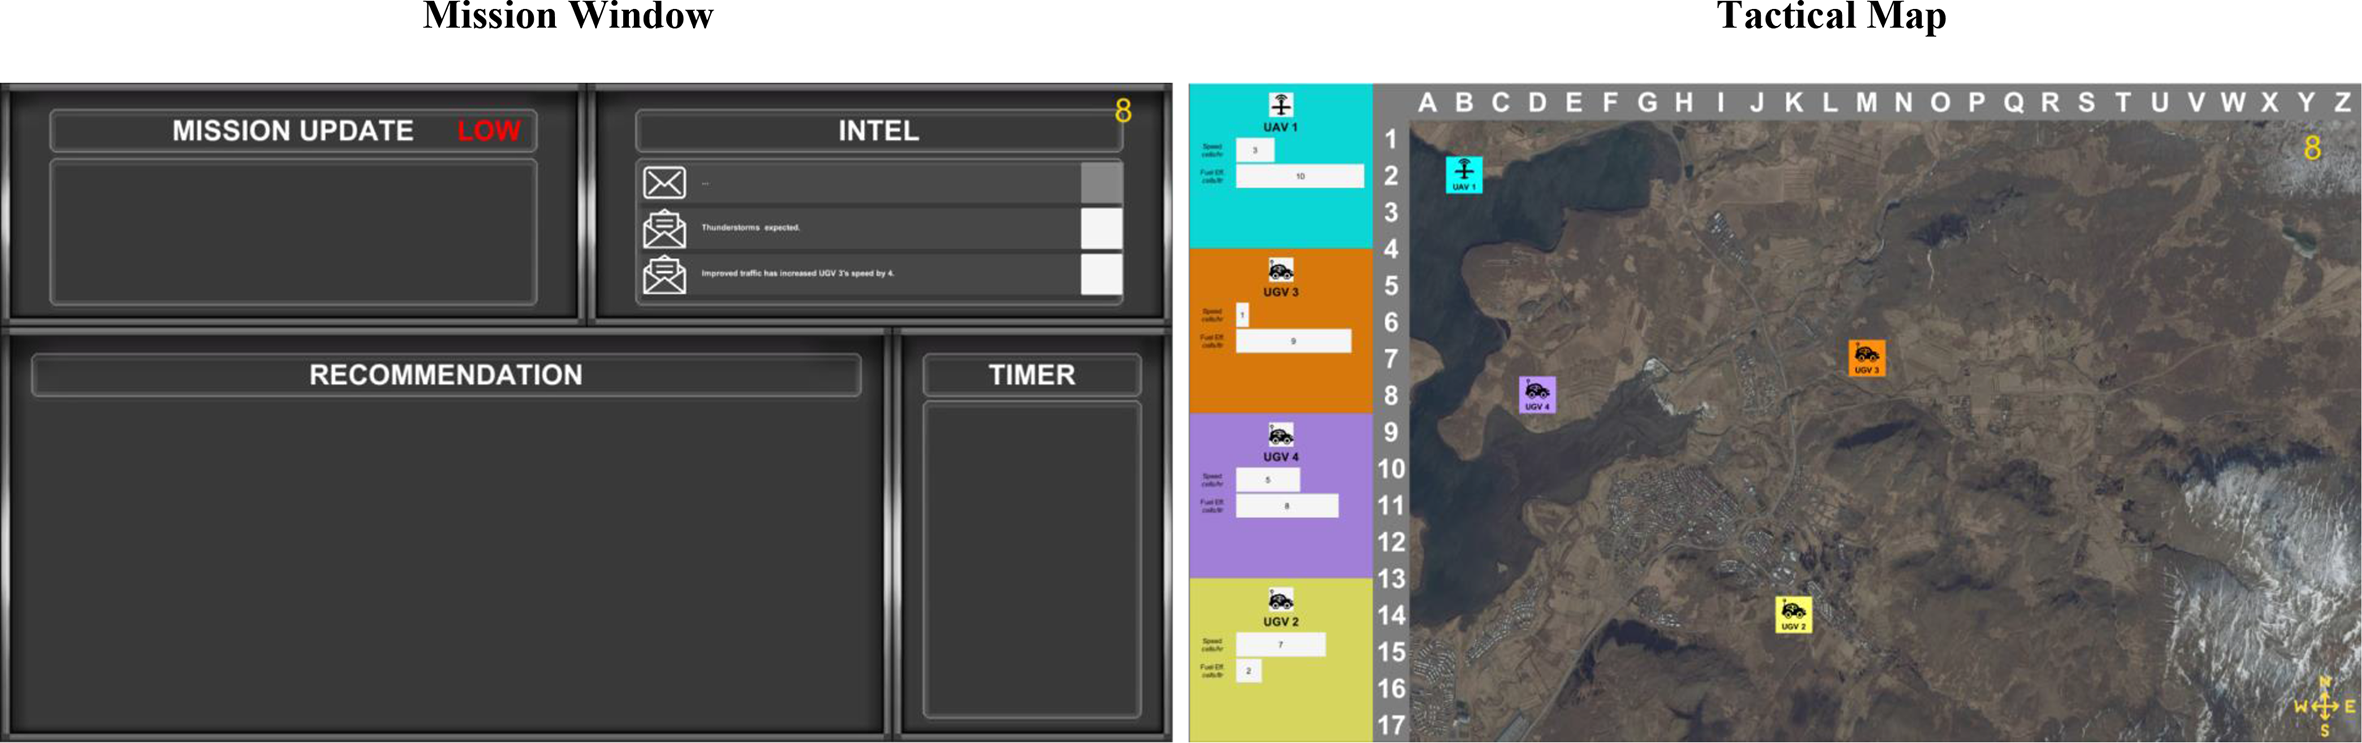
Displays for the familiarization phase. The UV task displaying the mission window (left) and the tactical map (right) during the familiarization phase of a sample low-risk mission. The mission window contained the Mission Update, Intel, Recommendation, and Timer panels. Mission risk is indicated in red with “LOW” or “HIGH.” The tactical map showed the four UVs with their speed and fuel efficiency (displayed on the side panel to the left of the map) presented numerically and in analog (i.e., by bar length). The rural terrain map was used for this mission. The display shown for the familiarization phase was identical across the two transparency conditions. Reprinted from Bhaskara et al. (2021) with permission by Elsevier.
Mission phase
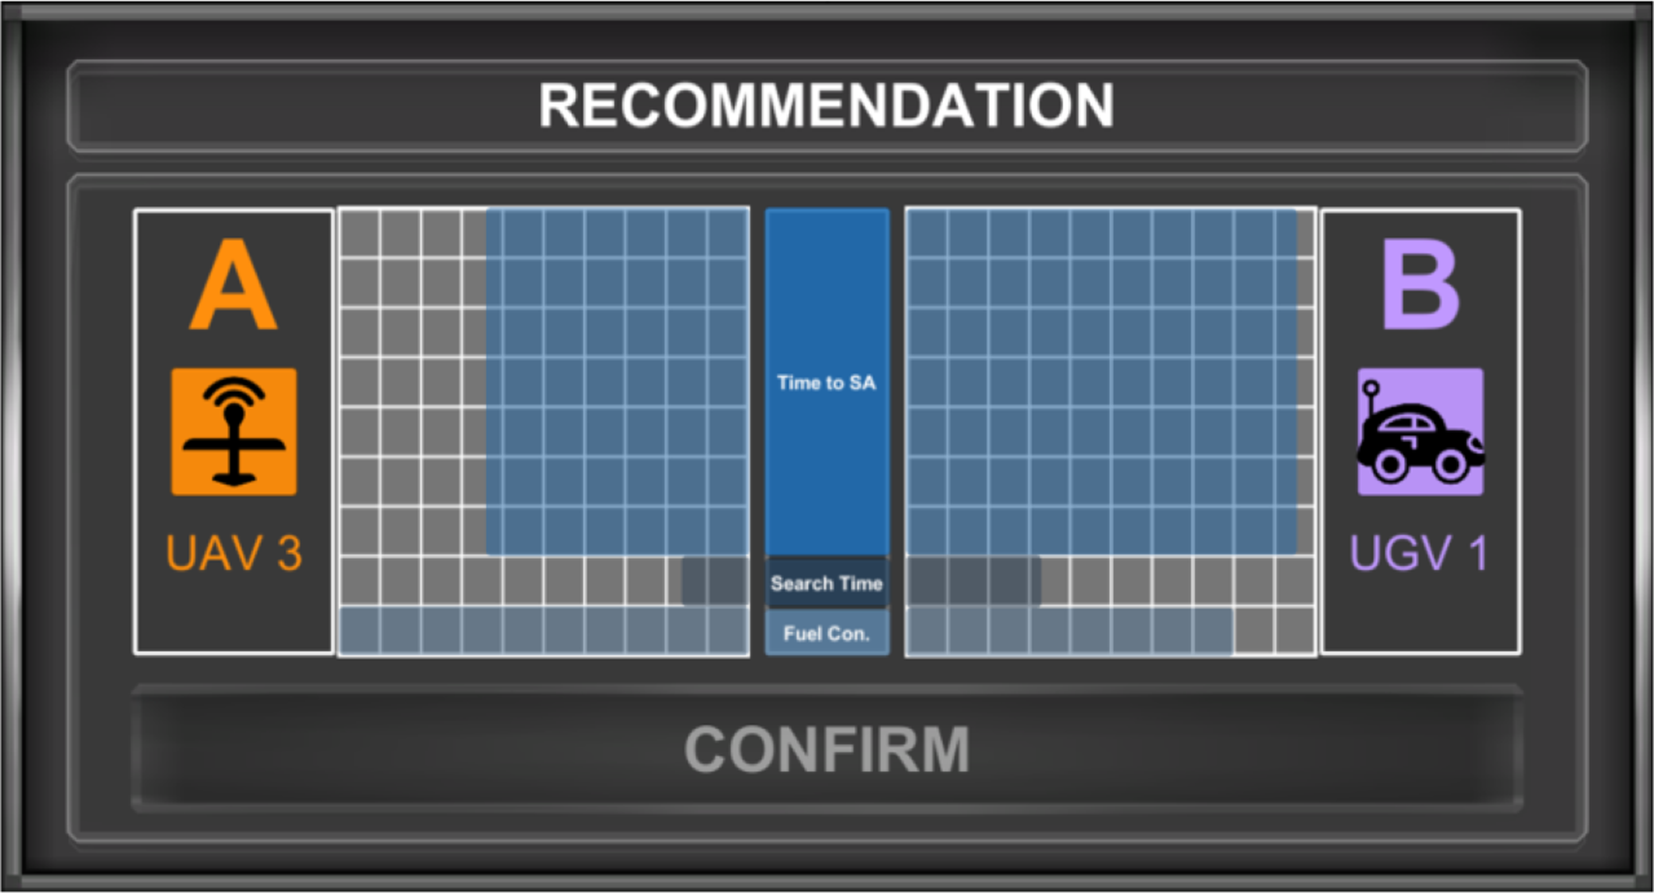
Each mission phase started after each familiarization phase and had a maximum duration of 45 s. At mission onset, a communication (e.g., “Poachers have been reported to be hunting within protected national park. Send a vehicle to intercept them”) was presented in the Mission Update panel, as shown in Figures 3 and 4. The tactical map indicated the location and search area (gray box), and any remaining Intel unopened by the participant during familiarization was automatically opened. The automated advice (Figures 3 and 4: Plan A [UGV4] and Plan B [UGV3]) was displayed in the Recommendation panel. During the mission phase, only the two recommended UVs remained on the tactical map, and two additional properties of these UVs (distance-to-search-area and search-steps) were displayed. Participants had to select a plan and click the “Confirm” button for UV deployment within the remaining time (indicated by countdown on Timer panel).
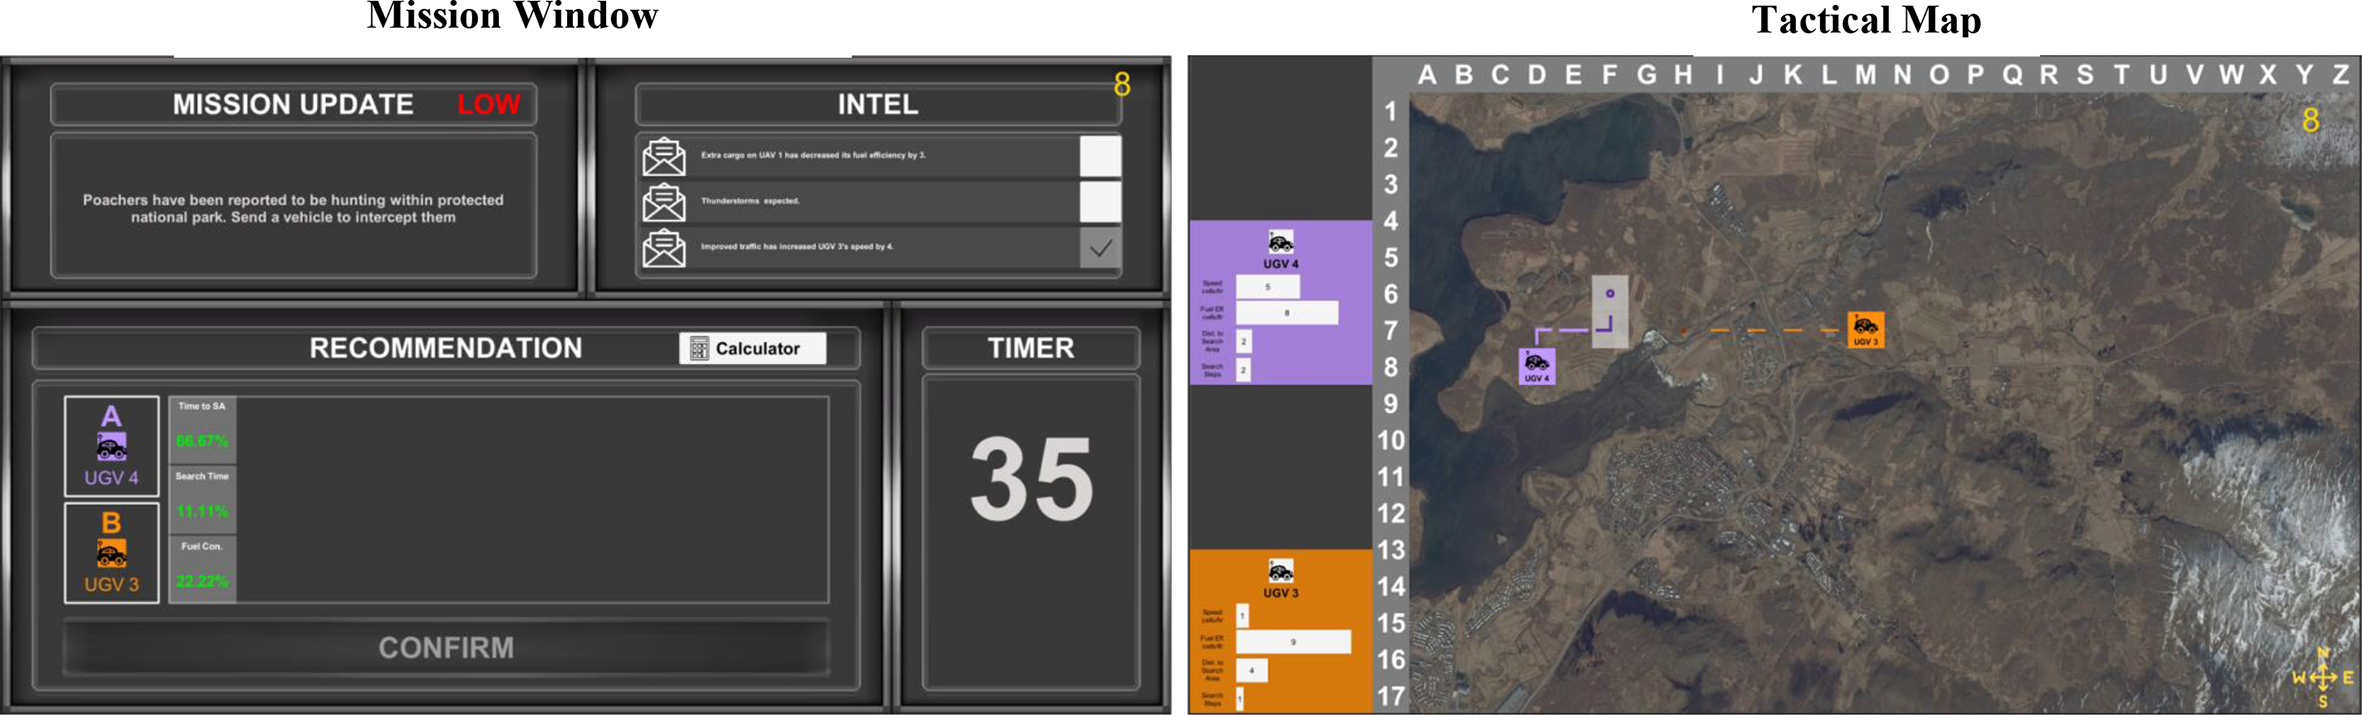
Level 1 + 2 transparency condition (mission phase). The UV task displaying the mission window (left) and the tactical map (right) during the mission phase for a sample low-risk mission, as presented to the Level 1 + 2 transparency condition. The Mission Update and Intel panels showed the mission and Intel, respectively. In the Recommendation panel, the two most optimal UVs were selected as Plans A (UGV4) and B (UGV3), and the relative importance weightings of the three mission attributes were displayed as percentages (i.e., Time to SA 66.67%, Search Time 11.11%, Fuel Con. 22.22%). The Calculator button was displayed, and if clicked, a new window, as depicted in Figure 5, was presented and replaced the right display (tactical map) of Figure 3. The Timer panel showed the time remaining to make a decision, counting down from 45 s. The tactical map showed the two recommended UVs and two additional sources of data for the two UVs (distance-to-search-area and search-steps) displayed on the side panel, presented numerically and in analog (i.e., by bar length). The translucent gray box depicted the mission location and its associated search area. Reprinted from Bhaskara et al. (2021) with permission by Elsevier.
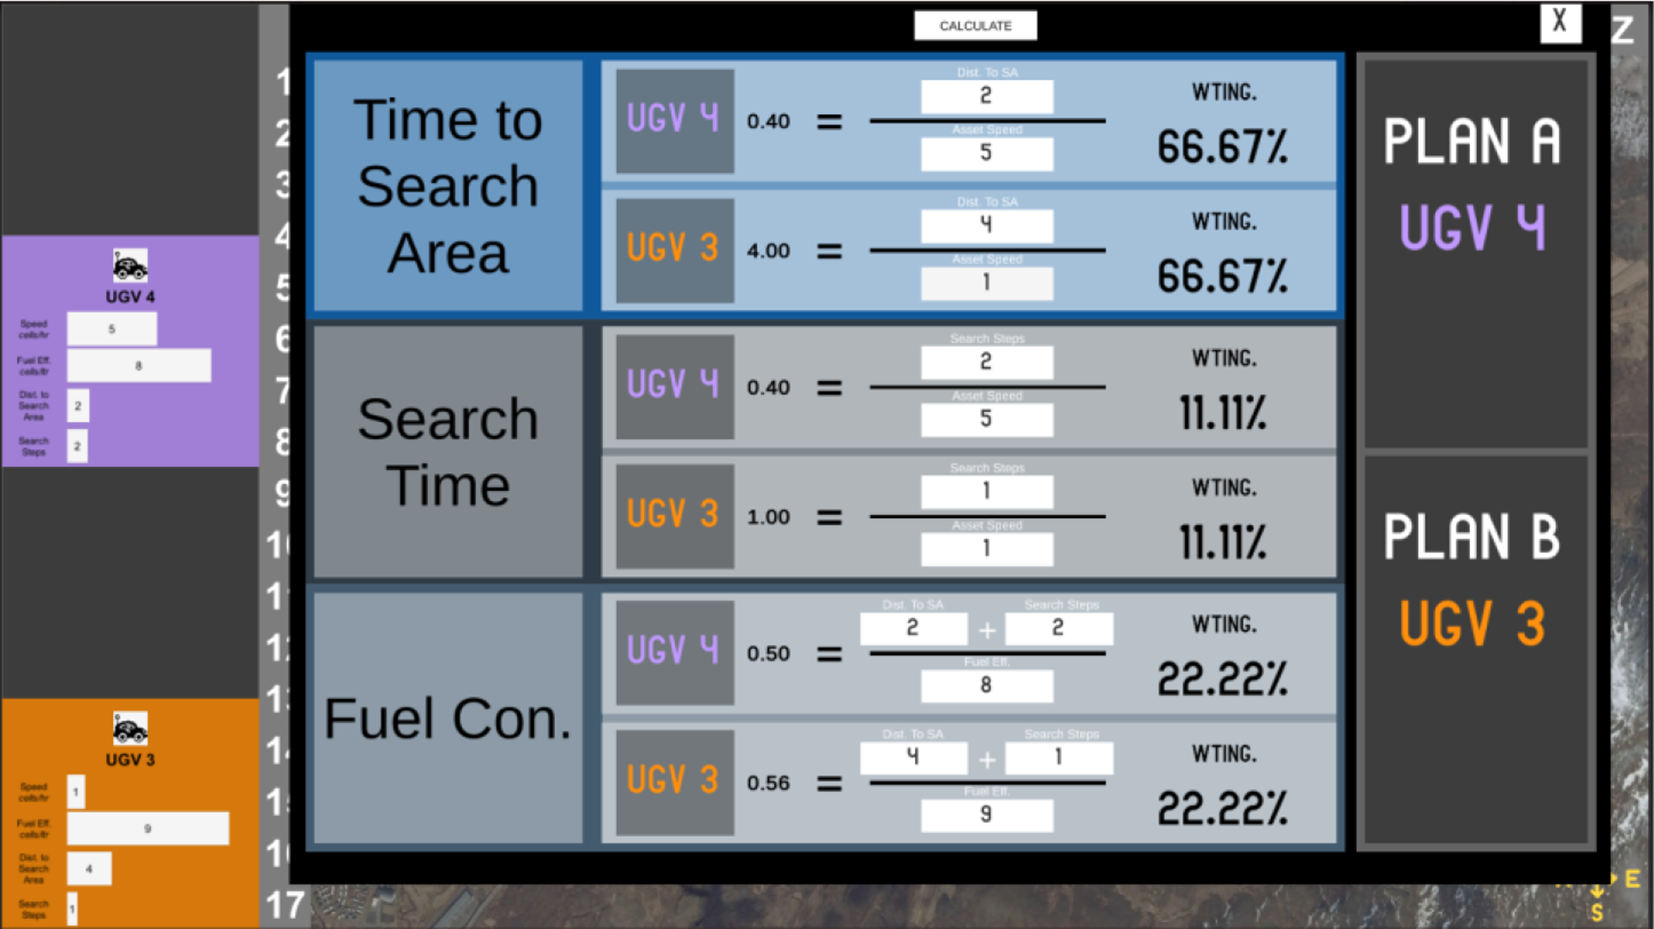
Calculator window display (mission phase). Participants changed the relevant UV property in the calculator based on Intel. In the running example, due to Intel 1 that “Improved traffic has increased UGV3’s speed by 4,” the participant would change the speed of UGV3 from 1 to 5, and the calculator would then indicate (highlight) which of the two was the optimal plan. Note that the participants only needed to change a given value once; for example, if they changed the speed from 1 to 5 as shown above for Time to Search Area, the new speed was then automatically populated for Search Time.
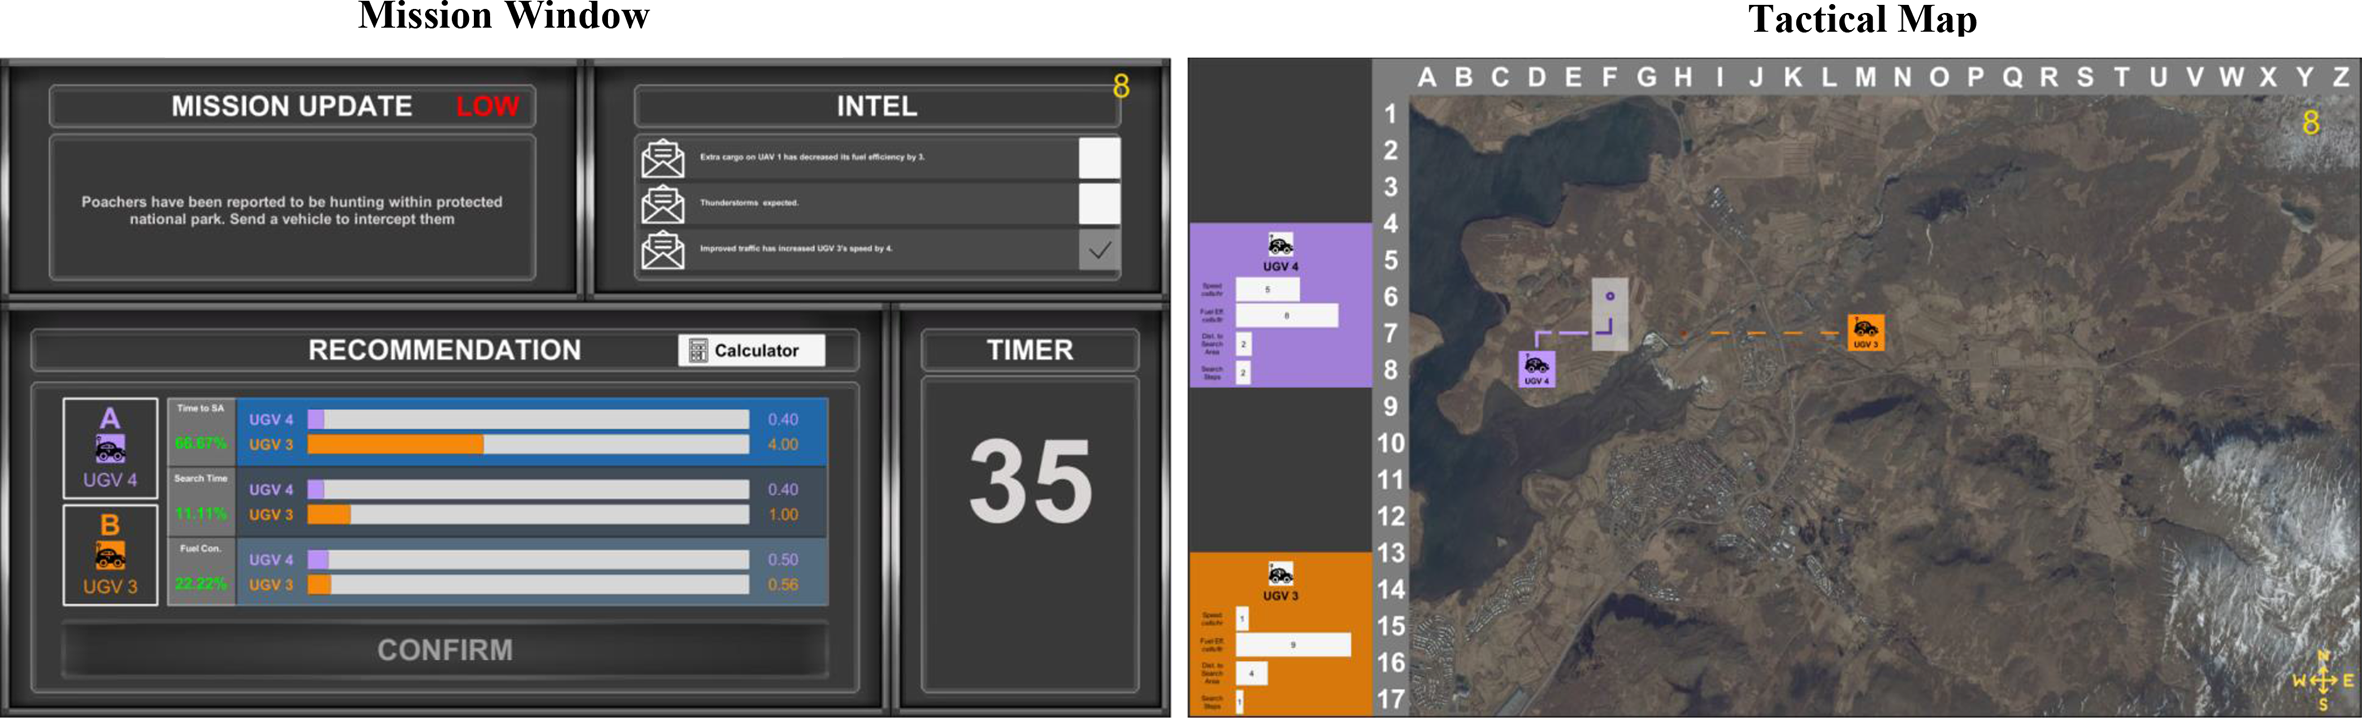
Level 1 + 2 + 3 transparency condition (mission phase). The UV task displaying the mission window (left) and the tactical map (right) during the mission phase, as presented to the Level 1 + 2 + 3 transparency condition. The display features were identical to the Level 1 + 2 (Figure 3), except with the additional visualization of the projected outcomes for the two plans. These projected outcomes displayed how the two UVs chosen for Plans A and B would perform (relative to each other) on each of the weighted mission attributes. Projected UV performance was indicated by horizontal shaded bars for each UV on each weighted mission attribute, and an exact projected outcome numerical value was displayed to the right of each bar. Reprinted from Bhaskara et al. (2021) with permission by Elsevier.
The automation used the UVs’ properties (speed, fuel efficiency, distance-to-search-area, search-steps) to calculate each UV’s capability on three mission attributes: (a) Time to Search Area (how much time it takes the UV to reach the search area = distance to search area/UV speed); (b) Search Time (how much time the UV takes to search the area = search steps/UV speed); and (c) Fuel Consumption (how much fuel the UV uses to complete the mission = [distance to search area + search steps]/UV fuel efficiency). Mission attributes had different weightings on each trial, and these weightings were displayed as percentages in the Recommendation panel. For example, for the mission presented in Figures 3 and 4, the Time to Search Area had the highest weighting (66.67%). The UV score on each mission attribute was multiplied by the weighting for that attribute and then summed. The UV with the lowest overall score was selected by the automation as Plan A, and the UV with the next lowest score selected as Plan B.
Intel relevance
Participants were instructed that while the automation was reliable, it would not be 100% accurate. Participants were not told the exact automation reliability. Plan A was optimal (i.e., the automated advice was correct) on 75% of trials. For the remaining 25%, Plan B was optimal due to Intel. Each of the three Intel messages on each trial (text-based) could have a positive impact (e.g., in Figures 3 and 4, Intel 1’s indication of “Improved traffic has increased UGV3’s speed by 4,” led to better UGV3 performance on Time to Search Area and Search Time); a negative impact (e.g., “Extra cargo on UAV1 has decreased its fuel efficiency by 3”); or no impact (e.g., “Thunderstorms expected”) on UV capability. Participants were instructed that Intel that stated a quantitative change in a property or position of a UV associated with Plan A or B (relevant Intel) could potentially impact recommendations, and other Intel such as those impacting the two nonselected UVs (irrelevant Intel) could not. Out of the three Intel per mission, there was one relevant Intel present in 30 of 36 test trials (83%). In the remaining six test trials (17%), all three Intel were irrelevant. In nine of the 30 test trials (30%) containing relevant Intel, Plan B was optimal due to the direction and magnitude of the impact that the relevant Intel had on Plans A and B. Thus, overall, the automation was correct on 27 of the 36 test trials (75% reliability).
The training and test trials had the same automation reliability rate and proportion of relevant Intel. A full list of the missions and Intel is presented in Bhaskara et al. (2021).
Calculator (automation verification)
Participants could press the “Calculator” button on the tactical display during the mission phase (Figures 3 and 4) to trigger a panel display with several prepopulated calculations (Figure 5). They could then change the relevant UV property in the calculator based on Intel to derive updated plan calculations. All participants started with a $15 financial incentive, and money was deducted with each instance of calculator use during test trials. To discourage use of gaming strategies, participants were not told the exact dollar amount that would be deducted for calculator use (but were told it would be less than that deducted for failing a mission). Participants were also not provided feedback on test trials.
Manipulation of transparency
Participants in the Level 1 + 2 condition (Figure 3) were provided audio-visual instructions that detailed how automation would evaluate UV capabilities against the weighted mission attributes to determine Plans A and B, including several mission examples demonstrating how the automation applied the formulae for calculating UV capability on mission attributes.
Participants in the Level 1 + 2 + 3 condition (Figure 4) received the same instructions as participants in Level 1 + 2 condition; however, they additionally received a projected outcome visualization depicting how the UVs chosen for each plan would perform relative to each other. Projected UV performance was indicated by horizontal shaded bars for each UV on each weighted mission attribute, and an exact projected outcome numerical value was displayed to the right of each bar. The representation of these bars was linear and constant across trials (i.e., a difference of 1.00 in one trial would be the same physical width as a difference of 1.00 on a different trial). Shorter bars indicated less Time to Search Area, less Search Time, and less Fuel Consumption, and therefore indicated superior capability. In Figure 4, UGV4 has a smaller score on Time to Search Area, Search Time, and Fuel Consumption, indicating superior capability over UGV3.
Participants in the Level 1 + 2 + 3 condition were trained on how to use the projected outcome visualization to assess the impact of Intel on plans and were provided several mission examples. This training included specific information regarding the relationship between potential Intel messages and corresponding changes to expect in the projected outcome visualization. In our running example (Figure 4), Intel 1 improved the UGV3’s capability on Time to Search Area and on Search Time due to its increased speed. However, the projected outcomes indicate that UGV3’s Time to Search Area (the most heavily weighted mission attribute) is much poorer than UGV4, and thus it should be apparent that increasing UGV3’s speed by 4 is unlikely to make Plan B the optimal plan. Note that the projected outcome bars did not change as a function of Intel because the automation was not privy to Intel, and thus the participant needed to assess the impact of Intel on the two plans.
Manipulation of mission risk
Each mission was defined as high or low risk. Mission risk was presented on the Mission Update Panel and was announced via an audio message as “high risk” or “low risk” at the start of each familiarization and mission phase. Participants were only told that selecting the suboptimal UV plan, or not responding, would incur a higher monetary loss for high-risk compared with a low-risk missions. Participants were not told the exact amount that would be deducted.
The assignment of risk (high or low) to each mission was counterbalanced across participants, so that across participants each mission was used equally often as either high or low risk. The order of presentation of missions was random for each participant.
Measures
Accuracy of automation use and decision time
We calculated the hit rate (the proportion of missions that participants correctly selected Plan A), and the correct rejection rate (the proportion of missions where participants correctly selected Plan B). The Signal Detection parameter d’ assessed the sensitivity of participants to discriminate Plan A from Plan B. The bias parameter c assessed the degree to which participants were biased toward agreeing with automation (choosing Plan A) as indicated by negative values; and positive values indicating a bias towards disagreeing with automation. We adjusted for extreme hit (0 or 1) and false alarm (0 or 1) values by replacing rates of 0 with 0.5/n and rates of 1 with (n – 0.5)/n; where n is the number of signal trials (Plan A correct; 75% of trials) when calculating hit rate, and n is the number of noise trials (Plan B correct; 25% of trials) when calculating false alarm rate (Macmillan & Kaplan, 1985). Missions with calculator use were scored as correct. Correct decision time was defined as the time taken to select Plan A or B from the time of mission onset (correct trials only). Non-responses were scored as incorrect decisions.
Automation verification
Automation verification rate was defined as the proportion of trials in which participants used the calculator before making a decision.
Subjective workload
Workload was measured using the Air Traffic Workload Input Technique (ATWIT; Stein, 1985). After each familiarization phase, participants were prompted, “How hard have you been working during this familiarization?” and after each mission phase were asked, “How hard have you been working during this mission?” They responded by clicking on a 10-point Likert scale from 1 (very low) to 10 (very high).
Trust
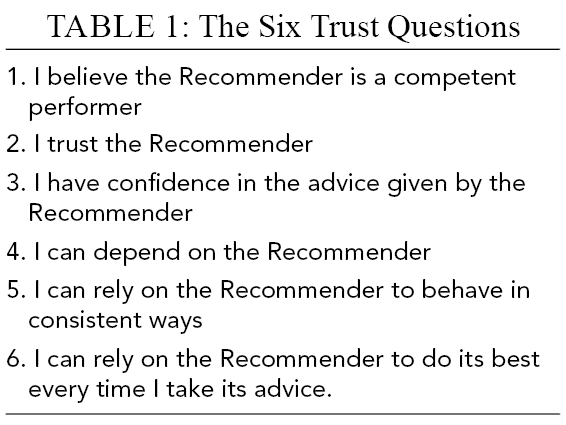
Trust in automation was assessed at the end of the experiment using a modified version of the Merritt (2011) scale. The scale included six items (Table 1) measured on a 5-point Likert scale, ranging from 1 (strongly disagree) to 5 (strongly agree).
The Six Trust Questions
System usability scales (SUS)
Perceived usability was measured at the end of the experiment using a ten-item survey (Table 2) on a 5-point Likert scale (Brooke, 1996), scored from 0 (strongly disagree) to 5 (strongly agree). The participants’ scores for each question were converted (reverse-scored if required), added together, and then multiplied by 2.5 to derive a final score between 0 and 100 (Brooke, 1996).
The Ten System Usability Questions
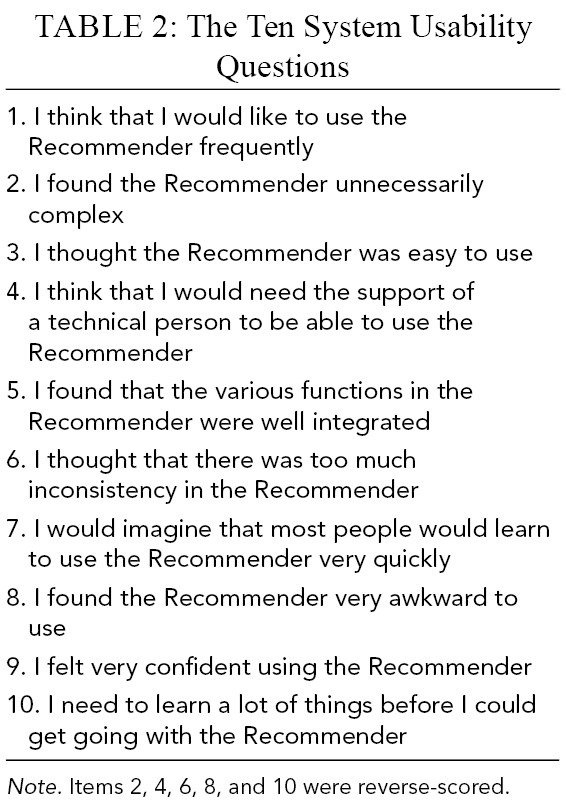
Note. Items 2, 4, 6, 8, and 10 were reverse-scored.
Results
Two participants from the Level 1 + 2 transparency condition did not adequately follow task instructions and their data were excluded.
Training Data
Participants responded to 82% (SD = 12%) of training missions correctly. A 2 (Level 1 + 2, Level 1 + 2 + 3 transparency) × 2 (first-half training, second-half training) mixed analysis of variance (ANOVA) revealed a main effect of training, F(1,114) = 6.97, p = .01, with higher accuracy during the second half (M = .85, SD = .15) compared with the first-half of training (M = .80, SD = .17). There was no main effect of condition, F < 1, and no interaction, F(1,114) = 1.96, p = .16.
Test Data
Participants responded to 99.5% of missions within the available time and there was no difference in non-response rate as a function of transparency or decision risk.
Table 3 presents descriptive statistics and inter-correlations on the test trials. Many correlations are as expected, such as automation use accuracy (d’) being strongly positively associated with hit and correct rejection rate, the correct rejection rate being strongly associated with a bias toward disagreeing with automation (c), and automation verification rate being positively associated with automation use accuracy. A strong positive association was found between workload ratings made after familiarization and mission phases. There was a strong positive association between trust and perceived usability. A bias toward disagreeing with automation was moderately positively associated with correct decision time.
Overall Means, Standard Deviations, and Inter-Correlations Between Accuracy of Automation Use (Hit, Correct Rejection, Sensitivity, and Response Bias), Automation Verification, Decision Time, Subjective Workload, Trust in Automation, and Perceived Usability of Automation
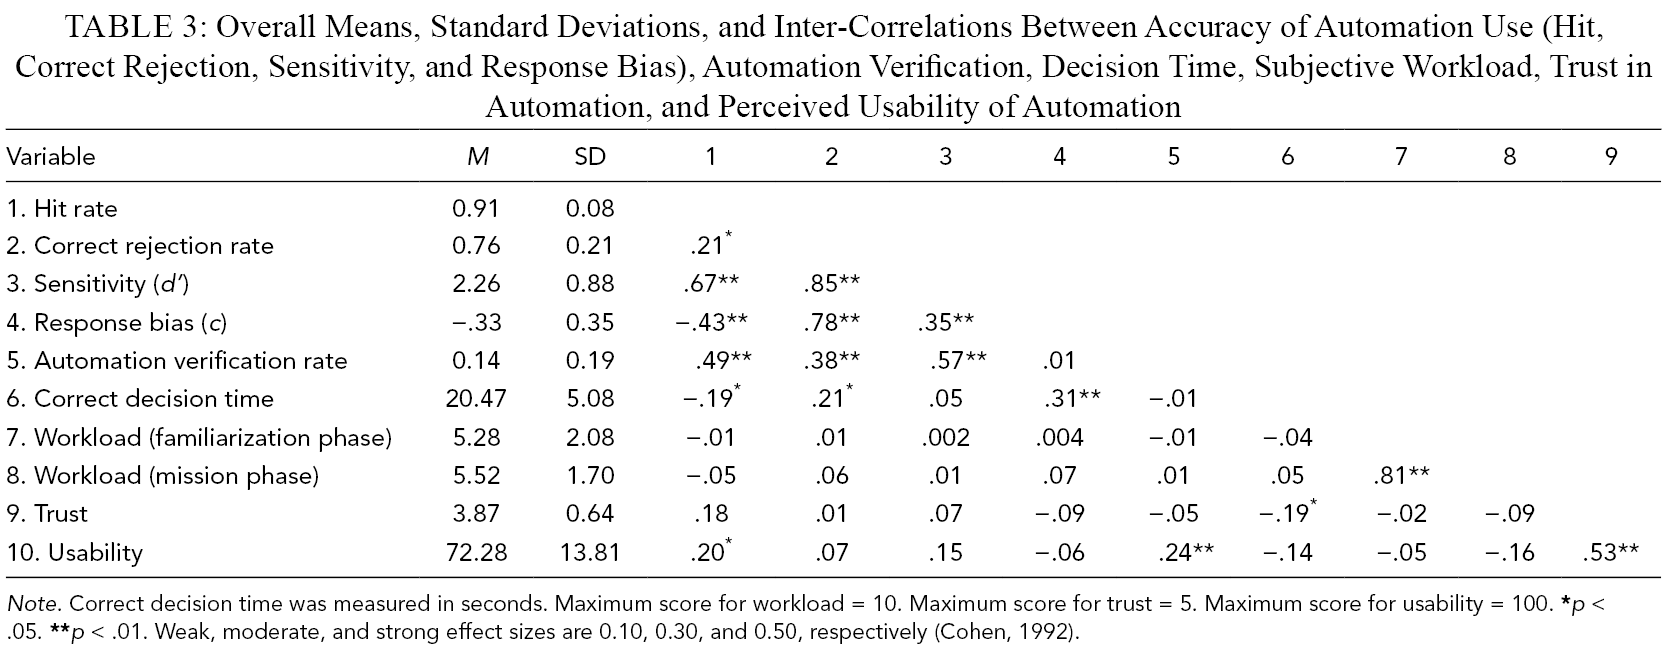
Note. Correct decision time was measured in seconds. Maximum score for workload = 10. Maximum score for trust = 5. Maximum score for usability = 100.
Table 4 presents the descriptive statistics for the test trials for each dependent variable as a function of risk and transparency. We analyzed the hit rate, correct rejection rate, sensitivity (d’), response bias (c), correct decision time, and automation verification using 2 Transparency (Level 1 + 2, Level 1 + 2 + 3) × 2 Risk (low, high) mixed ANOVAs. The between-subjects factor was transparency, and the within-subjects factor was risk. Effect sizes were estimated using partial eta-squared (small = .01, medium = .06, large = .14; Cohen, 1992).
Mean Accuracy of Automation Use (Hit, Correct Rejection, Sensitivity, and Response Bias), Automation Verification, Correct Decision Time, and Subjective Workload, as a Function of Transparency and Risk Condition
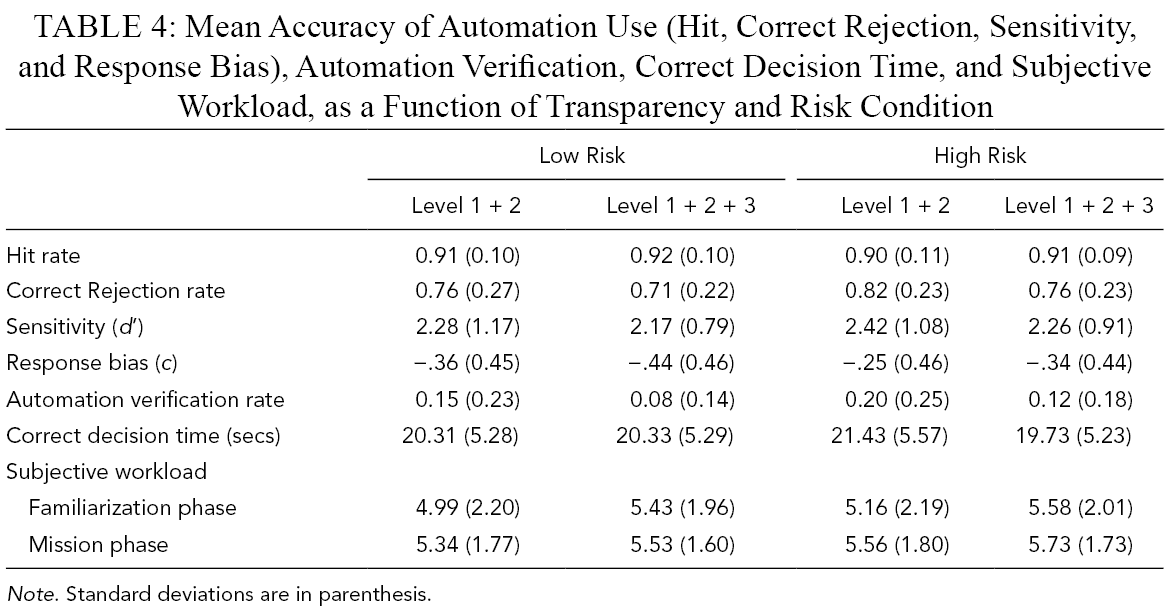
Note. Standard deviations are in parenthesis.
Accuracy of automation use
There was no significant difference in the Hit rate as a function of transparency or risk, and no interaction (all Fs <1).
Participants were more likely to correctly reject automation (choose Plan B) for high- compared with low-risk missions, F(1,114) = 5.05, p = .026,
There was no significant difference in sensitivity (d’) as a function of transparency (F < 1) or risk, F (1,114) =1.76, p = .19, and no interaction (F < 1).
Participants were less biased toward agreeing with automation (choosing Plan A) for high- compared with low-risk missions, F(1,114) = 4.04, p = .047,
Correct decision time
There was no main effect of transparency or risk on decision time (Fs <1). There was a significant interaction between transparency and risk, F(1,114) = 8.37, p = .005,
Subjective workload
We used a 2 Transparency (Level 1 + 2, Level 1 + 2 + 3) × 2 Risk (low, high) × 2 Phase (familiarization, mission) mixed ANOVA, with phase as a within-subjects factor. Workload ratings from two participants from the Level 1 + 2 + 3 condition were missing due to technical difficulties. Participants rated workload as higher on high- compared with low-risk missions, F(1, 112) = 27.69, p < .001,
Automation verification
As indicated in Table 4, the automation verification rate was higher for high- compared with low-risk missions, F(1,114) = 14.28, p < .001,
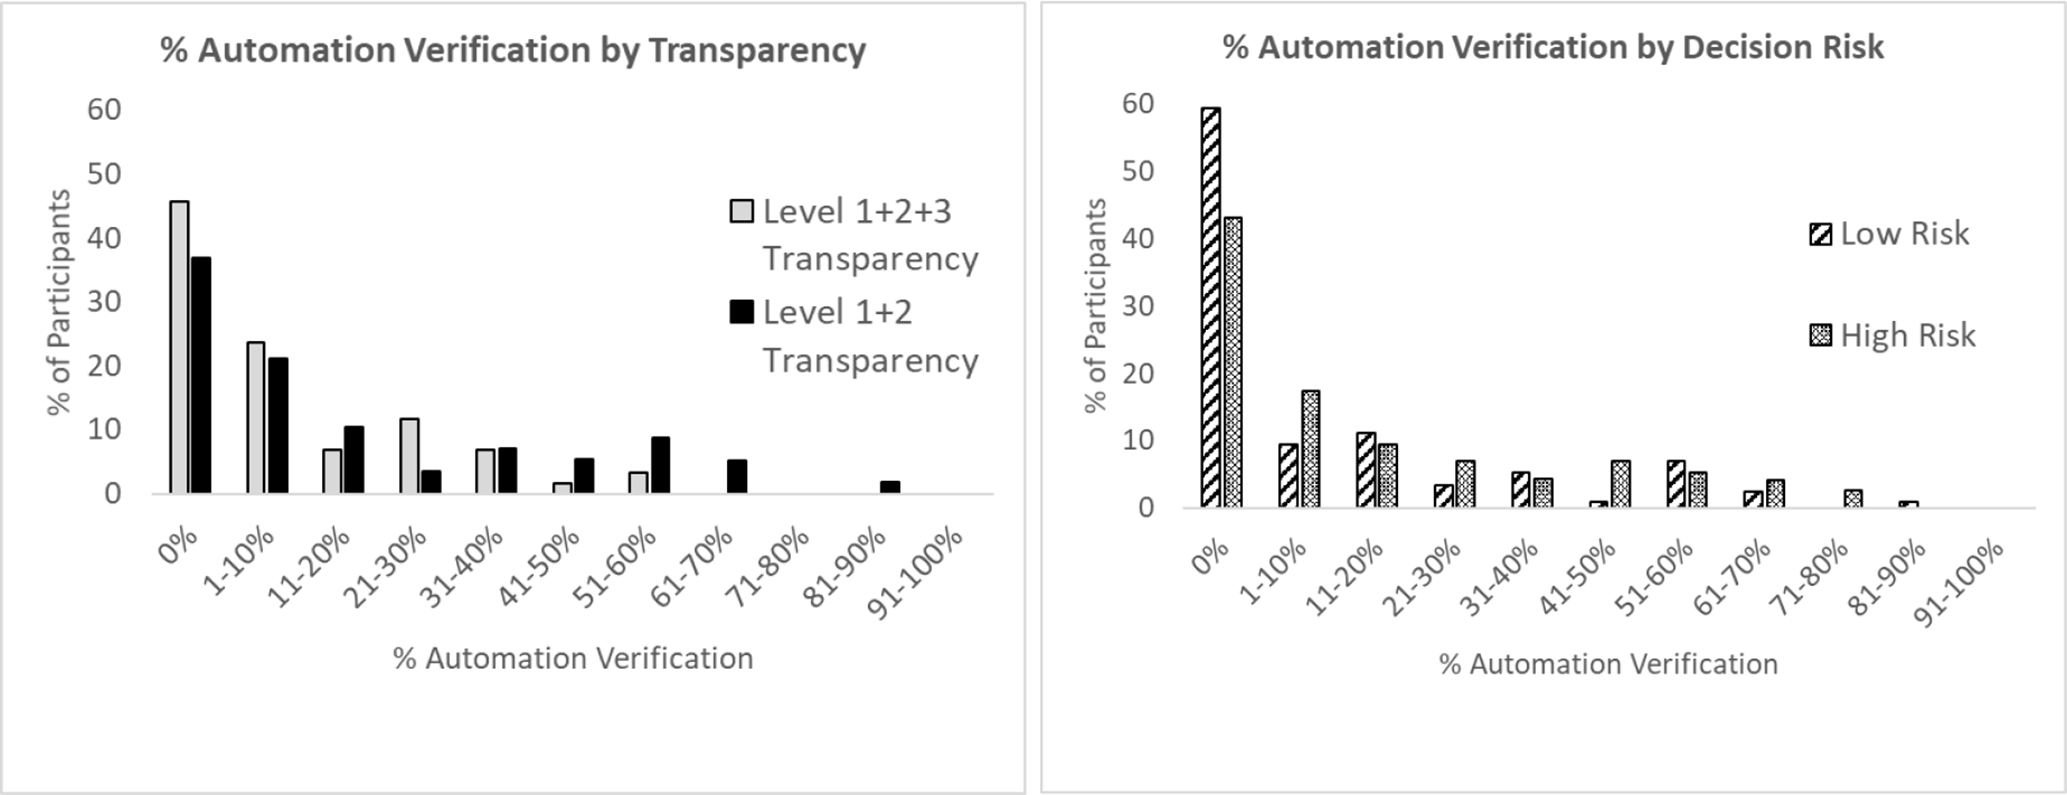
Automation verification rate as a function of the main effects of transparency and risk. When interpreting Figure 6, note that the left graph (transparency) reflects total automation verification (across both low- and high-risk missions) for participants in the Level 1 + 2 + 3 compared with the Level 1 + 2 transparency. The right graph reflects automation verification as a function of low risk (i.e., representing 50% of missions) and high risk (50% of missions) collapsed across transparency (i.e., all participants).
Trust and perceived usability of automation
There was no significant difference in trust for Level 1 + 2 (M = 3.83, SD = .61) compared with Level 1 + 2 + 3 (M = 3.91, SD = .68), t < 1. There was no significant difference in usability for Level 1 + 2 (M = 74.34, SD = 12.58) compared with Level 1 + 2 + 3 (M = 70.38, SD = 14.66), t(114) = 1.56, p = .12.
Discussion
The aim of the current study was to examine the effects of decision risk and of automation transparency, on the accuracy and timeliness of decisions, automation verification rates, and workload. Participants were more likely to correctly reject recommendations, and relatedly, were less biased toward agreeing with automation, for high- compared to low-risk missions, but there was no difference in overall decision accuracy (sensitivity) as a function of risk. Furthermore, participants were 4.8% more likely to verify automation and reported higher workload when completing high- compared to low-risk missions, and they took longer to make decisions (but only at Level 1 + 2 transparency). Increased transparency did not lead to more accurate decisions and did not impact workload or decision time; however, it decreased automation verification by 7.8%. Increased transparency also eliminated the increased decision time associated with high decision risk (that was found in Level 1 + 2). Transparency did not impact trust in automation or perceptions of system usability.
These outcomes are consistent with prior work that has found increased automation verification with increased decision risk (Ezer et al., 2008; Satterfield et al., 2017), although we did not find the accompanying improvement in decision accuracy found in some previous work (Satterfield et al.). Nonetheless, the fact that participants were more likely to reject incorrect automated advice for high-risk missions is a positive sign because in most work contexts, maximizing correct rejection rate would be critical. While the observed increase in subjective workload and automation verification for high- compared with low-risk missions is not necessarily problematic given the improved correct rejection rate, it would have been ideal if the improved correct rejection of automation were achieved without a concomitant impact on verification rate or workload. In addition, for participants using Level 1 + 2 automation, greater risk increased decision time.
Participants informal self-reports suggest that the decision of participants to use the calculator was often driven by the uncertainty associated with which plan was correct. With high decision risk, participants may have thus been less willing to tolerate uncertainty and opted to verify the automation in order to ensure a correct decision. We also found that participants were less likely to verify automated advice when provided higher transparency. To our knowledge, this is the first study to demonstrate decreased automation verification with increased transparency. At one level, the automation verification tool (calculator) could be initially viewed as being underutilized in the sense that its usage, even for the Level 1 + 2 transparency condition on high-risk trials (20%), was lower than the actual automation failure rate (25%). It is important to note however that it is likely that the financial penalty associated with calculator use discouraged participants from verifying automation. In addition, deciding when it was optimal to verify automation required participants to estimate the level of uncertainty in automated advice as a function of Intel. Presenting the integrated visualization of how the two recommended plans performed relative to each other on each of the weighted mission attributes (Level 1 + 2 + 3) was likely more useful for this estimation of the impact of Intel, and thus for deciding whether automation verification was required or not—compared with Level 1 + 2, in which weighted mission attributes and formulae were provided, but with no integration of the two.
Bhaskara et al. (2021) reported poorer decision accuracy with the use of Level 1 + 2 + 3 compared with Level 1 + 2 automation in a highly similar UV task, due to an increased response bias to agree with automation that resulted in increased automation misuse (i.e., enacting incorrect advice). In the current study, there was no significant difference in response bias or decision accuracy with the use of Level 1 + 2 + 3 compared to Level 1 + 2 automation, and this is likely due to the improvements we made to the presentation of the projected outcome visualization. In Bhaskara et al. (2021), the weighted mission attributes and relative UV performance were presented visually without numerical representation (Figure 7), whereas in the current study we displayed the weighted mission attributes and relative UV performance both visually and numerically. Further, unlike Bhaskara et al. (2021), we presented projected outcomes for Plans A and B adjacent to each other to facilitate their direct comparison.
The previously evaluated recommendation window for Level 1 + 2 + 3 condition (Bhaskara et al., 2021). The visualization of projected outcomes of the two plans was presented by Bhaskara et al. via the horizontal, blue-shaded bars. These projected outcomes displayed how the two UVs would perform (relative to each other) on each weighted mission attribute. The UV with the lowest score was selected as the optimal plan by the Recommender; in this example the horizontal, blue-shaded bars for UAV3 (Plan A) occupied less space overall than UGV1 (Plan B). Reprinted from Bhaskara et al. (2021) with permission by Elsevier.
Nonetheless, neither the outcomes from Bhaskara et al. (2021) nor from the current study are consistent with prior work that has reported improvement in hit rate (Stowers et al., 2020) or correct rejection rate (Mercado et al., 2016) for Level 1 + 2 + 3 compared with Level 1 + 2 in UV settings (for review see Bhaskara et al., 2020). As discussed further by Bhaskara et al. (2021), a key difference between our UV task and that used in prior work, is that our task includes complex quantitative data (e.g., assessment of the impact of changed UV speed on weighted mission attributes). In contrast, the Mercado et al. and Stowers et al. UV paradigms did not involve the evaluation of complex numerical calculations, and instead the required reasoning for assessing automated advice was qualitative and outcome deduction more straightforward (e.g., text boxes qualitatively indicated that the top-choice UV would achieve more adequate coverage or arrive faster because it had a more direct flight path). Bhaskara et al.’s (2021) and the current study’s outcomes indicate that designing transparent automation that uses quantitative reasoning may be more difficult, as it is not as “black-and-white” as transparency designed by Mercado et al. and Stowers et al. (where participants were either provided the extra diagnostic qualitative information with increased transparency or were not). However, the impact of this distinction between qualitative and quantitative transparency needs to be formally tested. It also remains possible that other representations of Level 1 + 2 + 3 quantitative transparency, or the use of other experimental test cases from the UV work domain, could lead to improved decision accuracy for Level 1 + 2 + 3 transparency (Morey et al., 2020).
Our UV task is broadly representative of work contexts in which operators rely on automation to assist with decision-making under time pressure on complex quantitative data, and thus the current findings have potential application for the design of automation transparency to improve human–automation teaming. Nonetheless, a limitation is that we used novice participants, and there are differences in the skills and motivations of novices compared with experts. Furthermore, there are features of the UV task that, while providing the required experimental control, limit generalizability to UV operations (Calhoun et al., 2018). First, our participants were told that automation was imperfect and why, whereas automation shortcomings in the field are often multidimensional. Second, our verification process removed all ambiguity regarding the correct plan. Third, automation would not always be able to include all the information required for the optimal display of automated advice and auxiliary information, due to limitations in the viewport size of computer displays which confines operator access to a portion of the possible visual field/variable space (the keyhole effect; Woods, 1984, 1995). Future research should be conducted that better represents anticipated demands on future UV human–automation teaming, such as designing for transparency when there are more UVs and associated mission plans, a larger variety of operator tasks, and/or higher task load in general.
We only measured trust in automation at the end of the session. A negative relationship between trust and automation verification may arise if we measured trust on a trial-by-trial rather than summative basis, which would have also allowed us to examine trust as a function of changed decision risk. It was surprising that we did not find an association between transparency and trust, and this warrants further investigation along with replication of our basic study outcomes given that some of the practical effect sizes for performance and subjective rating outcomes were relatively small. Finally, operators are more likely to rely on automation when trust in automation exceeds self-confidence in manual decision-making (Lee & Moray, 1994). Future research should examine the impact of risk and transparency on automation verification under conditions where the reliability of automation is manipulated and under conditions where participants make some decisions without automation assistance.
Key Points
The study examined the effect of decision risk, and of automation transparency, on the accuracy and timeliness of operator decisions, automation verification rates, and subjective workload in a simulated unmanned vehicle control task.
Participants were more likely to reject incorrect automated advice, but were also more likely to verify the advice, and reported higher workload, when completing high- compared with low-risk missions.
Increased transparency did not lead to more accurate decisions and did not impact workload, trust, or system usability ratings, but did decrease automation verification rates and eliminated the negative impact of increased decision risk on decision time.
The outcomes have potential application to the design of automation transparency, and for anticipating the impact of decision risk on operator behavior, in order to improve human–automation teaming.
Footnotes
Acknowledgments
This research was supported by a Research Grant from the Defence Science and Technology Group, Australia, and by the Australian Research Council Discovery Grant (DP160100575), both awarded to Shayne Loft.
Author Biographies
Shayne Loft is a professor at The University of Western Australia. He received his PhD in psychology in 2004 from The University of Queensland.
Adella Bhaskara is a research scientist at the Defence Science and Technology Group and a Visiting Research Fellow at The University of Adelaide. She received her PhD in psychology in 2015 from The University of Adelaide.
Brittany A. Lock was an honours student at The University of Western Australia. She is currently Strategy and Planning Manager at Mining Plus.
Michael Skinner was a senior research scientist at the Defence Science and Technology Group. He received his PhD in cognitive psychology in 1990 from the University of Tasmania.
James Brooks is a research scientist at the Defence Science and Technology Group. He received his PhD in psychology in 2016 from Edith Cowan University.
Ryan Li is currently working as an independent software developer and consultant at Applied Games and Simulations. He received his PhD in psychology in 2015 from the University of Western Australia.
Jason Bell is a senior lecturer at The University of Western Australia. He received his PhD in psychology in 2008 from The University of Western Australia.