



Abstract
Objective
The present studies examine how task factors (e.g., email load, phishing prevalence) influence email performance.
Background
Phishing emails are a paramount cybersecurity threat for the modern email user. Research attempting to understand how users are susceptible to phishing attacks has been limited and has not fully explored how task factors (e.g., prevalence, email load) influence accurate detection.
Method
In three experiments, participants classified emails as either legitimate or not legitimate and reported on a variety of other categorizations. The first two experiments examined how email load and phishing prevalence influence phishing detection independently. The third experiment examined the interaction of these two factors to determine whether they have compounding effects. All three experiments utilized individual difference variables to examine how cognitive, behavioral, and personality factors may influence classifications.
Results
Experiment 1 suggests that high email load can make the task appear more challenging. Experiment 2 indicates that low phishing prevalence can decrease sensitivity for phishing emails. Experiment 3 demonstrates that high levels of email load can decrease classification accuracy under 50/50 prevalence rates. Notably, performance was poor across all experiments, with phishing detection near chance levels and low discriminability for emails. Participants demonstrated poor metacognition with over confidence, low self-reported difficulty, and low perceived threat for the emails.
Conclusion
Overall, the present studies suggest that high email load and low phishing prevalence can influence email classifications.
Application
Organizations and researchers should consider the influences of both email load and phishing prevalence when implementing phishing interventions.
Cybersecurity attacks have become a pervasive threat in modern society. As technology rapidly expands, corporations and individuals are only becoming more vulnerable to potential cyberattacks. The Council of Economic Advisers (2018) estimates that malicious cyberactivity cost the U.S. economy between $57 billion and $109 billion in 2016. This financial cost stems from cyberattacks affecting both private and public systems in the form of “data and property destruction, business disruption (sometimes for the purpose of collecting ransoms) and theft of proprietary data, intellectual property, and sensitive financial and strategic information” (The Council of Economic Advisers, 2018, p. 1). The latter form of attacks has particular importance for the individual user in the context of phishing emails.
Phishing emails can be defined as “email scam(s) that attempts to defraud people of their personal information” (Drake et al., 2004, p. 1). Computer scientists have focused on protecting users by completely removing phishing attacks from users’ inboxes with spam filters. Modern techniques to improve the detection of spam filters involve machine learning to discover the typical characteristics of fraudulent emails (e.g., Drake et al., 2004; Elkind, 2015; Fette et al., 2007; Jakobsson, 2007). Although these attempts to prevent phishing attacks rely on eliminating dangerous emails from users’ inboxes (e.g., spam filters), as phishing attacks are ever evolving it is impossible to completely insulate users. Thus, it is necessary to understand the circumstances under which users may be particularly vulnerable to develop the appropriate safeguards (Proctor & Chen, 2015).
Realistic Tasks Factors and Phishing Vulnerability
Most research exploring phishing susceptibility has demonstrated that users are vulnerable to phishing attacks (e.g., Sarno et al., 2020) and this vulnerability may be magnified under realistic task settings. Typically, cybersecurity research exploring phishing emails employs a 50/50 split between phishing emails and legitimate emails (Canfield et al., 2016; Parsons et al., 2013; Sarno et al., 2020). However, the real-world rate of phishing emails relative to legitimate emails is estimated to be less than 1% (Canfield et al., 2016). The visual search (e.g., Wolfe et al., 2005), vigilance (e.g., Baddeley et al., 1969), and automation (Parasuraman et al., 1997) literatures suggest that the prevalence of a target directly impacts performance, such that rarer targets are often missed. For example, in the visual search domain, rare targets like tumors can be missed in radiological scans (e.g., Evans et al., 2013). Similarly, baggage screeners have more trouble finding weapons in bags when they are infrequently present. Both of these applied tasks have incorporated countermeasures (e.g., breaks, response confirmations, simulated targets) to offset the performance decrements associated with low target prevalence. In the context of phishing emails, this suggests that relative to laboratory settings, email users may be poorer at detecting attacks in realistic settings in which few fraudulent emails occur.
Sawyer and Hancock (2018) explored how varying the prevalence of fraudulent emails influenced participants’ performance. All participants were presented with 300 emails and either saw phishing emails 1%, 5%, or 20% of the time. The results were consistent with the visual search (Wolfe et al., 2005) and vigilance domains (Baddeley et al., 1969), indicating that when phishing attacks were present 1% of the time they are more likely to succeed. The authors argued that this effect was not associated with fatigue, but rather difficulty in discerning the rare attacks. Since the phishing attacks were always requests from an external email address ending in a specific suffix, the generalizability of this study is limited. Recent work by Lawson et al. (2020) suggests that the success of phishing attacks can depend on the persuasion tactics utilized, and the personality of the intended victim. Thus, a wider variety of phishing emails should aid our understanding of how prevalence may affect classifications in real-world environments. Despite its limitations, Sawyer and Hancock (2018) were the first to demonstrate that prevalence is an important task factor in phishing susceptibility and suggest that it needs further examination.
Highly related to the prevalence of phishing emails is the sheer number of emails a user evaluates during a given time period. Many cybersecurity studies provide participants with unlimited time to evaluate a small number of emails (e.g., Canfield et al., 2016, p. 40, emails; Parsons et al., 2013, p. 50, emails). However, in the real world this is often not the case. Email users often manage the necessities of competing tasks when checking and responding to emails, like work demands (e.g., I have a meeting in 5 min) or self-inflicted time constraints (e.g., I need to go through these emails quickly so I can watch TV). Additionally, most email users aren’t thinking of phishing emails on a daily basis, so when they go through their email they may pace themselves very differently compared to when they know they are in a phishing study. Parsons et al. (2013) showed evidence for this hypothesis demonstrating that when individuals are not expecting phishing emails, they evaluate them quicker and make riskier decisions. Sarno et al. (2020) have also shown that limited time to view emails before classifying them influences decision criterions. Specifically, without time pressure older adults exhibited conservative response behaviors, rating more emails as spam or not safe. Once older adults were given a shorter period of time to view emails, their bias was attenuated. These results suggest that decreasing the time to view each email, and thus increasing email load, may directly impact the manner in which some individuals evaluate emails. Since the time pressure in this study was designed to influence older adults; younger adults may, or may not, exhibit similar bias shifts when put under comparable time pressure. Whether self-inflicted or otherwise, email load appears to impact email classifications and the risky actions associated with them. Thus, a better understanding of how email load may impact the manner in which individuals classify and respond to emails is required.
Vishwanath et al. (2011) examined how email load may impact phishing performance directly. Participants in their study were targeted with two phishing attacks that were 2 weeks apart. Although the researchers did not manipulate email load specifically, they collected self-report data from the participants regarding the average amount of email they receive on a given day. Interestingly, the more emails participants reported having in their inbox, the more likely they were to fall for the simulated phishing attacks. These results suggest that email load is an important aspect of phishing susceptibility. However, no empirical work has explicitly manipulated email load. It is possible that when email load is manipulated in a controlled setting, clearer findings will be revealed.
Individual Differences in Phishing Susceptibility
Previous research has demonstrated that all individuals struggle with detecting phishing emails. However, as with most tasks, there are several individual difference variables that may exacerbate poor performance in the email domain. Individual differences in cyber experience have been examined in the context of cyberattacks. For example, Silva et al. (2015) compared performance between novice and expert cyber incident reporters. Utilizing eye movements, the researchers determined that novice reporters took longer to locate the primary region of interest and were more readily distracted by erroneous text in the display compared to their expert counterparts. Zielinska et al. (2015) also determined that experts and novices have largely different ways of organizing/conceptualizing phishing information. Novices appear to have simpler mental models regarding the content of phishing emails. Other studies have also examined the relationship between cybersecurity experience and phishing vulnerability. Most research has suggested that more experience tends to lead to more secure online behaviors (e.g., Grimes et al., 2007; Sheng et al., 2011). However, there has been some research that has suggested that experience may prove detrimental to email classification performance (Cain et al., 2018; Parsons et al., 2013). It is possible that there is a nonlinear relationship between experience and cybersecurity performance, such that those individuals who have nominal training perform the worst because they have a false sense of security, and that true experts exhibit safer and more accurate performance in the cyber domain. Many of the studies exploring cyber experience use just one or a few questions to evaluate previous cyber experience (e.g., Parsons et al., 2013; Sheng et al., 2011). Downs et al. (2006) suggested that general risk awareness may not be connected to an individual’s ability to correctly detect phishing emails. Rather, users may only be able to correctly detect phishing emails when they have specific experience with the risks associated in the emails. This study emphasizes the importance of relevant experience as a predictor of performance. More in-depth questions investigating previous cybersecurity experience may illuminate these disparate findings in the literature.
In the present study, cybersecurity experience is operationalized as the frequency of interactions with various cybersecurity threats (e.g., falling for a phishing attack, receiving phishing training). General cyber behaviors may be distinct from this definition of cybersecurity experience and may be linked to phishing susceptibility. Cain et al. (2018) examined this idea in the form of cyber hygiene. Cyber hygiene consists of safe online practices, for instance updating your software, using firewalls, antivirus scans, and not opening emails or attachments from unknown sources. They found that participants who self-identified as experts reported less secure behaviors than their novice counterparts. Additionally, the experts appeared to have less knowledge about cyber hygiene than other participants. Both findings suggest that cyber hygiene may be distinct from cyber experience, such that experience does not always predict behavior. Additionally, consistent with the training literature, participants who had received cybersecurity training did not exhibit better cyber hygiene, suggesting that training does not translate in improvements to cyber hygiene. Thus, general cyber hygiene may represent a distinct individual difference that describes how users may interact with phishing emails regardless of experience and should be further explored.
Vishwanath et al. (2016) suggested that deficient self-regulation is a critical aspect of developing suspicion for fraudulent emails, such that more deficient self-regulators are less likely to develop suspicion. In the suspicion, cognition, and automaticity model (SCAM), deficient self-regulation was defined by eight self-report introspective questions (e.g., I feel my email use has gotten out of control). Other aspects related to deficient self-regulation have been strongly linked to phishing susceptibility in other studies, such as impulsivity. Several studies have found that impulsive individuals are more likely to fall for phishing attacks (Hadlington, 2017; Parsons et al., 2013; Welk et al., 2015). However, some studies have found the opposite pattern (Kumaraguru et al., 2007) or no relationship at all (Sarno et al., 2020). Thus, further work is necessary to elucidate the impact of impulsivity on phishing vulnerability. A different aspect of deficient self-regulation that may be related to phishing vulnerability is inhibitory control. Mayhorn and Nyeste (2012) utilized the Stroop task as a measure of inhibitory control to understand its relationship with phishing susceptibility. Their results demonstrated that the ability to inhibit irrelevant information seems to be a crucial aspect of accurate email classification. Silva et al. (2015) also found that attention to irrelevant information is a critical indicator of cyber performance. Specifically, novices are often distracted by irrelevant information, whereas experts are more likely to attend to the attack relevant information. Wang et al. (2012) found that users who attend to emotion-provoking information in emails (e.g., your bank account may be deleted if you do not respond) over deception triggers (e.g., spelling mistakes) are more likely to fall for phishing attacks. Impulsive individuals, who may be less likely to inhibit responses in general, may be more vulnerable to these types of emotional ploys. Overall, it seems that individuals who exhibit poor inhibitory control may be unable to ignore information that elicits emotional responses and/or is irrelevant to the task, resulting in an inaccurate (and possibly dangerous) classification of the email.
The Present Studies
The purpose of the present studies was to examine how phishing vulnerability manifests under real-world constraints. Specifically, how email load and the prevalence of phishing emails impact classification, and also the actions chosen for emails. Toward that end, all three experiments asked participants to classify each email as legitimate or not legitimate, what action they would take next with each email, and several metacognitive classifications (i.e., threat level, difficulty, confidence). Experiment 1 explored how different email loads impact classification and action selection. In a similar vein, Experiment 2 investigated how the prevalence of phishing emails affects classification and action selection. Finally, Experiment 3 combined the task factors of email load and phishing prevalence to examine how the number of emails and the prevalence of phishing emails interact to influence classifications and cyber actions.
Experiment 1
The purpose of Experiment 1 was to determine how email load influences the detection of phishing emails and the actions taken with phishing emails. To our knowledge, no previous research has experimentally manipulated the number of emails participants have to examine within a given time frame. However, previous research suggests that higher email loads should increase vulnerability to phishing attacks (Vishwanath et al., 2011). Email load was manipulated by changing the number of emails displayed in the inbox. Although all participants were given 100 emails to classify, some were deceived in how many emails they were told they needed to get through. Each email was classified for a variety of factors. The main factors of interest included the participants’ phishing classification, metacognition, and action selection. Additionally, deficient self-regulation (Vishwanath et al., 2016) and cyber hygiene (Cain et al., 2018) were investigated as potential covariates.
Method
Participants
Seventy-five undergraduate students (Mage = 19.08, 45 males, 30 females) from the University of Central Florida were recruited for course credit. All participants had normal or corrected-to-normal vision (20/32 or better corrected vision on a Snellen eye chart) and color vision (Ishihara’s test for color blindness; 13 plates). This research complied with the American Psychological Association Code of Ethics was approved by the Institutional Review Board at the University of Central Florida. Informed consent was obtained from each participant.
An ANCOVA power analysis was conducted in G*Power (Faul et al., 2007) to determine how many participants would be required to find an effect of email load on performance, controlling for both deficient self-regulation and cyber hygiene. Sawyer et al. (2014) found an effect size of
Apparatus and stimuli
The experiment was programmed and run in SR Research Ltd’s Experiment Builder. Stimuli were real emails, obtained from either the researcher’s inboxes/junk folders or web searches, and have been validated in previous studies (Sarno et al., 2020, Sarno et al., 2017; Patel et al., 2019; Williams et al., 2019). Participants had unlimited time to view the 100 emails. However, the number of the emails displayed in the inbox depended on the condition (Figure 1). In the high email load condition, participants were told that they needed to get through 300 emails. In the moderate email load condition, participants were told they needed to evaluate 200 emails. Lastly, in the low email load condition, participants were told they needed to assess 100 emails.

Gmail interface and load conditions.
The emails that were utilized were diverse in nature, including content such as banking, media (e.g., Netflix), and shipping (see Sarno et al., 2020 for a full description; Table 1), and phishing themes (Table 2). To limit prevalence effects and increase power, 50% of the emails were real phishing attacks and 50% of the emails were real legitimate emails. The emails were presented within a Gmail interface that counted down the number of emails in the inbox (Figure 1). The experiment was presented on a 19” Dell Professional P190S Monitor at a resolution of 1280 × 1040 pixels with participants seated approximately 20 inches away, making the visual angle of the display roughly 36° × 29°. Participants made classifications regarding each email utilizing the mouse and keyboard.
Phishing Email Content Categories
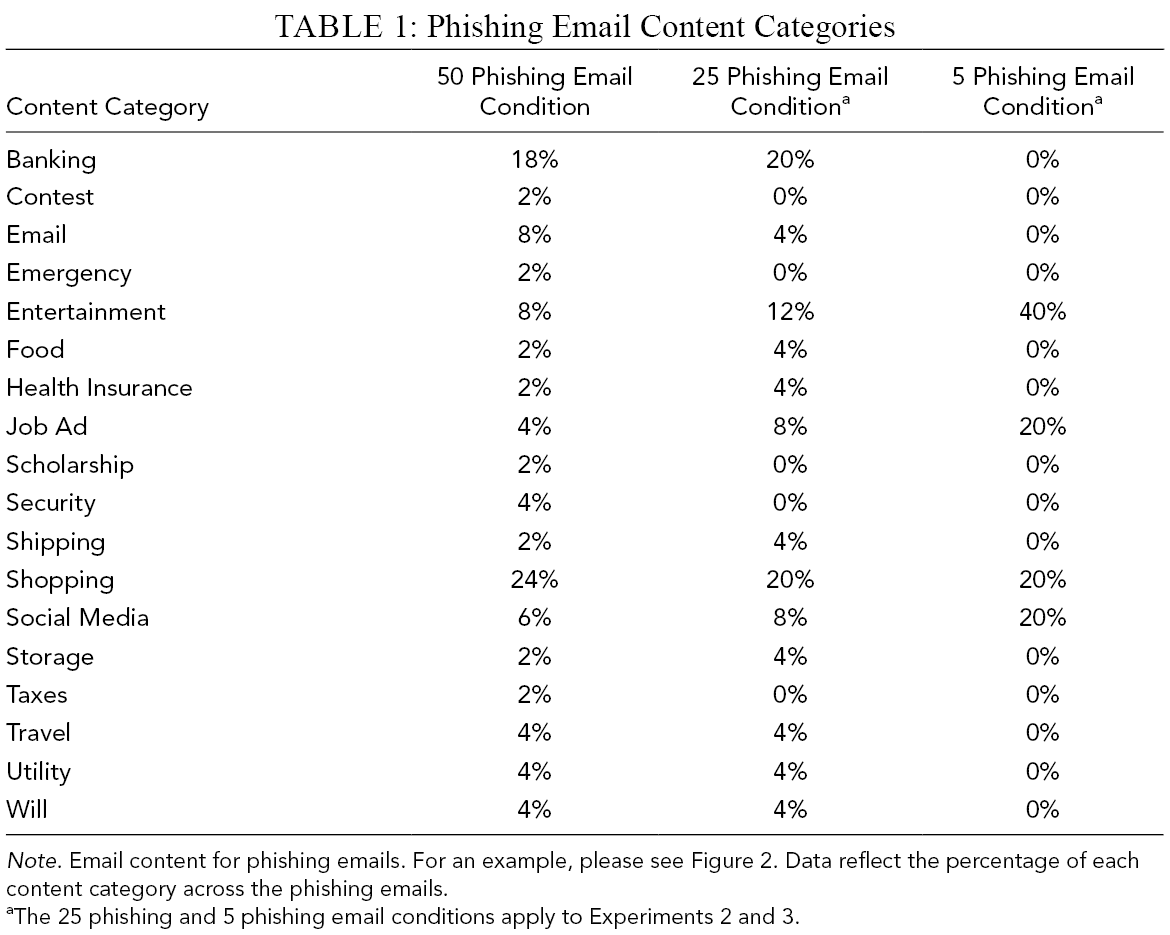
Note. Email content for phishing emails. For an example, please see Figure 2. Data reflect the percentage of each content category across the phishing emails.
aThe 25 phishing and 5 phishing email conditions apply to Experiments 2 and 3.

Example emails: (A) legitimate emails; (B) phishing emails.
Phishing Themes

Note. Data reflect the percentage of each phishing theme across the phishing emails.
aThe 25 phishing and 5 phishing email conditions apply to Experiments 2 and 3.
Individual difference measures
Deficient self-regulation
Deficient self-regulation was assessed utilizing two different measures—impulsivity and inhibitory control. Although impulsivity and inhibitory control have been found to be related to one another (Logan et al., 1997), both measures were included because the impulsivity scale is a more subjective, self-report measure, and inhibitory control is a more objective, direct measure. Impulsivity was assessed utilizing the Barratt Impulsiveness Scale Version 11 (BIS-11; Patton et al., 1995). Inhibitory control was measured utilizing a Stroop task (Stroop, 1935). The Stroop task was programmed in E-Prime and consisted of 240 trials where participants were asked to indicate, via button press, the color of ink in which a word was written. The Stroop task is a measure of inhibitory control because to respond correctly participants must respond to the color the world is written in and inhibit their response to the word’s meaning.
Cyber hygiene
Cyber hygiene was measured utilizing the 20 yes/no cyber practice questions from Cain et al. (2018). Example items include “do you secure your browser?” and “do you perform weekly antivirus scans?”
Procedure
Upon providing informed consent, participants were prescreened for near, far, and color vision. After being screened for normal or corrected-to-normal vision, participants completed the demographics questions. The demographics questionnaire included questions regarding basic information (e.g., gender, age, education level), questions about their cyber hygiene, and the BIS-11 (Patton et al., 1995). After completing the demographics, participants continued to the experimental station in the back of the room for the remainder of the study.
Prior to completing the experiment, participants completed the Stroop task. After the Stroop task, participants received the instructions for the experiment. They were randomly assigned to one of the three email load conditions (high, moderate or low). Each trial began by presenting an email (Figure 3). Participants were then asked to indicate via button press if the email was legitimate or not. Participants then classified what threat level the email posed (Canfield et al., 2016), what action they would take next (i.e., click a link/open attachment, reply, check sender, delete, report as suspicious), how difficult their classification was, and finally how confident they were in their classification (Canfield et al., 2016) (Figure 3). Participants did not receive any feedback regarding their performance. After completing all the trials, participants were debriefed regarding the true nature of the study.

Example trial sequence.
Results and Discussion
Email classifications
The primary analysis of interest explored how participants accurately classified emails as either legitimate or not legitimate. Neither deficient self-regulation nor cyber hygiene were correlated with any of the dependent measures and therefore were excluded as covariates in all analyses. Accuracy and response times were each submitted to separate two-factor mixed ANOVA with an α level of .05, with email load (high, moderate, low) and email type (legitimate, phishing) as the independent variables. Response times were calculated on both correct and incorrect trials.
Email classification accuracy
There was a main effect of email type, F(1,72) = 22.35, p < .001, ηp2 = .24, with participants being more accurate in their classifications of legitimate emails (70.88% correct) than phishing emails (55.81% correct; Figure 4A). Note that overall, the participants were nearly at chance performance for phishing emails. There was no main effect of email load, F(2,72) = 1.53, p = .224, ηp2 = .04, or a significant interaction of email type and email load, F(2,72) = 0.36, p = .698, ηp2 = .01, suggesting that email load did not influence the accurate detection of either phishing or legitimate emails (Figure 4A).

Experiment 1: (A) email classification accuracy and (B) email classification response times by email load and email type. Error bars indicate the standard error of the mean.
Email classification response times
Although cyber hygiene was not related to email classifications for legitimate emails, there was a relationship between cyber hygiene and classifications for phishing emails. Specifically, the more phishing emails participants detected, the more likely they were to have reported more “hygienic” (i.e., safer) cyber behaviors, r(75) = .26, p = .026. Even though this relationship is relatively weak, it does suggest that general safe cyber behaviors may be linked to the ability to detect phishing emails.
There were no main effects of email type, F(1,72) = 0.89, p = .349, ηp2 = .01, or email load, F(2,72) = 2.47, p = .092, ηp2 = .06, nor any significant interaction of the two on response times, F(2,72) = 0.23, p = .792, ηp2 = .01 (Figure 4B). These results suggest that the time to classify emails does not depend on whether the email is a phishing or legitimate email or how many emails need to be evaluated.
Sensitivity and response criterions
Exploring classification accuracy alone may not fully explain performance differences between different email loads. Signal detection theory (SDT; Green & Swets, 1988; Mackworth, 1948) has been applied to better evaluate phishing susceptibility. Signal detection measures have been recently utilized in cybersecurity studies (Canfield et al., 2016; Sarno et al., 2020) to investigate whether performance differences are due to changes in sensitivity to phishing emails (d’) or response criterion shifts (c). Sensitivity in the present studies is defined as d’ or the separation between the signal and noise distributions in SDT. Response criterion (c) was chosen over response bias (β) because of the conservative and liberal bounds being more balanced. Response bias (β) scores are limited to 0–1 for lenient responders and can be any number above 1 for conservative responders (Green & Swets, 1988). In response criterion (c), lenient responders have scores that are <0, conservative responders have scores that are >0, and unbiased responders have scores of 0 (Stanislaw & Todorov, 1999). Legitimate emails were treated as targets, such that liberal responders classified more emails as legitimate, and conservative responders classified more emails as phishing. Both sensitivity and response criterions were calculated for each email load group and subjected separately to two one-way between subjects ANOVAs with an α level of .05, with email load (high, moderate, low) as the independent variable.
There were no main effects of email load for sensitivity (Figure 5A), F(2,72) = 1.10, p = .340, ηp2 = .03, or for response criterion (C; Figure 5B), F(2,72) = 0.47, p = .628, ηp2 = .01. However, all participants demonstrated very low sensitivities (below 1). Response criterions for each email load condition were each submitted to one sample t-tests to determine if they were different from zero. Each condition’s average response criterion did significantly differ from zero (p’s > .035), suggesting that all participants were liberal in the responses (i.e., rated more emails as legitimate). Taken together, these results suggest that email load does not influence the response profiles of email users, but that all users are very vulnerable to phishing emails.

Experiment 1: signal detection measures, (A) sensitivity and (B) response criterion by email load. Error bars represent the standard error of the mean.
Actions Chosen
The next actions chosen for each email were also analyzed. Since participants in this study evaluated emails meant for other individuals, it is impossible to know what the correct actions are for legitimate emails. On the other hand, if users reply or click a link in a phishing email they are always putting themselves at risk in the real world, whether it was meant for them or not. Thus, only phishing emails were considered in these analyses. Actions chosen were considered correct for phishing emails if participants chose to check the sender, delete, or report it as suspicious. Incorrect actions for phishing emails included clicking a link/opening an attachment or replying. Action choice accuracy was submitted to a one-way between-subjects ANOVA with an α level of .05 with email load (high, moderate, low) as the independent variable.
There was no main effect of email load on action accuracy (Figure 6), F(2,72) = 0.20, p = .823, ηp2 = .01, indicating that email load does not meaningfully impact the actions selected for each email.

Experiment 1: action accuracy for phishing emails. Error bars represent the standard error of the mean.
Threat level, confidence, and difficulty
Threat level, confidence, and difficulty may represent different dimensions of the email classification task. Additionally, these relationships may not be consistent across varying email loads. Therefore, three separate two mixed-factor ANOVAs, with α levels of .05, and email load (high, moderate, low) and email type (legitimate, phishing) as the independent variables were conducted. All three measures were calculated including both correct and incorrect trials.
Threat Level
There was a main effect of email type on the perceived threat, F(1,72) = 155.43, p < .001, ηp2 = .68, such that phishing emails were rated as higher threats (53.21) than legitimate emails (33.72; Figure 7A). Even though phishing emails were perceived as more threatening, they still were rated rather low on threat level, ~53, out of 100, suggesting that all participants had miscalibrated perceptions of threat. There was no main effect of email load, F(2,72) = 0.89, p = .417, ηp2 = .02, nor was there an interaction between email type and email load, F(2,72) = 2.55, p = .085, ηp2 = .07, on threat level (Figure 7A). Overall, these results indicate that email users rate phishing emails as mildly threatening regardless of the number of emails in their inbox.

Experiment 1: (A) threat level, (B) confidence, and (C) difficulty ratings by email load.
Confidence
There were no main effects of email type, F(1,72) = 0.28, p = .596, ηp2 = .01, or email load, F(2,72) = 2.18, p = .120, ηp2 = .06, nor any interaction of the two, F(2,72) = 0.28, p = .760, ηp2 = .01, on confidence in the task, suggesting that confidence is not influenced by email load (Figure 7B). It is worth noting that confidence was fairly high given the relatively poor accuracies across the groups.
Difficulty
There was no main effect of email type on difficulty, F(1,72) = 3.50, p = .065, ηp2 = .05, suggesting that participants viewed both phishing and legitimate emails as equally difficult (Figure 7C). However, there was a main effect of email load on difficulty, F(2,72) = 5.33, p = .007, ηp2 = .13, indicating that the number of emails in the participant’s inbox influenced how difficult the task was (Figure 7C). Specifically, pairwise comparisons revealed that when participants were given 100 emails, their task was perceived as easier (27.56) than when they were told they had to evaluate 200 emails (36.01; p = .026) or 300 emails (39.32; p = .002). However, there was no difference between the 200 and 300 conditions (p = .375). Lastly, there was no significant interaction of email load and email type on difficulty, F(2,72) = 1.22, p = .302, ηp2 = .03. Taken together, these results suggest that the number of emails to examine does influence how difficult the task is perceived.
Summary of Experiment 1’s results
Email load did not appear to influence participants ability to classify or respond to emails. However, participants did view the task as more challenging in the higher email load conditions (i.e., 200, 300 emails). All participants also demonstrated low sensitivity for the task, displayed a bias toward classifying emails as legitimate, and exhibited poor metacognition. Lastly, participants with higher levels of cyber hygiene were more likely to correctly classify phishing emails.
Experiment 2
Experiment 1 investigated how perceived email load affects phishing email detection. However, email load is only one task factor that may be involved in email classifications. Experiment 2 explored how the prevalence rate of phishing emails impacts performance. Previous research exploring prevalence rates of phishing emails suggests that when the probability of a phishing email is low, users have poorer phishing detection (Sawyer & Hancock, 2018). While Sawyer and Hancock (2018) explored phishing prevalence, they did not specifically investigate the connection between classification and action. Additionally, Sawyer and Hancock (2018) focused on clerical emails and did not utilize a diverse set of emails that generalizes to most email users.
Method
Participants
Fifty-four undergraduates (Mage = 18.65, 19 males, 35 females) from the University of Central Florida participated for course credit. All participants had normal or corrected-to-normal vision and were prescreened for near and far vision (20/32 or better corrected vision on a Snellen eye chart) and color vision (Ishihara’s test for color blindness; 13 plates).
To determine how many participants were necessary to find an effect of prevalence, a new power analysis was conducted in G*Power (Faul et al., 2007). Sawyer and Hancock (2018) found an effect size of
Apparatus and stimuli
The apparatus and stimuli were the same as Experiment 1 with the following exceptions. All participants evaluated 100 emails and were given an accurate email counter. The number of phishing emails depended on condition. The low prevalence (5%) condition contained five phishing emails, the moderate prevalence (25%) condition contained 25 phishing emails, and the high prevalence (50%) condition contained 50 phishing emails. Importantly, the same phishing emails in the five phishing prevalence condition were utilized in both the 25 and 50 conditions to make direct comparisons in performance. Similarly, the same phishing emails in the 25 condition were utilized in the 50 condition. The phishing emails were selected randomly from the 50 condition to avoid experimenter bias.
Individual difference measures
Cyber experience
Cyber experience was assessed utilizing 20 self-report questions about an individual’s previous experience with cyber threats. These questions were developed for an unpublished study by Sarno, McPherson, and Neider (Supplemental Material). Example items include “have you had any previous training about cybersecurity?” and “have you ever had a virus due to engaging with a spam email?”
Procedure
The procedure was the same as Experiment 1 with the following exceptions. Instead of being asked questions about their cyber hygiene, participants were asked questions about their cyber experience. Additionally, participants were not given the BIS-11 or the Stroop Task. Lastly, instead of varying the email load, participants were randomly assigned to one of the three prevalence conditions (5%, 25%, 50%).
Results and Discussion
Email classifications
Similar to Experiment 1, the main analysis in Experiment 2 investigated how participants classified emails as legitimate or not legitimate. Cyber experience was not related to any of the dependent measures and therefore was not included as a covariate in any analysis. Accuracy and response times were each subjected to a two-factor mixed ANOVA with an α level of .05 with prevalence (high, moderate, low) and email type (legitimate, phishing) as the independent variables. Like Experiment 1, response times were calculated across both correct and incorrect trials.
Email classification accuracy
There was no main effect of email type on accuracy, F(1,51) = 1.40, p = .242, ηp2 = .03, suggesting that participants classified phishing and legitimate emails equally well (Figure 8A). The main effect of prevalence approached, but did not reach significance, F(2,51) = 3.02, p = .058, ηp2 = .11, indicating that prevalence also did not influence email classification accuracy, and there was no interaction between email type and prevalence, F(2,51) = 0.04, p = .961, ηp2 <.01.

Experiment 2: (A) email classification accuracy and (B) email classification response times by phishing prevalence and email type. Error bars represent the standard error of the mean.
Additional analyses were also conducted on the same five emails that each prevalence condition received. It is possible that some of the specific phishing emails across the conditions varied in difficulty. Thus, these analyses were performed to make direct comparisons between the groups. This analysis suggested that there were no significant differences amongst the prevalence groups when directly comparing the same five phishing emails (Figure 9A), F(2,51) = 1.14, p = .327, ηp2 = .04. Together, these results suggest that lower phishing prevalence did not result in poorer overall email classifications.

Experiment 2: (A) email classification accuracy and (B) email classification response times for the same five phishing emails by phishing prevalence. Error bars represent the standard error of the mean.
Email classification response times
There were no main effects of email type on classification times, F(1,51) = 0.73, p = .396, ηp2 = .01, or prevalence on classification times, F(2,51) = 0.06, p = .940, ηp2 <.01, suggesting that email type and prevalence rates do not influence classification times (Figure 8B). However, there was a significant interaction between email type and phishing prevalence, F(2,51) = 3.21, p = .049, ηp2 = .11. Separate one-way repeated measures ANOVAs on phishing and legitimate classification times for each group revealed that this interaction was driven by the 25 prevalence condition. Specifically, participants in the moderate prevalence condition took significantly longer to classify phishing emails (~16 s) compared to legitimate emails (~13 s), F(1,17) = 8.66, p = .009, ηp2 = .34. There were no differences in classifications times for phishing and legitimate emails for the other two conditions (p’s > .414; Figure 8B).
Additional analyses were conducted on response times for the same five phishing emails that each group received. These analyses determined that the number of total phishing emails influenced responses times for those same five phishing emails (Figure 9B), F(2,51) = 5.68, p = .006, ηp2 = .25. Pairwise comparisons revealed that this effect was largely driven by the moderate prevalence condition taking longer (~24 s) than the low prevalence condition (~13 s, p = .003) and the high prevalence condition (~15 s, p = .012). There was no difference between the high prevalence condition and the low prevalence condition (p = .575; Figure 9B). Overall, these results suggest that users who experience moderate phishing prevalence rates may take longer to classify phishing emails.
Sensitivity and response criterions
Just as with Experiment 1, SDT measures were analyzed to better characterize phishing susceptibility. Both sensitivity and response criterions were subjected separately to two-factor mixed ANOVAs with an α level of .05, with phishing prevalence (high, moderate, low) as the independent variable.
Surprisingly, there was a main effect of phishing prevalence on sensitivity (Figure 10A), F(2,51) = 8.42, p = .001, ηp2 = .25. Pairwise comparisons determined that this difference was based on the low prevalence condition compared to the other two prevalence conditions. Specifically, the lowest phishing prevalence condition had significantly lower sensitivity (0.69) compared to the moderate phishing prevalence condition (1.46, p < .001) and the high phishing prevalence condition (1.31, p = .003); the moderate and high phishing prevalence groups did not differ significantly from one another (p = .437). Interestingly, phishing prevalence did not influence response criterion (c; Figure 10B), F(2,51) = 0.62, p = .545, ηp2 = .02. To determine if response criterions were considered liberal, separate one sample t-tests were conducted on each prevalence condition. The low prevalence condition was the only condition significantly different than zero (p = .023), the other two groups were not (p’s > .276). This suggests that only the low prevalence group was liberal in their responses, but they were not significantly different from the other two groups. Taken together, these results suggest that lowering the prevalence of phishing emails decreases email users’ abilities to detect phishing emails without changing their response criterion.

Experiment 2: signal detection measures, (A) sensitivity and (B) response criterion by phishing prevalence. Error bars represent the standard error of the mean.
Actions chosen
The actions chosen for each email were also analyzed in a similar way to Experiment 1. Action choice accuracy was then submitted to a one-way between subjects’ ANOVA with an α level of .05 with prevalence (high, moderate, low) as the independent variable.
There was a no main effect of prevalence on action accuracy for phishing emails, F(2,51) = 0.35, p = .705, ηp2 = .01, suggesting that prevalence does not change the actions selected for phishing emails (Figure 11A) . Additional analyses were conducted for the same five phishing emails everyone received. These results indicated that once again phishing prevalence did not influence the actions selected (Figure 11B), F(2,51) = 0.16, p = .854, ηp2 = .01. Overall, the prevalence of phishing emails did not influence the action selected for the emails.

Experiment 2: (A) action accuracy for phishing emails and (B) action accuracy for the same five phishing emails. Error bars represent the standard error of the mean.
Threat level, confidence, and difficulty
To determine if phishing prevalence influenced the three factors of threat level, confidence and difficulty, three separate two-factor mixed ANOVAs with α levels of .05, and prevalence (high, moderate, low) and email type (legitimate, phishing) as the independent variables were performed. Each measure’s scores were calculated on across both correct and incorrect trials.
Threat level
There was a main effect of email type on threat level, F(1,51) = 248.61, p < .001, ηp2 = .83, such that phishing emails were rated as significantly more threatening (59.86) than legitimate emails (30.66) across all groups (Figure 12). There was no main effect of phishing prevalence F(2,51) = 0.06, p = .945, ηp2 < .01, nor an interaction between email type and phishing prevalence, F(2,51) = 1.77, p = .180, ηp2 = .07. There was a significant positive relationship between cyber experience and the perceived threat level of legitimate emails, r(54) = .304, p = .025, indicating that more experience heightens the perceived threat of legit emails. These results suggest that prevalence does not change the perceived threat level of emails and that threat level is solely determined by the legitimacy of the email.

Experiment 2: (A) threat level, (B) confidence, and (C) difficulty ratings by phishing prevalence. Error bars represent the standard error of the mean.
Confidence
There were no main effects of email type, F(1,51) = 0.01, p = .919, ηp2 < .01, or of phishing prevalence (Figure 12), F(2,51) = 0.06, p = .944, ηp2 < .01, nor any interaction on confidence, F(2,51) = 0.25, p = .777, ηp2 = .01. These null effects suggest that confidence is unaffected by email type or phishing prevalence.
Difficulty
As with confidence, there were no main effects of email type, F(1,51) = 2.34, p = .132, ηp2 = .04, or prevalence, F(2,51) = 0.81, p = .457, ηp2 = .03, nor any interaction on perceived difficulty, F(2,51) = 0.17, p = .845, ηp2 = .01 (Figure 12). Cyber experience was related to how difficult it was to evaluate phishing emails, r(54) = .312, p = .022, suggesting the more previous cyber experience participants had, the more challenging they felt it was for them to evaluate the phishing emails. This may be because those who have sufficient cyber experience are more aware of the difficulty of this type of task. Overall, like confidence, difficulty level does not appear to be influenced by either phishing prevalence or email type.
Summary of Experiment 2’s results
The prevalence of phishing emails did influence participant’s sensitivity. Participants who received a low frequency of phishing emails were poorer at distinguishing phishing and legitimate emails. Additionally, participants in the moderate phishing prevalence condition took longer to classify phishing emails. This finding indicates that while moderate phishing prevalence rates may not influence accuracy, they may result in slower classification times. Similar to Experiment 1, all participants exhibited low sensitivities and poor metacognition. Lastly, higher levels of cyber experience were related to increased perceived threat in the emails, and higher perceived difficulty for the task.
Experiment 3
Experiments 1 and 2 investigated how task factors influenced email classifications. However, email load and phishing prevalence do not vary in isolation from one another in the real world. Sawyer et al. (2014) investigated a similar question with an IP monitoring task when they manipulated event rates and the probability of a signal. They found that performance was poorest for conditions with the fast event rate and low probability of a signal. Although this cyber task is different from the email task at hand, the results suggest that the combination of high email load and low phishing prevalence may result in even poorer performance. Thus, Experiment 3 examined the interaction of prevalence and email load.
Method
Participants
Seventy-two participants (Mage = 18.45, 30 males, 42 females) were recruited from the University of Central Florida for course credit. All participants had normal or corrected-to-normal vision (20/32 or better corrected vision on a Snellen eye chart) and color vision (Ishihara’s test for color blindness; 13 plates).
To determine how many participants were necessary to find an effect of the interaction of prevalence and email load, a power analysis was conducted in G*Power (Faul et al., 2007). Sawyer et al. (2014) found an effect size of
Apparatus and stimuli
The apparatus and stimuli were the same as Experiment 1 with the following exceptions. As in Experiment 1, all participants evaluated 100 emails but their perceived email load was manipulated. In the low email load condition, they were told they had 100 emails in their inbox, and in the high email load condition they were told they had 300 emails in their inbox (Figure 1). The number of phishing emails also varied based off the condition, with either low or high prevalence. The low prevalence condition contained 5% phishing emails, and the high prevalence condition contained 50% phishing emails. This produced four experimental conditions (i.e., low email load/low phishing prevalence, low email load/high phishing prevalence, high email load/low phishing prevalence, high email load/high phishing prevalence). Lastly, participants were all given an hour timer that they could view throughout the experiment. This timer was implemented to enhance the email load effects from Experiment 1.
Individual difference measures
Experiment 3 utilized the same deficient self-regulation and cyber hygiene measures from Experiment 1 and the same cyber experience questions from Experiment 2.
Procedure
The procedure for the current experiment was the same as Experiment 1 with the following exceptions. In addition to measuring deficient self-regulation and cyber hygiene, Experiment 3 included the previous cyber experience questions from Experiment 2. Additionally, participants were told that they only had an hour to classify all the emails and to alert their experimenter if their timer ran out. If the timer ran out, participants were told to keep going. This occurred for five participants, and their responses did not meaningfully differ from participants who finished prior to the timer running out.
Results and Discussion
Email classifications
As with the first two experiments, the main analysis investigated if participants varied in their classification accuracy based off email prevalence and email load. The covariates were not related to any of the dependent variables except difficulty ratings, and therefore were only included in those analyses. Classification accuracy and response times were submitted to three-factor mixed ANOVAs with an α level of .05, and email load (high, low), phishing prevalence (high, low) and email type (legitimate, phishing) as the independent variables. Response times were calculated across both correct and incorrect trials.
Email Classification Accuracy
There was no main effect of email type on accuracy, F(1,68) = 0.83, p = .366, ηp2 = .01, suggesting that participants did not differ in their ability to classify legitimate and phishing emails (Figure 13). There was also no main effect of email load, F(1,68) = 0.01, p = .911, ηp2 < .01, or phishing prevalence, F(1,68) = 0.02, p = .897, ηp2 < .01, or a three-way interaction between email type and phishing prevalence/email load (p’s > .163). There was an interaction of email load and prevalence, F(1,68) = 5.51, p = .002, ηp2 = .08. To break this interaction down, separate ANOVAs were conducted on each prevalence condition. When there were only five phishing emails present, there was no effect of email load, F(1,34) = 0.1.89, p = .178, ηp2 = .05. However, when there were 50 phishing emails present, there was a difference between the two email load conditions, F(1,34) = 4.45, p = .042, ηp2 = .12, such that the 100 email load condition had higher accuracy (~71%) compared to the 300 email load condition (~66%). Overall, these results suggest that email load may be a predictor of classification accuracy, at least under circumstances where there is a 50/50 split between legitimate and phishing emails.

Experiment 3: (A) email classification accuracy and (B) email classification response times by email load and phishing prevalence. Error bars represent the standard error of the mean.
Like Experiment 2, the same five phishing emails were also analyzed to examine a more direct comparison between the prevalence conditions (Figure 14). There were no main effects for phishing prevalence, F(1,68) = 3.73, p = .058, ηp2 =.05, email load, F(1,68) = 1.34, p = .250, ηp2 = .02, or an interaction between email load and phishing prevalence, F(1,68) = 0.34, p = .564, ηp2 < .01, suggesting that participants did not differ in their ability to correctly classify the same five emails based on phishing prevalence or email load.

Experiment 3: (A) email classification accuracy and (B) email classification response times for the same five emails by email load and phishing prevalence. Error bars represent the standard error of the mean.
Email classification response times
There was a main effect of email type on response times, F(1,68) = 5.57, p = .021, ηp2 = .08, such that participants took longer to evaluate phishing emails (~12 s) than legitimate emails (~11 s; Figure 13). There were no main effects of prevalence, F(1,68) = 1.46, p = .231, ηp2 = .02, or email load, F(1,68) = 0.01, p = .918, ηp2 < .01. There were also no significant interactions (p’s > 167).
Like the accuracy analyses, response times were examined for the same five phishing emails that all participants classified (Figure 14). There were still no main effects of email load, F(1,68) = 0.18, p = .672, ηp2 < .01, and prevalence, F(1,68) = 0.56, p = .458, ηp2 = .01. The interaction of email load and prevalence trended toward, but did not reach significance, F(1,68) = 3.51, p = .065, ηp2 = .05. Lastly, there was a significant relationship between cyber hygiene and phishing response times, r(72) = .233, p = .049, suggesting that the more cyber hygiene participants reported, the longer it took them to evaluate phishing emails. Overall, these results indicate that the main factor contributing to differences in classification times in our task is the legitimacy of the email and the participant’s cyber hygiene.
Sensitivity and response criterions
As in the first two experiments, signal detection measures were analyzed to understand the influence of email load and phishing email prevalence. Sensitivity and response criterions were subjected to two separate three-factor mixed ANOVAs with an α level of .05, with email load (high, low), and phishing prevalence (high, low) as the independent variables.
There were no main effect of email load, F(1,68) = 0.52, p = .474, ηp2 = .01, or prevalence, F(1,68) = 0.70, p = .407, ηp2 = .01, nor an interaction between prevalence and email load, F(1,68) = 0.57, p = .452, ηp2 = .01, on sensitivity (Figure 15). It is important to note that, like Experiments 1 and 2, all sensitivities were extremely low, and all individuals were very poor at this task. Overall, email load and phishing prevalence do not seem to influence phishing sensitivity and all users struggled to classify emails.

Experiment 3: signal detection measures, (A) sensitivity and (B) response criterion by email load and phishing prevalence. Error bars represent the standard error of the mean.
There were no main effects of email load, F(1,68) = 0.29, p = .294, ηp2 <.01, or phishing prevalence, F(1,68) = 0.05, p = .828, ηp2 <.01, nor any interaction on response criterion, F(1,68) = 0.38, p = .538, ηp2 =.01 (Figure 15). Like the first two experiments, each group’s response criterion was submitted to separate one sample t-tests to determine if they were significantly different from zero. Only the 50 prevalence, 100 email load condition was determined to be significantly different from zero (p = .033) suggesting they were liberal in their responses. The other groups were not different from zero (p’s > .130), suggesting that they were unbiased. Overall, the effects of email load and phishing prevalence did not appear to influence response criterion.
Actions chosen
The accuracy for actions chosen were analyzed in a similar way to Experiments 1 and 2. Action choice accuracy was then submitted to a one-way between subjects ANOVA with an α level of .05 with email load (high, low) and phishing prevalence (high, low) as the independent variables.
There were no main effects of email load, F(1,68) = 2.14, p = .148, ηp2 = .03, or phishing prevalence, F(1,68) = 0.06, p = .803, ηp2 <.01, nor their interaction on action accuracy, F(1,68) = 0.35, p = .555, ηp2 <.01 (Figure 16). These results suggest that neither email load nor phishing prevalence influence email actions.

Experiment 3: action accuracy for phishing emails. Error bars represent the standard error of the mean.
Threat level, confidence, and difficulty
Like the first two experiments, threat level, confidence, and difficulty were analyzed in the context of email load and phishing prevalence and calculated across both correct and incorrect trials. Two separate three-factor mixed ANOVAs with α levels of .05, with email load (high, low), prevalence (high, low), and email type (legitimate, phishing) as the independent variables were performed to investigate the relationship between email load and prevalence on threat level and confidence. As cyber hygiene was related to the difficulty ratings for both legitimate, r(70) = −.24, p = .039, and phishing emails, r(70) = −.24, p = .046, it was included as a covariate. Additionally, cyber experience was related to both legitimate, r(70) = −.25, p = .035, and phishing email difficulty ratings, r(70) = .25, p = .036, so it was also included as a covariate. Thus, difficulty ratings were submitted to a three-factor mixed ANCOVA with α levels of .05, with email load (high, low), prevalence (high, low), and email type (legitimate, phishing) as the independent variables, and cyber hygiene and experience as covariates.
Threat level
There was a main effect of email type on threat level, F(1,68) = 250.53, p < .001, ηp2 = .78, such that participants rated phishing emails as more threatening (56.59), than legitimate emails (33.12; Figure 17). There was no main effect of phishing prevalence, F(1,68) = 0.11, p = .741, ηp2 < .01, or email load on threat level, F(1,68) < 0.01, p = .965, ηp2 < .01. There were also no significant interactions (p’s > .387). Overall, these results indicate that level of threat perceived for emails depends solely on the legitimacy of the email rather than other task factors.

Experiment 3: (A) threat level, (B) confidence, and (C) difficulty ratings by phishing prevalence. Error bars represent the standard error of the mean.
Confidence
There were no main effects of email type, F(1,68) = 0.42, p = .518, ηp2 < .01, email load, F(1,68) = 0.23, p = .636, ηp2 < .01, or phishing prevalence on confidence, F(1,68) = 2.07, p = .154, ηp2 = .03. There were also no significant interactions (p’s > .224; Figure 17). These results suggest that confidence levels are ubiquitous regardless of the legitimacy of the email or various task factors.
Difficulty
Cyber hygiene was found to be a significant covariate for difficulty ratings, F(1,66) = 5.09, p = .027, ηp2 = .07. Cyber experience was also a significant covariate, F(1,66) = 4.70, p = .034, ηp2 = .07. However, after controlling for both cyber hygiene and cyber experience, there was not a main effect of email type, F(1,66) = 0.51, p = .479, ηp2 = .01, email load, F(1,66) = 0.36, p = .553, ηp2 = .01, or phishing prevalence, F(1,66) = 0.49, p = .488, ηp2 = .01 (Figure 17). Additionally, there were no significant interactions (p’s > .646). Lastly, there was a significant relationship between impulsivity (i.e., BIS-11 scores) and difficulty ratings for legitimate emails, r(72) = .286, p = .015, indicating that the more impulsive participants were, the more challenging they found classifying legitimate emails. Overall, these results suggest that task factors and the legitimacy of emails do not dictate how difficult the task is, but rather individual difference factors such as cyber hygiene, experience, and impulsivity.
Summary of Experiment 3’s results
Unlike Experiment 2, there was no effect of phishing prevalence on email classifications. However, higher levels of email load did result in poorer classification accuracy in the high phishing prevalence condition. As in Experiments 1 and 2, all participants displayed low sensitivities and poor metacognition. Lastly, cyber hygiene, cyber experience, and impulsivity all appear to be related to the perceived difficulty of classifying the emails.
General Discussion
Previous work exploring email classifications has suggested that email users are very poor at detecting phishing emails (e.g., Ferguson, 2005). Yet few studies have examined how email load (Vishwanath et al., 2011) and the prevalence of phishing emails (Sawyer & Hancock, 2018) influence the detection of phishing emails, and how these two factors may interact. The present experiments address the previously mentioned gaps in the literature by investigating the effects of both email load and phishing prevalence on email classifications. Experiment 1 explored how high email load may negatively influence email classification. Experiment 2 looked at how low prevalence settings decrease phishing detection with a novel, more diverse set of emails than previously utilized (Sawyer & Hancock, 2018). Experiment 3 utilized the two variables of the first two experiments (email load: high vs. low, phishing prevalence: high vs. low) to investigate if these task factors interact, thus creating even poorer performance under conditions of high email load and low phishing prevalence. Lastly, all three experiments utilized several individual difference variables to help identify how various cognitive (i.e., deficient self-regulation) and behavioral (i.e., cyber hygiene) factors influence phishing detection under varying email task conditions.
The Effect of Task Factors
Experiments 1 through 3 explored the effects of task factors on email classifications. To our knowledge, no previous research has manipulated how the number of emails in a user’s inbox influences their ability to detect phishing emails. Email load was manipulated in both Experiment 1 and 3. Experiment 1’s results indicated that the more emails a user has in their inbox (e.g., 300 emails vs. 100 emails), the more difficult they perceived it was to classify the emails. Interestingly, this did not seem to influence their actual ability to classify emails. We observed minimal effects of email load on performance in Experiment 3; higher email load only resulted in accuracy decrements within the 50/50 prevalence condition. It is possible that our email load manipulation was not robust enough to produce meaningful performance differences on its own. Specifically, email load may play a larger role under situations of multitasking. For example, observers may be more vulnerable to high email load when checking their bank statements, watching their children, and waiting for a delivery. Understanding the influence of email load is particularly important in the real world given that the average working professional has over 20 unread emails in their inbox and gets 120 new emails every day (Plummer, 2019). If email load negatively impacts classifications, email systems may benefit from implementing restrictions on how many emails users are able to interact with. This in turn may decrease vulnerability to phishing emails. However, this type of intervention will likely experience pushback from users and may decrease usability. Research is required to understand how successful email load restrictions may be and if the benefits outweigh any potential negative consequences.
The prevalence of phishing emails was also manipulated in Experiments 2 and 3. In Experiment 2 lower phishing prevalence resulted in decreased sensitivity. Specifically, low prevalence condition had lower sensitivity than the moderate and high prevalence conditions. Interestingly, participants in the moderate prevalence condition took longer to classify phishing emails. It is possible that this condition was more difficult than the high prevalence condition and required more time to maintain similar levels of sensitivity. Overall, Experiment 2’s results are consistent with previous findings that demonstrate decreased phishing sensitivity with fewer phishing emails (Sawyer & Hancock, 2018). Surprisingly, Experiment 3 did not find similar decrements due to lower prevalence rates of phishing emails, suggesting that low phishing prevalence may not always result in higher susceptibility. In a recent training study from Singh et al. (2019), higher phishing prevalence training conditions (75% phishing) decreased sensitivity for phishing detection following training. Minor sensitivity improvements were only seen when phishing prevalence rates were lower at 25% and 50%. Thus, email users seem to lack sensitivity for phishing emails (even with training) and including more phishing emails may only provide more opportunities to miss attacks. Our findings, together with that of Singh et al. (2019), suggest that lower phishing prevalence rates may not always be detrimental to performance and require further investigation.
Individual Differences in Email Classifications
Individual differences have been explored by several previous phishing studies (e.g., Sarno et al., 2020; Sheng et al., 2011). However, there has been limited work exploring how these traits may influence the different aspects of email classifications. Although there were very limited relationships between the individual difference variables and the dependent measures in the current studies, some interesting patterns emerged. Impulsivity has previously been found to result in increased susceptibility to phishing emails, specifically that individuals who are less impulsive are more vulnerable to certain types of phishing attacks (Kumaraguru et al., 2007). Experiment 3 found that the more impulsive (i.e., from BIS-11 scores) an individual was, the more likely they were to rate their task as difficult. These two impulsivity findings make it difficult to interpret how impulsivity plays a role in phishing detection. One potential hypothesis is that impulsive individuals may be somewhat aware of their impulsive tendencies and find it challenging to suppress their impulsive responses. Other research (e.g., Parsons et al., 2013; Welk et al., 2015) has found that impulsivity negatively impacts phishing detection. Welk et al. (2015) suggested that conflicting impulsivity results may be due to the nature of the task. Specifically, that interactive email tasks result in impulsive individuals being more vulnerable, whereas image-based email tasks may find opposite results. While that hypothesis may be true, it doesn’t explain why Kumaraguru et al. (2007) found nonimpulsive individuals to be more vulnerable within an interactive task. It is possible that the specific impulsivity measure (e.g., Cognitive Reflection Task [Frederick, 2005] vs. BIS-11 [Patton et al., 1995] vs. the Stroop, 1935) utilized influences the effect impulsivity has on phishing vulnerability. Future work should attempt to elucidate the true influence of deficient self-regulation on phishing vulnerability.
More specific individual difference variables related to cyber behaviors and experience were also included in the present studies. Individuals who had better cyber hygiene took longer to classify phishing emails in Experiment 3 and were more likely to detect the phishing emails in Experiment 1. This suggests that general safe online behaviors are linked to the ability to detect phishing emails. Although these results are limited in their causal inferences, they do suggest that further training and intervention studies that focus on general safe online behaviors may be able to improve phishing detection. Additionally, both cyber hygiene and cyber experience were related to difficulty ratings for legitimate and phishing emails in Experiment 3. Specifically, that individuals who reported better cyber hygiene and more cyber experience found the email task less difficult. Lastly, in Experiment 2, individuals who had more cyber experience found legitimate emails more threatening, possibly demonstrating an increased awareness of cyber threats. This is consistent with previous research that has found cyber knowledge and experience to be linked with increased resilience to phishing attacks (Grimes et al., 2007; Harrison et al., 2016; Sheng et al., 2011). Although the present results are limited in their causal inferences, they do suggest that general experience and cyber behaviors may positively influence email classifications. It is worth noting that, similar to the impulsivity findings, some studies have suggested that experience may be detrimental to phishing detection (Cain et al., 2018; Parsons et al., 2013). Given the conflicting accounts between the aforementioned studies and the present studies, researchers should demonstrate caution when making any assertations regarding the benefit of general cyber experience and behaviors on phishing detection.
Vulnerability to Phishing Emails
A consistent theme across all three experiments was the overwhelming poor performance. Although accuracy was higher for legitimate emails in Experiment 1, phishing email detection was near chance performance. Email classification accuracies remained low across the remaining three experiments, and all sensitivities (d’) fell below 1.5, indicating that all participants, regardless of the experiment, struggled to classify emails. Additionally, many participants were liberal in their classifications, classifying more emails as legitimate than phishing. This bias is particularly concerning given how low the sensitivities were. Even more troubling than their classification accuracies were the inappropriate actions that participants selected for phishing emails. On roughly 20% of phishing emails, participants said the next action they would take was to click a link/open an attachment or reply. These dangerous actions would result in an email user potentially compromising their personal information in the real world. Participants also demonstrated poor metacognition for their performance on the task. Participants did rate phishing emails as more threatening than legitimate emails across the experiments, but only rated the phishing emails as mildly threatening. Ideally, this perceived threat level should be much higher, given that any of these phishing emails could have compromised their sensitive/personal information in the real world. Participants were also highly confident and viewed the task as relatively easy despite their poor task performance. This miscalibration of confidence and ability is consistent with previous studies related to metacognition and multitasking (e.g., Ophir et al., 2009; Sanbonmatsu et al., 2013) and recent phishing studies (Canfield et al., 2019). Overall, participants appeared to exhibit extremely poor performance across the board with little awareness of their vulnerabilities.
Limitations and Future Directions
Although the present studies contributed to the cyber domain’s understanding of susceptibility to phishing emails, there are several limitations and areas for future research. One limitation of the present results is the addition of the timer in Experiment 3. This methodological difference may make it difficult to directly compare performance among Experiments 1,2, and 3. It is possible that this additional time pressure washed out any prevalence effects in Experiment 3. Prevalence effects may have also been challenging to find because of how poorly the participants performed. In some cases, higher prevalence conditions may have only decreased performance since participants had more opportunities to miss phishing emails due to their low discernibility (i.e., sensitivities) and bias toward saying emails were from legitimate sources.
We also found very minimal relationships between our individual difference variables and dependent measures. It is possible that these analyses were just underpowered, but it is also possible we had a limited sample. For example, the cyber experience data were constricted to low levels of previous cyber experience, making it difficult to find any meaningful relationships. As previously mentioned, research has demonstrated that experts may have drastically different mental models of phishing emails compared to novices (Zielinska et al., 2015). Studies that only include undergraduate students, like the present studies, may have more difficulty recruiting a distribution of experts and novices. More studies are necessary that have experimental control over these types of variables (i.e., recruiting cyber experts and novices) to more fully understand these relationships.
Lastly, one key limitation for phishing studies is the methodology implemented. Our study opted for a more controlled laboratory design to carefully examine the effects of email load and phishing prevalence. Findings may vary under real-world conditions (e.g., multitasking, personalized emails, etc.) or simulated attacks. Overall, the present studies indicate that realistic settings such as high email load and low phishing prevalence can increase vulnerability to phishing emails.
Key Points
In Experiment 1, increasing email load caused participants to view the task as more challenging. In Experiment 3, increasing email load decreased classification accuracy in the 50/50 prevalence conditions.
In Experiment 2, low phishing prevalence can increase susceptibly, but not in all circumstances.
All participants demonstrated poor performance with poor metacognition. Specifically, participants had over confidence, low self-reported difficulty, and low perceived threat for phishing emails.
Cyber experience and cyber hygiene represent distinct individual differences related to phishing performance and are linked to time on task and perceived difficulty.
Supplemental Material
Supplementary Material 1 - Supplemental material for So Many Phish, So Little Time: Exploring Email Task Factors and Phishing Susceptibility
Supplemental material, Supplementary Material 1, for So Many Phish, So Little Time: Exploring Email Task Factors and Phishing Susceptibility by Dawn M. Sarno and Mark B. Neider in Human Factors: The Journal of Human Factors and Ergonomics Society
Footnotes

Supplemental Material
The online supplemental material is available with the manuscript on the HF website.
Author Biographies
Dawn M. Sarno is an assistant professor at Clemson University in the department of psychology. She received her PhD in Human Factors and Cognitive Psychology from the University of Central Florida in 2020.
Mark B. Neider is an associate professor at the University of Central Florida in the department of psychology. He received his PhD in Cognitive/Experimental Psychology from Stony Brook University in 2006.
References
Supplementary Material
Please find the following supplemental material available below.
For Open Access articles published under a Creative Commons License, all supplemental material carries the same license as the article it is associated with.
For non-Open Access articles published, all supplemental material carries a non-exclusive license, and permission requests for re-use of supplemental material or any part of supplemental material shall be sent directly to the copyright owner as specified in the copyright notice associated with the article.
