
Abstract
Objective
This study examined the impact of monitoring instructions when using an automated driving system (ADS) and road obstructions on post take-over performance in near-miss scenarios.
Background
Past research indicates partial ADS reduces the driver’s situation awareness and degrades post take-over performance. Connected vehicle technology may alert drivers to impending hazards in time to safely avoid near-miss events.
Method
Forty-eight licensed drivers using ADS were randomly assigned to either the active driving or passive driving condition. Participants navigated eight scenarios with or without a visual obstruction in a distributed driving simulator. The experimenter drove the other simulated vehicle to manually cause near-miss events. Participants’ mean longitudinal velocity, standard deviation of longitudinal velocity, and mean longitudinal acceleration were measured.
Results
Participants in passive ADS group showed greater, and more variable, deceleration rates than those in the active ADS group. Despite a reliable audiovisual warning, participants failed to slow down in the red-light running scenario when the conflict vehicle was occluded. Participant’s trust in the automated driving system did not vary between the beginning and end of the experiment.
Conclusion
Drivers interacting with ADS in a passive manner may continue to show increased and more variable deceleration rates in near-miss scenarios even with reliable connected vehicle technology. Future research may focus on interactive effects of automated and connected driving technologies on drivers’ ability to anticipate and safely navigate near-miss scenarios.
Application
Designers of automated and connected vehicle technologies may consider different timing and types of cues to inform the drivers of imminent hazard in high-risk scenarios for near-miss events.
Keywords
Introduction
Motor vehicle crashes are the second leading cause of unintentional death of Americans, killing a total of 38,824 people in 2020 alone, over 61% of them being passenger vehicle occupants (IIHS, 2023). Despite a general decline in motor vehicle crash deaths per 100 million miles driven over the years since 1979, the last 15 years of statistics show no further reduction (IIHS, 2023). Specifically, in 2020 alone, 7,781 two-vehicle crashes involved passenger cars, constituting roughly 62% of all the vehicle types (NHTSA, 2023). These statistics indicate that while motor vehicle crashes are preventable (CDC, 2023), multivehicle crashes (crashes involving two or more vehicles; NHTSA, 2023) remain the most common type of crashes that lead to deaths of passenger vehicle occupants. Although vehicle automation systems have the potential to reduce the number of multivehicle crashes overall, how drivers respond to takeover requests for hazards that they cannot immediately see is unclear.
Multivehicle crashes arise in various unique scenarios such as those identified as precrash scenario typology in NHTSA (2007). Based on the 2004 General Estimates System crash database, the researchers at NHTSA developed scenario typology that represents typical movements and dynamics of vehicles in 44 risky driving scenarios involving at least one light vehicle prior to a crash. Furthermore, using police-reported crash data and injury severity of involved parties, the report quantifies the severity of each precrash scenario to characterize the projected consequence of crashes in the scenario. The precrash scenario typology could provide one starting point for identifying characteristics of near-miss scenarios in transportation safety research. In aviation, near misses have offered opportunities for human factors scientists and engineers to improve safety of the U.S. aviation system (Madsen et al., 2016; Thoroman et al., 2018). In contrast, near-misses in the surface transportation domain are rarely reported and are thus relatively unexplored. The precrash scenario typology offers details of each precrash scenario to be modeled in a driving simulator in which human behavior in a near-miss event can be systematically induced and studied in a controlled experiment.
The current study aimed to evaluate the impact of automated and connected vehicle technologies (Fisher et al., 2020) on driving performance in selected precrash scenarios using a distributed driving simulator environment. The Society of Automotive Engineers (SAE, 2021) defines six levels of vehicle automation in which drivers are driving the vehicle even with various driver support features such as lane centering and/or adaptive cruise control engaged between Level 0 to Level 2 while drivers are not driving the vehicle when Automated Driving System (ADS) is engaged between Level 3 to Level 5 (though, see de Winter et al., 2022 for details on automation pitfalls). Even though the drivers are not driving the vehicle when ADS is engaged in Level 3, the drivers must take over the active and manual control of the vehicle promptly when the ADS fails or operates outside of its operational design domain (ODD). Connected vehicle technology allows vehicles to sense and communicate with each other regarding their positioning and dynamics and to make warnings to a driver possible when a conflicting vehicle approaches the driver. In fact, connected vehicle technology may issue warnings to a driver of a Level 3 ADS before they reach the point where they must take over driving. To design effective warnings using the connected vehicle technology, it is critical to examine the driver performance in various scenarios including near misses and crashes in which the connected vehicle technology is expected to improve driver performance.
Two theoretical approaches for how drivers may handle near-miss events are situation awareness (SA) and hazard anticipation (HA). First, drivers’ SA may influence several information-processing stages of the driver. The most popular model of SA by Endsley (1995, 2023) postulates that SA comprises of three hierarchical levels—perception, comprehension, and projection. Briefly, to be situationally aware in a dynamic operational environment, a human operator must perceive objects around them, understand patterns and meanings of the perceived objects, and estimate how the comprehended environment unfolds over time in the future. If drivers recognize a particular driving scenario from its geometry and traffic patterns, they may successfully perceive and comprehend the scenario as risky and react based on their projection.
In a related study, Yamani and Horrey (2018) proposed an integrative model that connects the human information-processing model and levels of automation and suggested that drivers reallocate limited attentional resources that are “freed” by automation to other tasks. This implies that when drivers are supported by higher levels of vehicle automation, resources that support a driving task (e.g., perception and comprehension of the immediate driving environment) may be reallocated to a different task, which compromises their SA in the event that the ADS requires them to take over control of the vehicle. In fact, the literature indicates that engaging in secondary/driving-irrelevant tasks and increased levels of vehicle automation degrade certain takeover performance metrics such as post take-over driving performance (McDonald et al., 2019; Weaver & DeLucia, 2022) and SA (Liang et al., 2021).
Second, related to SA, latent HA is a higher-order cognitive process that allows drivers to anticipate hazards that have not yet materialized on the forward roadway (e.g., Pradhan & Crundall, 2016; Pradhan et al., 2005; Unverricht et al., 2018). Latent HA is analogous to the projection level of SA, where a driver must predict the location of a hazard if they hope to eventually mitigate it. Near-miss scenarios may be classified into two categories, scenarios with obstruction and scenarios without obstruction. In scenarios with obstruction, road geometry or objects (a precursor) obscure a part of the forward roadway where a hazard might exist. In these scenarios with environmental hazard (Crundall et al., 2012), where a precursor and a hazard are different, drivers must deploy HA by preparing their response to the imminent hazard when it materializes in the future. In other words, they must anticipate a hazard being behind the obstruction if they hope to mitigate it (should it appear on the road).
On the other hand, in scenarios without obstruction, a precursor itself is a hazard, or behavioral hazard, and the scenario may prompt more overt anticipatory actions, such as hovering one’s foot over the brake. In near-miss scenarios where another car is visibly approaching a driver, the driver could respond to mitigate the anticipated conflict. Despite a large volume of literature on HA, research on anticipatory processes in drivers of ADS is relatively scarce. Connected vehicle technology could communicate to them about the distance to a potential conflict with another vehicle via intervehicle warning information systems (Guler et al., 2014; Jeong et al., 2014). This technology may enhance drivers’ HA by providing a warning as a cue to upcoming latent hazard (Krishnan et al., 2019; Yamani et al., 2022).
To address the research gap in automation takeover and HA, the current experiment examined the impact of the ADS driving instructions (passive vs. active) and the presence of road obstruction (present vs. absent) on driving performance in intersection and highway scenarios in connected vehicle environments that provided reliable audiovisual collision avoidance warning (e.g., Spence & Ho, 2008). A road obstruction in the simulated driving environment would mean that a driver would need to anticipate if a hazard could be behind it to quickly mitigate and avoid it. Drivers drove eight scenarios in a random order in a high-fidelity driving simulator connected to another driving simulator which was controlled by the experimenter to create a near miss in each scenario.
To measure human performance in scenarios where multivehicle crashes are likely to occur, a distributed driving simulator offers a means for studying interactions between two drivers in a shared, and controlled, virtual environment (Figure 1). In a distributed driving simulator environment, multiple driving simulators are connected via a local network, allowing researchers to examine interactions between drivers such as near misses in a repeated and controlled manner. Distributed driving simulators offer an alternative to traditional driving simulators’ method of using location and timing triggers to repeatedly generate conflicts by allowing confederates within the driving environment the flexibility to interact with participants. While variations in participants’ speed or steering when driving through triggers in the driving environment can sometimes lead to missed interactions, with the distributed driving simulator, a confederate-controlled vehicle can adjust its behavior to match the participants, allowing more consistent interactions in the road environment. Concept of distributed driving simulation platform. In distributed driving simulation, vehicle data from multiple driving simulators, each driven by a driver, are shared with each other and represented in a shared virtual environment.
We hypothesized that drivers would more effectively respond to the near-miss scenarios, as measured by mean longitudinal velocity, standard deviation of longitudinal velocity, and mean longitudinal acceleration, when instructed to actively drive and monitor the ADS than when instructed to passively drive and monitor the ADS. In addition, we predicted that drivers would demonstrate greater standard deviation and mean longitudinal acceleration when the hazard was visually obstructed versus when it was not obstructed.
Method
Participants
Forty-eight licensed drivers (mean age = 24.67 years, SD = 7.79 years, mean years since licensure = 8.22 years, SD = 7.61 years) were recruited from the community of Old Dominion University (ODU) to participate in the study. All participants either received course credit or were paid $20 for their participation. This research complied with the tenets of the Declaration of Helsinki and was approved by the Institutional Review Board at ODU. Informed consent was obtained from each participant.
Apparatus
A distributed driving simulation platform at ODU (see Figure 2) was used for the study, which networks two Real-Time Inc driving simulators, a partial-cab simulator (RDS-1000; Real-Time Inc) and a desktop simulator (RDS-100; Real-Time Inc) allowing two drivers to interact in a shared virtual environment. The partial-cab simulator was comprised of four networked computers and a single-seat real-vehicle console with three 65-inch screens subtending approximately 205° horizontally and 35° vertically from the driver’s head. The partial-cab simulator features a 3 degrees-of-freedom motion system that reduces simulator sickness along with 5.1 surround sound audio system. The desktop simulator consists of a high-end simulator computer, USB-based steering wheel and pedal, three 27-inch monitors subtending approximately 100° from the driver’s head and 2.0 audio system. Each audio system produces ambient noise simulating realistic traffic environments with doppler shift respect to each simulator independently. The RDS-1000 and the RDS-100 simulators were connected via the networked mode where the RDS-1000 fully controlled and managed the proposed networked scenario, and the scenario was presented and driven in both driving simulators at the same time. Distributed Driving Simulator Platform at ODU. A partial-cab driving simulator (RDS-1000; big box) and a desktop simulator (RDS-100; small box).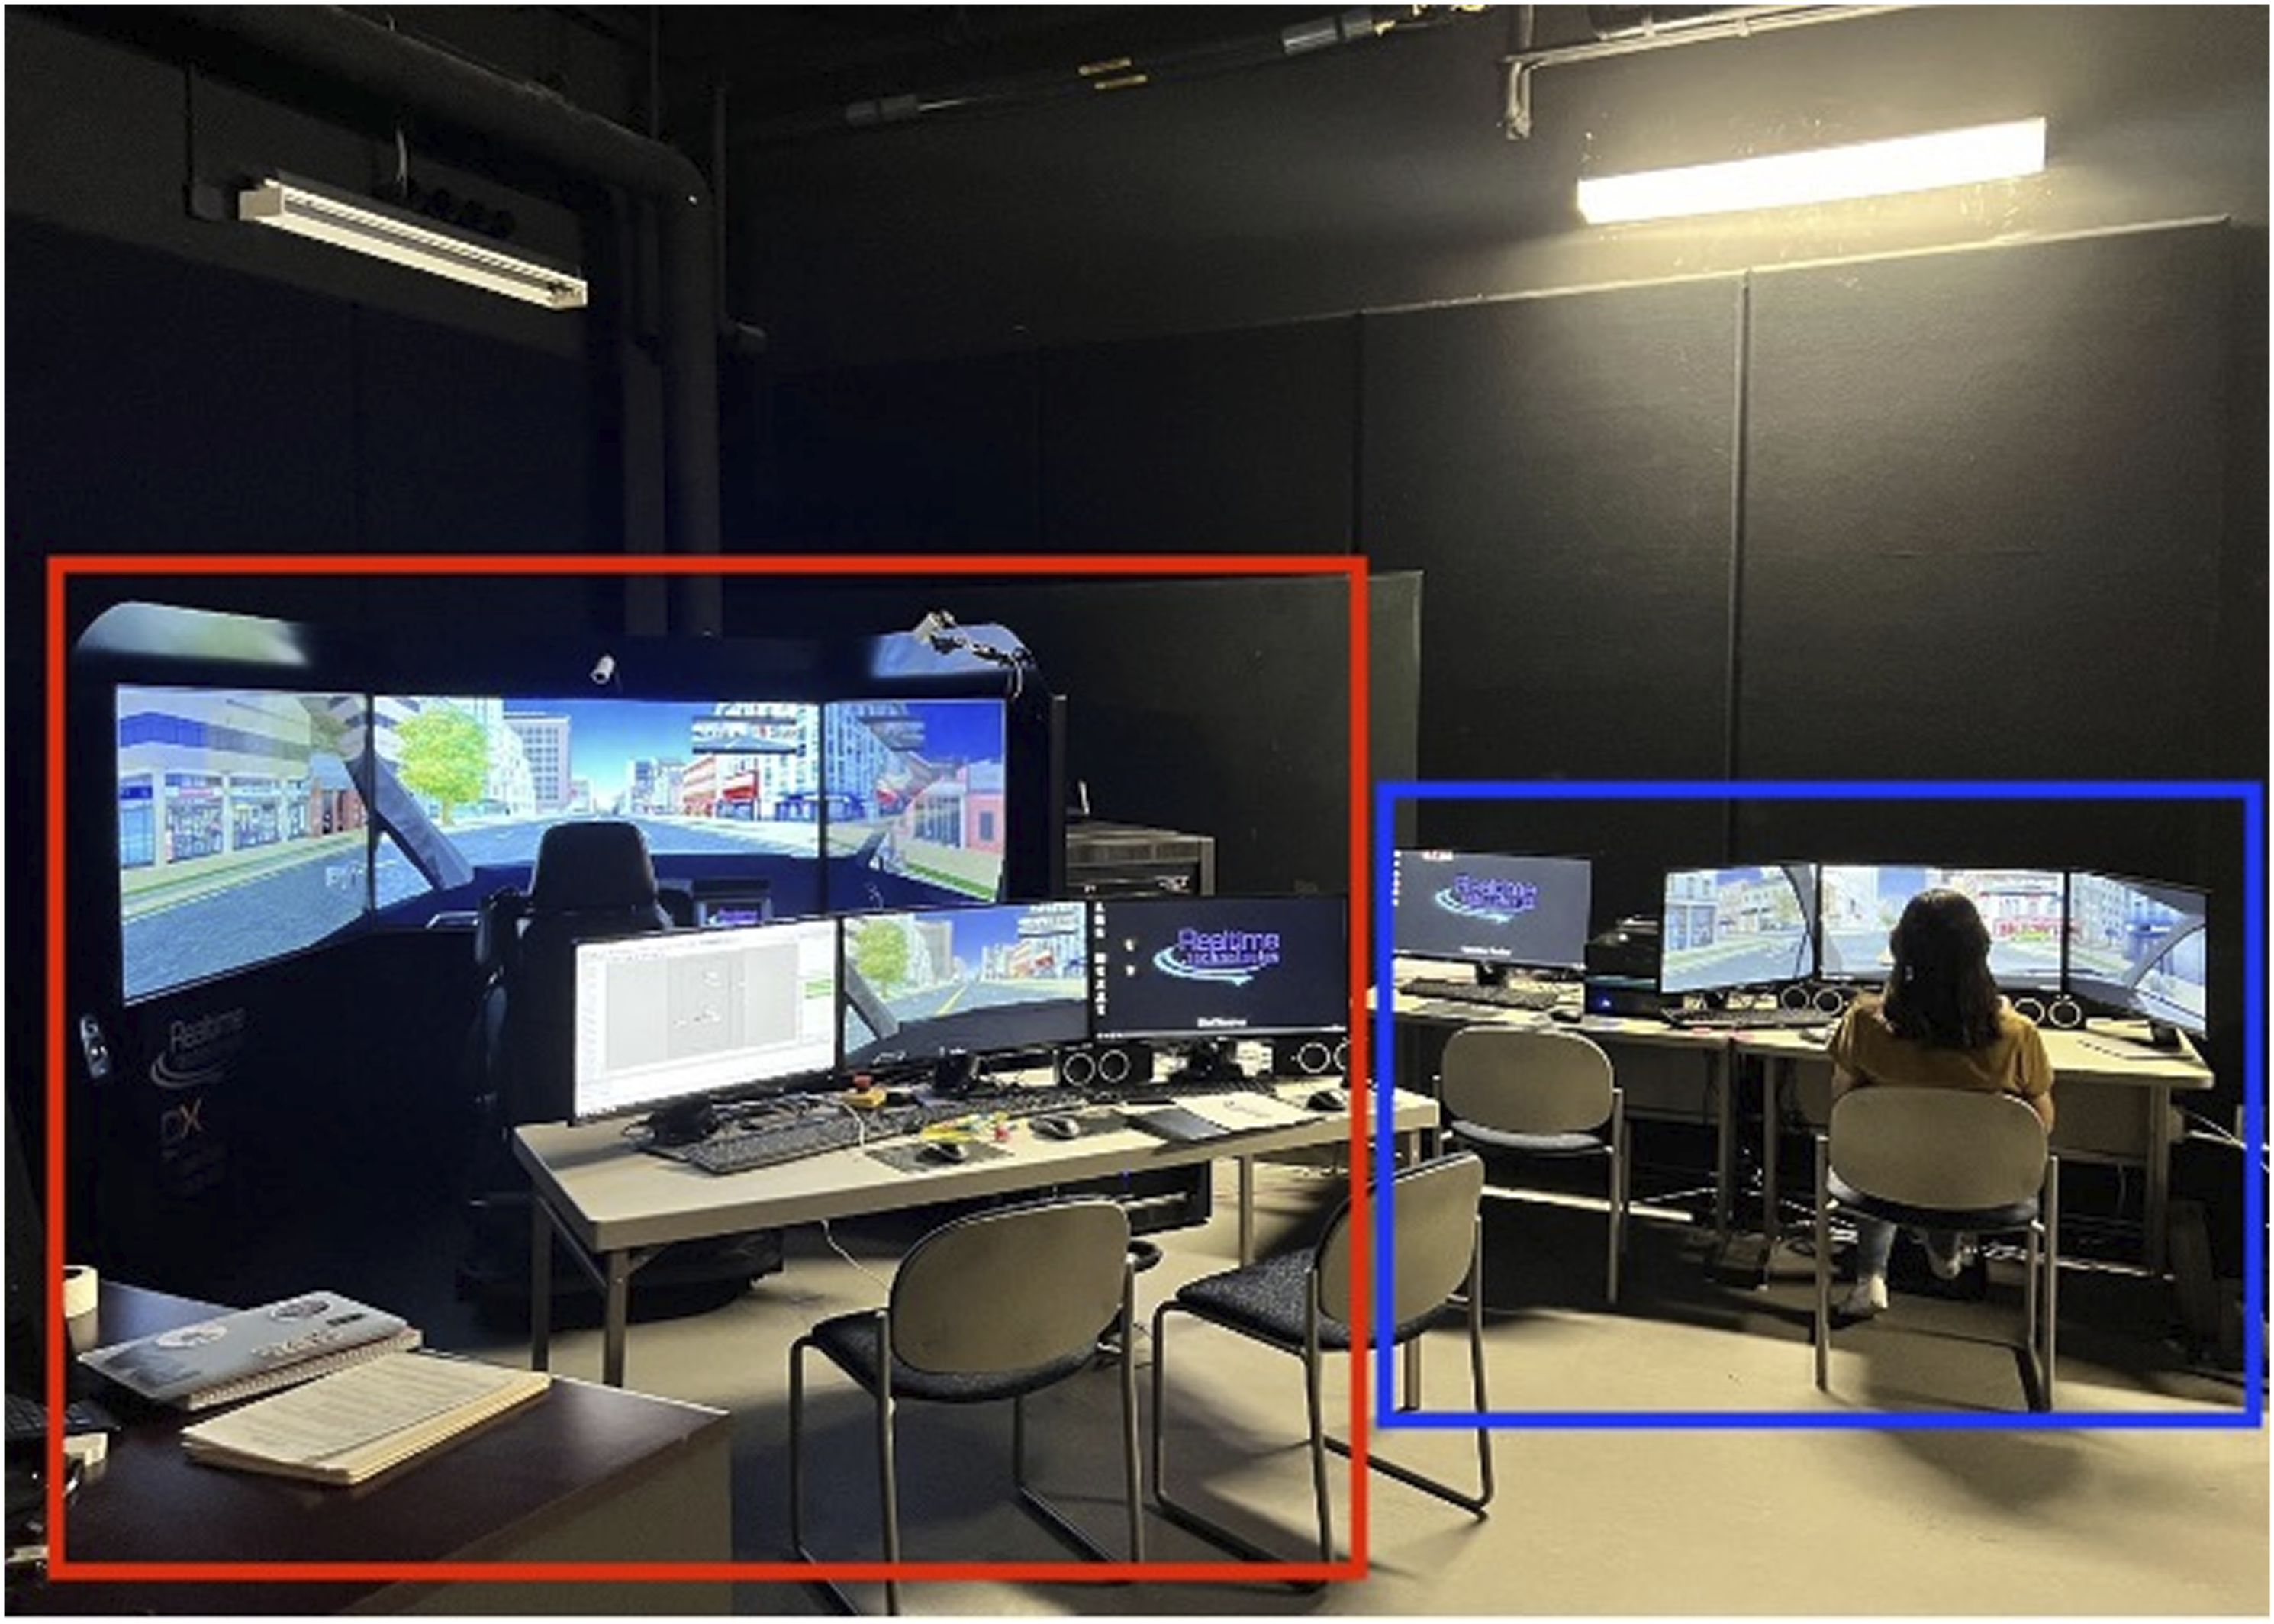
Driving Scenarios
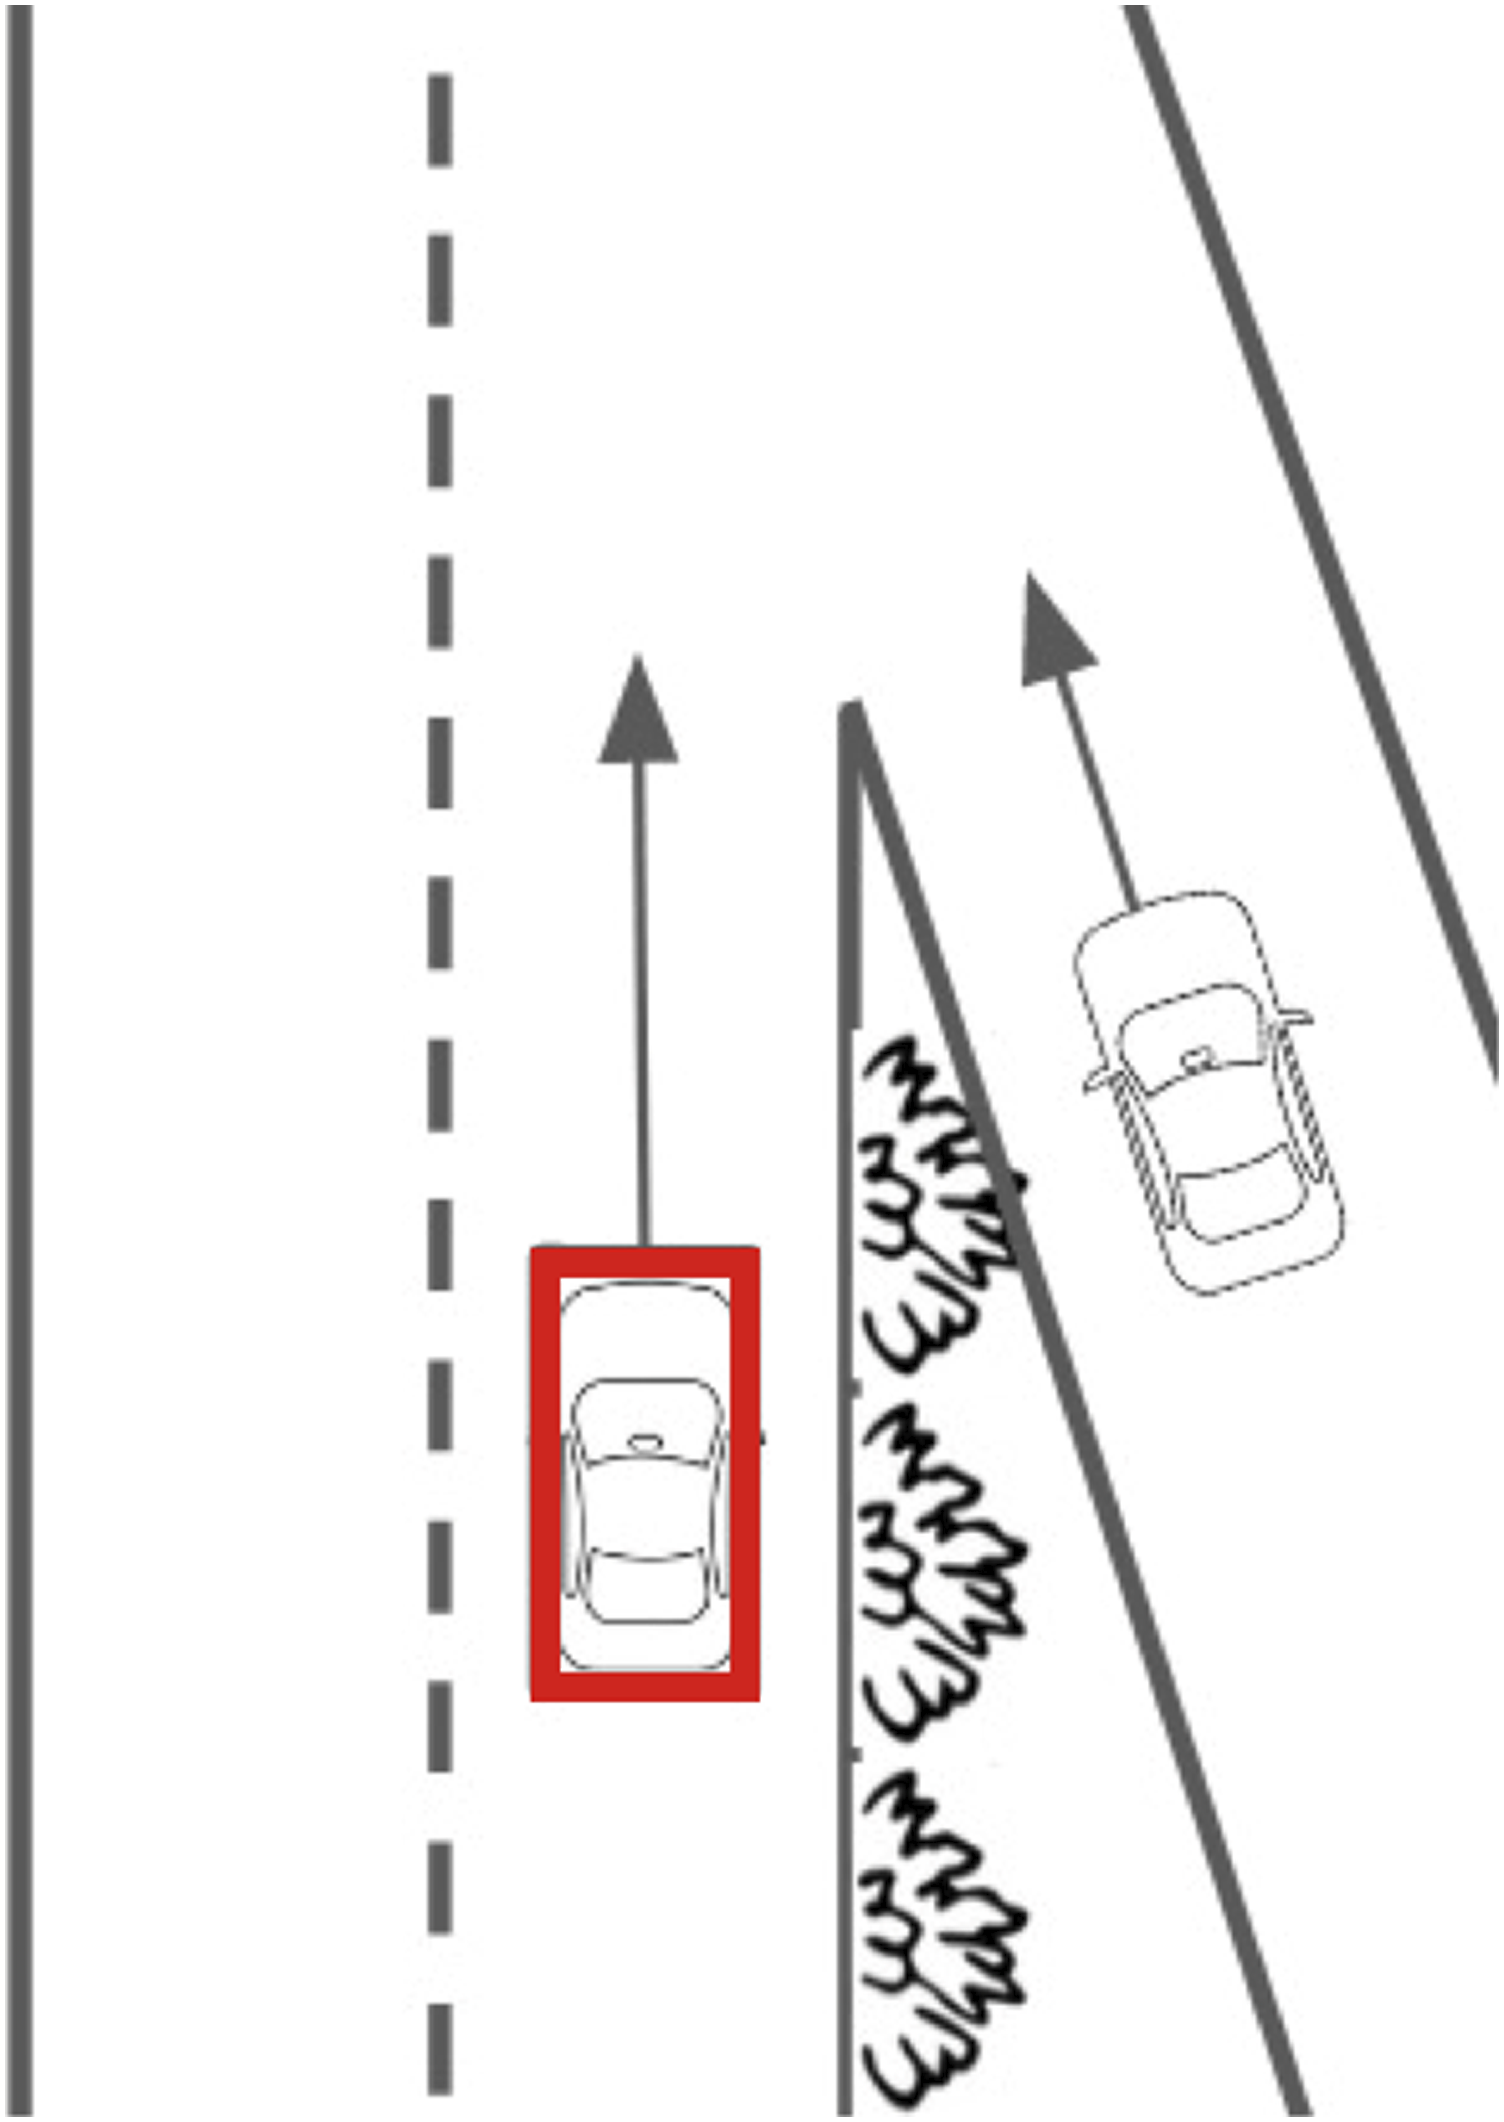
Four high-risk driving scenarios were selected from the NHTSA Pre-Crash Scenario Typology (NHTSA, 2007) and modeled using SimCreator for driving simulation (Realtime Technologies, Inc., 2023). Specifically, two intersection scenarios and two highway merging scenarios were modeled with and without visual obstructions blocking the view of a conflicting vehicle (see Figures 3–5). The onset of audiovisual warning in each scenario was designed based on the complexity of the scenario while ensuring the driver reaction time of 2.5 seconds as suggested by American Association of State Highway and Transportation Officials (AASHTO, 2011). Running Red Light Scenario in the obstruction-present condition. The vehicle in red represents the participant’s vehicle. Running Stop Sign Scenario in the obstruction-present condition. Highway Merging Scenario in the obstruction-present condition.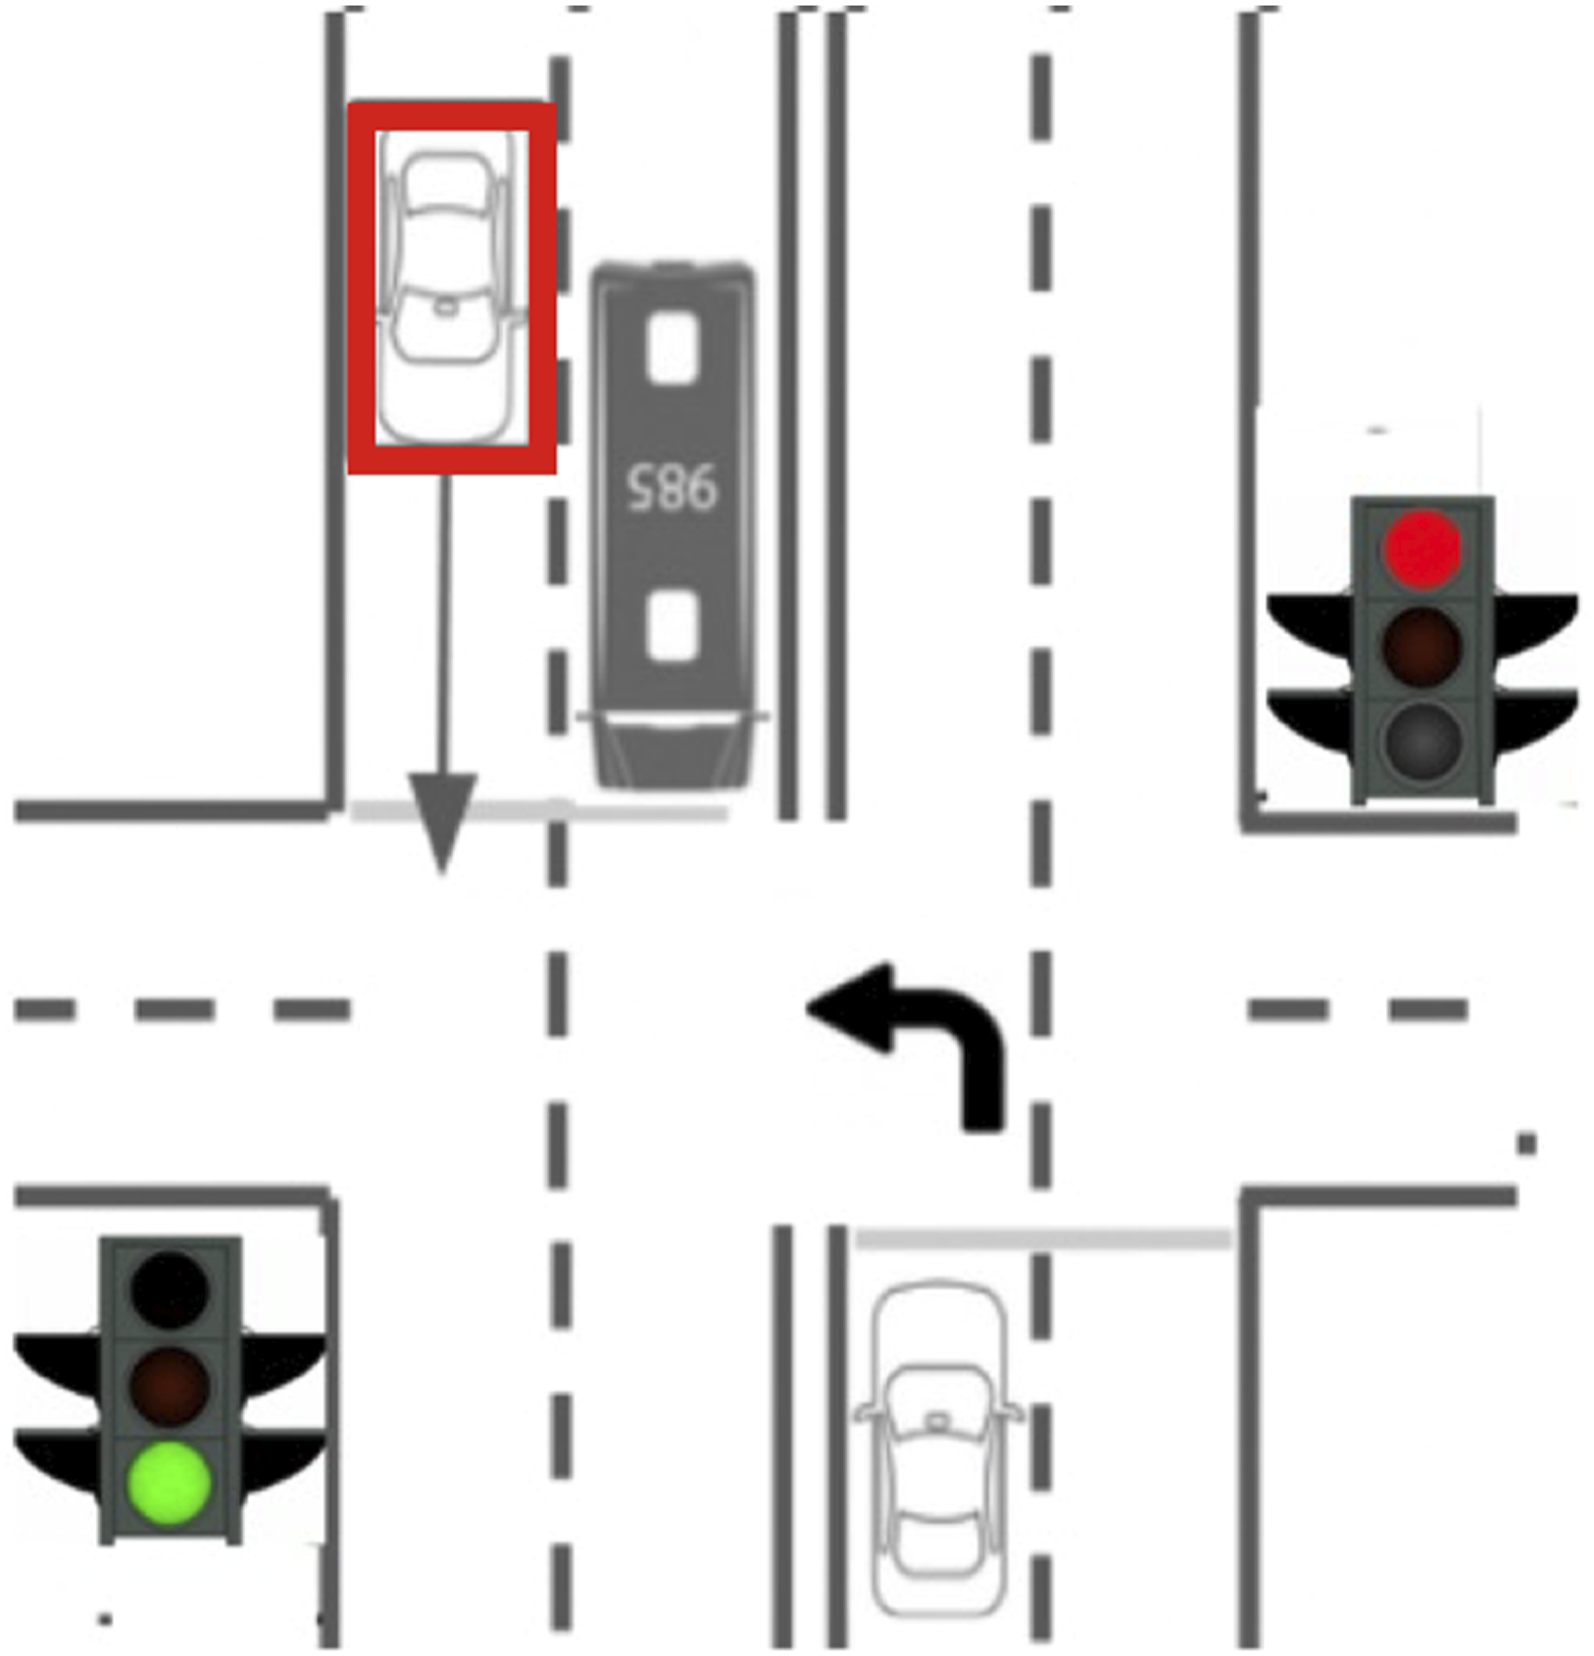

Running Red Light Scenario
The driver (in a bold box) is traveling straight at a signalized intersection at a posted speed limit of 35 mph, in daylight and under clear weather conditions (Figure 3). Another left-turning vehicle runs a red light and enters the intersection, colliding with the approaching vehicle from the opposite direction. The conflict vehicle was clearly visible to the participants before running the red light in the obstruction-absent condition while occluded by a stationary bus in the lane to the left of the participant in the obstruction-present condition. A warning was presented 112.20 feet before the collision point.
Running Stop Sign Scenario
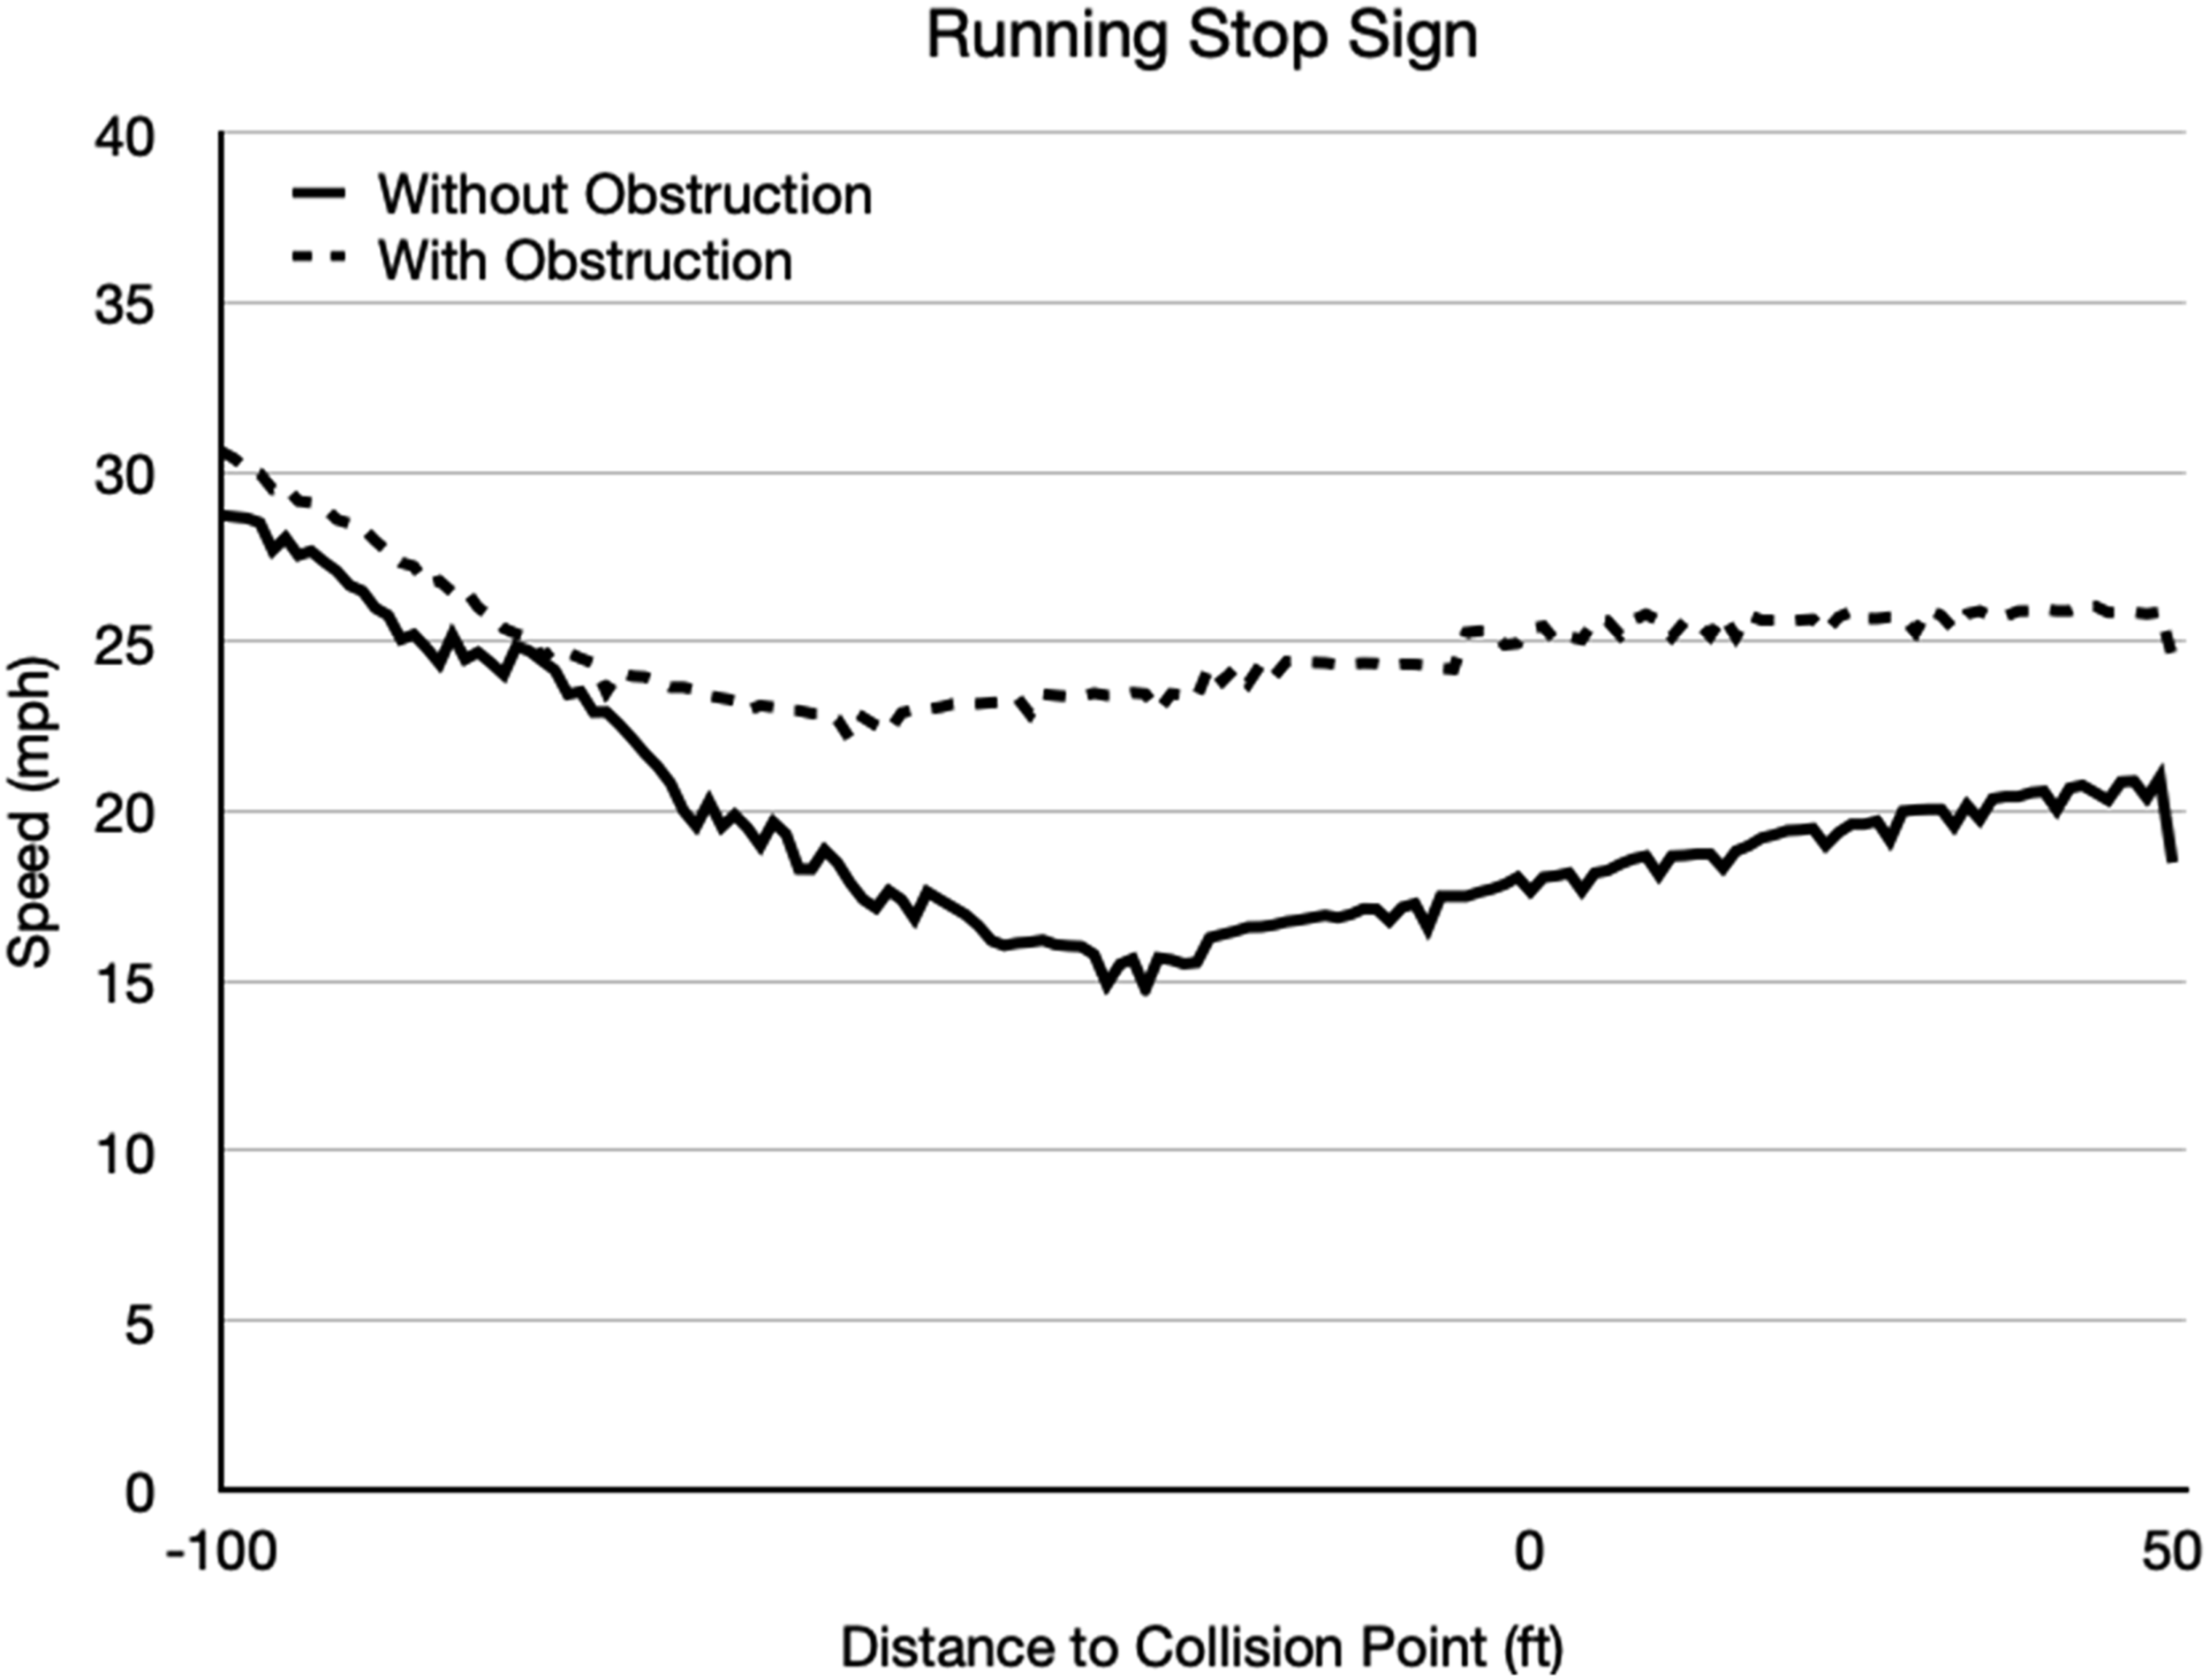
The driver (in a bold box) is traveling straight at an intersection at a posted speed limit of 35 mph, in daylight and under clear weather conditions, with cross traffic controlled by a stop sign (Figure 4). Another vehicle runs a stop sign at the intersection, colliding with the driver’s vehicle crossing the intersection from a right-angle direction. The conflict vehicle that ran the stop sign was visible to the participant in the obstruction-absent condition while not visible until right before it crossed paths with the participant due to a row of dumpsters along the edge of the sidewalk in the obstruction-present condition. The warning was presented 137.14 feet before the collision point.
Highway Merging Scenarios
The driver (in a bold box) is traveling on the right lane of a straight section of a highway at a posted speed limit of 65 mph with moderate levels of ambient traffic under clear weather conditions (Figure 5). A conflict vehicle merges onto the highway from the highway entrance ramp. The merging scenarios consisted of one daytime obstruction-present, one daytime obstruction-absent, one nighttime obstruction-present, and one nighttime obstruction-absent scenarios. The conflict vehicle merging onto the highway was visible to the participant in the two obstruction-absent scenarios but was not visible in the two obstruction-present scenarios due to a row of hedges between the highway and the on-ramp. The warning occurred 247.77 feet before the collision point.
Procedure
Each participant provided verbal consent to participate in the study and was randomly assigned to one of two groups: active ADS driving or passive ADS driving. There were no functional differences between active and passive ADS; only the instructions given to the participants varied. The ADS controlled both steering and speed of the participant vehicle until the takeover event occurred. Participants completed a demographics form and a driving history questionnaire. Following Samuel et al. (2020), we provided participants in the active and passive driving conditions with different instructions on how to operate the vehicle with ADS and takeover procedures when a warning is issued. Specifically, participants assigned to the active ADS driving condition were told: “You are expected to have your hands on the steering wheel and foot over the brakes even though the simulator will handle the maneuvering (steering, braking, acceleration, and other vehicle behavior parameters) aspects of your driving throughout the entire simulation. You are also expected to pay attention to the forward roadway even though the vehicle handles your navigation in autonomous driving.” Those in passive ADS driving group were instructed that “All aspects of your drive will be handled by the simulation, but you need to be ready to take over if requested to do so by the system.”
Participants completed a practice drive in the RDS-1000 to acclimate themselves with the physical dynamics of the simulated vehicle for approximately 5 minutes. Participants were asked to obey all posted speed limits, traffic signs, signals, and all applicable traffic rules for both the practice and experimental drives. Additionally, participants were informed of the function of the warning system of the simulated connected vehicle technology (Figure 6). Driver perspective views for the Running Stop Sign scenario (left) and Highway Merging scenario (right) with the warning sign used for each scenario.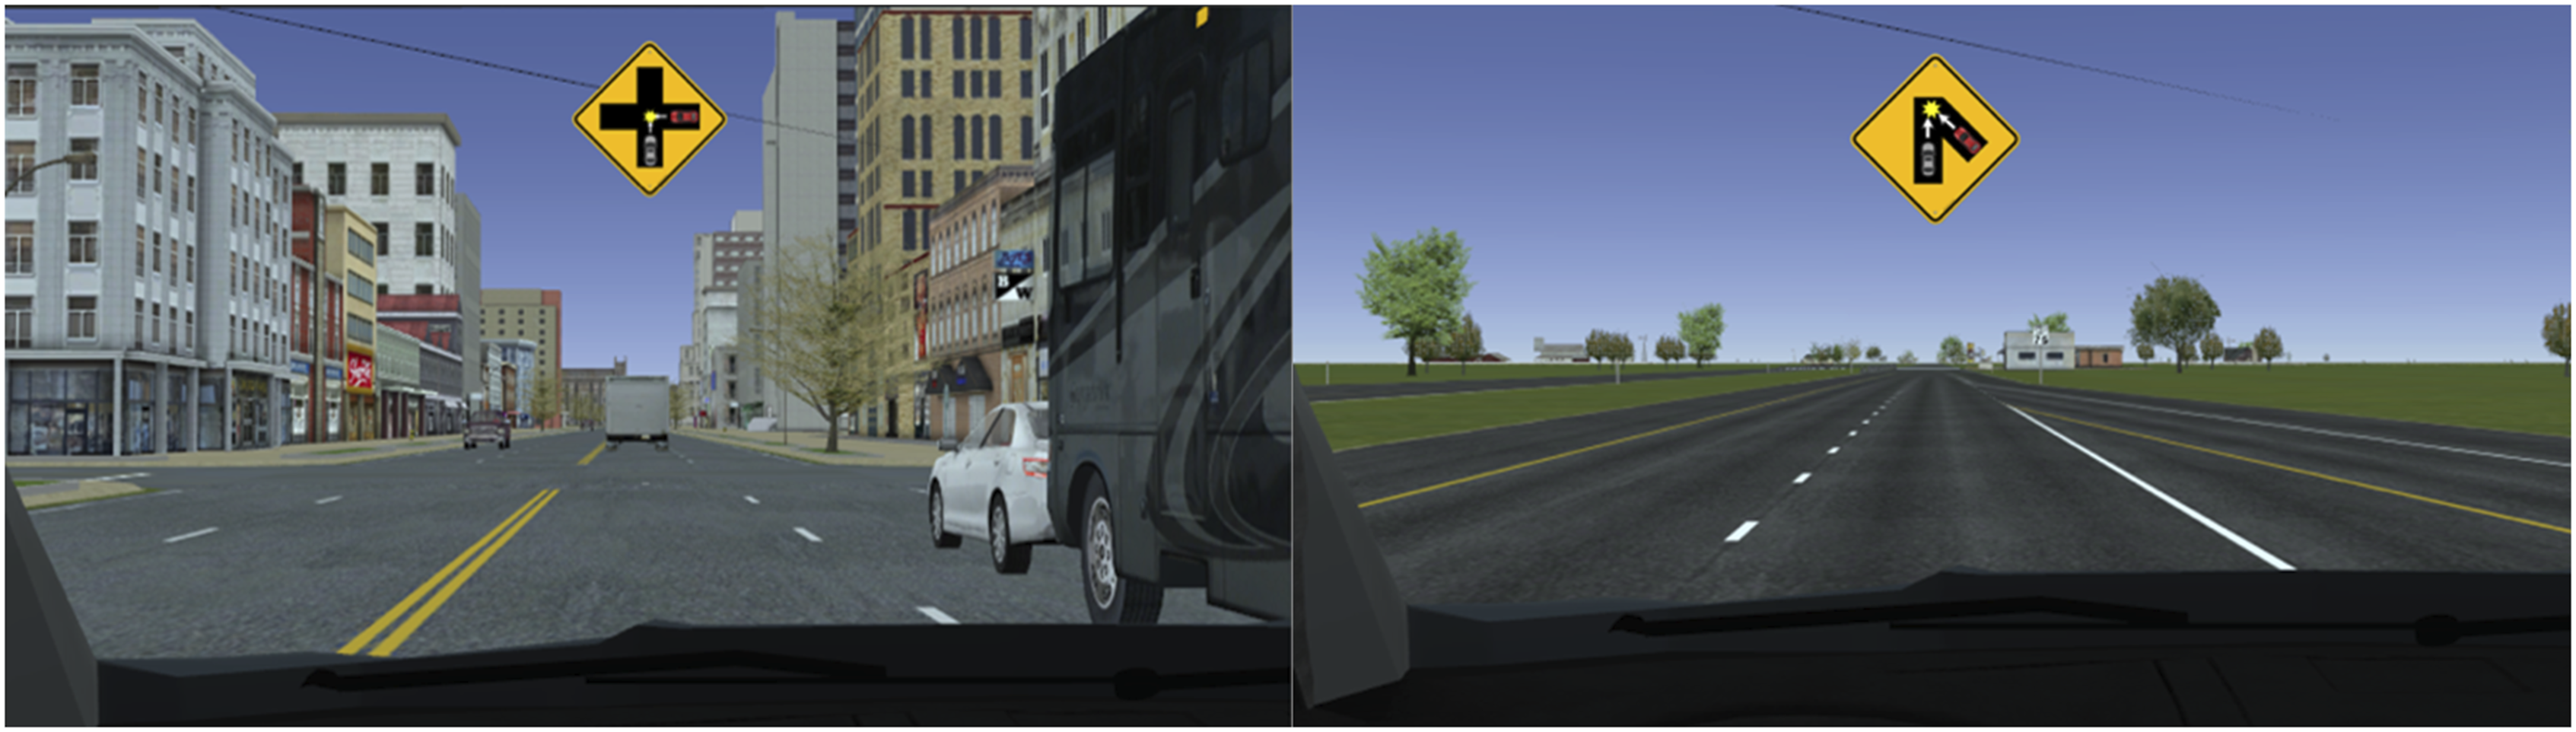
Each participant completed the trust questionnaires (Chancey et al., 2017; Jian et al., 2000) before completing a series of eight experimental scenarios in the RDS-1000 simulator in an order randomized for each participant. During each simulated drive, a trained experimenter drove in the RDS-100 simulator, networked in the same simulated environment with the partial-cab simulator, to approach the predetermined collision point by controlling the vehicle speed and traveling direction in response to the participant’s behavior as viewed in the top-down scenario map on the master control display. Finally, after completing the scenarios, participants completed the two trust questionnaires for a second time. Participants were provided either course credits or were paid at the conclusion of the study. Each experimental session took approximately 1 hour.
Design and Dependent Variables
The experiment employed a 2 × 2 × 2 mixed factorial design with Driving Instruction (Active vs. Passive) as a between-subject factor and Scenario (Intersection vs. Merging) and Obstruction (Present vs. Absent) as within-subject factors. Three vehicle measures, the mean longitudinal velocity, the standard deviation of longitudinal velocity, and the mean longitudinal acceleration served as dependent measures for the study. Each measure was calculated from vehicle data captured between the warning onset and the projected collision point for each scenario. Trust toward the ADS was measured via Jian et al.’s (2000) and Chancey et al.’s (2017) trust questionnaires, which have been shown to indicate two different facets of automation trust (Yamani et al., under review).
Statistical Analysis
In place of conventional null-hypothesis significance tests (NHSTs), default Bayesian analysis of variance (ANOVA; Rouder et al., 2012) was used for statistical analysis. The measure of statistical evidence is a Bayes factor, denoted as B 10 , a ratio of the likelihood that a statistical model including an effect of interest produce obtained data to the likelihood that a model excluding the effect produce obtained data. Thus, a greater value of the Bayes factor indicates stronger evidence for the effect of interest while a smaller value indicates weaker evidence. Thus, unlike the NHSTs often encouraging dichotomous statistical judgment, the Bayesian analysis allows a more graded statistical judgment than the NHSTs and accumulates evidence either for or against the presence of an effect of interest. Finally, each magnitude of the Bayes factor was interpreted following nomenclature provided by Jeffreys (1961). A default Cauchy prior was used for all the analysis (scale = √2/2).
Vehicle data on each dependent measure were submitted to a 2 × 2 × 2 mixed Bayesian ANOVA with Driving Instruction as a between-subject factor and Scenario and Obstruction as within-subject factors. Trust scores, both composite and subscale data, were submitted to 2 × 2 mixed Bayesian ANOVAs with Driving Instruction as a between-subject factor (Active vs. Passive) and Time (preexposure vs. postexposure) as a within-subject factor. Along with the Bayes factor for each effect, we report a conventional test statistic with an eta squared as a measure of the effect size. All the analysis was performed in R (R Core Team, 2023) using tidyverse, dplyr, lme4, effectsize, BayesFactor, and ggplot2 packages.
Results
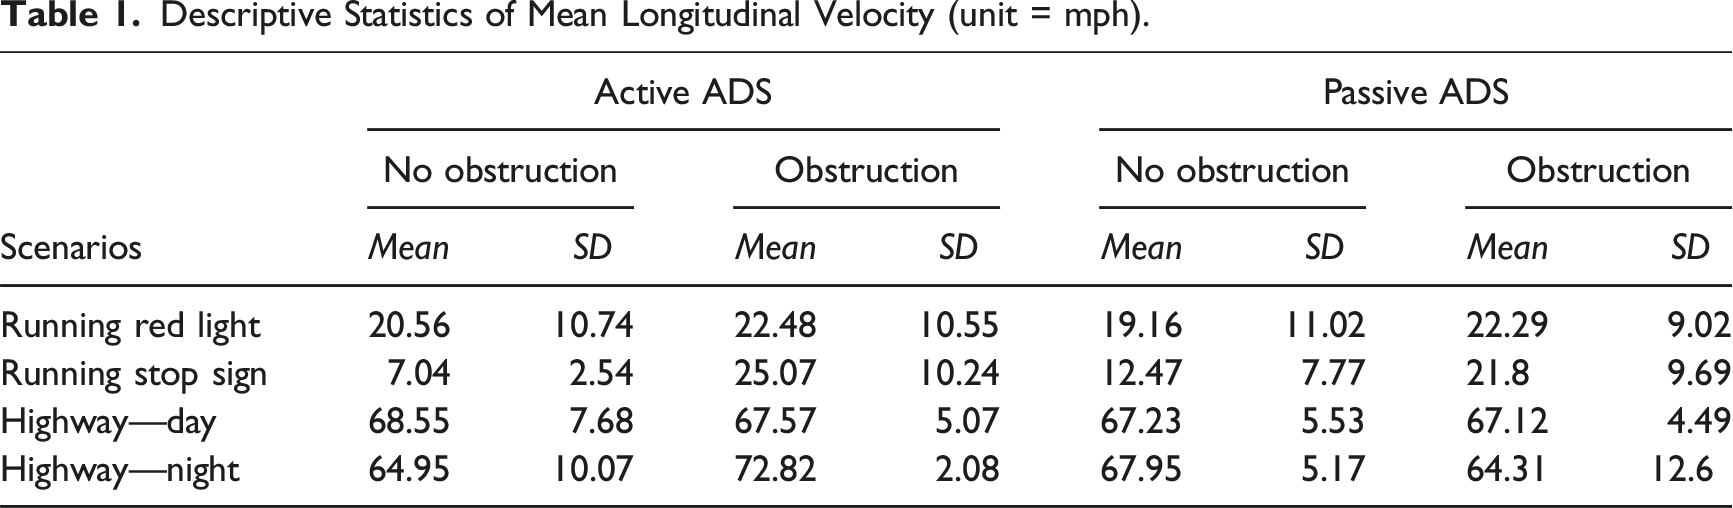
Descriptive Statistics of Mean Longitudinal Velocity (unit = mph).
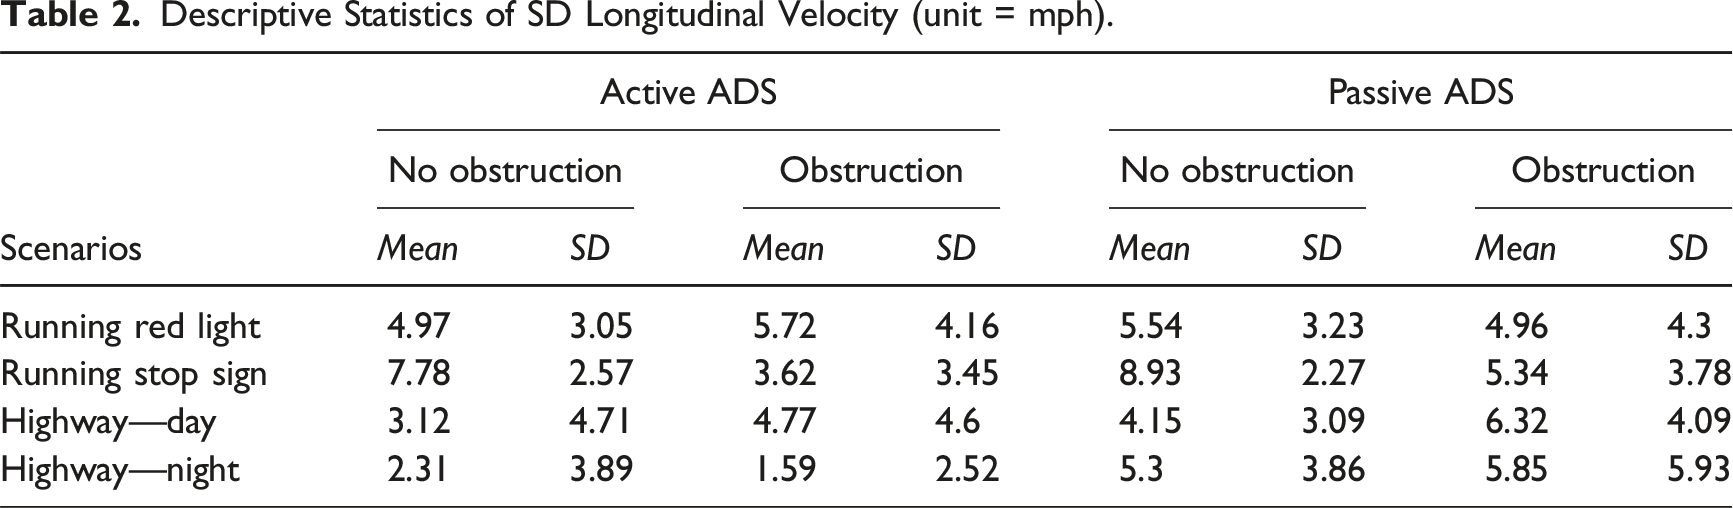
Descriptive Statistics of SD Longitudinal Velocity (unit = mph).
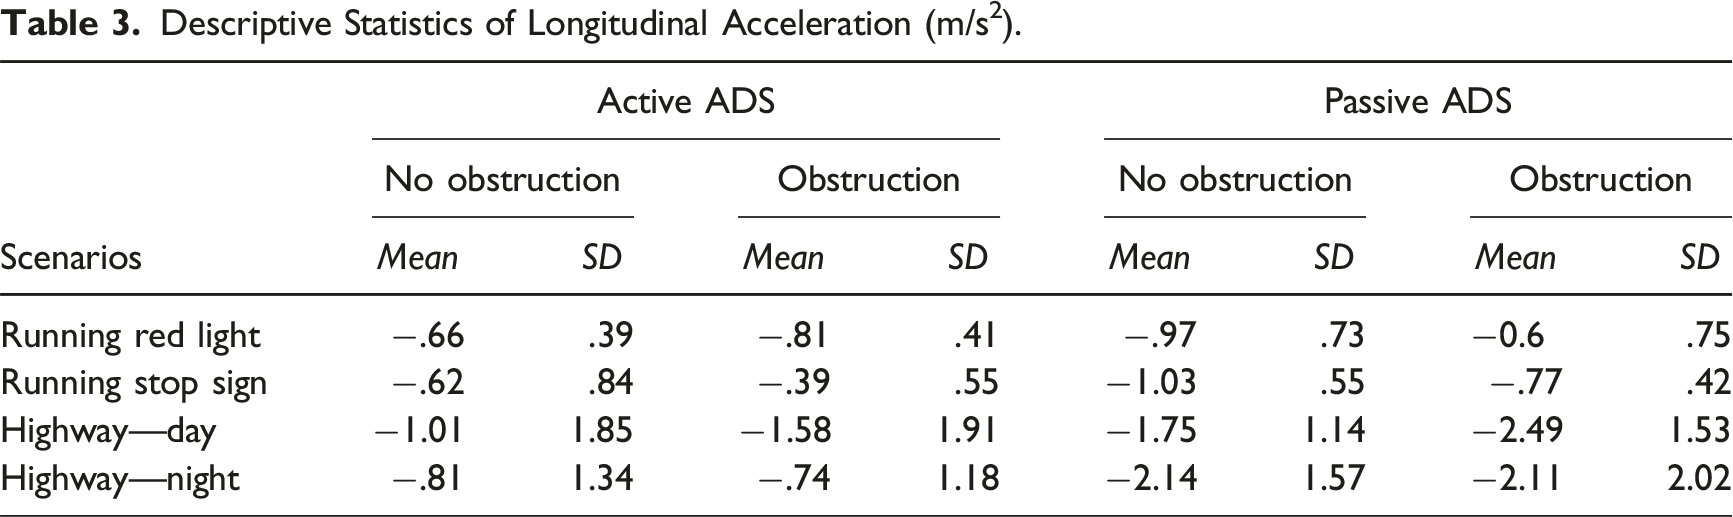
Descriptive Statistics of Longitudinal Acceleration (m/s2).
Mean Longitudinal Velocity
As expected, drivers traveled at lower speeds in the intersection scenarios than the highway scenarios (M = 19.62 mph vs. 67.58 mph), F (3,116.18) = 679.21, η
2
= .95, B
10
= 3.45 × 1077, indicating that the participants followed the posted speed limits. Drivers substantially slowed down more when obstructions were absent than when obstructions were present in the driving scenarios, F (1,22.33) = 11.04, η
2
= .33, B
10
= 24.17, an effect only present in the running stop scenario, F (3,117.20) = 7.57, η
2
= .16, B
10
= 18.36. Figure 7 represents mean longitudinal velocity across the four scenarios plotted separately for the obstruction conditions. For the Running Stop Sign scenario, Figure 8 presents mean longitudinal velocity as a function of distance from the projected collision point. Data gave substantial to strong evidence against the main effect of Driving Instruction, B
10
= 1/5.04 and the Obstruction × Driving Instruction, B
10
= 1/12.23, except that data were indifferent to the remaining effects, 1/2.14 < B
10
< 1/1.41. Mean longitudinal velocity in each scenario with- and without-obstruction conditions. Error bars represent 95% Bayesian Credible Intervals. Mean vehicle speed as a function of distance to the projected collision point plotted separately for the obstruction conditions.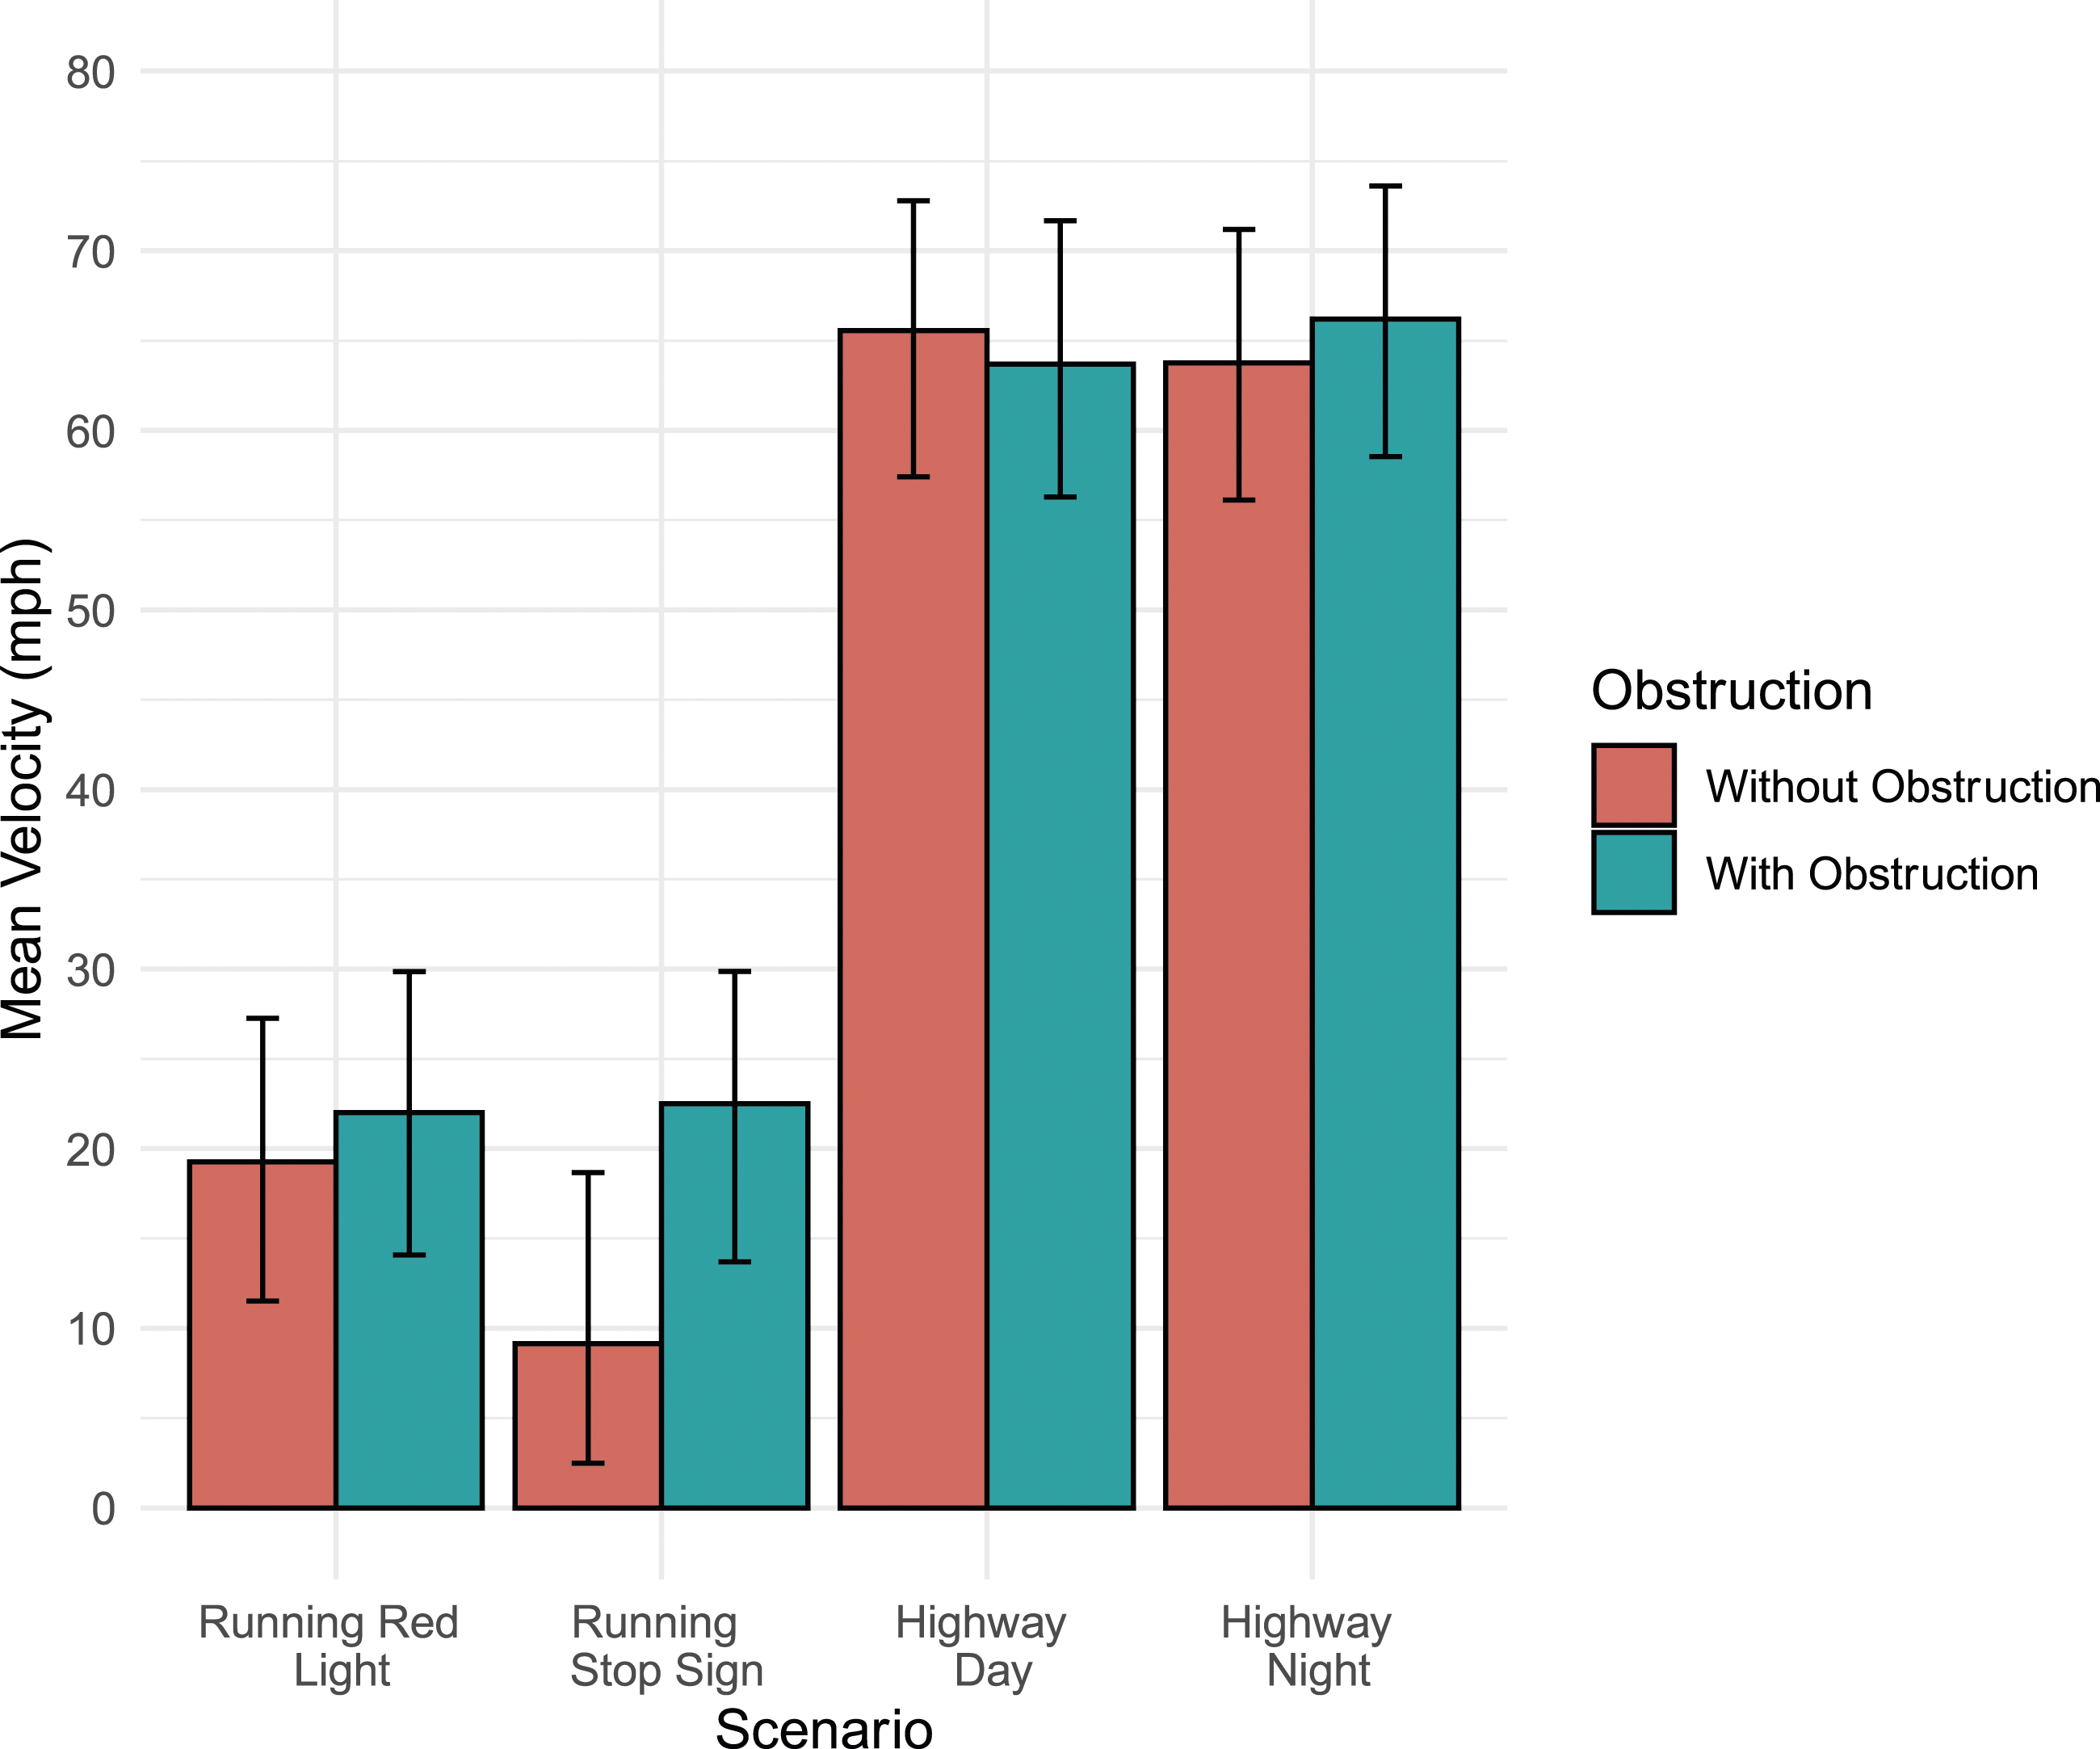
Standard Deviation of Longitudinal Velocity
Drivers in the running stop scenario showed substantially less variability in their speed control when their view was obstructed than they did when it was not obstructed, F (3,60.06) = 7.64, η 2 = .28, B 10 = 4.02. However, this effect was not observed in the remaining scenarios. Additionally, drivers who were instructed to passively drive using the ADS showed substantially more variability in their speed control during the conflict than those of the active driving condition, F (1,22.34) = 2.49, η 2 = .10, B 10 = 5.61, suggesting that drivers of higher levels of ADS exhibit poorer vehicle control at the time of a critical conflict. Data gave substantial evidence against the remaining effects, 1/5.73 < B 10 < 1/4.15, except that data were indifferent to the main effect of Scenario, B 10 = 1.94, and the Driving Instruction × Scenario interaction, B 10 = 1/1.91.
Mean Longitudinal Acceleration
Drivers decelerated at a decisively higher rate in the highway scenarios than the intersection scenarios (M = −.74 vs. −1.56 m/s2), F (3,60.83) = 6.62, η 2 = .25, B 10 = 125.96. Interestingly, drivers of the passive ADS driving condition showed a decisively higher deceleration rate than those of the active ADS driving condition ADS, F (1,21.90) = 4.34, η 2 = .17, B 10 = 41.25, reflecting that drivers instructed to passively drive ADS needed to more aggressively slow down their vehicle during the conflict situations than those in the active ADS driving group. Data substantially supported the statistical models without the remaining effects, 1/7.16 < B 10 < 1/4.33 except that data were indifferent to the Scenario × Driving Instruction interaction, B 10 = 1/1.21.
Trust
Trust scores on both Jian et al. (2000) and Chancey et al. (2017) scales did not substantially vary as a function of Time and Group (1/3.62 < B 10 < 1/1.17).
Discussion
The current study used a distributed driving simulator environment to examine post take-over driving performance in near-miss scenarios for drivers of simulated connected and partially automated vehicles. Each of the four near-miss scenarios was presented with or without a visual obstruction, masking the entry of the conflict vehicle which was manually controlled by the experimenter to create predefined near misses in the shared virtual environment. Participants drove each scenario in the driving simulator and their vehicle measures in each near-miss event were recorded. Three points can summarize the results.
First, the drivers instructed to only passively drive using ADS exhibited more rapid deceleration rates and less stable vehicle control than those instructed to actively be ready to drive using ADS. The mean deceleration rates among the drivers of the passive condition were roughly 1.49 m/s2 which is below the conventional threshold for hard braking of 2.67 m/s2 (Hunter et al., 2021), but higher than the average deceleration rate of .86 m/s2 observed in the drivers of the active condition. Increased standard deviation of longitudinal velocity further implies that the traveling speed of the drivers of the passive condition varied more than those of the active condition, consistent with previous research (Strand et al., 2014). It is noteworthy that the characteristics and functionalities of the simulated vehicle were identical between the instruction conditions: What was manipulated was the instruction that allowed them to delegate the driver responsibility to the ADS and take their “mind” off the road. One explanation of the results is that, because the drivers of the passive condition were not expected to fully attend to the forward roadway and the control of the automated vehicle, the drivers might have sampled the immediate driving environment less effectively than those of the active condition, leading to poorer perception (Level 1 SA) and comprehension (Level 2 SA) of the environment. Compromised SA on the two first levels could degrade the quality of their ability to project, or anticipate, an imminent threat (Level 3 SA). Unless drivers are specifically instructed to search the environment, higher levels of automation are generally associated with decreases in SA compared to lower levels of automation (de Winter et al., 2014), suggesting that deteriorated SA may have contributed to increased and more variable deceleration rates when participants were instructed to only passively monitor the ADS in the current study. Future research can directly examine the possible relationship between degraded SA and vehicle control when passively monitoring ADS by using SA measures such as Situation Awareness Global Assessment Technique (SAGAT) (Endsley, 1995). In addition, tracking drivers’ eye movements (see Unverricht et al., 2018) would also allow us to examine drivers’ ability to anticipate imminent road hazards both when passively and actively monitoring ADS.
Second, the presence of an obstruction was associated with a slightly, but statistically credible, higher longitudinal velocity compared to scenarios without an obstruction (10.43 vs. 23.37 mph) in the running stop signal scenario. The drivers slowed down less and their velocity was more consistent in the obstruction-present than obstruction-absent trials, implying that the drivers might not have anticipated the hazard correctly and therefore failed to modulate vehicle control. Interestingly, the drivers were presented the simulated connected vehicle warning prior to the planned conflict. This implies that connected vehicle warning may not be effective in some near-miss scenarios even though the connected vehicle technology can provide audiovisual warnings about precollision with another vehicle. This finding conflicts with previous research that found when drivers in a simulator received HUD alerts on hazards ahead on the road, they slowed down more than drivers who did not receive alerts, even when the view of the hazard was obscured (Hajiseyedjavadi et al., 2018; also Saito et al., 2021a). However, the warnings drivers were shown in Hajiseyedjavadi et al. (2018) provided detailed, schematics from the driver’s perspective of the location of the hazard, suggesting that more generic warnings may not be as effective at encouraging drivers to slow down when approaching hazards. A context-aware driver assistive technology powered by artificial intelligence (AI) may be used to recommend speed control in scenarios with latent hazard to drivers (Saito et al., 2021b).
To further examine the underlying mechanisms that regulate the behaviors above, it is necessary to understand the relationship between hazard anticipation process and overt response execution to control the vehicle. Our recent work expanded the existing theoretical framework on driver hazard anticipation to include operational hazard anticipation, the engagement of overt motor actions (such as hovering one’s foot over the brake) in preparation in the event a latent hazard does materialize (Yamani et al., 2022). For example, in the merging scenario, drivers who operationally anticipate the incoming conflict vehicle as a latent threat would scan the visual area that may contain the approaching vehicle and hover their foot on the brake pedal to prepare for decelerating the vehicle in the event that the vehicle creates a conflict with the driver. Thus, future research should collect eye movements as well as preparatory responses in near-miss scenarios to explicate their mental model of the environment.
Third, the survey data imply that these results are not due to compromised trust in the automated and connected vehicle technologies. The drivers’ trust levels did not change before and after their exposure to the simulation using two measures of trust in automation (Chancey et al., 2017; Jian et al., 2000). It is in fact surprising that their trust levels did not evolve or degrade after multiple exposure to the near-miss scenarios. In fact, the drivers had numerous opportunities to perceive behaviors of automation to estimate its reliability. Trust in automated and connected vehicle technologies in near-miss scenarios may be more robust than those reported in the literature (Abe et al., 2018; Körber et al., 2018; Kraus et al., 2020; Manchon et al., 2022).
Several limitations exist in this study. First, as with other driving simulator research, external validity of the current finding should be tested in an on-road study with various cohorts of drivers. Second, although the experimenter who drove in the RDS-100 was highly experienced, driving performance variability is unavoidable unless the vehicle behavior is preprogrammed. Yoking behaviors of the paired vehicle could systematically induce near-miss scenarios across drivers but reduce intricacy of multivehicle conflicts such as social interactions (e.g., Lee & Momen, 2021). Future research should balance these tradeoffs to examine performance of drivers in automated and connected vehicles. Third, additional dependent measures such as a time to collision (TTC) and response time to an onset of imminent hazard could further clarify interactions of drivers of automated and connected vehicles, which were not available in the current study due to the complexity stemming from interactions between two human drivers during a conflict.
In conclusion, drivers’ expectations of ADS may impede their ability to effectively respond to near-miss events following the vehicle control takeover. The vehicle data revealed that connected vehicle technology may not be effective in guiding their vehicle in some near-miss scenario such as the running stop signal scenario. Drivers’ trust toward automated and connected vehicle technologies did not degrade even following multiple exposure to the near-miss scenario, implying a possibility that trust in vehicle automation and connected vehicle technology may be more robust in near-miss scenarios than other scenarios frequently reported in the literature. Future research may focus on interactive effects of automated and connected driving technologies on drivers’ ability to safely navigate near-miss scenarios and anticipate hazards on the road. In practice, designers of automated and connected vehicle technologies may consider different timing and types of cues to inform the drivers of imminent hazard in specific high-risk scenarios for near-miss events.
Key Points
Distributed driving simulation enables researchers to investigate multivehicle accidents in a controlled experiment. Forty-eight licensed drivers were randomly assigned to active or passive automation driving groups and navigated eight simulated scenarios. Half the scenarios included obstructions blocking the view of a conflicting vehicle. Participants in the passive driving automation group displayed more variable and greater deceleration rates than drivers in the active driving automation group in the near-miss scenarios despite the presence of reliable warning. Drivers only passively driving automation may still show degraded post take-over performance in some near-miss scenarios even though connected vehicle technology may provide precollision information. Future research may focus on interactive effects of automated and connected vehicle technologies on driver performance.
Footnotes
Acknowledgments
This study is based upon work supported by the National Science Foundation under Grant No. 1949760 (PI: Yamani) and by Batten College of Engineering and Technology at Old Dominion University under Multidisciplinary Research Seed Grant (PI: Xie).
Author Biographies
Yusuke Yamani is an Associate Professor in the Department of Psychology and the Department of Civil and Environmental Engineering and directs Applied Cognitive Performance Laboratory at Old Dominion University. He received his PhD in psychology (visual cognition and human performance) from the University of Illinois at Urbana-Champaign in 2013.
Jeffrey Glassman is a PhD student in the Department of Psychology at Old Dominion University. He received his BA in psychology from the University of Connecticut in 2021.
Abdalziz Alruwaili is a PhD student in the Department of Civil and Environmental Engineering at Old Dominion University. He earned his MS in civil engineering in 2018.
Sarah E. Yahoodik is an Engineering Psychologist at Volpe National Transportation Systems Center. She earned her PhD in psychology (Human Factors) at Old Dominion University in 2023.
Emily Davis is an undergraduate student in the Department of Psychology at University of Virginia. She was an REU student at Old Dominion University in 2022.
Samantha Lugo is an undergraduate student in the Department of Psychology at University of Texas at San Antonio. She was an REU student at Old Dominion University in 2022.
Kun Xie is an Assistant Professor in the Department of Civil and Environmental Engineering and the director of the Transportation Informatics Lab at Old Dominion University. He holds a PhD in transportation planning and engineering from New York University.
Sherif Ishak is a Professor and an Associate Dean for Research and Innovation in the Batten College of Engineering & Technology at Old Dominion University. He received a PhD in civil engineering from the University of Central Florida in 1998.