




Abstract
The influenza pandemic of 1918–19 wreaked havoc all over the world, and Bihar, where more than a million people died, was no exception. The pandemic became more lethal in Bihar relative to what we know of other states in eastern India. Why did rural mortality surpass urban mortality? How did the pandemic worsen the socio-economic crisis in the years that followed? This study examines the socio-economic context of the pandemic in Bihar at a micro-level and investigates how the pandemic became unbearable for the people due to a severe economic crisis that resulted from the war and failed monsoons, among other factors. It seeks to explain the manner in which factors such as agricultural failure, inflation, high population density and poor health infrastructure resulted in higher rural mortality. It also shows how the loss of the younger generation and forced migration during the pandemic resulted in a lower rate of birth in the years following the pandemic, resulting in a loss of the labour force and worsening of the agrarian crisis.
Introduction
The influenza pandemic of 1918 was the most destructive in recorded history in terms of its intensity, reach and impact. World War I had just ended, and the world was in earnest hope of peace when the influenza virus invaded the entire globe. While it is still difficult to give exact figures of lives lost, if all kinds of data and studies are taken into consideration, then it would be safe to say that no less than 40 million people across the world died because of this disease. India was badly affected by the pandemic that ravaged the subcontinent; more than 20 million people died. This figure is higher than the total casualties caused by the war, during which there were an estimated 10 million battle casualties and less than 20 million total casualties. 1 At the pan-Indian level, death rates had steadily been rising since the 1870s and had begun to fall after 1908, but the influenza pandemic of 1918 caused a one-time massive spike in mortality. 2 In India, there was uniformity as far as the infection by the disease was concerned, but there was certainly a regional variation in terms of mortality. Bihar lay between the province that suffered the most, the Central Province and that which suffered the least, Bengal, and in comparison with other provinces, it escaped relatively lightly. Nevertheless, no other pandemic left so deep a mark on the population of the provinces. 3 All districts suffered, but the most affected ones were Shahabad, Gaya, Palamu, Ranchi and Hazaribagh. The combined impact of the outbreak of the pandemic, the deteriorating agricultural economy and rising inflation against the backdrop of the war resulted in enormous suffering for the people of Bihar. 1918 marked the worst year in the recorded economic history of India since 1900, with a negative, real growth rate of 10% and inflation surging to 30%, suggesting a massive supply-side shock to the country. 4
Innumerable people lost their lives on account of endemics and pandemics, which had widespread socio-economic consequences, yet the pandemics and their concomitant socio-economic effects initially went unnoticed by historians, who did not consider pandemics and their consequences as important factors for change. Historians have only recently begun to take pandemics and their effects into account, particularly while studying subjects like medicine and public health in colonial India. David Arnold has analysed the introduction and spread of western medicine in colonial India and the role of the state in dealing with epidemics such as cholera, smallpox and the plague. 5 Ira Klein also attempted to analyse the deaths due to pandemics in the nineteenth and twentieth centuries in India and concluded that modern economic conditions, especially poverty and population pressure were the causes of widespread epidemic outbreaks and rapid mortality. 6 Chinmay Tumbe studied the demographic disasters resulting from pandemics such as cholera, plague and influenza in the nineteenth and twentieth centuries and emphasised that this period was not only known for industrialisation, colonialism, imperialism and global wars but also for devastating diseases, pandemics and innumerable lives lost. 7 Similarly, Christopher Hamlin undertook extensive work on cholera in its different contexts. He underlined the role of the state in influencing the understanding and perception of the lay public and health professionals towards this disease. 8 Alok Sheel has studied the plague epidemic in a global context and focused on its source, spread and impact in South Bihar. 9 Aditya Sarkar dealt with the outbreak of the bubonic plague in 1896 in Bombay city and elaborated on its effects on the city’s cotton mills and the resultant changes in the relationships between employers and workers. 10
The great influenza pandemic of 1918 has also received attention from historians, particularly in its global context, wherein they have estimated the total number of deaths using various methods. Using the method of aggregation of country estimates, Jordan, in 1927, estimated global influenza mortality to be over 21.5 million. 11 Johnson and Mueller also used the method of aggregation of the country estimate in their study, which estimated total global deaths to be between 32 and 42 million. 12 However, the issue of the validity of country estimates used in these studies cannot be denied, making it difficult to settle on exact figures. A few scholars attempted to focus on the spread and impact of the pandemic, such as Alfred Crosby and Susan Kinsley Kent. 13
There are several scholars who have studied the influenza pandemic of 1918–19 in detail in the Indian context as well. In his pioneering work, David Kingsley used an average decadal population growth rate of 8% for the decades 1901–10 and 1921–31 and calculated an 18.5 million shortfall, which he attributed to the influenza pandemic. 14 This figure was contested by Mills, who questioned the assumption of an 8% decadal growth prior to the pandemic in favour of a 6.8% population growth rate up to 1917, on the basis of which he estimated that there were 10 million influenza-related deaths in the Indian subcontinent in 1918–19. 15 Hill gave a figure of 13.3 million influenza deaths in British India using the excess mortality method and 17.8 million deaths in the Indian subcontinent using the intercensal method. 16 Chandra et al. made a significant contribution in this regard by using a random coefficients panel model based on data from six censuses for 199 British India districts and estimated influenza mortality of 15.51 million when using data from 1901–41 and 13.88 million when using data from 1891–1941. 17 One limitation of this study is that it excludes India’s princely states, some of which were likely to be severely affected by the pandemic. Chinmay Tumbe has shown that if Chandra’s figures were extrapolated for all of India, including the princely states, the figures would be between 18.46 and 20.63 million. 18 Thus, there is a considerable variation in death figures due to scholars using different methods, but the excessive mortality in India due to the pandemic of 1918 cannot be denied.
More important than determining an accurate number of mortalities is comprehending the context in which the pandemic took its devastating form, as well as the socio-economic aspects of its impact on various regions of the country. However, only a few scholars have attempted to address the influenza pandemic in the context of specific regions or social classes. David Hardiman has studied the impact of the influenza pandemic, especially on the tribals living in the western region of India. 19 In this context, he has discussed the general health of the Adivasis, their access to medical facilities and the policies of the colonial government to combat and treat the disease. David Arnold pointed out the need to understand the influenza episode and its impact in India in terms of local conditions. 20 Nevertheless, the widespread prevalence and huge socio-economic impact of the influenza pandemic of 1918, during which hardly any region or social group in India remained unaffected, remain to be studied. Micro-level studies are required for a better understanding of the extent and impact of this pandemic in India. So far, the devastating impact of the influenza pandemic has been overshadowed by other issues, such as military recruitment and war conditions. Even in the government documents, the pandemic has found little attention in comparison to political unrest and economic discontent.
Bihar also came under the grip of this terrible pandemic, in which all the regions—North Bihar, South Bihar and the Chotanagpur Plateau—were affected and a large number of people lost their lives. Even more important was the socio-economic context in which this pandemic occurred and which contributed to making it extremely deleterious. The plummeting agricultural output, roaring inflation, supply crisis and other economic factors aggravated and compounded the crisis, while at the same time the lack of health and sanitary facilities, lack of organised efforts and awareness, population pressure and conditions of poverty weakened the ability of the people to fight this pandemic. There are many reports and documents related to the spread of the pandemic and its impact in Bihar, such as the Sanitary Commissioner’s Report, Census Report and the Provincial Administration Report, on the basis of which this article discusses and analyses the spread of the influenza pandemic and its impact in Bihar. 21
In March 1918, the first outbreak of a flu-like illness was discovered in the United States when over 100 soldiers at Camp Furston in Fort Riley became ill. The first mention of influenza appeared in a weekly public health report issued on 5 April, which confirmed 18 severe cases and 3 deaths in Haskell, Kansas. 22 It then quickly spread to Europe through American troops travelling on ships to the western front, who marched through the continent en route to Asia and Africa. It is reported that this disease first became an epidemic in Spain in April–May of 1918. Hardly a town or city in Spain escaped its wrath. Even King Alfonso fell victim to this disease. 23 Very soon, this human calamity reached countries such as France, Germany and England. According to a newspaper report, schools were closed and mines and factories were shut down, and soon it took the form of a global pandemic. 24 India came under its grip without much delay. The first sign of this disease was clinically diagnosed in Bombay city during the first week of June 1918 among the police. 25 Such cases proved to be the starting point of the pandemic in India, and in the middle of June, sporadic cases were reported from cities like Calcutta and Madras. It is assumed that this disease reached India through ships that arrived in Bombay towards the end of May. A few cases of the disease were found after the arrival of the first ship in May. The symptoms were first noticed some hours after the ship’s arrival. On 15 June, another ship arrived, on which several cases of influenza had occurred during the voyage. However, the government reports pointed out that this disease was already present in India before the arrival of the ships from abroad, and it had been clinically diagnosed among the British troops in Bombay since 1917. 26 Therefore, it is difficult to ascertain whether this disease was imported from outside or had its origin in India. The symptoms of influenza might have previously been present in India in a mild form, and the infected passengers travelling on ships from outside may have contributed to the dissemination of the infection throughout India. In the earliest stages of the outbreak in India, the disease was not so dangerous, and the case mortality rate was almost insignificant. But soon it took a gruesome and dangerous form during the second wave, which started in September of that year. The death rate, which fell and reached its minimum of 29.95 per thousand, soon reached its maximum of 193.69 per thousand in November, during the second wave of the pandemic. 27 Fatal complications chiefly affecting the lungs and respiratory tract became very prevalent. No section of the population remained unaffected, and both the towns and villages suffered simultaneously.
Spread of the influenza pandemic in Bihar, 1918
In Bihar, influenza was first noticed in July 1918. According to the report of the Sanitary Commissioner of Bihar and Orissa, the disease first appeared in a mild form early in July and abated temporarily after 3 or 4 weeks. 28 The second wave of the pandemic started in September and reached its maximum degree of severity in October and November. It appeared first in the towns and soon thereafter gripped the rural areas, which suffered more than the urban areas; the urban mortality rate was only 5.8 per mille as compared with the rural mortality rate of 10.6 per mille. 29 The year had started with a high death rate in January, caused by the prevalence of the plague, cholera and fever, but the rate of mortality fell in February and March. The death rate fell again in August but started climbing with the start of the second wave of influenza in September. Almost all the regions of Bihar were affected by this epidemic, besides a few, like the district of Purnea and the region of Santhal pargana, a part of the Bhagalpur division. Overall, the whole of Bihar had to bear the brunt of this global pandemic, which is attested by the fact that mortality directly or indirectly due to influenza in the provinces of Bihar and Orissa is assumed to be 1,381,835, and the death rate was 40.0 per thousand population, which was higher than the death rate in Bengal (30.4 per thousand) and Assam (26.25 per thousand). 30 Compared with subsequent years, the death rate due to influenza and fever in 1918 in Bihar was very high, as shown in Table 1.
Average number of deaths due to fever and/or influenza.
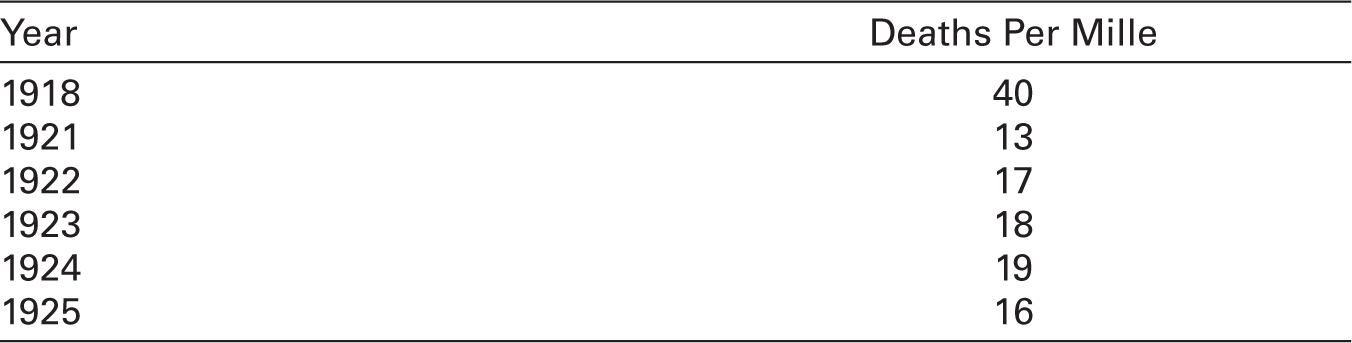
It is necessary to mention here that this figure is based on data collected by the government agency, whose methods were not so advanced and efficient at that time. It was mainly dependent on the information gathered by village chowkidars, who reported to the concerned police station. Moreover, due to the pandemic situation, many cases may have gone unreported and unnoticed, particularly in the villages. Therefore, the exact figures for deaths and therefore calculations of death rates were most likely higher than the given figure.
Southern Bihar and the Chotanagpur region suffered more in comparison to other parts of the province. In southern Bihar, the district of Shahabad was affected the most. The district had already been suffering from different epidemics of plague, cholera and fever, which had caused more than 100,000 deaths in the previous decade. 31 The outbreak of cholera in 1918 came as a heavy blow to the people, and fever, which includes influenza, caused 103,000 deaths, with the death rate being 80.9 per mille that year. 32 The second phase of the pandemic proved to be fatal, and deaths were caused mainly by lung complications in the form of pneumonia. 33 In southern Bihar, the district of Gaya was next to follow Shahabad in terms of casualties. In August 1917, there was a severe flood in this district that was equally disastrous to human life as it was to the crops. It was followed by an outbreak of cholera, which caused heavy mortality in Pakriborwan and Tikari thanas. 34 The worst happened when the district had to face another disaster in the form of influenza in 1918. The number of deaths from fever in Gaya was greater than in other parts, with a death rate of 73.3 per mille, second only to Shahabad. 35 For the first time in a decade, the number of deaths exceeded the number of births by around 65,000. Gaya mufassil, Tikari and Wazirganj thanas in the district registered the heaviest losses. 36 Nawada and Pakriborwan thanas also suffered badly due to the combined effects of cholera and influenza in 1918 and registered population losses of 2.54% and 8.9% respectively. 37 In the district of Patna, violent outbreaks of cholera were common in the aftermath of the floods, which occurred frequently. In the previous decades, cholera had inflicted a lot of devastation in this district, causing 100,000 deaths since 1900. 38 Against this backdrop, the district of Patna saw an unprecedented disaster in the form of the influenza pandemic in 1918, and that year the death rate rose to 63.0 per mille and the number of deaths over births was 41,000. 39 The district also faced a heavy flood in August 1918.
In the region of the Chotanagpur plateau, the district of Palamu suffered as severely as the neighbouring districts of Shahabad, Gaya and Hazaribagh. The disease followed the same pattern as in other parts; the first wave was rather mild and subsided in August. The second wave, which started in September was by far the worst outbreak, and the death rate from fever alone reached 59.2 per mille, which was just behind the districts of Shahabad and Gaya. In this district, the areas that suffered the most were Bhandari (99.1 per mille), Mahuadanr (87.1 per mille) and Ranka (83.9 per mille). 37 Mahuadanr was simultaneously attacked by influenza and malaria. 38 In the Hazaribagh district, a series of cholera epidemics began in 1917 that lasted for 3 years. At the same time, the district was attacked by the influenza pandemic in 1918 and registered 68,000 deaths from fever alone. The total number of deaths in the year in Hazaribagh was 82,000 and the death rate was 63.4 per mille. 40 The loss was greatest in the Sadar subdivision. The Ramgarh and Hazaribagh thanas lost 11.93% and 8.35% of their total population, respectively. 41 Similarly, in the district of Ranchi, the total number of deaths in 1918 was 82,000, which was 30,000 above the number of births. Out of the total deaths, 72,000 occured from fever alone. In Ranchi, the death rate from all causes was registered at 59.3 per mille. 42 In Singhbhum and Manbhum, the disaster was not as severe as in Palamu, yet these districts too could not escape this pandemic. In Singhbhum, the influenza pandemic raised the death rate from 19.8 per mille in 1917 to 48.6 per mille in 1918. 43 In the district of Manbhum, there had been an epidemic of cholera in 1913, and further epidemics of this disease occurred every year until 1919. The influenza pandemic of 1918 affected this district as well, and in this year the death rate was registered at 42.2 per mille with the total number of deaths being 66,000 from all causes, which was 20,000 more than the total births. 44
In northern Bihar, the district that was affected the most was Muzaffarpur, which had already been suffering from cholera. 1917 was a year of prolonged and excessive rains, resulting in the outbreak of cholera and fever, which was especially severe in Paru thana. 45 In 1918, the most violent outbreak of cholera began in March and continued till August. Amid the cholera epidemic, the district was hit by the outbreak of the influenza pandemic. The total number of deaths recorded from fever alone that year was 120,000, which raised the death rate to 60.87 per mille. 46 The worst havoc was seen in the south of the district in Lalgang, where the highest municipal death rates were recorded at 91.3 per mille. 47 The district of Saran, where an outbreak of cholera in 1914 claimed over 20,000 lives, also witnessed the havoc of influenza in 1918. In August, influenza visited the district and raised the number of deaths from fever to 69,000. The number of total deaths from all causes was 142,000, which was 43,000 over the number of total births. 48 The neighbouring district of Champaran also had to face the crisis, and by the end of the year, 97,000 persons or 57.2 per mille had perished from all causes, of which fever contributed the most. 49 The Bagha thana in the district was the most affected, with over a thousand deaths by the end of the year. Influenza proved especially fatal to the Tharu tribe, who had been residing along the foothills in the northern part of this thana. 50 Other thanas badly affected were Kesariya, Motihari and Adapur. In the district of Darbhanga, floods occurred in 1915, which led to outbreaks of cholera and malaria. In March 1917, cholera broke out and continued in epidemic form until August, causing no less than 57,000 deaths. To this was added the outbreak of the influenza pandemic, which raised the number of deaths from fever this year to 109,000. The total number of deaths in 1917 was 188,000 or 64.2 per mille, which was 85,000 in excess of the number of births. 51
The influenza pandemic caused devastation in the Bhagalpur division as well. The district had recently seen a severe outbreak of cholera, which was most disastrous in the Supaul and Madhepura subdivisions. The same region was again attacked by cholera in 1916, which continued to take a heavy toll in this district until 1919. The distress of the people here was increased by the pandemic of influenza, which raised the death rate to 52.2 per mille in 1918. 52 The greatest loss was registered in the southern region of the district, in the Banka subdivision. The district of Munger was already attacked by epidemics like the plague and cholera in 1917, which brought the death rate up to 41.6 per mille against an average of 31.8 per mille for the previous 5 years. The outbreak of the influenza pandemic in 1918 caused a heavy increase in the previous year’s figure for the district, where the total number of deaths in 1918 was 131,000, of which influenza contributed 98,000. 53 The deaths were 50,000 more than the births. The district of Purnea and the region of the Santhal pargana of the Bhagalpur division were less impacted by the pandemic as compared to the other regions, yet many more deaths were registered here due to influenza than before. The towns of Kisanganj and Katihar recorded the lowest death rates in the province at 17.9 and 18.9 per mille, respectively. In Purnea, a total of 60,000 people died from various causes, of which the most deaths occurred due to influenza. 54 Similarly, in the Santhal pargana, the total number of deaths in 1918 from all causes was 67,000, out of which 60,000 people died from fever alone. 55 A severe outbreak of cholera in 1916 had already caused over 3,000 deaths. 56
The records of the jails also reveal the devastating impact of the influenza pandemic on those incarcerated, which caused an admission rate of 259.6 per mille in 1918, against 2.3 per mille in 1917, and a decennial mean of 2.2 per mille. 57 The mortality rate in the jails of this province was the highest in the country. 58 The death rate was 65.97 per mille as compared with 34.49 per mille in 1917 and 26.71 per mille as the mean. 59 Apart from other diseases, it was influenza that caused the most severe loss. Except for Hazaribagh Central Jail, all the central jails record high rates of death: Gaya (73.37 per mille), Bhagalpur (56.60 per mille) and Buxar (53.32 per mille). 60 The Hazaribagh Central Jail records the death rate being only 23.20 per mille, which is difficult to explain given the remarks made by the Inspector-General that the jails of Chotanagpur suffered severely from influenza. 61
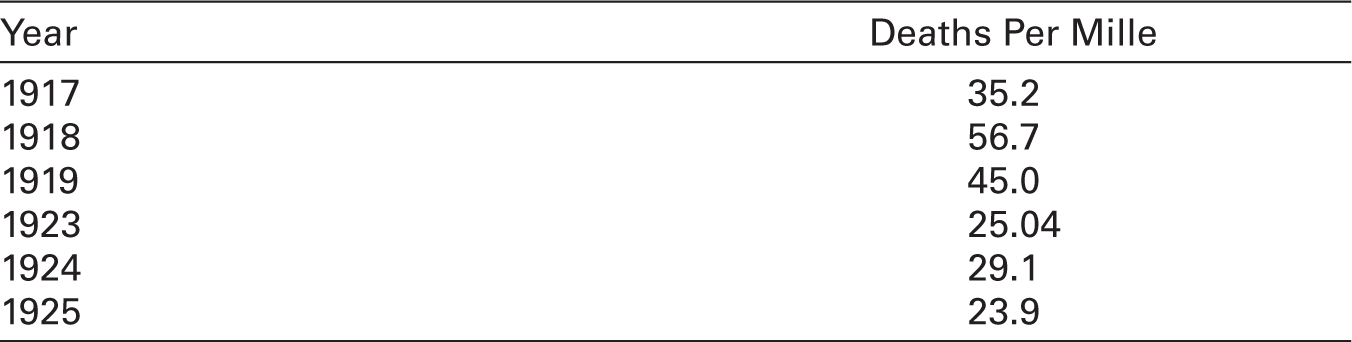
Thus, the widespread influenza pandemic was responsible for more than 600,000 deaths within the last 3 months of 1918 and increased the death rate from 35.2 per mille to 56.7 per mille in the province of Bihar. 62 The death rate in 1918 is compared with the death rates in the previous and subsequent years in Table 2.
The increased death rate in 1918 shown in Table 2 is largely due to the influenza pandemic, which may be further seen in Table 3, which shows the percentage of influenza- and fever-caused deaths to total deaths of that year.
Death rate in Bihar.
Number of deaths due to influenza and/or fever in 1918.

The socio-economic context, and impact of the influenza pandemic in Bihar
It is neither proper nor sufficient to understand the extent and impact of the pandemic simply in the context of the arithmetical figures of deaths throughout the province. To understand its true form and the depth of destruction it caused, it would be proper to investigate the socio-economic conditions under which this pandemic visited the province. The influenza outbreak happened at a time when the war conditions started showing their worst and most serious impact on the everyday lives of the people in the province, as in other regions of the country. Due to the lack of shipping, there was a serious crisis in the movement of goods, resulting in difficulty in marketing peasants’ products and procuring other necessary items. The situation of the farmers became more complicated when the price of the goods to be sold by them fell due to demand shock and the price of the goods to be purchased by them increased due to supply shock. Everything the farmers would sell, such as food grains and oilseeds, had fallen or at least not risen in price, while everything they had to purchase, including clothes, salt and kerosene, had become extremely expensive. 63 Therefore, even the surplus production of the cultivators could not fetch them the necessary cash to procure different necessary items, let alone pay rent to the landlords. But as the year 1918 advanced, the crisis of surplus faced by the cultivators due to the non-selling of their products turned into a crisis of shortage due to deficiency in production consequent upon the failing monsoon. Now the problem for the farmers was not how to sell their produce but how to maintain their stock. This crisis arose due to the failure of the monsoon throughout the country. 64 The monsoon rains started earlier than usual that year but were very scanty over nearly the whole country. The retreating monsoon period from October to December was also dry. Bihar and Orissa received only 9% of their normal amount of rainfall. 65 The adverse monsoon affected the area and yield of the main crops, particularly the winter rice. For rice, the season was not favourable, especially in Bihar and Orissa. 66 In five out of the previous 10 years, the exports of rice from the province had exceeded imports, but when the rains and therefore the crops failed in 1918, rice had to be imported. 67 The failure of winter rains also affected the production of wheat. Agricultural production was affected by reasons besides the failed monsoon as well, such as the rabi crops in the Mokamah Tal in Patna district being destroyed by insects and pests. 68 Consequently, the total output was reduced so much that by the end of the year, the province had to manage with only two-thirds of its normal produce. 69 It was not only the province of Bihar that suffered due to the failure of crops; the whole country was also facing this crisis, and that was a period of world-wide shortage of foodstuffs. The profundity of the crisis may be understood by the fact that an urgent need was felt to control the inter-provincial movements of rice, wheat and gram. A special food-stuffs commissioner was appointed by the Government of India, and a ‘whole-time’ director of civil supplies was appointed for the province. 70
In this situation, the rise in the price of agricultural products reached its maximum. Retail prices of rice in the province of Bihar saw a sharp rise at six seers to a rupee in January 1919 and five seers to a rupee in September 1919. 71 During the early years of the decade, there had been a general upward trend in the price of rice. In 1917–18, there was a marked fall, settling at 12 seers to a rupee in the Chotanagpur Plateau in January 1918. At this time, due to the difficulty of transport in India—as only about 20% of the rolling stock was available for ordinary traffic—rice could not be exported and had to be held up, with the result that its prices fell. However, the failure of monsoon soon reversed the situation, leading to a deficiency in production that led to a rise in the price of rice in the province. The price of other agricultural commodities also rose; the average price of maize in Bihar was over 20 seers to a rupee in the early years of this decade, but it rose to 8 seers to a rupee in January 1919 and about 6 seers to a rupee in July of that year. 72 Even the price of marua, a food consumed by the poorer class in northern Bihar, rose to 5.5 seers to a rupee in July 1919. 73 The price of wheat also increased in 1919, double of what it was in 1911. 74
Apart from agricultural products, the prices of non-agricultural products also rose, adding to the agony of the people. As pointed out, the people of Bihar were mostly dependent on the supply of these items from outside, which was obstructed by the war conditions. In 1914, 20 seers of salt could be procured for a rupee, but at the start of 1918, only 8 seers of salt could be purchased for a rupee. 75 The restriction on the import of Liverpool salt due to the war led the people to depend on internal resources that were not sufficient. The shortage of salt, combined with gambling and hoarding, distorted its price. Similarly, owing to the difficulty in overseas transportation, the supply of kerosene was also affected, and its price rose from 2 to 3 rupees a tin. 76 It is probable that in local markets the oil was being sold in small quantities at far higher prices. Apart from the supply shock, hoarding and profiteering also played a role in the rise of prices. The poorer class had to pay more even for clothes; in comparison to 1911, they had to pay three times as much for their dhotis and saris in 1918–19. 77 The price rose to such an extent that the local government had to take action. It purchased 16 million yards of cloth, which was subsequently sold at controlled prices to the public. 78 Despite this step taken by the government, the prices remained exorbitant throughout the year and started declining only after January 1920. The pandemic had broken out in November 1918, when the cold season started, and the people were struggling even for sufficient clothing. Thus, the common people were indisposed to water pneumonia.
The pandemic of influenza exploded in such a difficult situation when people, especially the poor, had been facing existential crises due to different reasons. The population pressure and the lack of medical facilities made their conditions even more miserable. It is known that at the time of the pandemic then, the provinces of Bihar and Orissa held the third position in the country, behind Bengal and the United Provinces, in terms of population density. It is important to mention that if the Chotanagpur Plateau, which covers half of the total area of the province but has only one-third of the total population of the province, is excluded, the density in other regions of the province comes to 567 persons per square mile, which is higher than the density of the United Provinces and nearly equal to that of Bengal. 79 See Table 4 for the mean population density in various districts of Bihar in 1921.
Mean density of population per square mile in 1921 in Bihar.

Heavy population density was an important factor in rural overcrowding that kept peasants’ earnings low because of the increasing ratio of men to land. Many districts had over 500 inhabitants per square mile, which was excessive in the opinion of the census officials. 80 The falling agricultural income of the rural population made them poorer and more helpless, which adversely affected the pandemic mortality. It is likely that, whereas poverty and roaring inflation reduced the inner strength and self-confidence of the common people to fight the pandemic, the lack of health facilities made them more helpless and flustered. The province had a vast population that had very limited health-facilities, and those that were available were scattered. Table 5 displays the data regarding health institutions in Bihar from 1917 to 1919.
Number of health institutions in the province of Bihar and Orissa (1917–19).

Thus, during the 3 years from 1917 to 1919, there was a net increase of only eight health institutions in the province. The only institution of some significance was the Patna General Hospital, which had previously been a locally funded institution and had been brought under the provincial administration in 1918. 81 The villages were still far removed from basic health facilities and other kinds of government aid.
The influenza pandemic therefore occurred in Bihar at a time when people were going through a severe economic crisis. The shortage of food, rising prices of essential commodities and lack of health facilities combined to produce devastating results. A large portion of the population was malnourished, and the scientific calorie diet was unknown to common people. Indeed, the pandemic spread simultaneously and equally throughout the world: from grain-deficient areas to grain-surplus areas, from war zones to places far away from war, from areas lacking health facilities to areas with proper facilities and areas with different types of geographical features. Therefore, the spread of the disease cannot be explained based solely on poverty or other socio- economic factors. Nevertheless, it cannot be denied that these reasons made the effects of the pandemic more brutal and contributed decisively to increasing the number of mortalities. Table 6 presents the comparison of district-wise death rates for the decades 1911–20 and 1921–30. 82
Number % of deaths of the population in 1911–21 and 1921–31 82 .
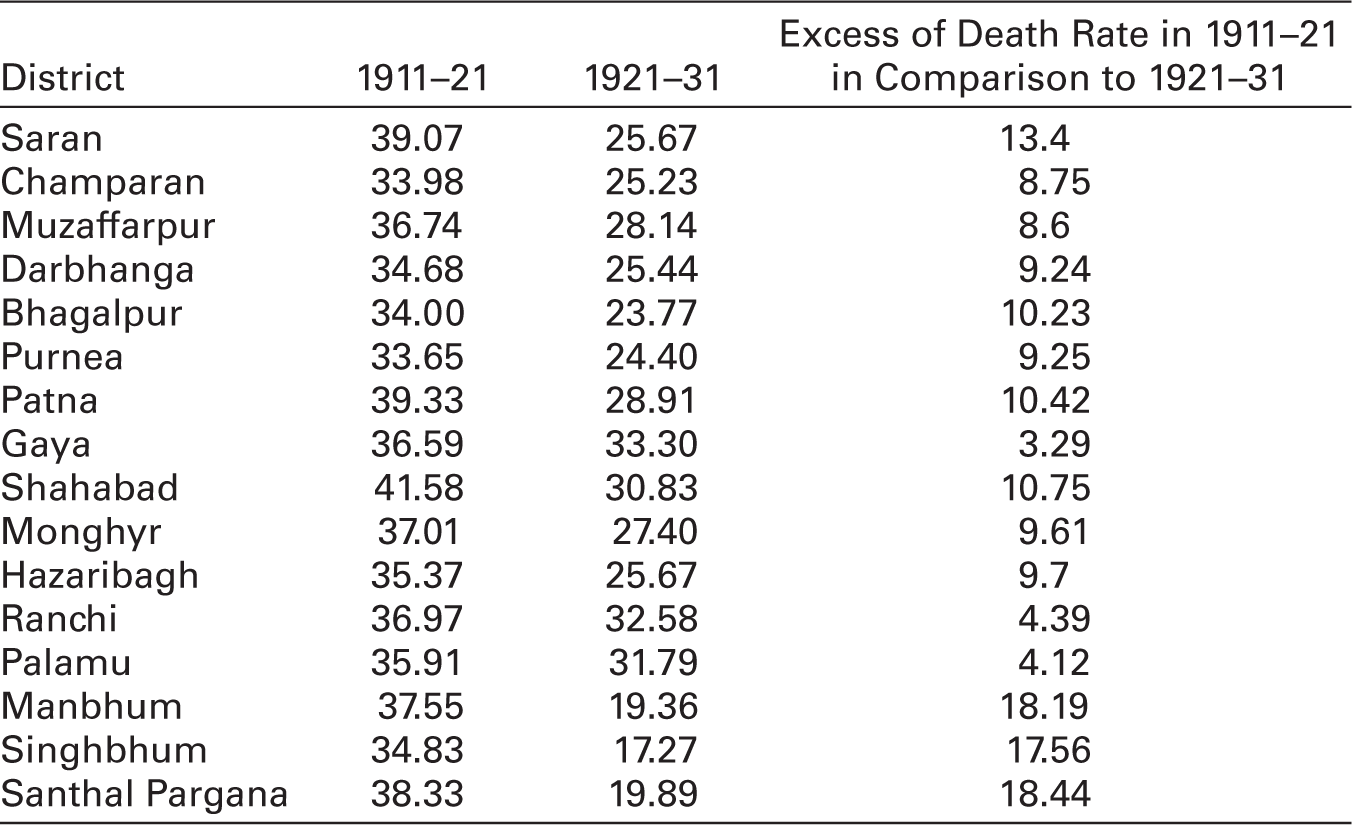
Table 6 clearly shows that the death rate in each district during the decade 1911–21 was significantly higher than during 1921–31. It is worth noting that other diseases like smallpox and cholera appeared from time to time in each district in both decades. As a result, if their effect is assumed to be constant, the increased death rate in 1911–21 can only be explained as being a result of the influenza pandemic. The influenza pandemic also had an adverse impact on population growth in the decade 1911–20, which may be observed in Table 7.
Total population between 1872 and 1951, and the mean growth-rate for each decade.
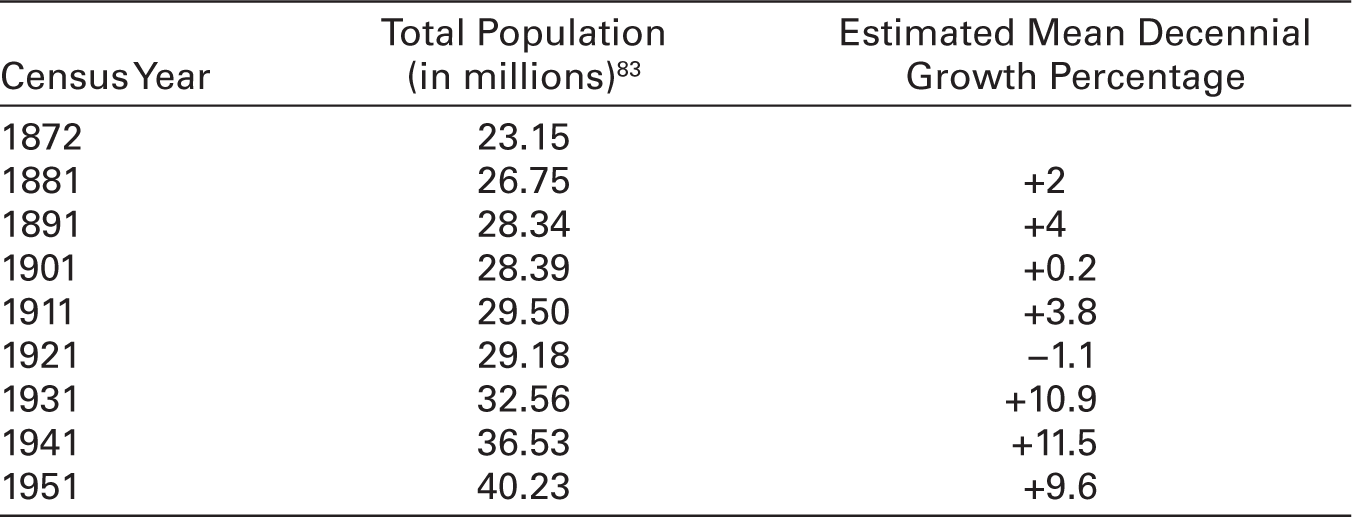
With the exception of 1911–21, every decade witnessed a varying degree of growth in the total population of the province. When the census of 1921 was taken, the total population of the province was found to be 1.2% lower than what it had been 10 years before. However, it is worth noting that the population grew at a positive rate for the first 7 years of this decade, and it is possible that if a census had been taken in March 1918, it would have revealed an increase from the population of 1911. The 1921 census, in contrast, showed a significant decrease in population. In this regard, the district-wise population growth rate in the censuses of 1911, 1921 and 1931 may also be compared, as presented in Table 8.
District-wise percentage of variation in population over previous decades.
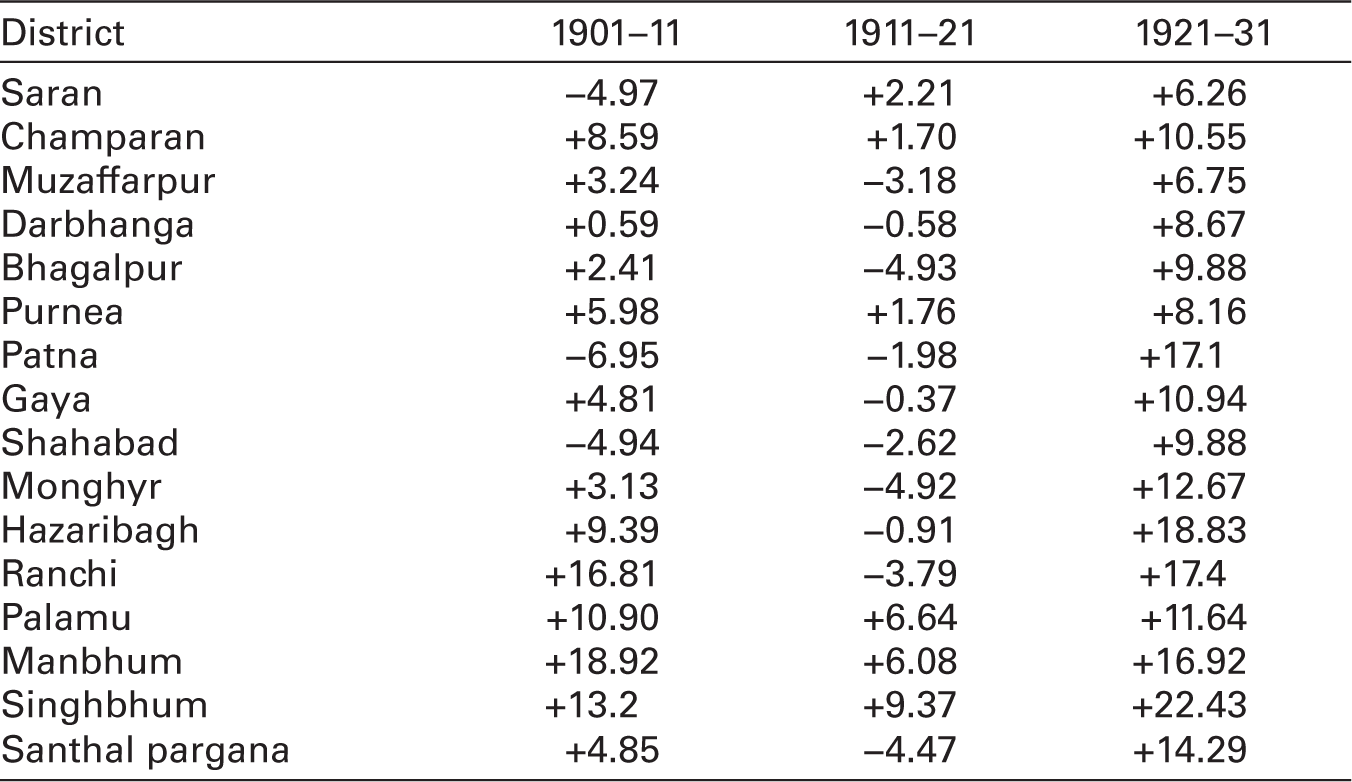
The table shows that with the exception of Saran, Patna and Shahabad, every district experienced positive growth in the decade 1901–10, and the growth rate remained positive for every district in the decade 1921–30. However, in the decade 1911–20, the growth rate remained negative in 10 out of 16 districts. Positive growth rates were recorded in the industrially advanced districts of the Chotanagpur Plateau, which not only attracted immigration but also arrested emigration. The decrease in the growth rate in the decade 1911–20, compared to that in 1901–10 and 1921–30, may be explained only in terms of the devastating impact of the influenza pandemic of 1918–19 on the population.
Therefore, the pandemic and the anomalous economic situation together affected all areas of the state and all sections of society, but the rural areas and the poorer sections of society were affected the most and the worst. It is noteworthy that the population of the province was predominantly rural, as seen in Table 9.
The proportion of the population per mille in urban and rural areas in Bihar.
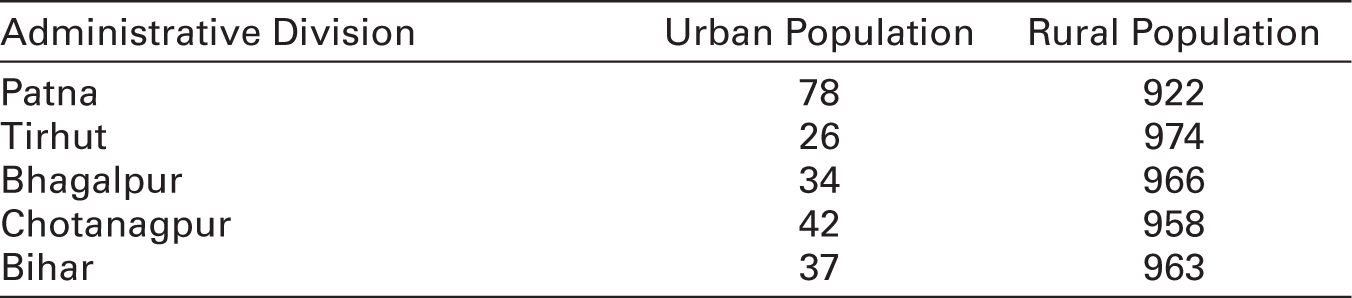
The proportion of the urban population in Bihar (37 per mille) was very low compared to other states such as Bengal (67 per mille), Central Province (90 per mille), United Provinces (106 per mille) and Madras (124 per mille). 84 The rural population was already in distress due to failed monsoons and increasing prices. Heavy population density, sanitary disadvantages, lack of communal efforts and the lack of cooperative organisation made them helpless to fight the pandemic. The villagers found themselves in a state of complete disorganisation. It was becoming difficult to even plan out how to burn or bury the dead, let alone nurse the living back to good health. Whatever health facilities there were, they also collapsed as the medical staff themselves were infected with the disease in many places. 85 As a result, in 1918, the loss was severe in the rural areas, which registered a death rate greater than the urban areas. In Bihar, in the municipalities and towns, the death rate was 44.8 per mille, while in districts excluding towns, it was 57.1 per mille. It was much higher in comparison to the records of 35.2 per mille for the urban areas and 34.2 per mille for the rural areas in the previous year. 86 It was also much higher than the mean death rate during the previous 5 years, which was 29.9 per mille for the urban areas and 31.5 per mille for the rural areas. 87 The excess death rate in comparison to the mean death rate of the previous 5 years for rural areas was about 26 per mille and for urban areas, about 14 per mille. 88
The higher death rate in the rural areas reflects the fact that the poorer sections of the population living in the villages were affected the most. Influenza proved to be more fatal to them because they could not even rest and stay quietly in their homes with someone to look after them, let alone access proper medicine and treatment. They were even forced to migrate in search of work. The disease also caused high mortality in the age group of 20–40 years, because this age group forms the actual working force. The estimated number of deaths of people between the ages 20–40 was 463,157, which was 278,074 in excess of the mean and constituted 23% of the total deaths in the province in 1918. 89 It was not just a question of more people in this age group dying. The reduction of the number of people in this age group was to have more severe socio-economic implications as it meant a reduction in the workforce. Labour-intensive regions like Bihar could hardly afford this loss. The high mortality rate in this age group also meant a decrease in the number of people earning within a family. The breadwinners perished, and their dependents were left with nothing.
The demographic implications were also significant, as they had a very negative impact on the future population structure. The infant mortality rate for Bihar and Orissa was 23.1 in 1918 and 21.5 in 1919, calculated as the percentage of deaths under 1 year of age to registered births. 90 The birth rate also fell considerably during this period. The birth rate of the population of Bihar and Orissa was 37.5 per mille in 1918, which was less than the mean ratio during previous years, which was 40.4 per mille. 91 It decreased to 30.4 per mille in 1919 in the province. 92 The birth rate could not rise to its normal level even in the following decade, as seen in Table 10.
Number % of birth of the population in 1911–21 and 1921–31.

Even though the decade 1921–30 was prosperous and healthy, the birth rate in this decade fell from 1911–21 in all districts except Monghyr, Ranchi, Manbhum and Santhal Pargana which showed only a marginal increase. The decrease in birth rate can be attributed to the impact of the influenza pandemic on women. It proved particularly fatal to women between the ages 20–40, resulting in a disproportionately low number of women of childbearing age being alive in the following years. Further, the emigration of males in search of work and the lowered vitality of the population given the shortage of food and other nutrients such as milk also contributed to low birth rates. The scarcity of fodder led to a decrease in livestock, which in turn led to the scarcity of milk. 93 The fall in the birth rate affected the potential number of children, which was bound to reduce the possible workforce and increase the strength of the dependent population.
As mentioned, the prevailing economic conditions in rural areas led to the emigration of people, especially the adult working age group. The population of the province, in general, had been home loving, and the cultivation of land was their most important occupation, which did not encourage them to move out from their native places. But the necessities and hardships of life often forced them to search for their livelihood in places outside of their homes and villages. Therefore, periodic migration associated with the seasons of the agricultural year is of great volume and importance in Bihar. The slack time in the agricultural year begins when the winter rice crop is cut and ends with the coming of the monsoon. This, therefore, is the time of maximum migration. It is to be pointed out that this was the period when the pandemic was in full swing, with the start of the second wave in September, which continued until March of the next year. Agriculture was severely affected by the failure of the monsoon, which forced the population that was mainly dependent on agriculture, to move out of their homes to find work through which they could make both ends meet. The workforce, especially those in the age group between 20 and 40, could not afford to stay at home and escape infection. Migration thus also became a tool for spreading the disease and, at the same time, also reflected the material conditions of the people in general, in which they had to compete against the onslaught of the pandemic. It is at this time that the poorer agriculturists and labourers, mostly coming from the lower castes, especially in northern Bihar, migrated in search of livelihood. The number of male migrants was certainly higher than female migrants, but the labourers who went out to harvest crops were accompanied by their women and children, who would assist them in cutting and gleaning. In northern Bihar, maximum migration took place from the Saran, Muzaffarpur and Darbhanga districts. People from the Saran district migrated mostly to the neighbouring United Provinces, whereas the people from Muzaffarpur and Darbhanga preferred to look for work in Calcutta and other regions within the province of Bengal. People from southern Bihar also migrated in large numbers to Calcutta and the other industrial centres of Bengal. The emigration from the Chotanagpur Plateau to then-contiguous parts of other provinces also increased considerably after the scarcity of 1918–19. Though it is difficult to measure any kind of emigration during this period, some data is available on people migrating to the tea gardens of Assam during the pandemic, which sheds light on the status of emigration at that time. In 1917–18, the number of workers and dependents recruited to work in the tea gardens of Assam in the province was 11,246; but in 1918–19, this number rose to 196,336, which was more than a tenfold increase. 94 Similarly, in the Bhagalpur district, the southern portion of the Banka subdivision suffered heavily, and all three thanas show losses varying from 3.78 to 17.78%. Here, the pandemic was combined with famine, and over 20,000 people emigrated from this subdivision. 95
The biggest impact of the pandemic was certainly on the poorer sections of society, who were living primarily in the villages. The agricultural crisis and rising inflation, combined with poor health facilities, conspired against the poor and posed a threat to their survival. Even so, other sections of society also could not escape the devastating pandemic and accompanying socio-economic side effects. In fact, the non-agricultural classes were more affected by agricultural stagnation than the agriculturists. Since a poor crop led to an increment in the price of food grains, this affected the consumers, who had to purchase their whole supply, more than the farmers, who could grow something or other even in the deteriorating conditions of agriculture and did not depend completely on the procurement of their food necessities. In fact, the classes most severely affected by the shortage and rising prices of food grains were the landless workers and the professional class, who were dependent on a fixed income. 96 Even the landlords could not remain untouched by the disastrous impact of the pandemic situation as the tenants defaulted on their rent, which affected the purchasing capacity of the landlords as well. This was the period when a large number of farmers were being evicted from their land due to non-payment of rent.
The influenza pandemic continued in the province in the following year. In September 1919, a severe outbreak occurred in the Bhagalpur Central Jail. It was so severe that it had to be specially investigated by Major Morison and Captain Malone. 97 The jail records also show the lingering effects of the pandemic in 1919. The epidemic was chiefly felt in Gaya and Bhagalpur Central Jails, where 51 deaths were recorded. Apart from these two jails, the maximum number of cases were admitted in Champaran (123) followed by Ranchi (74), Buxar (57) and Chapra (32). 98 In 1919 as well, the total number of deaths exceeded the number of births in the whole of India, and the situation was the same in Bihar. The deaths numbered 1,372,657, which was 342,084 over the births, which numbered 1,030,573. 99 The rural areas again bore the brunt, and the ratio of deaths was 33.3 per mille for the municipalities and 40.3 per mille for the rural areas in 1919. 100
Conclusion
The history of human civilisation not only tells the story of development and progress but also highlights the challenges that humanity has faced at various times. Pandemics and epidemics are one such major challenge, which have affected the world from time to time. Smallpox, malaria, plague, cholera and other epidemics and pandemics have had a significant impact on various aspects of human history. However, in comparison to the widespread impact of pandemics and epidemics, focused studies on them have been sparse, particularly in the context of their decisive role in historical change. The influenza pandemic of 1918–19 in particular may be mentioned as a stand-out case. Its spread, expansion and impact were greater than any pandemic, and it affected almost the entire world in equal measure. Its impact was felt in almost every part of the world and by every social group, and it can only be compared to the coronavirus pandemic. Both pandemics claimed a large number of lives. However, the 1918 influenza pandemic appears to have been more lethal, as it claimed more lives than the coronavirus pandemic. Millions of people lost their lives and several million people grappled with its side-effects and its lethal trails on the economy, society and system overall. For this reason, it is astonishing that the influenza pandemic of 1918, which had such a broad impact and killed more people than the world wars, has not been thoroughly studied. The studies on the subject that are available have been conducted from either a medical or demographic standpoint, whereas this pandemic had multifaceted aspects that determined its prevalence and impact. Yet even a century after one of the worst-ever pandemics, there is not one study that has attempted to discuss it in its totality. Death might become just a statistic in case of a pandemic, but below those numbers lies the real story, which is more important to know in order to comprehend the impact of a pandemic in its historical and socio-economic context.
India was the country most-affected by this pandemic, as 20–30 million people perished. However, the studies that have been conducted, particularly in the Indian context, only seem to show changes in demographics, particularly the mortality rate. Nevertheless, there is detailed information available in the contemporary documents that can be studied and analysed to understand the spread and impact of this pandemic at a basic level. This article has attempted to fill a gap in the study of the 1918–19 influenza pandemic by investigating its spread and impact in Bihar from a socio-economic standpoint, indicating a shift in the approach to historical studies of this pandemic. Noticing the importance of socio-economic factors in the transformation of a disease or epidemic into a pandemic with lethal consequences, this article has attempted to contribute to a better understanding of different aspects of the global pandemic. The study has shown that the socio-economic context was no less important than the pandemic’s own impact on mortality. The prevailing economic situation not only contributed to the spread of the pandemic but also made it more lethal. As a result, Bihar had more fatalities than nearby Bengal and Assam. Again, even within Bihar, rural areas had more deaths than urban areas. The ongoing war crisis, agricultural stagnation, roaring inflation coupled with high population density, malnutrition, medical deficiency and mismanagement, all contributed to the pandemic’s widespread and intense impact. Looking at the death toll in the eastern regions of India, it can be inferred that the figure of deaths would have been in the same proportion in Bihar as in Bengal and Assam. But the death rate in Bihar was much higher, and this study has shown that there was a direct correlation between the higher number of deaths and other non-pandemic contextual factors.
Further, the impact of the influenza pandemic cannot be seen only in its immediate context. Its long-term consequences include a decrease in birth rates in the subsequent decade as a result of the high number of adult male and female deaths during the pandemic. This had an impact on the overall structure of the workforce, especially those who were between the ages of 20–40. The reduction in labour-force participation and the compulsion to migrate contributed to the escalation of the agrarian crisis. It is also worth noting that the influenza pandemic cannot be understood solely in the context of its own effects but must be understood in conjunction with the effects of other diseases, epidemics and natural disasters such as floods and famines. Overall, this study has presented an overview of the influenza pandemic in Bihar and enabled one to comprehend and imagine the pandemic’s national and global impact.