



Abstract
This study empirically re-examines the relationship between transport infrastructure and economic growth in India for the period 1990–2017. Multivariate dynamic models are applied to estimate the relationship between economic growth and different modes of transport infrastructure namely road, rail and air transports in the vector error correction model framework. The results reveal that road and air transports have significant positive contribution to economic growth in the long-run while rail transport is insignificant. This study further examines the said issue using unit free index variables and has constructed a composite index of transport infrastructure using principal component analysis to analyse the nexus between aggregate transport infrastructure and economic growth in India in the post globalisation era. The results of the study indicate the bidirectional causality between aggregate transport infrastructure and economic growth. Results of this study suggest incorporating feedback issue in policy formulations.
Introduction
The economists and policy makers recognise transport infrastructure as a crucial factor for sustainable economic growth. Many studies (Pradhan & Bagchi, 2013; Sanchez-Robles, 1998; Shah, 1992; Short & Kopp, 2005; Tripathi & Goutam, 2010) show that integrated and well-functioning transport facilities are necessary for achieving sustainable economic growth. Recently, according to the World Bank, India emerges as the fastest growing economy in the World. 1 One of the possible reasons behind this success might be the outcome of several factors particularly, massive investment in infrastructure which was initiated in road infrastructure 2 in India since early in the twenty-first century. In this context, the relevant question arises whether transport infrastructure is the cause of economic growth in the post globalisation era in India. This study revisits the ongoing debate over this issue in the context of India.
Demand for infrastructure especially, transport infrastructure for economic growth is age old. Various economic theories have been put forwarded to justify the role of transport infrastructure in a country’s economic progress. Amongst them some supported the view that enlarged availability of transport facilities is the essential pre-condition for economic development (Barro, 1990; Barro & Sala-i-Martin, 1992, 1995; Hirschman, 1958; Wagner, 1958, etc.). However, Wagner (1958) opposed the view of Hirschman (1958) and argued that demand for transport facilities would grow if and only if development takes place. So, there is a debate over the causal relationship between transport infrastructure and economic growth. In other words, whether transport infrastructure causes economic growth or economic growth itself is the cause of demand for transport infrastructure. Empirical literature provides controversial role of transport infrastructure in the process of economic growth. Aschauer (1990), Khadaroo and Seetanah (2008), Tripathi and Goutam (2010), Pradhan and Bagchi (2013) and Mohmand et al. (2016) supported the view that the availability of well-developed transport facilities is the cause of economic growth. Opposing the above said view, Gramlich (1994), Ramanathan and Parikh (1999) and Maparu and Mazumder (2017) suggested that economic growth causes transport sector to grow further. Thus, the outcomes of the empirical studies (Bosede et al., 2013; Khadaroo & Seetanah, 2008; Nwakwze & Mulikat, 2010; Stephan, 2000; Tong et al., 2014; Wessel, 2019) are inconclusive and still unsettled.
In the context of India, few studies have been conducted to estimate the nexus between transport infrastructure and economic growth (Ghani et al., 2014; Maparu & Mazumder, 2017; Pradhan & Bagchi, 2013; Sahoo & Dash, 2011; Tripathi & Goutam, 2010). Overall, the results of these studies revealed that transport infrastructure plays a crucial role in economic growth. In most of the cases either road transport or both road and rail transports have been considered as proxy for transport infrastructure. However, the multidimensional facet of transport infrastructure will not be reflected adequately if we consider transport infrastructure as one-dimensional phenomenon, that is, use them separately in a bivariate framework. This is because the use of bivariate model may mislead to the biased causality inferences due to the omission of relevant variables (Lutkepohl, 1982). This study attempts to provide a better estimation technique by taking different sub-sectors of transport infrastructure as explanatory variables to estimate the nexus between transport infrastructure and economic growth unlike previous studies that have taken only one sub-sector of transport infrastructure as explanatory variable under ceteris paribus assumption. The use of different sub-sectors of transport infrastructure in a multivariate structure 3 helps us to capture the multidimensional aspects of transport infrastructure. However, this may create problems like multicollinearity if all the indicator variables are highly correlated to each other. Therefore, this study develops a composite time series index of transport infrastructure using principal component analysis (PCA) 4 to avoid such problem and revisits the relationship between transport infrastructure and economic growth in India in the post globalisation period.
The rest of the study is organised as follows: Section 2 summarises the existing literature. Section 3 presents a brief overview of transport infrastructure development in the post globalisation period in India. Section 4 describes the sources of data and econometric methodologies used in the study. Section 5 analyses the empirical results. Finally, conclusions and policy suggestions are presented in Section 6.
Review of Literature
The nexus between transport infrastructure and economic growth had been started with Antle (1983) when he measured the effects of transportation and communication infrastructure on aggregate agriculture productivity using a Cobb–Douglas production function for 47 less developing countries and 19 developed countries. He found a strong and positive association between the level of infrastructure and aggregate agriculture productivity. This finding is in line with Aschauer (1989), who found that the elasticity of gross domestic product (GDP) with respect to core (such as street lights, highways, airports, mass transit services, sewerage and electricity and gas)infrastructure was 0.24 and concluded that in the U.S. core infrastructure contributed more to productivity than other forms of infrastructure. Eberts (1990), Munnell (1990), Garcia-Mila and McGuire (1992), etc. have also found a high output elasticity of some public capital infrastructure. The positive contribution of transport infrastructure has also been addressed by Fernald (1999) where he reported that output elasticity of highway capital in U.S. economy for the period 1953–1989 was 0.35. He concluded that industries who used road transport intensively, have a faster growth of factor productivity than others. Stephan (2000) measured the effects of public infrastructure (consisting transport and human capital infrastructure) to local private production using a panel data set of 327 German counties and found that transport and human capital positively contribute to the productivity and output of local private sector. Fan and Zhang (2004) used 1996 Agricultural Census dataset of China and estimated the effects of rural infrastructure (road density) on both farm and nonfarm productions. Using a simultaneous equation system they concluded that the role of rural infrastructure and education is much higher to the productivity of nonfarm sector than agriculture productivity. Khadaroo and Seetanah (2008) examined the association between transport capital and economic growth for Mauritius over the period 1950–2000 using a dynamic time series analysis in a vector error correction model (VECM) framework and found a positive contribution of transport infrastructure to the economic performance of Mauritius. Tripathi and Goutam (2010) examined the long-run equilibrium relationship between road transport, employment, output and gross capital formation in India from 1970–1971 to 2007–2008. They used vector autoregressive approach (VAR) to analyse the impact of road transport on such macroeconomic variables. The results of their study revealed that road transportation has a significant and positive long-run relationship with economic growth and gross public capital formation. This result is in line with Pradhan and Bagchi (2013), who have also showed a positive contribution of transport infrastructure (consisting road and rail) to economic growth in India during 1970–2010. Using VECM, they found bidirectional causality between road infrastructure and economic growth and road infrastructure and gross domestic capital formation, unidirectional causality from railway infrastructure to economic growth, and gross domestic capital formation, and finally, unidirectional causality from total transport to economic growth and gross capital formation in India. Similar results have been found by Mohmand et al. (2016). They have measured the impact of transportation infrastructure on economic growth in Pakistan using a panel data of developed and less developed provinces. The results of their study found bidirectional causality between transport infrastructure and economic growth in case of rich and much developed provinces and unidirectional causality between economic growth and transportation infrastructure in underdeveloped provinces. Maparu and Mazumder (2017) examined the causal relationships between transport infrastructure (road, rail, air and port infrastructure), economic development and urbanisation in India from the period 1990 to 2011. They used several time series estimation techniques such as, Engle–Granger cointegration test, Johansen cointegration test, VECM and Granger causality test to conduct the analysis of their study. Their results showed that in the long-run, transport infrastructure is cointegrated with economic development and the directional of causality is from economic development to different sub-sectors of transport infrastructure in most of the cases and drawing support in favour Wagner’s law. However, no causation has been found from urbanisation to transport infrastructure but the reverse is not true as unidirectional causation runs from highway and port transport to urbanisation. Wessel (2019) analysed the effects of specific mode of transport infrastructure on trade using a gravity equation model with European trade flows. The results of the study showed that improvement of certain types of transport infrastructure have different trade effects, among them rail and air infrastructures are more responsive to quality improvements in the corresponding infrastructure while road density rather than road quality has a positive trade effect.
State of Indian Transport Infrastructure in the Post Globalisation Period
Category-wise Share of Road to Total Road Length.
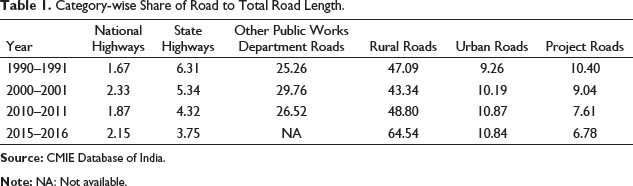
Category-wise Share of Road to Total Road Length.
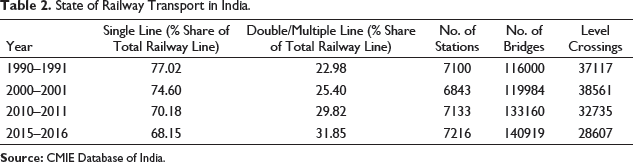
State of Railway Transport in India.
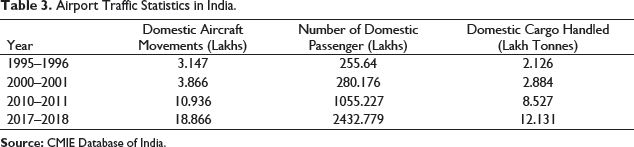
Airport Traffic Statistics in India.
Share of GDP of Different Transport Modes in India During 1999–2000 to 2010–2011.
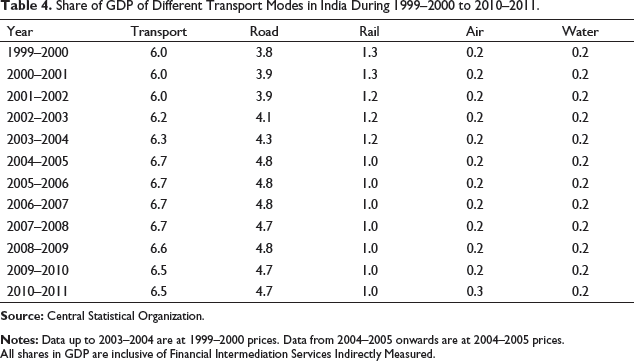
All shares in GDP are inclusive of Financial Intermediation Services Indirectly Measured.
For conducting the analysis, this study takes three components of transport infrastructure namely, road density (total road length per 1,000 sq. km), railway density (total railway route length per 1,000 sq. km) and air density (domestic aircraft flown per 1,000 sq. km), and GDP per-capita (constant 2011–2012 in rupees) as a proxy for economic growth in India for the period 1990–2017. All the indicators of transport infrastructure are taken from the Economic Outlook of India—the CMIE database while GDP per-capita is obtained from the Handbook of Statistics, Reserve Bank of India (RBI). All the variables are used in real terms and then transformed to natural logarithms, that is, road density as lnRODN, rail density as lnRLDN, air density as lnARDN and economic growth as lnGDPPC.
This study applies VECM to assess the long-run equilibrium relationship between road, rail and air transports and economic growth as well as their short-run dynamics. Since, the use of the VECM (Equation (1a) in Appendix) requires the series to be cointegrated with the integration of order one, that is, I (1), therefore, Engle–Granger cointegration test (1987) and Johansen cointegration test (1988) are applied to check the cointegrating nature of the variables. Engle and Granger test of cointegration method applies augmented Dickey–Fuller test (ADF) test on the residuals (Equation (1b) in Appendix) estimated from the cointegrating regression between the variables. On the other hand, Johansen test of cointegration (1988) proposes two different likelihood ratio tests namely: the Trace test (Equation (1c) in Appendix) and Maximum Eigenvalue test (Equation (1d) in Appendix) to analyse the long-run associations among the variables.
Results and Discussion
Basic Results
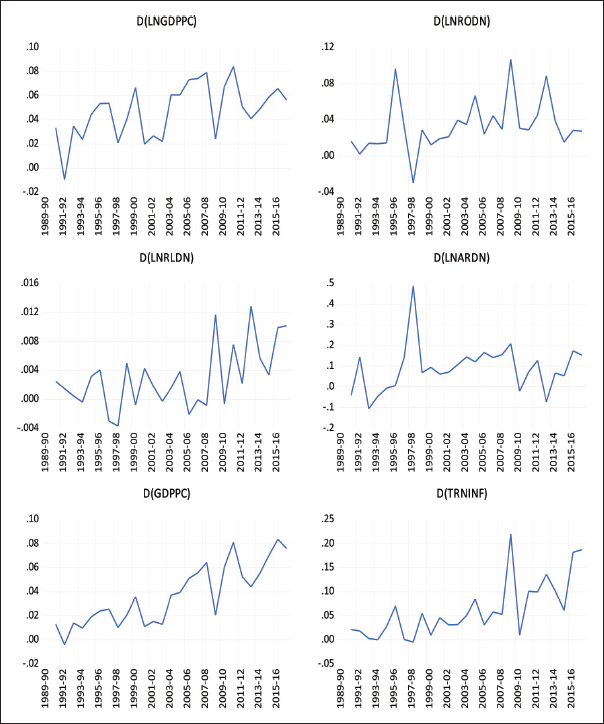
The underlying assumption of time series empirical work is based on stationary data that might avoid spurious regression. 5 Therefore, it is necessary to check the nature of the data generating process (DGP) 6 of a time series variable that is, whether this process is stationary or not before using it in time series estimation. A DGP is said to be stationary (weekly) if its mean and variance are time-invariant and its covariance depends on time difference only. We use two different ways to detect the stationary nature of a time series, namely visual inspection of the data plots (Figures 1 and 2) and numerical judgement with unit root tests (see Table 5). Figure 1 displays lnGDPPC, lnRODN, lnRLDN, lnARDN, income index (GDPPC) and index of transport infrastructure (TRNINF) for the period of 1989–90 to 2016–2017. All the series show a tendency to drift upwards over time (see Figure 1) at their levels and therefore, they are non-stationary in mean. Otherwise, they are stationary in mean at their first difference (see Figure 2).

Results of Unit Root Tests of GDPPC and TRNINF Index.
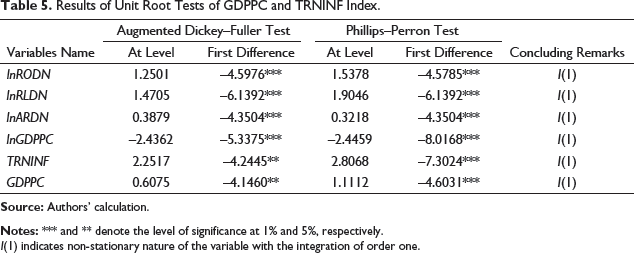
I(1) indicates non-stationary nature of the variable with the integration of order one.
Results
Results of ADF and PP test indicate that lnGDPPC, lnRODN, lnRLDN, lnARDN and index of TRNINF and normalised GDPPC are integrated of order one, that is, all the variables are first difference stationary. In this context, this study applies two types of cointegration techniques—multivariate cointegration and bivariate cointegration. Engle and Granger (1987) showed that two I(1) time series may cointegrate if their linear combination is I(0). Existence of cointegration may exhibit a long-run equilibrium relationship and in such situation error correction model can be applied to estimate the long-run relationship along with short-run dynamics among the variables. The next section discusses the nexus between transport infrastructure and economic growth in a multivariate framework.
Multivariate Model
Results of Johansen Cointegration Test.
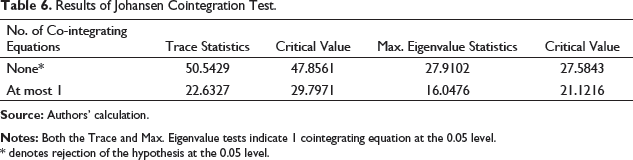
* denotes rejection of the hypothesis at the 0.05 level.
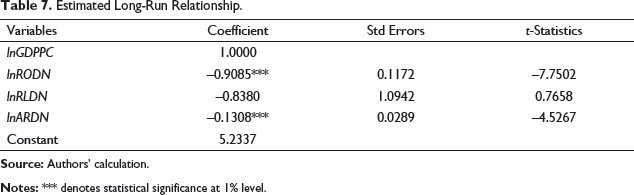
Cointegration provides long-run equilibrium relationship between two or more non-stationary variables. However, it does not say anything about short-run forces that keep the long-run equilibrium relationship intact (Bhaumik, 2015, p. 273). In this context, the study applies VECM to assess the long-run relationship among road transport, rail transport, air transport and economic growth in India along with short-run dynamics. The result of estimated long-run relationship is presented in Table 7. The estimated long-run relationship between GDP per-capita and different modes of transport infrastructure is:

Estimated Long-Run Relationship.
Optimum lag length is 2 as per Akaike information criterion and Schwarz information criterion.
Short-run Dynamics.

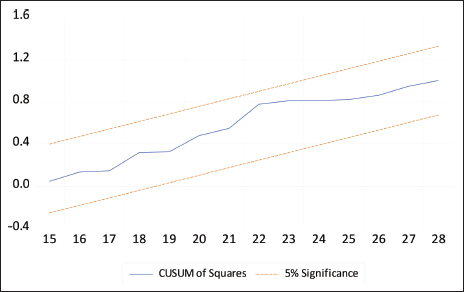
The study then performs some diagnostic tests to check the model’s validity. 9 Results of the Lagrange multiplier (LM) test, Jarque–Bera test and CUSUM of squares test (Tables A1 and A2, and Figure A1) suggest that the error correction equations are not subject to residually auto-correlated up to lag 2, normally distributed and stable.
The study further investigates the direction of causality among the variables. The direction of causation on the nexus between growth and transport infrastructure development is debatable and still an unsettled issue. However, this issue needs to be settled in the effective design and implementation of better transport policies for an emerging country like India. Therefore, the study applies VECM based causality test to assess the direction of causality, whether it is from transport infrastructure (or more specifically, different modes of transport infrastructure) to economic growth and vice versa.
Results of VEC Granger Causality/Block Exogeneity Wald Test.
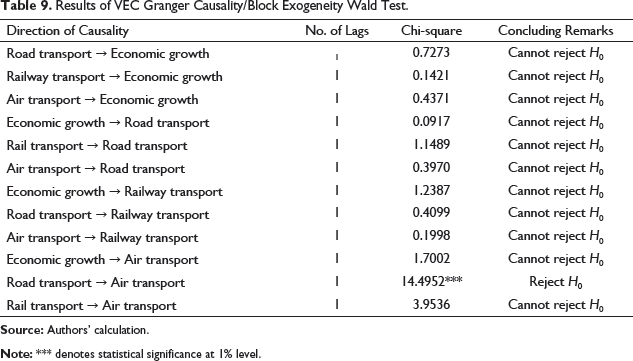
Overall, from the multivariate analysis, it is observed that road, rail and air transport infrastructures are cointegrated with economic growth in India. Road and air transports have a positive and significant long-run relationship with economic growth. However, no short-run causality is found from any of the sub-sector of transport infrastructure to economic growth and vice versa.
The analysis of above said multivariate level variables may have some limitations, if any. As per literature, there is also certain problem in bivariate levels. To overcome these problems and to re-examine the nexus between growth and infrastructure development focusing transport infrastructure, this study designs a time series composite index of transport infrastructure using PCA. The corresponding Eigenvalues and the different principal components for each sub-sectors of transport infrastructure are reported in Tables A3 and A4. Design of composite index of transport infrastructure will reduce the dimension of the data set and make them unit free. Despite this, it also provides relevant coefficients of all the three indicators rather incorporating them into a single equation. In the section below, we discuss the empirical results between transport infrastructure index and normalised GDP per capita or income index.
Nexus Between Transport Infrastructure Index and Income Index
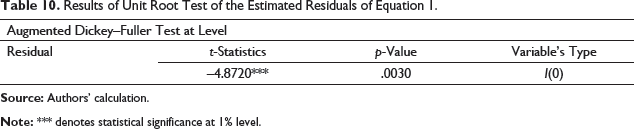
ADF and PP unit roots tests (Table 5) suggest that TRNINF and GDPPC are non-stationary and having integrated in order one, that is, I(1). Therefore, cointegration can be tested between GDPPC and TRNINF. Engle and Granger test of cointegration applies ADF test on residuals (Table 10) of the estimated cointegrating equation:

Results of Unit Root Test of the Estimated Residuals of Equation 1.
Estimated Long-run and Short-run Dynamics Between GDPPC and TRNINF Index.
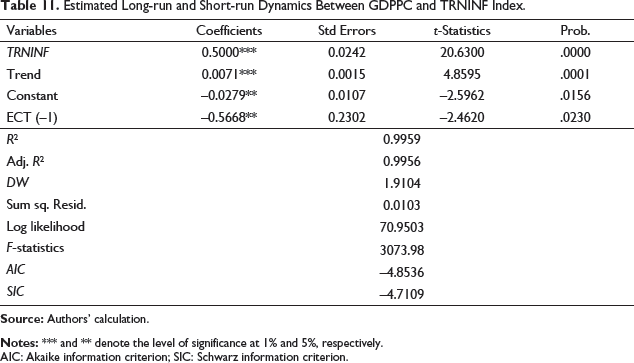
AIC: Akaike information criterion; SIC: Schwarz information criterion.
This study applies ordinary least square method to estimate the long-run relationship between transport infrastructure and economic growth. Equation 1 shows the estimated long-run relationship between transport infrastructure and economic growth. Equation 1 indicates that normalised per-capita income increases by 0.50 points for every incremental point of transport infrastructure index to maintain the long-run equilibrium, Ceteris peribus. Thus, in the long-run, transport infrastructure has a positive relationship with economic growth in India in the period of post liberalisation. Time trend is also positive and significant and bears a positive relationship with economic growth. The negative and significant error correction term indicate that transport infrastructure would make a short-run adjustments at an approximate speed of 57% towards its long-run equilibrium path whenever there induce any shock to the system, respectively. The study then performs some diagnostic tests to check whether the model is free from serial correlation, whether the residuals of the error are normally distributed and finally, whether the model is stable or not. The results of LM test, Jarque–Bera test and CUSUM of squares test are reported in Tables A5, A6 and Figure A2.
VAR Granger Causality/Block Exogeneity Wald Tests.
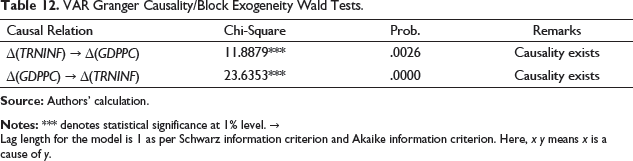
Lag length for the model is 1 as per Schwarz information criterion and Akaike information criterion. Here, x y means x is a cause of y.
The result of the causality test indicates that transport infrastructure causes economic growth and economic growth is also a cause of transport infrastructure in the short-run. This indicates the existence of bidirectional causality between transport infrastructure and economic growth.
There has been a long debate between endogenous growth theories and Wagner’s law on the issue of direction of causality between infrastructure and economic development. Empirical literature was unable to confirm whether the causality is from infrastructure to economic development or vice versa. The findings of this study may settle the above said issue and definitely help to form appropriate transport policies for an economy which aspires to grow.
Conclusion
This study has reinvestigated the relationship between transport infrastructure and economic growth in the post liberalisation era in India. For the said purpose, we have collected data from the RBI and the CMIE for the period of 1990–2017. Applying techniques of unit root tests, we have examined the nature of data and observed that concerned variables are non-stationary, that is, I(1). Next, the study investigates the cointegrating long-run equilibrium relations. This investigative study has done in two ways using (a) multivariate level variables and (b) unit free bivariate index variables. To make unit free, this study constructs a composite index for transport infrastructure using the PCA. This composite index represents overall transport infrastructure.
Initially, this study applies a multivariate dynamic framework to examine the nexus between economic growth and transport infrastructure in general, and different modes of transport namely road, rail and air transport infrastructure with economic growth in particular. Applying econometric techniques, this study confirms the cointegrating relationship between economic growth and transport infrastructure. Using cointegration and Granger causality test, the results of this study may be summarised as follows:
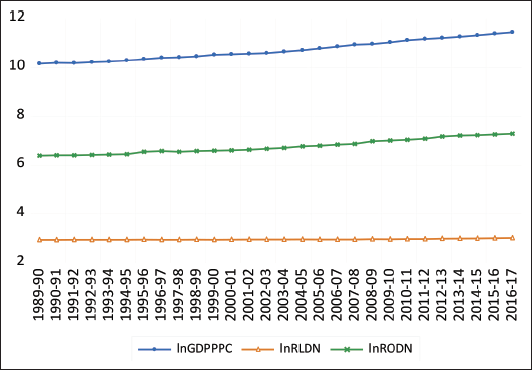
Economic growth is directly related with road and air transport. Road transport infrastructure has a significant positive contribution to economic growth in the long-run. This indicates that an increase in road transport would have a positive effect on economic growth in the long-run. In the long-run, air transport has also played an important role in economic growth in India. No significant long-run relationship is found between railway infrastructure and economic growth in India. This could be due to the fact that in the post globalisation era, the extension of railway network (total railway length) has not been increased much and remained constant over the years (Figure A3). The results of the Granger causality test from the multivariate dynamic frame work suggest no short-run causality from any of the sub-sector of transport infrastructure to economic growth and vice versa. Unit free bivariate model is used to replace the multivariate model. Results of unit free bivariate model provide long-run relation between transport infrastructure and economic growth with short-run dynamics. Overall transport infrastructure is reflected in transport infrastructure index, which is significant in the long-run and has a positive contribution to the economic growth in India since 1990. However, bidirectional causality exists between overall transport infrastructure and economic growth in the short-run, indicating that expansion of transportation system will cause economic growth and on the contrary, high growth in per-capita income will also facilitate the demand for transport infrastructure.
From the policy perspective, the results of this study suggest that increasing transport facilities (namely road, rail and air) might be an effective way through which sustainable economic growth can be achieved. An extra care should be taken to increase the total railway length as it is more environmental friendly than other sub-sectors of transport infrastructure.
Appendix A





Results of Breusch–Godfrey Correlation Lagrange Multiplier Test.

Results of Jarque–Bera Normality Test.

Eigenvalues and Variance Explained by Principal Components.

Components Loadings for Different Sub-sectors of Transport Infrastructure.

Results of Breusch–Godfrey Correlation Lagrange Multiplier Test.

Results of Jarque–Bera Normality Test.

Lag Order Selection Criteria for the VAR Model.
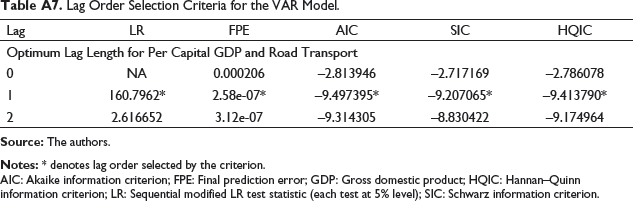
AIC: Akaike information criterion; FPE: Final prediction error; GDP: Gross domestic product; HQIC: Hannan–Quinn information criterion; LR: Sequential modified LR test statistic (each test at 5% level); SIC: Schwarz information criterion.
Footnotes
Acknowledgements
We are grateful to the referees for their valuable comments and suggestions. We are also thankful to the Chairman and participants of XXIXth Annual Conference at Jadavpur University during 16–17 December 2019 and Summer School at Presidency University during 29 July–2 August 2019 for their constructive comments.
Declaration of Conflicting Interests
The authors declared no potential conflicts of interest with respect to the research, authorship and/or publication of this article.
Funding
The authors received no financial support for the research, authorship and/or publication of this article.