



Abstract
This study examines the inclusiveness of poverty reduction among the newly formed states of undivided Andhra Pradesh by looking into the poverty among the different socio-religious groups both in the rural and urban regions during the 2000’s. The major proposition that has highlighted in this study: which socio-religious groups are more poverty ridden in the undivided Andhra Pradesh and its bifurcated states (Andhra Pradesh and Telangana)? The National Sample Survey Organisation unit level data (61st and 68th rounds) on Consumption Expenditure Survey have been used for the analysis. The result reveals that Telangana is having lower poverty level than Andhra Pradesh and records a faster reduction in poverty during 2004–2005 to 2011–2012. Andhra Pradesh constitutes around 70% of the total poor of the undivided Andhra Pradesh. This study found that most of the Scheduled Tribes, Scheduled Castes among the social groups and Muslims among the religious groups are more vulnerable and having higher head count ratio than the state average. Although several welfare programmes and schemes have already been implemented to eradicate poverty and inequality, still it is not effective in the ground level. Based on this argument, our study suggests that the schemes should focus on different sections of the people irrespective of rural and urban sectors in both the recently bifurcated states of Telangana and Andhra Pradesh.
Introduction
Despite having high economic growth in the post-reform period, the main concern of the policy-makers are: whether this growth has resulted in reducing the poverty and inequality and whether the benefits of growth have been distributed among the socially disadvantaged sections and whether the growth is pro-poor. India’s Eleventh Five-Year Plan, 2007–2012, was focused on ‘Inclusive Growth’ and included some concrete strategies to promote the well-being and participation of disadvantaged groups (Planning Commission, 2013), but there is a relative dearth of in-depth research on the pro-poorness and inclusiveness of growth at national and provincial level. This study attempts to bridge the gap by studying the inclusiveness at the regional level in undivided Andhra Pradesh and the bifurcated states during 2000’s. The post-reform period especially 2000’s decade recorded a faster growth rate in the undivided Andhra Pradesh (Vakulabharanam & Motiram, 2014). But the questions are: whether the faster growth in output has resulted in reducing the poverty and inequality among the disadvantaged socio-economic–religious groups and whether this growth has reduced the regional disparities among the districts.
As mentioned in the earlier section, the inclusiveness of poverty can be analysed by looking at poverty among the socio-economic–religious groups. Though, various studies have been undertaken to measure poverty at the national and state level, very few studies have attempted to measure it at disaggregated level, that is, poverty among the socio-economic–religious groups (Arora & Singh, 2015; John & Mutatkar, 2005; Sundaram & Tendulkar, 2003; Thorat & Dubey, 2012). As each state has different demographic compositions and socio-economic characteristics, it is necessary to estimate poverty at the disaggregate level among the states.
The state Andhra Pradesh is situated in the Southern part of India and is considered as one middle-income state among the Indian states. As per the Andhra Pradesh Reorganization Act 2014 (amended by Indian Parliament), the state has been bifurcated into Telangana state and residuary Andhra Pradesh state. Mainly undivided Andhra Pradesh was consisting of 23 districts before bifurcation, out of which large number of districts from Telangana and Rayalaseema regions are considered as backward districts. The demand for a separate state of Telangana is due to the long neglected by the undivided Andhra Pradesh government on several fronts like economic, political, social, language and religion criteria (Rao, 2011). In the context of regional disparities, unequal distribution of resources and uneven employment opportunities between the two Indian states (Andhra Pradesh and Telangana), our study has attempted to explore—whether the reduction of poverty helps in bringing inclusiveness among different social and religious groups and between rural and urban sectors. Looking into the above dimensions, this study has mainly focused on the socio-religious conditions, especially that defined by the percentages of households below poverty line among the socio-religious groups of these two newly formed states as well as their parent state (Andhra Pradesh, Telangana and undivided Andhra Pradesh) during 2000’s. Among these two states, which state has witnessed a high reduction in poverty? Whether the poverty reduction happens inclusively in all the regions of the undivided Andhra Pradesh irrespective of any socio-religious group?
The rest of the study is organised as follows. Section II explores the literature review. Section III describes the data and methodology. Section IV deals with results and discussion followed by concluding remarks in Section V.
Literature Review
In order to know the association between the economic growth and human development among the major socio-religious and economic groups particularly at provincial level, we must understand on how the macroeconomic performance and policies over different periods of time are influencing the state’s economic performance and status as compared to other states in the country (Dev & Ravi, 2003). The major thrust of economic development over the time has shifted from poverty-reduction to inclusive-development. As argued in various literature (Dev & Ravi, 2007; Dubey et al., 2018; Thorat & Dubey, 2012), the degree of decline in poverty during the post-reform period (1993–2005) has not been greater than the period of pre-reform (1983–1993). The reason may be the rise in inequality during the post-reform period and has reduced the extent of poverty reduction.
Furthermore, the strategy of inclusiveness in growth needs to be examined through the variation in poverty and growth in monthly per capita expenditure (MPCE) for major socio-economic groups in both rural and urban sectors in India (Thorat & Dubey, 2012). There are many comprehensive literatures (Chauhan et al., 2015; John & Mutatkar, 2005; Panagariya & More, 2013, 2014; Thorat, 2010) found on poverty alleviation pattern across socio-religious and economic groups in rural and urban India. As per the authors’ knowledge, perhaps no such studies have highlighted the inclusiveness in poverty reduction among the different socio-religious groups in undivided Andhra Pradesh or its bifurcated regions. Sahoo et al. (2019) and Sahoo and Khan (2018) have studied the poverty among the economic groups in rural and urban areas of the undivided Andhra Pradesh and among the bifurcated regions by taking the National Sample Survey Organisation (NSSO) unit level data on Consumer Expenditure Survey (CES). Telangana has seen a lower level of poverty and faster reduction in poverty in the post-reform period in comparison to Andhra Pradesh. The first period (1993–1994 to 2004 –2005) has seen a slow reduction in poverty, while the second period (2004–2005 to 2011–2012) witnesses a higher decline in poverty in both the regions. The decomposition of poverty shows that it is the growth of MPCE which results in a higher poverty reduction as inequality has seen as rising trends in the post-reform period, which offset the poverty reduction. This study tries to focus on inclusiveness in poverty reduction among the socio-religious groups in rural and urban Andhra Pradesh and how it can be used to develop policy for the identification of the poor for the purpose of targeting in social programmes.
Some of the recent literatures have evidenced that the growth and macroeconomic performance of undivided Andhra Pradesh have improved substantially. The study by Dev and Ravi (2003) shows that Andhra Pradesh has been accounting in the middle position in both the growth and human development estimates among the Indian states. Dev (2008) highlights that undivided Andhra Pradesh seems to be improving its economic growth. The growth rate of gross state domestic product in the last four years has been 7–8% per annum and the post-reform period has witnessed an increase in disparities across the regions and the social groups and between rural and urban areas. There is a need to have a broad-based and inclusive growth to improve all the sections of society. Additionally, there has been growing literatures those explore the poverty reduction and its potential impact on economic growth, social wellbeing, generation of employment opportunities, among others at aggregate level in Indian context. Based on our knowledge, very few studies have been attempted in this regard at the regional level and perhaps no study has paid much attention on different social groups and sector wise poverty analysis and further link to inclusiveness. Furthermore, many factors impact this performance in poverty reduction. For example, public intervention is very much important for poverty alleviation, the land reform has been the most effective measure to reduce the poverty in Andhra Pradesh (Parthasarthy, 1995).
In this backdrop, our study has attempted to examine the variation in poverty among different socio-religious groups as well as rural and urban sectors in undivided Andhra Pradesh, Telangana and Andhra Pradesh. This study has also tried to establish the relationship between poverty reduction and inclusiveness among the various sections of the people.
Data and Method
The poverty line that is set by the expert group and headed by Prof. S. Tendulkar has taken into consideration for this study (Planning Commission, 2011). Based on the poverty line proposed by the expert group, the poverty head count ratio (HCR) has been estimated among the socio-religious groups in newly formed states Andhra Pradesh and Telangana as well as the parent state of undivided Andhra Pradesh. The figures for the poverty line have collected from the Planning Commission, Government of India. Both the incidents of poor and the percentage share of poor among the socio-religious groups have been calculated for the analysis separately for the different regions and then has compared among the regions. In fact, for calculating the poverty among the socio-religious groups and among the regions, we have used the NSSO unit-level data on Consumer Expenditure Survey for the year 2004–2005 (61st round), and 2011–2012 (68th round). HCR, poverty depth, severity of poverty among the regions have estimated for the analysis. The Gini coefficients and the MPCE for the respective rounds have estimated among the socio-religious group for each rural and urban sectors. The MPCE is converted into real MPCE by using the poverty line deflator for the year 2004–2005 and 2011–2012.
Measurement of Poverty
There are several measures of poverty based on the income per capita consumption expenditure and the poverty line. The headcount index is the simple measure of poverty. It measures the proportion of the population that is below the poverty line. The poverty gap (PG) index therefore is considered as better measure of poverty over HCR, which measures the extent to which individuals fall below the poverty line as a proportion of the poverty line. The sum of these PGs gives the minimum cost of eliminating poverty. It shows that how much would have to be transferred to the poor to bring their incomes or expenditures up to the poverty line. The squared poverty gap (SPG) averages the squares of the PGs relative to the poverty line. The Gini coefficient is a measure of inequality of a distribution. It is defined as a ratio with values between 0 and 1: the numerator is the area between the Lorenz curve of the distribution and the uniform distribution line and the denominator is the area under the uniform distribution line.
Growth–Poverty Linkage
Let

This β measures the percentage fall in poverty due to each percentage increase in mean per capita income thereby indicating the poverty reduction efficiency of growth within a particular region over a period time. The value of β is always negative and the greater absolute value indicates the greater efficiency of growth spells in reducing poverty. The β is known as the poverty elasticity of growth. In the similar way the inequality elasticity of growth can be measured as the percentage fall or rise in inequality due to each percentage increase in mean per capita income.
Poverty in Undivided Andhra Pradesh and Its Bifurcated States
Especially the post 2000’s in the post-reform period recorded a faster reduction in poverty at the national level and among the states (Chauhan et al., 2015; Radhakrishna, 2015). But it is important to look whether the reduction in poverty is inclusive by looking the poverty among the socio-religious and economic groups. This section focuses on the poverty among socio-religious groups in rural and urban sectors of undivided Andhra Pradesh as well as the two newly formed states.
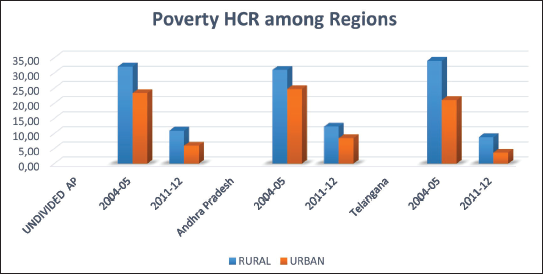
Figure 1 shows the poverty HCR of undivided Andhra Pradesh, Andhra Pradesh and Telangana, both for rural and urban areas for the year 2004–2005 (61st) and 2011–2012 (68th) NSSO rounds. The Tendulkar poverty line (based on the mixed reference period) is being used for calculation of poverty HCR. The Andhra Pradesh consists of 13 districts and the Telangana consists of 10 districts of the undivided Andhra Pradesh. The districts are being clubbed using the NSSO unit level data to get the poverty HCR figures at the regional level. While the rural poverty HCR for Andhra Pradesh has declined by 8.61% annually, whereas the decline rate for Telangana is 10.59%. The urban Telangana witnesses a faster decline rate in poverty HCR annually (11.80%) which is higher than the urban Andhra Pradesh which is 9.40% annually. The decline rate in poverty HCR is higher for the Telangana in comparison to Andhra Pradesh both in rural and urban regions. While the HCR measures the incidence of poverty but it does not give us a clear picture on how far the poor are deprived from the poverty line and the inequality among the poorer. For that reason, the PG and SPG figures for both the regions have been used.
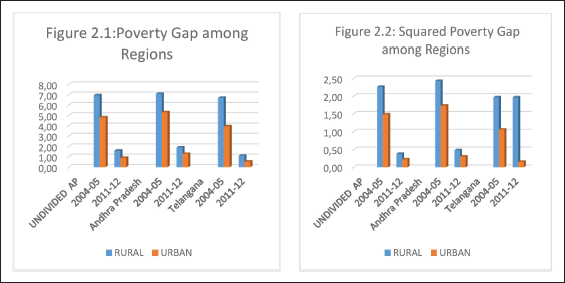
While Figure 2a shows the depth of poverty, Figure 2b shows the severity of poverty. Looking into the two bifurcated regions: Telangana and Andhra Pradesh, it is evidenced that Telangana has witnessed a faster decline in PG and SPG and the state is having lower PG and SPG than the Andhra Pradesh.
Poverty Among the Socio-religious Groups in Undivided Andhra Pradesh and Its Bifurcated States
Poverty HCR and Percentage Share of Poor Among the Social Groups in Rural and Urban Regions.
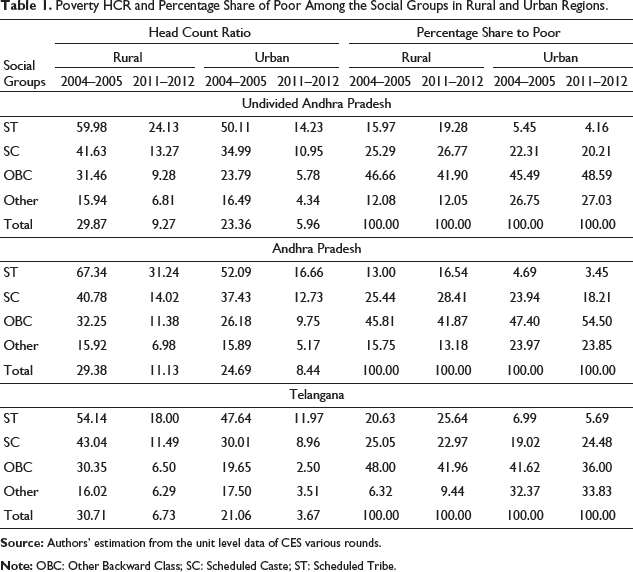
The decline in urban HCR is faster for Telangana than the Andhra Pradesh and Telangana has lower urban HCR in comparison to Andhra Pradesh. The contribution to the total poor in urban regions for Andhra Pradesh is double than the Telangana. While Andhra Pradesh contributes around 68% of the total urban poor, while the rest 32% has been contributed by Telangana. It shows that it is not the urban Telangana rather than urban Andhra Pradesh, which is highly poverty trodden. The incidence of poverty over the years reflects that both the groups STs and SCs in the undivided Andhra Pradesh, whose incidence of poverty is higher than the urban average. Looking at the regions, where both the Telangana and Andhra Pradesh witness a higher incidence of poverty above the urban average for SCs and STs. Poverty declines substantially among all the social groups in both the regions in this period. However, at segregate level, STs remain stand more deprived position in urban areas of both the regions.
The Table 1 presents the percentage share to rural poor for different social groups. The percentage share to the total poor can be calculated by dividing the HCR of a particular group with the average HCR and multiplying with the percentage of population of that group. If the poverty HCR declines at a faster rate by keeping the percentage of population remain constant, then there is a decline in the percentage share of poor of that group. Similarly if the percentage of population of a particular group decreases by keeping the HCR remain constant then the percentage share of poor of that group increases. Hence the percentage share of poor depends on the poverty HCR and the percentage of population of a particular group. It can be observed that the poverty risk for the OBC groups in Andhra Pradesh is rising during the period while it is falling in Telangana. Hence, the percentage share of OBC’s population increases in the period in both the regions, however, the Andhra Pradesh witnesses a rise in percentage share of poor among OBCs while Telangana witnesses a reduction in share of poor. Therefore, the above analysis concludes that OBC groups, who are considered as more deprived and vulnerable group in Andhra Pradesh, while this same critical problem has been observed for the SC groups in Telangana based on the estimated result of poverty HCR in both the sectors during the period.
It has also highlighted the percentage share to urban poor for different social groups. Although the HCR is higher among the STs followed by SCs in all the urban regions, the percentage share of poor is higher among the OBCs followed by others, SCs and STs. It is because of the fact that the OBCs constitute a higher percentage of population in both the regions in the urban areas. The percentage share to the total urban poor in both the regions among SCs is five time higher than the STs. Hence, though there is a faster reduction in poverty incidence, still poverty remains unchanged among the socially disadvantageous groups who have been deprived since the long period of time.
The Gini Coefficient and Real MPCE Among the Social Groups in Rural Regions.

For the urban region, it has been evidenced that the inequality witnesses a decline over the period of time. Over the period of time, the fall in urban inequality is higher in Telangana as compared to Andhra Pradesh. Surprisingly, the MPCE growth in urban Andhra Pradesh is faster than the Telangana in this period. But it is the faster reduction in inequality in Telangana, which causes faster reduction in the poverty. In the Andhra Pradesh, the inequality rises throughout among the SCs while in Telangana region the inequality raises among the STs over the years. The inequality is higher among the STs and SCs in Andhra Pradesh in comparison to Telangana regions. It might happen because the MPCE is higher in Telangana regions than the Andhra Pradesh regions.
Poverty Among Religious Groups in Undivided Andhra Pradesh and Its Bifurcated States
Poverty HCR and Percentage Share of Poor Among the Religious Groups in Rural and Urban Regions.
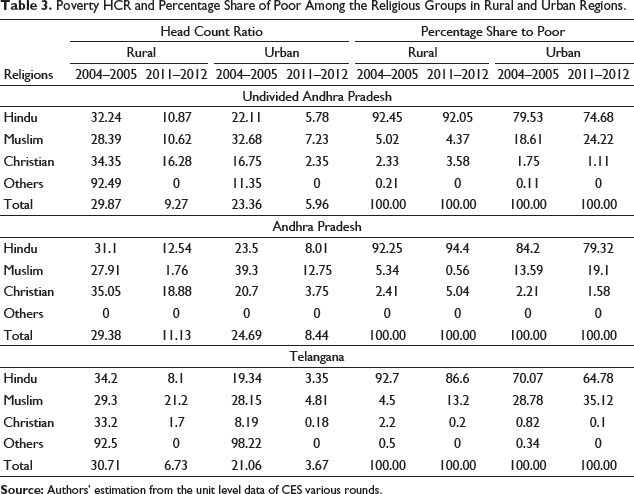
Table 3 presents the poverty HCR and the percentage share of urban poor among the religious groups in the regions of undivided Andhra Pradesh and its bifurcated states. The poverty HCR declines faster in Telangana region than the Andhra Pradesh. In both the regions, the poverty HCR is higher among the Muslim religious group and lower among the others. The HCR among Muslims is comparatively higher in Andhra Pradesh than in Telangana, which shows that Muslims in urban Telangana are in better position in terms of economic wellbeing than in urban Andhra Pradesh region. However, Muslim HCR is lower in Telangana than in Andhra Pradesh counterpart, but the percentage share to the total urban poor is higher in Telangana than in Andhra Pradesh, due to higher percentage of Muslim population in Telangana regions than in Andhra Pradesh region. On the other hand, the percentage share of urban poor for Hindu is 80% in Andhra Pradesh region, while it is only 65% for Telangana.
The Gini Coefficient and Real MPCE Among the Social Groups in Rural Regions.
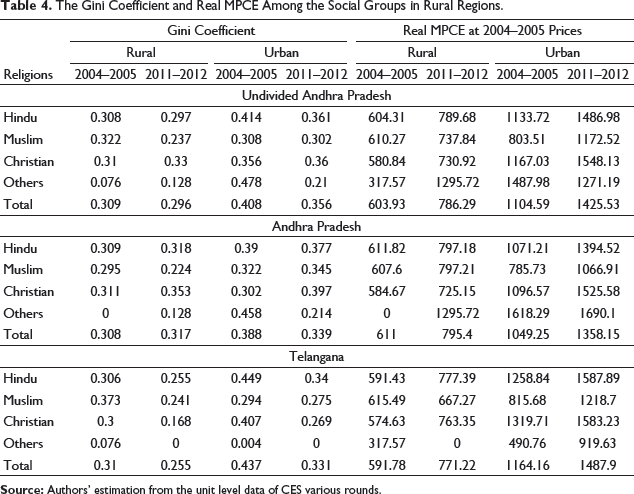
In the urban Andhra Pradesh regions, the Gini coefficient for the Muslims witnesses a rising trend while it declines in the Telangana. In this connection, the inequality declines among the Hindus in both the regions. In fact, the real MPCE increases in both the regions among all the religious groups. The MPCE is higher in urban Telangana as compared to the urban Andhra Pradesh.
Poverty and Inequality Elasticity of Growth
This section presents the poverty elasticity of growth and inequality elasticity of growth. The relationship between the growth and poverty can be established from the poverty elasticity. Furthermore, the relationship between growth and inequality can be established from inequality elasticity. The poverty elasticity is the ratio of relative change in poverty percentage between two periods to the relative change in MPCE between those periods. The inequality elasticity is the ratio of the percentage change in the Gini coefficient to the percentage change in MPCE between two periods. The value of the poverty elasticity will always be negative by implying that with a rise in MPCE there will be a decline in poverty between two periods. If the value of poverty elasticity is greater than one, it implies that the poverty reduced at a faster rate than the rise in MPCE. Hence, greater the poverty elasticity indicates the better-off the poorer are in the growth process. If the value of poverty elasticity is lower than one, it implies that the reduction in poverty is lower than the rise in MPCE or income. With rise in MPCE or income, the inequality might rise or fall, which implies that the inequality elasticity between two periods can be either positive or negative. The positive sign of inequality elasticity implies that the growth in MPCE causes a rise in inequality, which only benefits for certain upper income strata people while the negative sign of inequality elasticity implies a rise in MPCE that leads to reduction in inequality, which again implies that the lower strata has been benefitted more than the upper income group.
Figure 3 shows that the poverty elasticity of Telangana is higher than the Andhra Pradesh. The higher poverty elasticity might be due to the anti-poverty programmes like Mahatma Gandhi National Rural Employment Guarantee Act (MGNREGA) and the rise in public spending and expenditure on several welfare schemes. The same period also witnesses a decline in the inequality elasticity, which implies that the growth in MPCE during the period is more inclusive and reduces inequality. By comparing the poverty elasticity among the regions, it is found that during the study period, Telangana witnesses a faster rise in MPCE and a faster decline in the Gini coefficient causing a faster reduction in poverty. In this period, the poverty elasticity is higher in the urban sector than the rural sector. This shows that in this period, the growth effect of poverty reduction is higher in the urban sector than the rural sector. It is because of this period witnesses a faster rise in income in urban than its rural counterpart and the rise in MPCE is mostly among the lower sections of the population. Vakulabharanam and Motiram (2014) evidenced that Telangana witnessed a structural transformation where industry overtakes agriculture to become the dominant sector in this period. The construction and service sectors also displayed impressive growth during this time in Telangana.
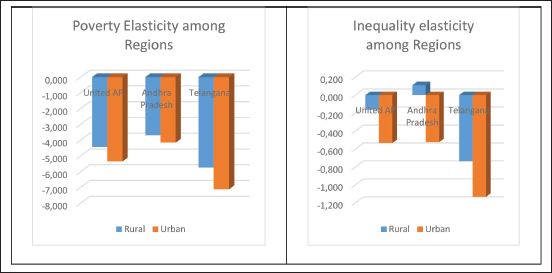
From Figure 3 it can be shown that the inequality elasticity is negative in this period implying that MPCE causes a fall in inequality. That means the MPCE rises faster in this period among the lower section of the people. Surprisingly, the inequality elasticity is higher in the urban sector than the rural sector in both the periods. It implies that the growth in MPCE in urban regions creates a higher degree of inequality than its rural counterpart as in the urban areas it mostly benefits the upper section of the people. However, the inequality elasticity in Telangana declines at a faster rate than Andhra Pradesh in this period. Reddy and Bantilan (2012) argued that during the second period there is a decline in inequality (Gini coefficient) in all the three regions of undivided Andhra Pradesh because the decline was marked in all three sectors, though the decline rate was more prominent in agriculture and industry sectors. Even the inequality elasticity in rural Telangana declines faster than the rural Andhra Pradesh.
Growth will be pro-poor if there is a reduction in poverty and equality along with the faster growth rate. Poverty reduction will take place through the increase in income of the poor. The income of the poor will increase through the employment opportunities. Hence, it is important to increase the income of that sector where the large mass depends on. In a developing country like India, around 50% of the population depends on agriculture. Hence, increasing the income of this sector plays a vital role in poverty reduction and achieving pro-poor growth. The income of the poor can also be increased through the rise in public spending and various welfare measures by the states. The whole set of literature available on the mechanism of poverty reduction can be classified into three heads: farm growth, non-farm growth and public spending. The studies by Ahluwalia (1978), Datt and Ravallion (1998), Eswaran et al. (2009) and De Janvry and Sadoulet (2010) emphasise on the role of the farm sector, especially the farm productivity in rural poverty eradication. Fan et al. (2000) and Hong and Ahmed (2009) look into the public spending and its impact on rural poverty whereas Foster and Rosenzweig (2004), Lanjouw and Murgai (2009) and Ravallion and Datt (2002) emphasise on the role of non-farm sector growth in rural poverty. The farm sector has a direct impact on the poverty reduction through the increase in productivity and agricultural wage, whereas non-farm sector has an indirect impact on rural poverty through the labour allocation from farm to the non-farm sector and its impact on agricultural wage and poverty. Public spending, especially on the welfare programme, resulted in reduction in poverty. There are hardly much literatures available on linking these above mentioned factors with poverty reduction for the state. To Mukherji and Zarhani (2020), the clientelistic politics can be transformed into programmatic politics in the state of undivided Andhra Pradesh in the post-reform period. The three major rural welfare programmes need-based redistribution, evolution of self-help groups and implementation of the right to work through the MGNREGA scheme functioning very well in the undivided Andhra Pradesh. Hence the factors causing a faster reduction in poverty during this period for the bifurcated state could have been a future research agenda for the researcher working in this area.
Using the unit level data of 61st and 68th rounds on Consumer Expenditure Survey of NSSO, this study has attempted to identify the economic disparities among different socio-religious groups in undivided Andhra Pradesh and its bifurcated states (Andhra Pradesh and Telangana) in the post reform periods. Main contribution of the study is to measure inclusiveness among the socio-religious groups and between rural and urban sectors. In what follows, the study finds that Telangana recorded a faster reduction in poverty in the period from 2004–2005 to 2011–2012. Andhra Pradesh constitutes around 70% of the total poor of the undivided Andhra Pradesh.
Furthermore, this study finds that religious and social diversity in India has an economic dimension. A comparison of the average consumption level of religious groups in the region shows that the average MPCE of Muslims is the lowest in both the rural and urban areas whereas among the social groups it is lowest among the SCs and STs. The population of SC and ST among the social groups and population of Muslim among the religious groups are more deprived, and are having HCR above the average in both the regions. Although there is a reduction in poverty for both the regions, still there are certain sections of population from socio-religious groups and certain regions, which are deprived, and hence the raising questions are obvious on the inclusiveness of poverty reduction. The immediate challenges are required to formulate and implement the ‘inclusive’ policies especially for these vulnerable groups to make poverty reduction inclusively. Therefore, people from marginalised sections must be included in mainstream of development. Nevertheless, public policy must be focused on the development of those marginalised groups.
Footnotes
Acknowledgements
The authors are grateful to Prof. R.V. Ramana Murthy and Dr Ranjan Kumar Nayak for their valuable comments during the preparation of the paper.
Declaration of Conflicting Interests
The authors declared no potential conflicts of interest with respect to the research, authorship and/or publication of this article.
Funding
The authors received no financial support for the research, authorship and/or publication of this article.
