



Abstract
The tracking of gross domestic product (GDP) as a measure of well-being of the society or human-being has been debated by many researchers and economists (Elizabeth, 2007; Abhinav, 2014; Deb, 2015) There are many deficiencies in tracking GDP as the economic development indicator, as it does not capture the inequality or true development of Human-being. Noted economist Mehbub ul Haq’s human development project defined a composite matrix which captures the life expectancy, education and per capita indicators in one matrix. This was developed to track as a development indicator of human welfare. In the previous studies, the GDP or GDP per capita was regressed with the Human Development Index (HDI) composite index and indicated a direct correlation between the two variables. However, this article examines the contribution of the income component in the HDI index by recalculating the composite matrix. This article also qualitatively examines the ability of HDI index to measure the human development parameters.
Keywords
Introduction
‘Just living isn't enough,’ said the butterfly, ‘one must have sunshine, freedom and a little flower.’ – Hans Christian Anderson
Economic wellbeing requires meeting various human needs, and includes the ability to pursue one’s goal, to thrive and feel satisfied with their life. (OECD, 2013)
The economic development of a country is the process of improving the well-being of people, whereas the economic growth is increase in gross domestic product (GDP). Noted economist Amartya Sen states that economic growth was just one aspect of the process of economic development. He argues that the ultimate objective of a government is to improve the material well-being of the society by adopting various economic policies. Different countries adopt different policies to improve the economic well-being of the society. However, majority of the countries primarily focus on the growth aspects of the country by improving the income which is measured in GDP or GDP per capita, and they show little interest in improving the economic well-being of the society.
Organisation of economic co-operation and development (OECD) advocates the importance of statistical measurement techniques for measuring the true economic development of a country, and it is increasingly relevant for the government to take policy decision to improve the country’s economic development. These matrices help each country to measure their progress in terms of the economic development and facilitate them to adopt policies required for further improving these matrices. The United Nations General Assembly also emphasised the importance of the economic development through a human centric approach. In the year 2015, they recommended sustainable development goals (SDGs) to measure the economic development of countries. These SDGs are tracked with the help of various matrices. Hence, it is important that the matrices used to track is a true reflection of the actual economic development. This article attempts to study the matrix called HDI (Human Development Index) published by UNDP on a yearly basis to measure the economic development of countries. The report ranks the countries based on their HDI scores.
Macroeconomics accounting standards such as GDP, national income does not directly measure the human or social well-being (OECD, 2013). Hence, human development or human well-being has always been a topic of discussion for the researchers and economists over a period of time. A happy and contended human being would be more productive and would contribute for the economic progress. While there are various dimensions to human well-being, the two broad classifications of human well-being include quality of life and material well-being (OECD, 2013). Historically, GDP or national income is considered as a measure of economic progress used by economists and statisticians. Many global research reports on human development argued and demonstrated with evidence that economic growth alone cannot bring human development. According to OECD, economic growth is necessary to make progress in human life but is far from sufficient as a sole condition for human well-being. As a result of many researches, economists suggested many matrices including the utility theory (Samuelson & Nordhaus, 2010) for measuring the human development progress. Finally, the breakthrough was brought in by the first publication of HDI by United Nations Development Program (UNDP) in the year 1990. HDI is a composite matrix which contains three normalised matrices in equal weight. The matrices included in HDI are education, health and per capita income. The HDI matric is published as a report by the UNDP on a yearly basis to measure the human development progress across different countries. The HDI data has been captured for 189 countries and ranked in the report published by UNDP. This report is widely acclaimed as a statistical measure for measuring the human development of a country.
However, in many countries including India, the most common measure used for measuring human well-being is GDP or per capita GDP, and this practice has been followed for more than 50 years (Stanton, 2007). The report card of the government is discussed and debated based on the GDP growth (Stanton, 2007). In her study on HDI, the author found that there is a positive correlation between income and UNDP published HDI. Hence, she argued that income will automatically take care of the HDI improvement. However, the author observed a highly concentrated and unequal growth and erratic HDI movement in some countries and she states that it was due to the failure of the government to take remedial measurement to correct the anomaly.
In a similar study conducted by Khodabakhshi (2010) using the HDI and GDP per capita of Indian states, he observed that, in spite of high per capita income growth, corresponding growth is not observed in the HDI growth, especially the life expectancy matrix failed to reflect the income growth.
Abhinav (2014) studied the HDI parameters of Indian states by separately ranking them based on Education Index, Health Index, Income Index and HDI. The author observed disparities in the rank of various states. He recommended that HDI indicator needs to be tracked closely, and concerted actions should be taken in terms of HDI improvement programs by the respective states to improve the economic well-being of society. Deb (2015), in his cross-country study of GDP and HDI indicators, infers that societal progress and GDP growth can be significantly different. He argues that GDP fails to depict important parameters such as human progress, utilisation of natural resources and environment; however, he is also of the view that HDI fails to depict key parameters such as income distribution and inequality. Based on his study on 140 countries, he inferred that at an aggregate level there is a strong correlation between GDP per capita and HDI. However, the causality is varying when a similar testing is carried out after segregating the countries to various income groups. The relationship is weaker in countries in middle income group.
Based on our literature study, we observed that most of the researchers highlight the importance of HDI matrix to track the human development. However, two authors criticised the effectiveness of the HDI to measure human development. One common deficiency we observed in the previous studies is that, while the researchers argued for and against the HDI matrix, there is no effective qualitative study carried out on the HDI index to substantiate its effectiveness or its deficiency. Apart from that, in most of the studies, the causality study is carried out on GDP per capita and HDI which we feel will provide an incorrect estimate due to the presence of income component in both the regressor and the regressed. In this study, we attempted to use more appropriate econometric tools to validate the causality coupled with a qualitative study on the HDI index. We have also carried out a cursory study on other human well-being index such as happiness index (John et al., 2018, 2019), suicidal rates (WHO, 2017) and work–life balance to corroborate the effectiveness of HDI for measuring human development.
Methodology and Data
This study uses the HDI data and GDP per capita. The HDI data was obtained from the yearly report published by UNDP and the state’s HDI data was obtained from the sub-national HDI data published by Global Data Lab. This is a panel data, and it contains time series data of 16 years and data for 36 different cross sections. The cross sections are individual states and union territories of India.
About Human Development Index
The HDI report was first published by UNDP in the year 1990. This report carried the country level data of human development indices of various countries. These indices helped the researchers and international organisations to assess the prosperity of a country in terms of human development. The HDI is tracked for a span of time, and peer comparison with other countries is also possible since this matrix was tracked uniformly across the countries. This would help countries to compare their progress with other countries in terms of human welfare. The HDI data trend over a period of time indicates the progress of the country towards the human development front. This report encourages the critics and researchers to question if the policies adopted by the country are favourable for the development of human well-being. HDI is considered as a statistical methodology for measuring the indicators that reveal the development of human beings quantitatively. The HDI has three dimensions: long and healthy life; knowledge; and decent standard of life. The longevity and education are valuable ingredients of a good life and also considered as constituents of capability to do other things (Anand & Sen, 2000). Since HDI captures three indicators, it is considered as a composite matrix that tracks human development from commodity centred to human centred.
In HDI, the life expectancy at birth is calculated by an index of population health and longevity; knowledge and education is calculated as adult literacy rate; and standard of living is calculated by taking log of GDP per capita at purchasing power parity.
Indicators and Dimension Index of IHDI.

Indicators and Dimension Index of IHDI.
The matrix used for analysis in the article is IHDI. However, to simplify and align with the convention used by the UNDP the matrix is mentioned as HDI throughout in this article.
The composite matrix HDI is created by combining with equal weightage the three normalised individual matrices namely inequality adjusted life expectancy index (IHDI), inequality adjusted education index and inequality adjusted GDP per capita index. In order to arrive at the equal weight composite matrix, the three individual matrices are multiplied first and cube root of the resultant matrix was taken. The final HDI matrix is arrived as follows:

Note: LEI is 1 when life expectancy at birth is 85 and 0 if life expectancy at birth is 20.

where MYSI is mean years of schooling index = MYS/15 (15 years of education is the projected maximum of this indicator for year 2025), and EYSI is expected years of schooling index = EYS/18 (18 is the time period required to achieve master’s degree in most countries).

Income Index (II) is 1 when GNIpc is 75,000 and 0 when GNIpc is 100.
The HDI is the geometric mean of the aforesaid three normalised indices.

In the HDI composite matrix, each of the individual matrix is given equal weightage by taking the geometric mean.
Re-computation of HDI Data for Analysis
As mentioned in Table 1, the HDI matrix published by UNDP (UNDP 1990–2018) is a composite matrix which has three dimensions, which includes inequality adjusted life expectancy, inequality adjusted education index and inequality adjusted GDP per capita index. The composite matrix is created by multiplying all the three dimensions and taking nth root of the product. This computation ensures equal weightage for all the three dimensions in the composite matrix.

In our literature study, we observed that the statistical analysis carried out in the previous studies had a major deficiency. In most of the studies, the HDI composite index is regressed with the GDP or GDP per capita index. In such a causality study, both the regressor and the regressed have income component which we feel will give an incorrect estimate. In order to remove this anomaly, we have recomputed the original HDI index published by UNDP. The re-computation is carried out by removing the income component from the original HDI matrix. After removing the income component, GDP per capita, we have multiplied the inequality adjusted life expectancy and inequality adjusted education index and taken the nth root of the product. This computation gives equal weightage for the education and life expectancy dimensions in the composite matrix.
The recomputed matrix is given in Eq. (6):

This recalculated composite index is regressed with the normalised income index for our analysis.
Stationarity Testing of Panel Data
The data used for analysis is a panel data, and it contains 28 years of time series data and 37 different cross sections. The cross sections are individual states and union territory of India.
A regression testing assumes that the underlying time series is stationery. Presence of non-stationary time series in the data may lead to the phenomenon of spurious regression. Thus, the R2 value we obtain may not be reliable for analysis. In order to assess if there are non-stationary time series in our data, we have carried out the augmented Dickey-Fuller test on both the revised HDI and GDP per capita. The test result is given here:

Alternative hypothesis: stationary

Alternative hypothesis: stationary
Based on the testing, we have observed that both the data points have a Dickey-Fuller coefficient < 0 with lag order of 10 and p-value < .05. This result helped us to determine that both the data sets are stationery and can be used for regression analysis.
One of the main advantages of panel data as opposed to a pure time series or cross-sectional data is that, by combining time series of cross-sectional observations, panel data gives more informative data, more variability, less collinearity among variables, more degrees of freedom and more efficiency (Gujarati, 2012). However, one of the major pitfalls of panel data is its heterogeneity. In our data, there are 37 individual states time series data; hence, we suspected heterogeneity of panel data formed by individual states. One of the easiest ways to test the heterogeneity is by using a visual technique like scatter plot. We have carried out a visual study to observe the heterogeneity of the data by a scatter plot.
The scatter plot of the individual cross section is depicted in Figure 1. The x-axis is the revised HDI and y-axis is the Income Index. The data shows differing patterns for different states; hence, we decided to check the heterogeneity of the data.
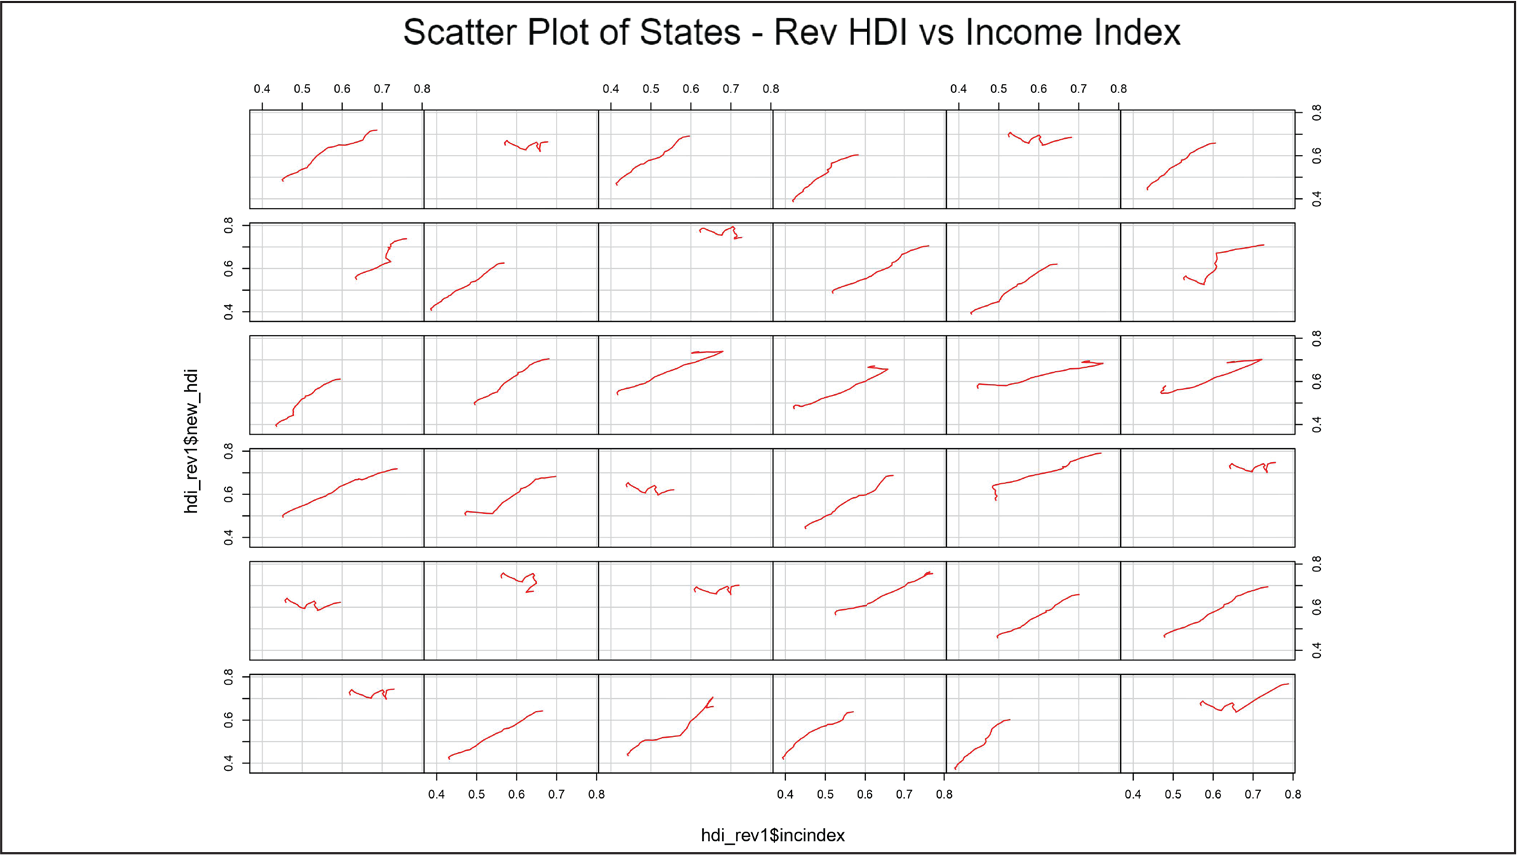
We have further plotted the heterogeneity graph groped by states and years (refer to Figures 2 and 3).

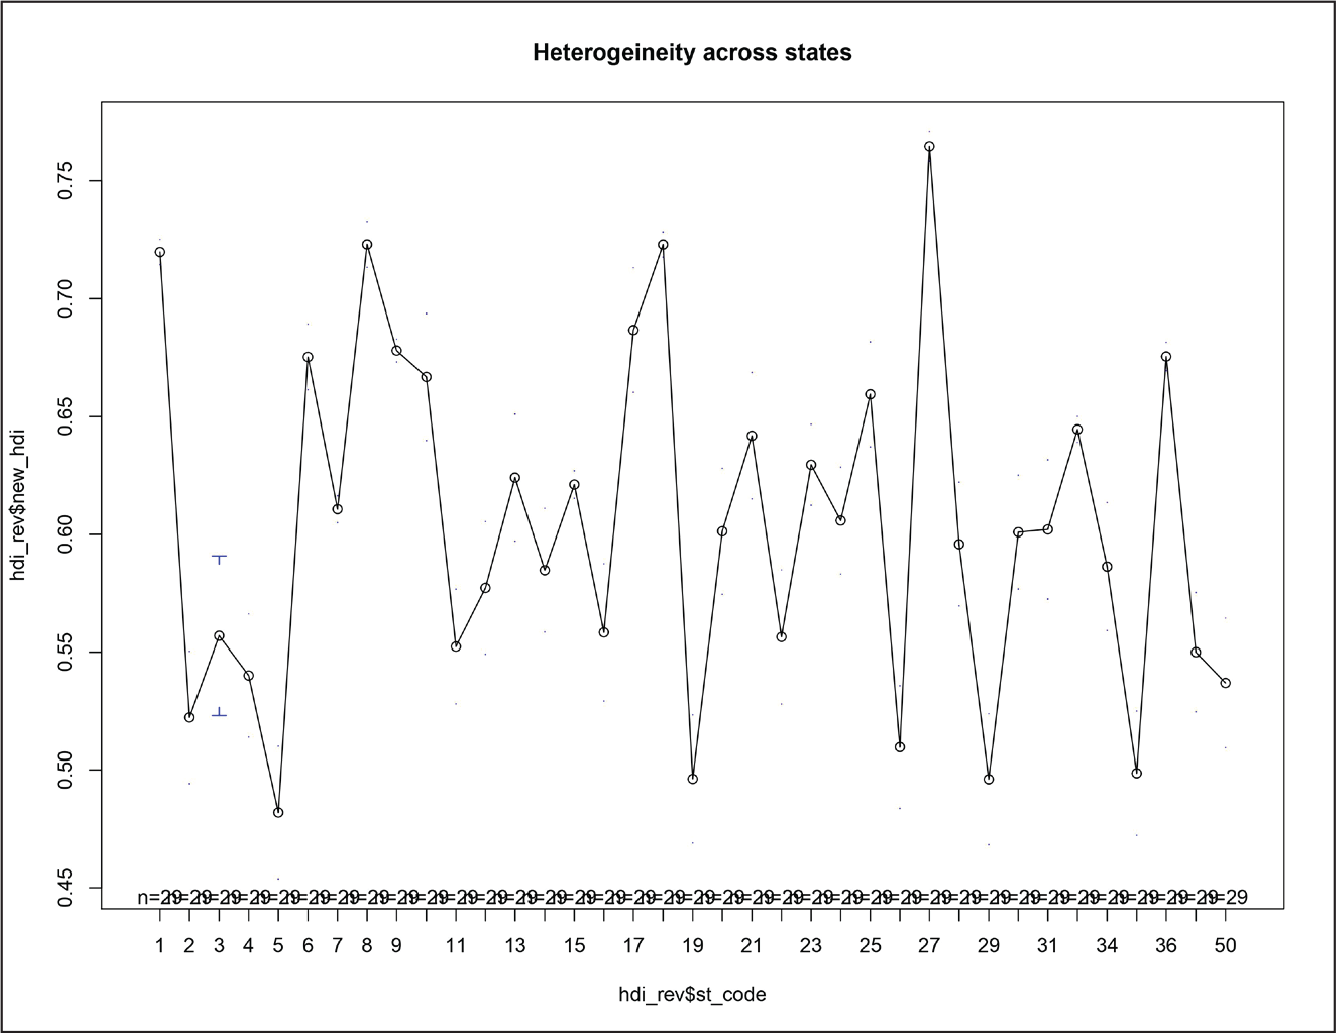
The graph grouped by years shows a linear pattern; however, the graph grouped by states is not in a linear form. The few options we have for carrying out the panel data analysis is by carrying out the OLS method 37 times for each and every state separately. This estimation technique is very cumbersome and will have only very few degrees of freedom to do a meaningful statistical analysis. The second option available is the pooled OLS estimation. In this estimation technique, we can pool all 1,036 observations (28 years × 37 states/UT) neglecting the dual nature of time series and cross-sectional state data. The disadvantage of this estimation is that we have to neglect the dual nature of the data and also, we have to assume the coefficients across time and cross section remains the same. The next best option is to estimate using fixed effect least-square dummy variable model. This estimation technique allows each state level data to have its own intercept. This technique also helps to nullify the effect of heterogeneity in the data of the 37 states since each state will have its own intercept. Fixed effect least squares dummy variable (LSDV) model equation is given as

where αi (i = 1…n) is the unknown intercept for each state; Yit is the dependent variable (HDI) where i = state and t = time; Xit represents independent variable (Income or GDP per capita); β1 is the coefficient for the GDP per capita; αi is the individual/time invariant characteristics of the state; and uit is the error term
In the fixed effects, LSDV estimation model, a reference or benchmark is taken and the individual factors are compared with the reference category. But in our estimation technique instead of taking the reference category we have computed the coefficients of all the states by tweaking the R plm package formula. Therefore, in our regression output, the individual factor coefficient became the intercept of the respective factor called states.
Test Result of New HDI Data and per capita income using fixed effect least squares dummy variable (LSDV) model


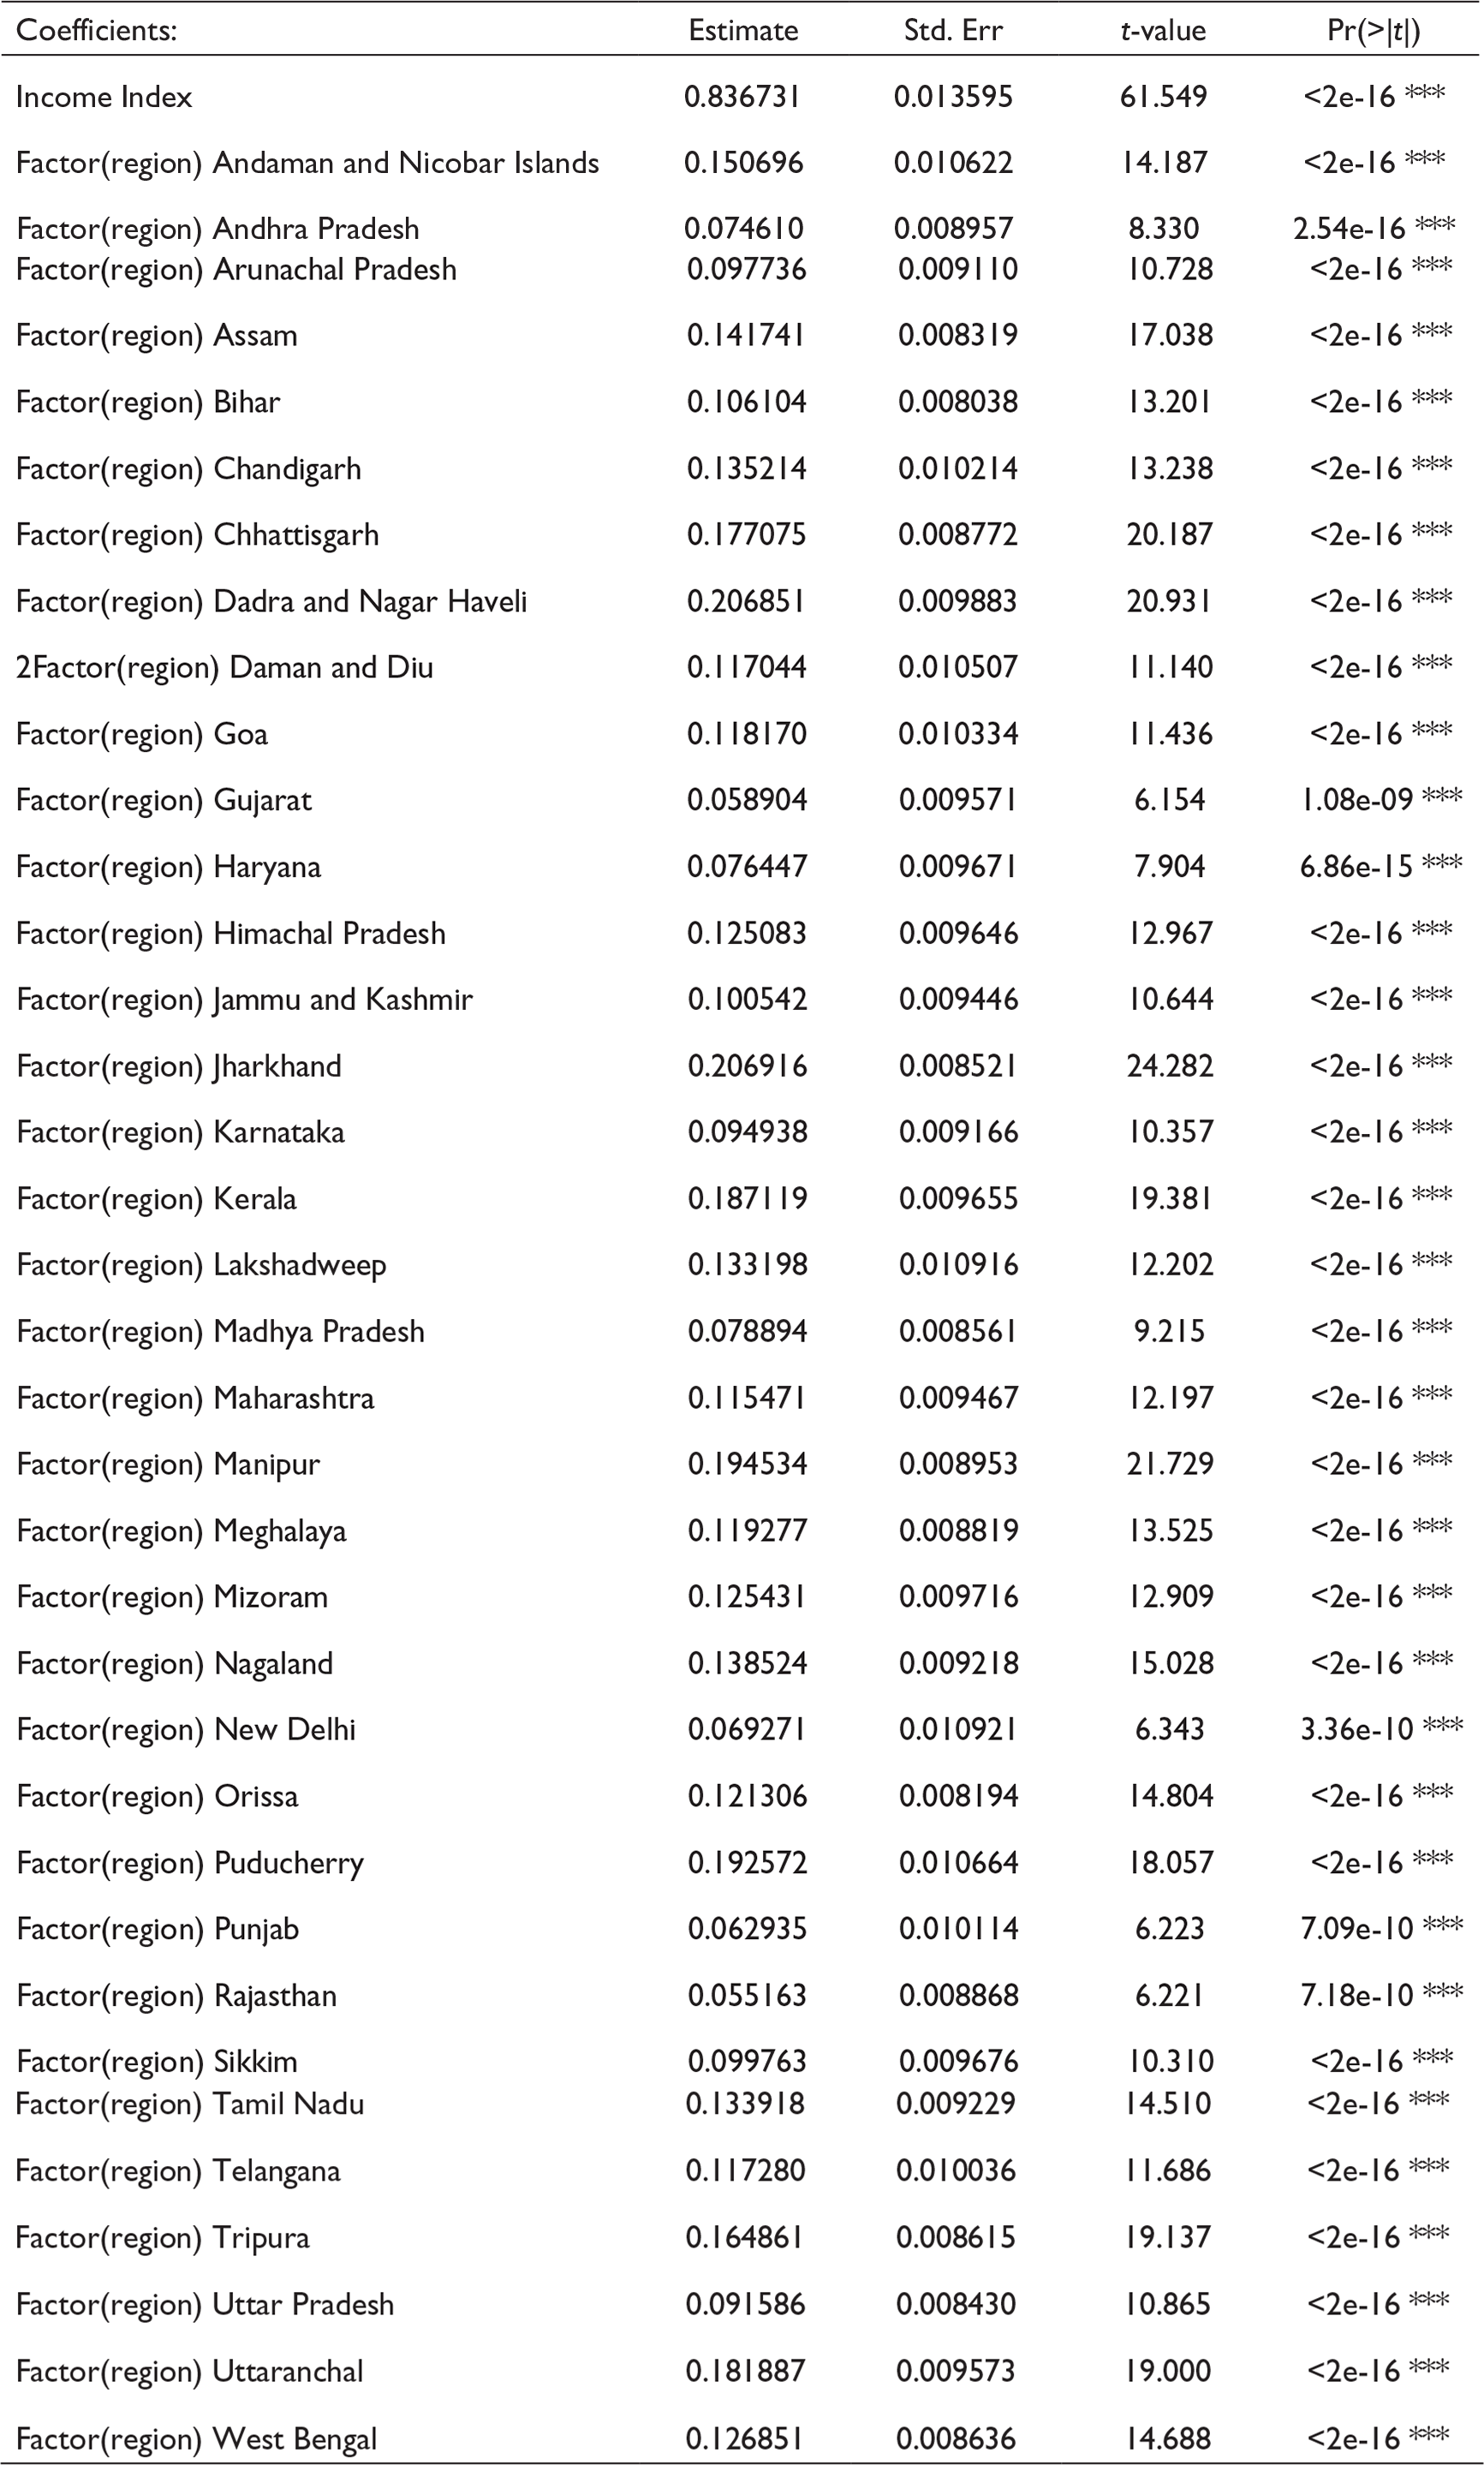
The least square dummy variable (LSDV) test result shows that there is significant relationship between revised HDI and GDP per capita. However, we have observed a lot of variation between the states. This variation is stemming from the fact that, our country cannot be considered as a homogenous country, different states shows different change in HDI with respect to change in income. The primary reason for this variation is due the fact that, different states adopt different policies for their development. The variation in HDI between states also corroborates the fact that HDI is the combined effect of both central government and state government policies. However, historical reasons also cannot be ignored as some states like Kerala have very high HDI from the very beginning itself. In our case, the first data point taken for the analysis is from the year 1990.
From the significance measure of all intercepts, we could infer that the coefficient, per capita income is significantly impacting all the states. While this is said, the LSDV method suffers from few drawbacks. The too many dummies may lead to multicollinearity, which make precise estimation difficult. In this estimation, the assumption is that the variance of the error term is same which is not true. Also, in the LSDV method, there will be time invariant regressors.
One way to avoid the above scenarios is to use the regressors and regressed in the equation as deviations from their respective group mean values and run the regression on the mean corrected values. This type of analysis can be carried out by a technique called within group estimation (WG). The within group estimators use the time variation within the cross-sectional data; hence, the estimation method removes the individual characteristics and time invariant regressors that may be present in the individual cross-sectional data of states which makes the model more efficient.
Fixed effects LSDV model within estimator equation is given as

Dividing the equation by (T =16) and by averaging, the t will get cancelled

Subtracting Eq (9) from Eq (8), we obtain

The individual/time invariant characteristics of the state will get cancelled out. The LHS is called the time-demeaned Y and the equation is called time-demeaned equation.



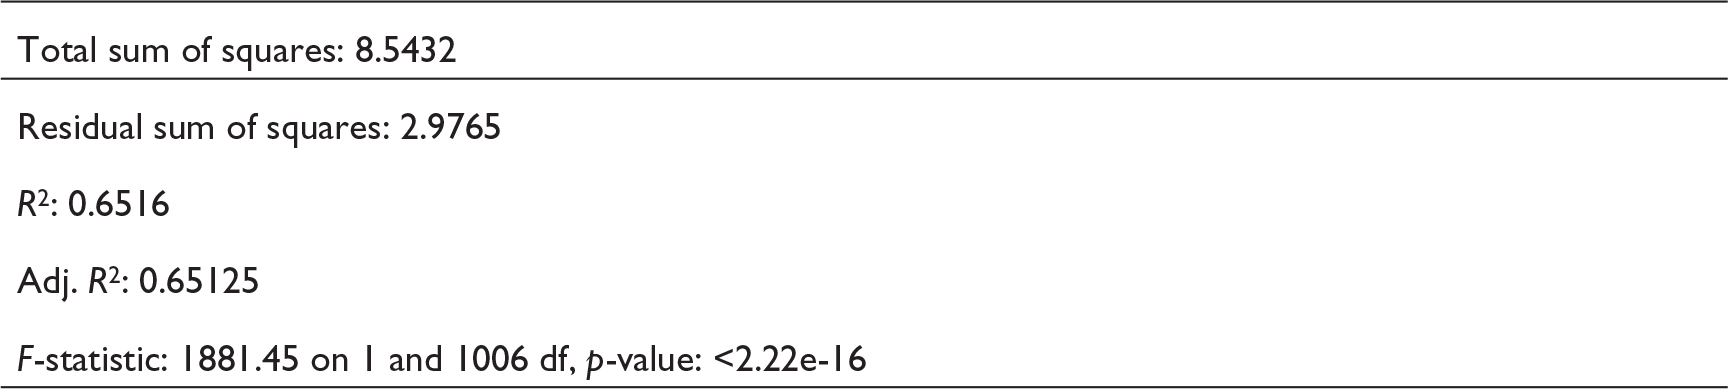
In the LSDV model estimation the R2 is 0.9979, whereas in the fixed effect WG estimation, the R2 is 0.65125. This shows that there was correlated error terms in the panel data estimation using LSDV model which got nullified when we used fixed effect WG estimation technique.
In the fixed effects model, the state specific coefficient α is time invariant and fixed for each state. However, in random effects model, the state-specific coefficient α is assumed as a random variable with a mean value of α with an intercept ε. The differences in the individual values of the intercept for each individual state are reflected in the error term.
Hence, in random effect model, the total error term is expressed as

where ε is the cross section or state specific error term, and u is the combined time series and state level cross section error term.
In a random model, the individual error component is not correlated with each other and is not autocorrelated across both cross section and time series units. Even ω is not correlated with regressors. If there is any correlation, the random model turns out to be an incorrect estimation. Hence, a popular test called Hausman test is carried out to determine which testing methodology is appropriate for this panel data.




In order to identify which model is the best suited for this study, we have carried out Hausman test.
Hausman Test Result is to test the best methodology for this study (Fixed Effect Within (WE) V/s Random Effect (REM)

From significance (p-value) of Hausman test we could conclude that fixed within is a better testing methodology than the random effect method.
Qualitative Study of HDI
The quantitative study is carried out to examine if there is a relationship between the variables GDP Per capita and revised HDI. However, we felt the need of a qualitative study of the indicator to examine if it is a true indicator of human well-being. In order to carry out the qualitative study, we examined the research papers of OECD, calculation methodology of HDI and the evolution of HDI. The literature includes the historical debates on the human well-being measurement and resultant development of the HDI indicator which was then advocated by UNDP to measure the human well-being of nations.
Historically, the prosperity of the country was measured by the national income of that country. The most common measure used by majority of the countries is GDP. The OECD defines GDP as ‘gross value of production equal to the sum of the gross value added of all residents and institutional agents engaged in production’. GDP measures the overall wealth of the country.
GDP is given as:
GDP = Consumption + Government Expenditure + Investment + Exports – Imports.
Attributes that Result in Higher Economic Well-being as Per OECD.
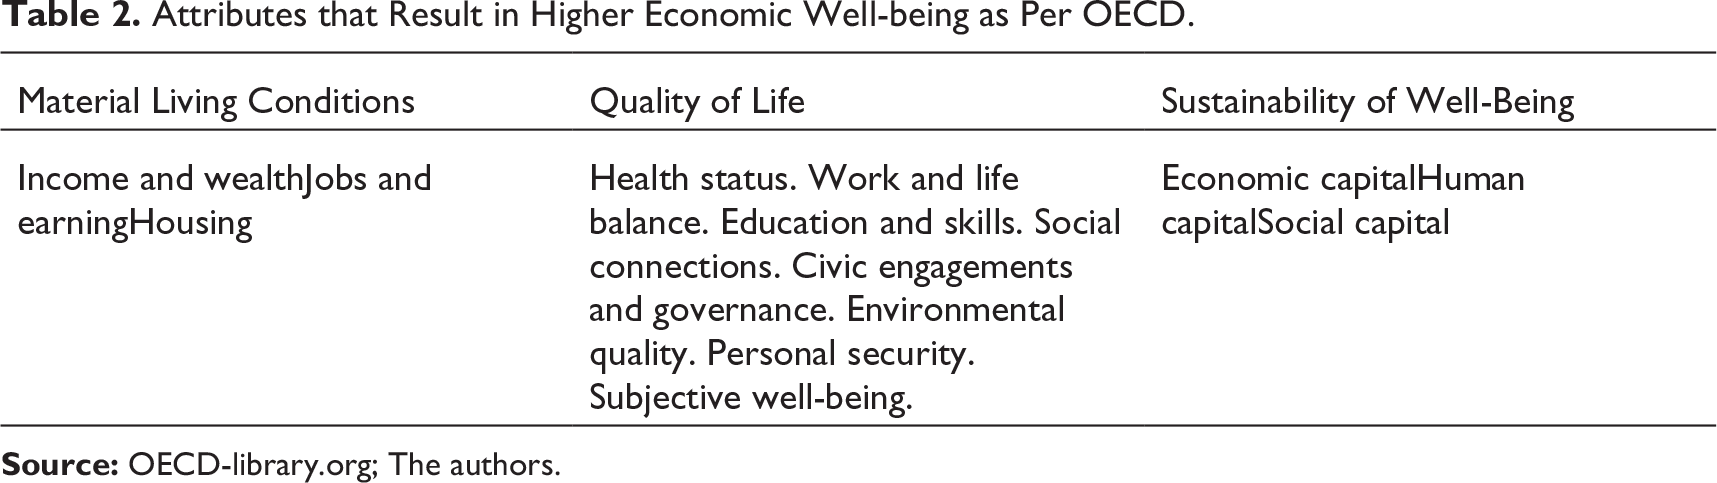
While it is very complex to measure all the aforesaid attributes and determine the human well-being, economists felt the need of a single matrix which can be used for intercountry comparison and measure the progress over a period of time. Therefore, in the absence of a single matrix, for a long period of time, the accepted matrix for measuring the state welfare was carried out using GDP per capita.
The breakthrough to this debacle was first addressed when UNDP released the first report of HDI in the year 1990. This matric was first devised by a noted economist Mahbub ul Haq along with Meghnad Desai and Gustav Ranis. Later refinements were carried out on the original HDI and now the measure has transformed into IHDI. The UNDP publishes the HDI report periodically showing the year-on-year HDI scores and comparisons of different countries.
Analysis of Human Development Index
The HDI report was first published by UNDP in the year 1990. This report carried the country level data of human development indices of various countries. These indices helped the researchers and international organisations to assess the prosperity of a country in terms of human development. The HDI can be tracked for a span of time and also peer comparison with other countries is also possible which would help a country to compare their progress with other countries in terms of human development. The HDI data points over a period of time would indicate the progress of a country towards the human development front. This report encourages the critics and researchers to question if the policies adopted by a country are favourable for the development of human well-being. HDI is considered as a statistical methodology for measuring the indicators that reveal the development of human beings quantitatively. The HDI has three dimensions: long and healthy life; knowledge; and decent standard of life. The longevity and education are valuable ingredients of a good life and also considered as constituents of capability to do other things (Anand & Sen, 2000). Since HDI captures three indicators, it is considered as a composite matric that tracks human development from commodity centred to human centred.
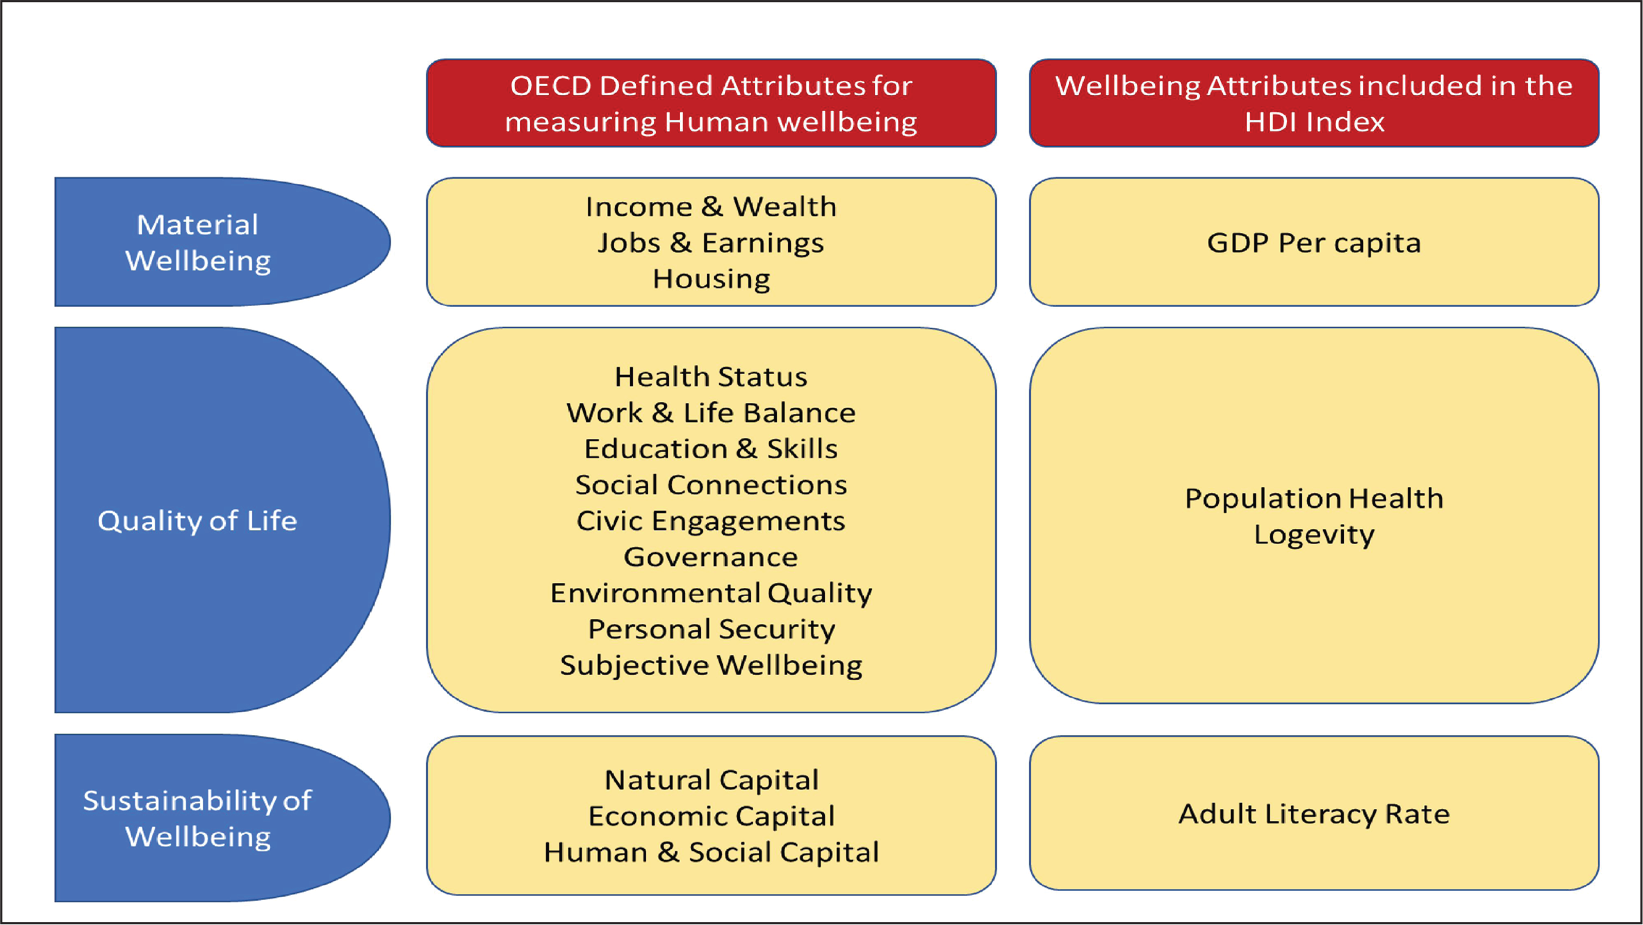
Figure 4 depicts the comparison of the attributes available in the HDI and the attributes ideally required to measure the human well-being as per original OECD definition. The mapping shows a huge gap between the attributes currently measured in the HDI and the attributes actually required for measuring the human well-being. The deteriorating work–life balance, declining happiness quotient (John et al., 2018, 2019), increasing suicidal rates (Dandona & Anil Kumar, 2016; WHO, 2017), gender disparity and income inequality are indicators for declining human satisfaction. These attributes are not measured in the HDI matrix. The sustainability is another important factor highlighted by OECD among the attributes for well-being. The HDI matrix does not measure common ill effects of GDP growth such as water pollution, contamination of rivers and air pollution, which are important factors for sustainability.
HDI vs Happiness Index
Figure 5 depicts the relationship between HDI and Happiness Index of 132 countries. There is a strong relationship between HDI and Happiness Index with an R2 of 0.70, which shows a very good correlation between two variables.
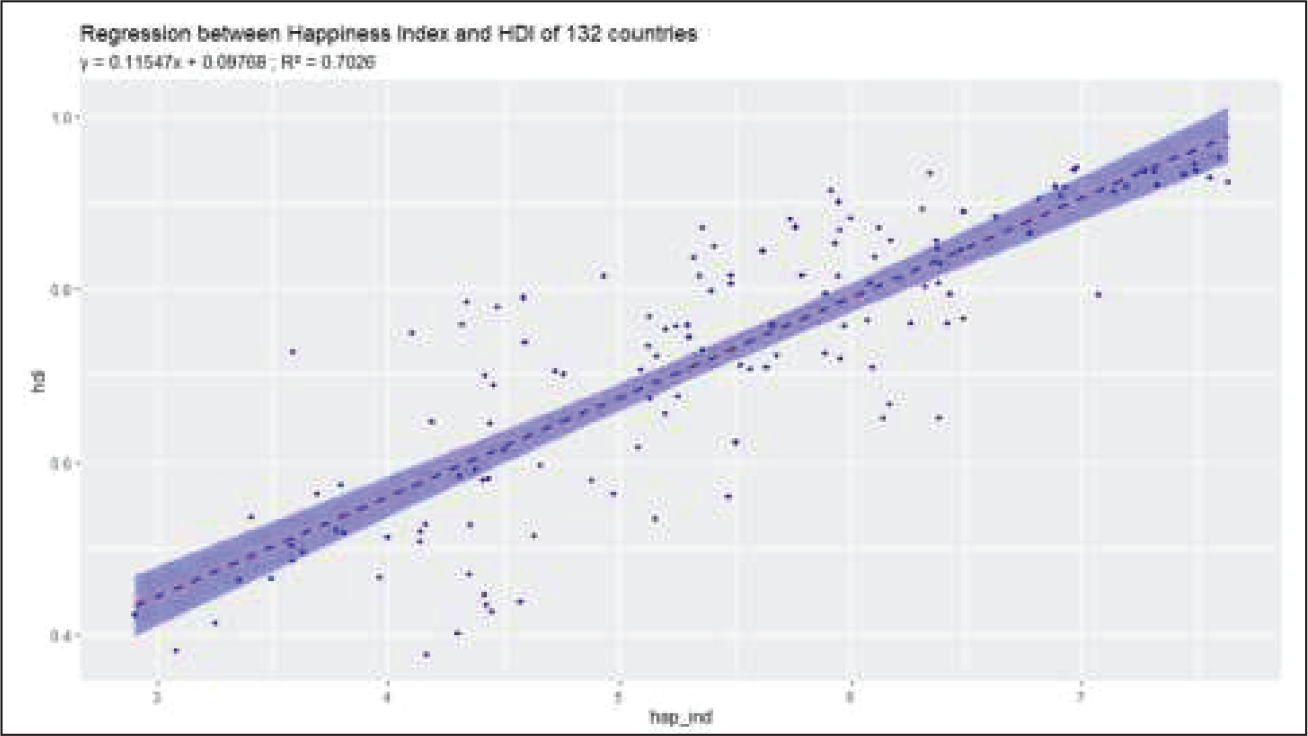
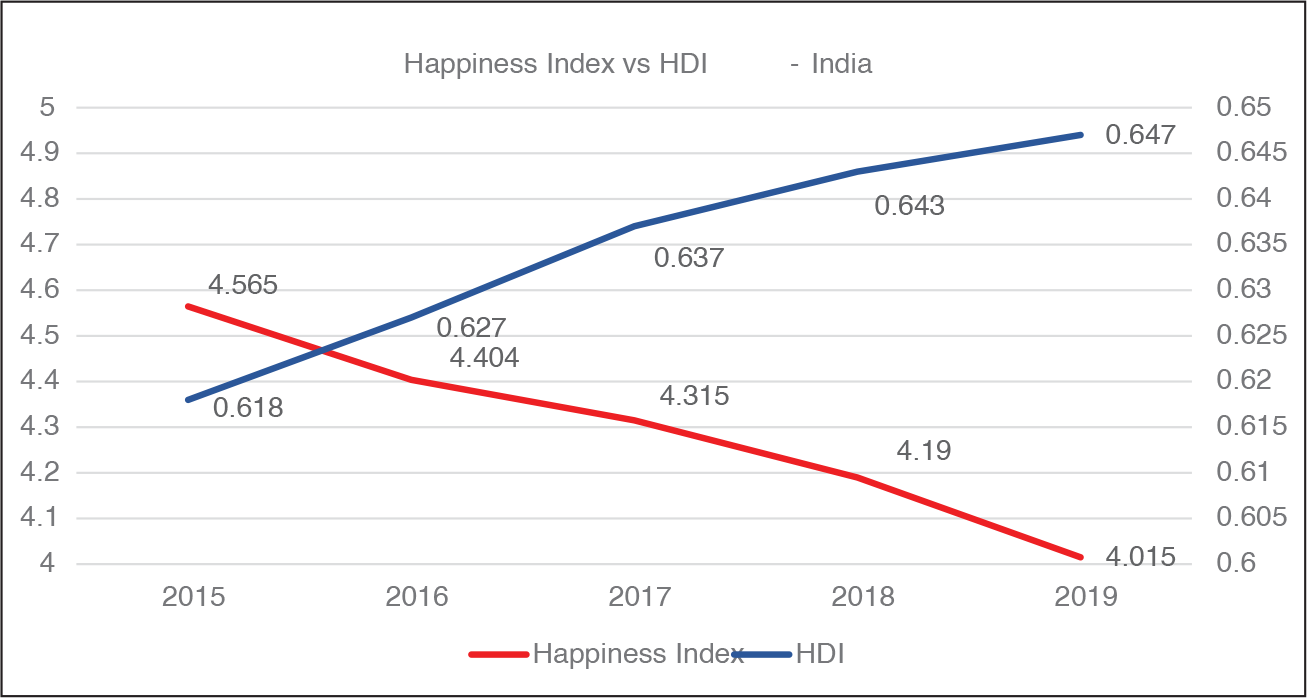
Figure 6 depicts the trend of Happiness Index and HDI of India from 2015 to 2019. The HDI of India has improved consistently from the year 2015 to 2019, whereas the Happiness Index has consistently declined from the year 2015 to 2019.
The Happiness Index report states that the happiness quotient is correlated with many other variables which includes GDP per capita, social support, healthy life, freedom to make life choice, generosity and perception of corruption. As per 2019 World Happiness Report, the 25% of the happiness of a country is explained by income/GDP per capita. From both these analyses, it is evident that income plays a significant role in the human welfare. Therefore, it is questionable that HDI can measure human welfare which the income or Happiness Index cannot.
Inference, Limitations and Future Work
Historically, the prosperity of a country is determined by measuring the national income of that country. However, as per OECD (2013) several countries showed a huge disparity between growth in income and human development, some countries showed significant human development with lower growth in income, whereas some countries showed lower human development despite higher growth in income. Hence, as per OECD, it is imperative to measure and track the HDI matrix separately, in addition to income growth, and take policy decisions to enhance the human well-being.
The regression analysis carried out for India shows that the GDP per capita growth is significantly correlated with the HDI growth with an R2 value of 65%. When we carried out a similar regression between Happiness Index and HDI, we observed a significant relationship between both the variables with an R2 value of 70%. Hence, in our view, we need not have to worry much about the HDI in terms of matrix; the income growth itself will take care of the HDI improvement from Indian context.
The data of HDI and Happiness Index of India from year 2015 to 2019 moved in opposite direction. If the HDI is a matrix tracked to measure human welfare and resultant human satisfaction, then we feel HDI composite matrix failed to capture some variables which can really measure the human satisfaction.
We examined the ability of HDI to measure the well-being by carrying out a one-to-one mapping of the original and ideal attributes of human well-being as defined by OECD with reference to the human well-being attributes currently available in the HDI published by the UNDP (Figure 4). From the mapping we could see a significant aberration of the required attributes and the attributes currently measured in the HDI indicator. We suspect that the absence of these attributes could be one reason why HDI of India is showing a continuous improvement and positively correlated with the GDP per capita, whereas some of the independent human well-being indicators like Happiness Index are showing a declining trend.
Hence, from an Indian standpoint, we feel that HDI matrix requires significant improvement to measure the well-being of the country. Therefore, the claim of UNDP that this indicator can be used as a single measurement scale to measure the human development and its ability to compare the human development between countries loses its credibility, because if the other human well-being attributes such as suicidal rates, work–life balance, happiness quotient, civic engagements and governance are included in this matrix it may altogether show a different picture. Furthermore, the absence of attributes related to sustainability and ill effects of GDP growth such as environmental pollution, air quality and contamination strengthen our views. Hence, our view is that this composite matrix can be a good scale for measuring the human well-being of many countries but not for all. If at all this has to be used as a scale to measure all countries in the world map, the matrix requires significant improvement.
In this study, we made inferences and have given our views on HDI indicator and its ability to capture the true development of a nation. However, this study is bound by some limitations in terms of data used for the analysis. This study is confined to India HDI and GDP per capita data, which may not truly reflect the characteristics of HDI. Hence, we feel that similar kind of studies are required with the data of other countries, which will help draw a more comprehensive inference.
In the recent past, the UNDP and economic fraternity have been giving a lot of importance to the sustainable development goals to improve the human well-being. In order to measure the sustainable development goals, it is important for us to have a reliable statistical matrix to measure the progress of the goals. HDI matrix is one of the most common matrices used by UNDP to measure and compare the human well-being across countries in the world. We have examined analytically and qualitatively the effectiveness of this matrix in measuring the human well-being. The data taken for carrying out the analytical study is the recomputed HDI and GDP per capita of Indian states for the past 29 years.
Based on the analytical study conducted on the data of Indian states, we inferred that GDP per capita has a strong correlation with reference to the revised HDI indicator. Hence at a high level we can infer that, from India’s perspective, growth in income itself will take care of the HDI growth; hence, we do not require a separate tracking or study of this indicator and also need not frame policy changes based on the HDI. However, based on our further examination of HDI attributes with reference to OECD’s originally defined human well-being attributes; we feel that the degree of relationship revealed in correlation study alone cannot be a determining factor to conclude that the GDP per capita growth itself will take care of the human development or HDI growth. Because we feel that the HDI measurement methodology requires significant improvement in terms of including more human well-being indicators to get a better picture of the human well-being of a country. This enhancement is also required to improve the credibility of the HDI for cross-country comparison. Besides, we observed a strong correlation between the HDI and Happiness Index of 132 countries, whereas the data of Indian HDI and Happiness Index is moving in opposite directions, which corroborates our viewpoint that HDI cannot be used as a common matrix across countries for cross-country comparison to measure human welfare. While this is said, this study has a limitation of the data being used for statistical inference as this study covers only the Indian data.
Footnotes
Acknowledgements
The exploration of an opportunity sometimes claims versatile guidance and the authors were fortunate enough to get it from Dr R. Srinivasan, Registrar, University of Madras; Dr Santosh Kumar Sahu, Assistant Professor, Department of Humanities and Social Sciences, Indian Institute of Technology, Madras; Dr. Durairaj Kumarasamy, Consultant at ASEAN India Centre, Research and Information System for Developing Countries (RIS); Dr T. Aathy Kannan, Assistant Professor, Economics, DRBCCC, Hindu College. The present research is an outcome of their insights and expertise that greatly assisted in lending shape and substance to the work. The authors would also like to extend their immense gratitude to Mrs Tiny S. Palathara and Mr S. Kamalnesan, Research scholars, University of Madras for their valuable feedback during the course of the research work. Authors are also grateful to Ms E.C. Beena, Research Manager, CMSR Consultants for proofreading the document. Authors are grateful to the anonymous referee of the journal for the comments on the earlier version of the article. Usual disclaimers apply.
Declaration of Conflicting Interests
Funding
The authors received no financial support for the research, authorship and/or publication of this article.