



Abstract
Regulations are put in place in the capital markets to protect the interests of investors while promoting companies to actively participate in the capital markets. This multidisciplinary study concentrates on analysing the impact of one such regulation, based on entry norms, on the initial returns of book-built IPOs in the presence of firm-related and issue-related control variables, thereby facilitating decision-making to issuers and investors.
Using various parametric and non-parametric tests on 259 IPOs issued on Indian Stock Exchanges during financial year 2009–2010 to 2019–2020, it can be concluded that Indian IPOs are underpriced on an average, irrespective of the entry norm followed. Further, firms entering through either of the entry routes, that is, profitability route or Qualified Institutional Buyer Route have significant differences in age, listing delay, type of sale, rank of lead managers and industry. Entry norm is established to have a negative yet insignificant role in determining the initial returns, while oversubscription is the only variable with a positive and significant impact on the initial returns of the issue.
Keywords
Introduction
Initial Public Offering (IPO) is raising funds from the public by issuing a firm’s shares for sale for the first time. It is considered one of the most crucial decisions during the lifecycle of the firm (Latham & Braun, 2010). Various theories explain the motivation of firms to go public—windows of opportunity theory (Ritter & Welch, 2002), life cycle theory (Rajan & Zingales, 1995), refinancing theory (Rock, 1986) and market timing theory. Generally, IPOs are priced either of two ways—fixed price offer method or book building method. The former involves setting a fixed issue price after evaluating the financial performance of the firm and the market conditions of the economy. While the latter involves setting the price after receiving bids from the investors.
In India, the IPO market is well-established and is regulated by the Securities and Exchange Board of India (SEBI). Issuers, along with hired lead managers, decide on several aspects of the IPO such as pricing, preparation of documents and prospectus, listing information and allotment of shares to different sets of investors, namely—retail individual investors (RII), non-institutional investors (NII) and qualified institutional buyers (QIB). Rock (1986) and Welch (1992) bifurcates these investors into informed (i.e., QIBs) and uninformed investors (i.e., RIIs). It causes information asymmetry and the tendency of the uninformed investors to follow the informed investors hoping for better returns. In terms of performance, India’s IPO market trends have been satisfactory compared to other parts of the world. It was ranked sixth worldwide in terms of quantum of IPO issued in 2019 (Ernst & Young, 2020). Figure 1 depicts the quantum and volume of IPOs issued in the last decade in India.
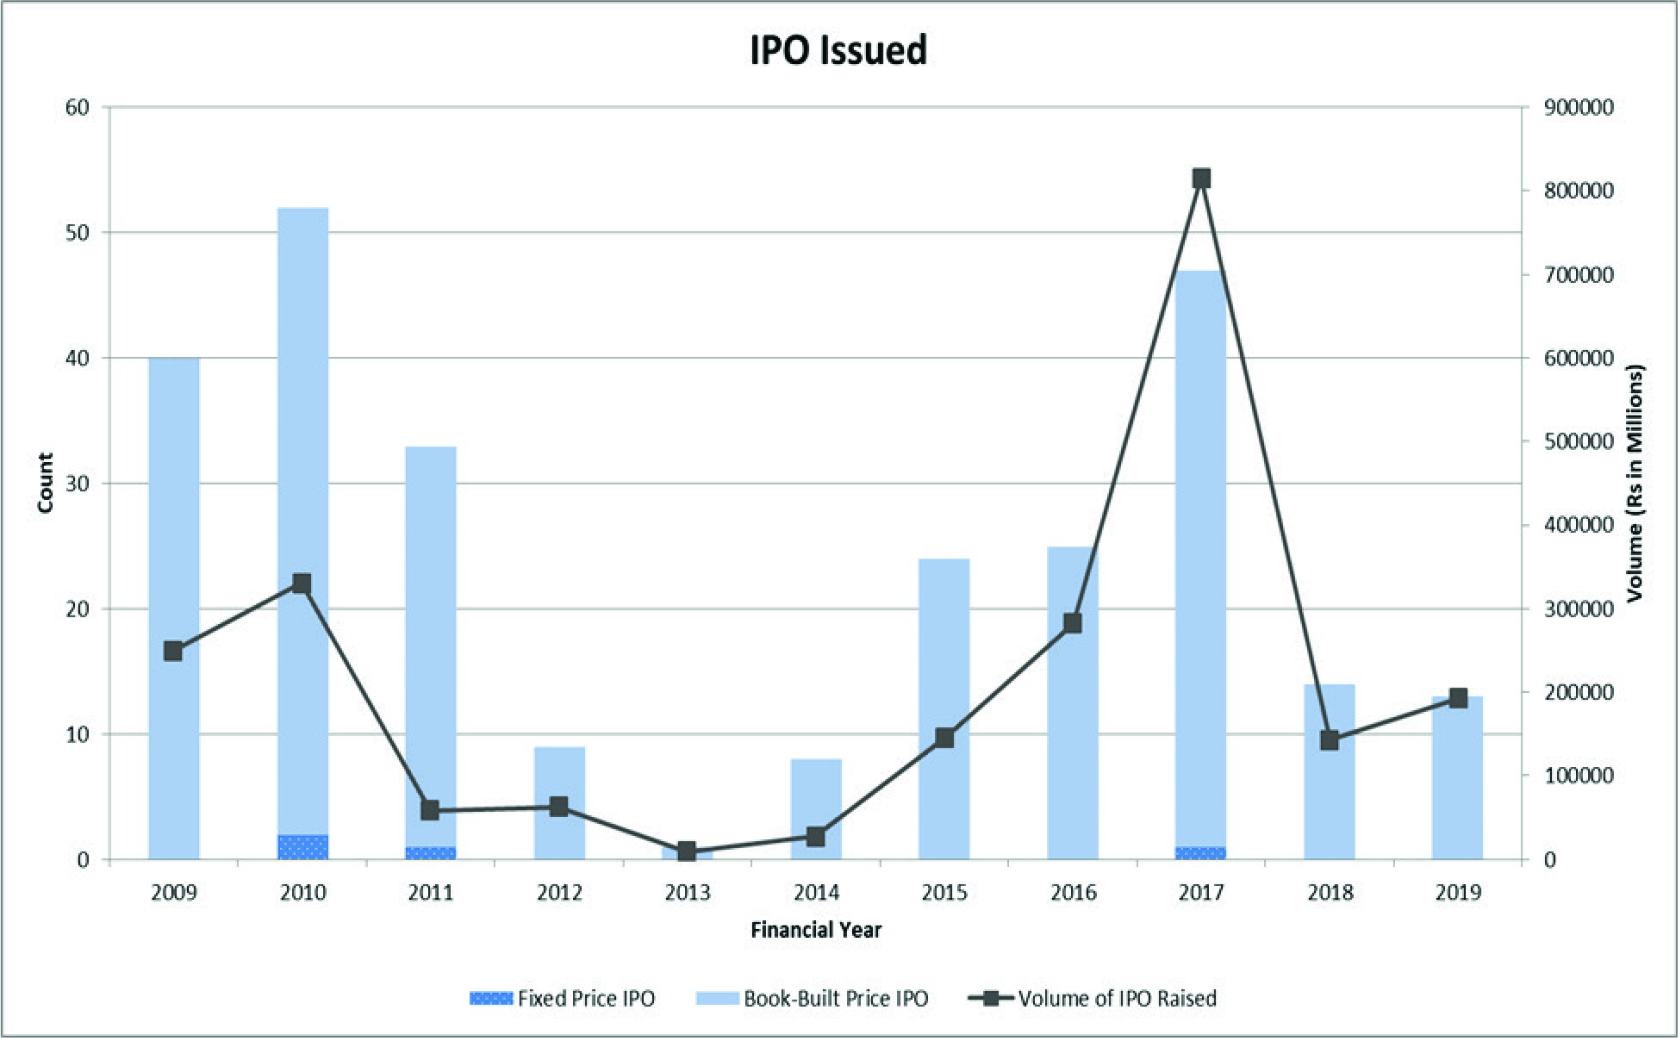
One of the reasons for the substantial volume raised is the regulations implemented by the SEBI for smooth markets’ administration. Regulations mandate adherence to the issuing and listing norms by the market participants to ensure transparency, uniformity and protection. Regulations that govern the Indian primary market, majorly, are the SEBI (Issue of Capital and Disclosure Requirements) Regulations, 2009 (SEBI (ICDR), 2009), (SEBI, 2018) and SEBI (Listing Obligations and Disclosure Requirements) Regulations, 2015. These regulations instil the investors’ faith in the Indian primary market, leading to high volume and subscription levels. But it also poses an intriguing research question—‘Do regulations impact the initial returns of the initial public offerings issued in the Indian primary market?’ The present study examines the same.
Literature on regulation and its impact on IPO performance is scarce. Our study is the first of its kind and fills this research gap. It carries out an extensive empirical analysis to discover the effectiveness of the regulations. Moreover, it examines the underpricing decadal trends post the Financial Crisis of 2007–08. The study also attempts to test the information asymmetry theory and cascade theory, arising out of different share allocation ratios to investors.
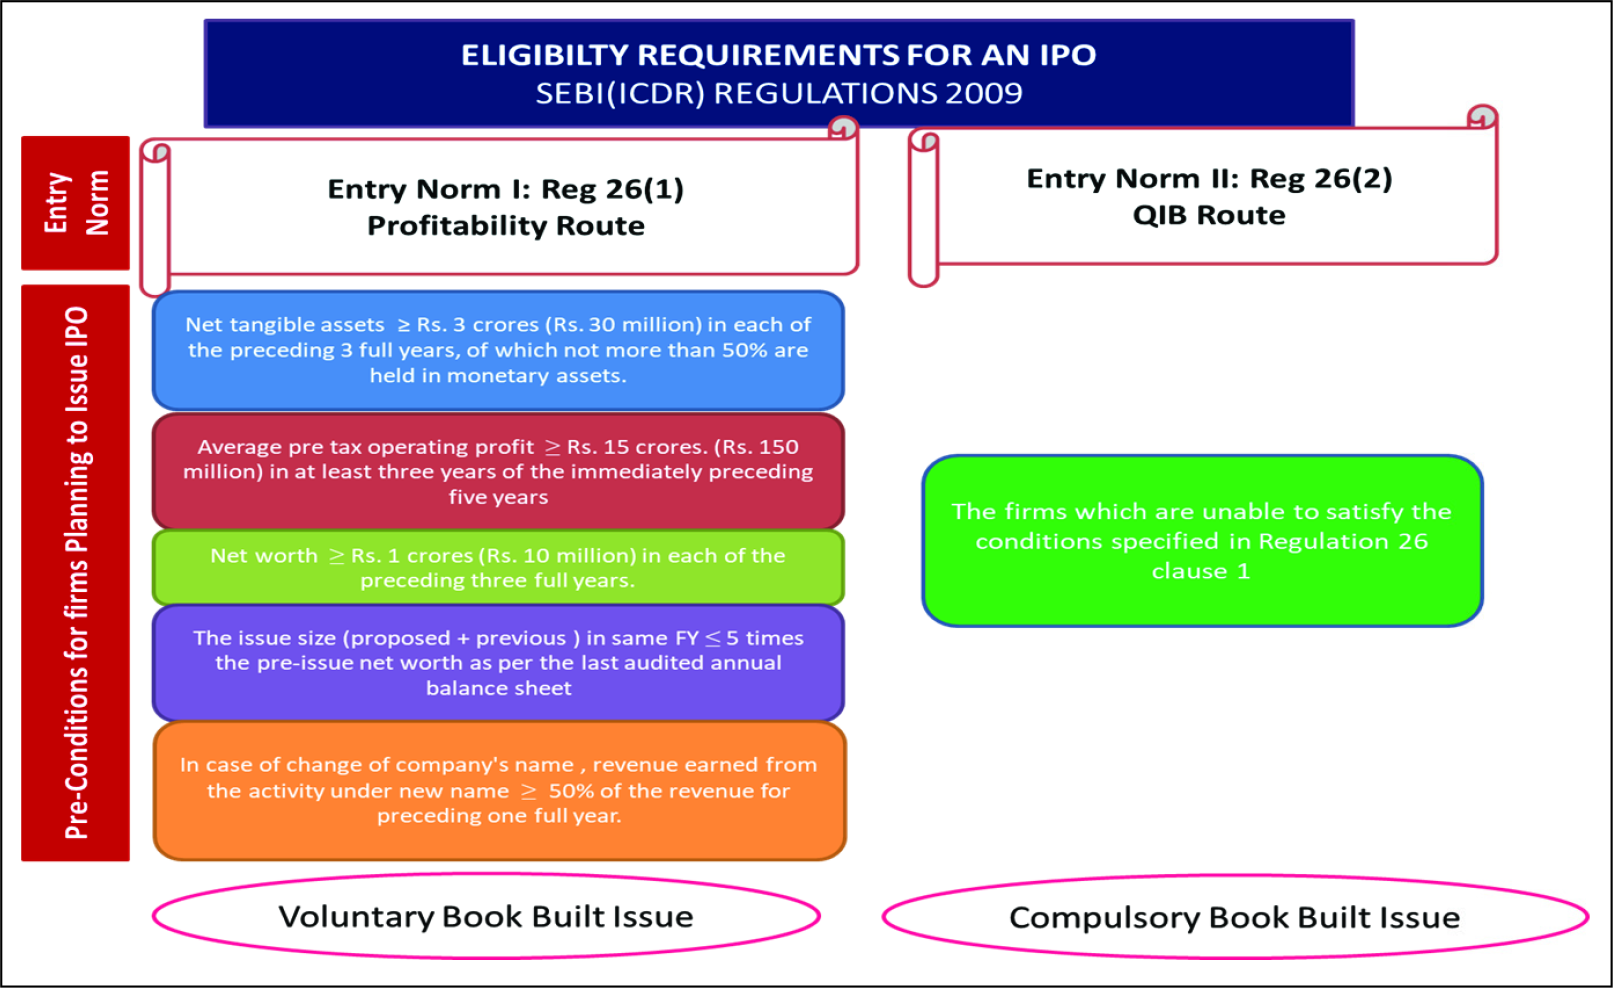
Indian IPO market operates, primarily, within the regulation as stipulated under SEBI (ICDR) Regulations, 2009. Introduced with 12 chapters and 21 schedules, SEBI (ICDR) Regulation, 2009 focuses on various aspects (such as eligibility requirements, stock allocation, pricing norms, the obligation of underwriters and issuers and disclosure manners) of each type of public issue (IPO, Right Issue, Preferential Allotment, FPO, IDRs, Bonus Issue, SME Listing). One such regulation relates to the entry norms for book-built equity issues and is specified in Regulation 26, read along with Regulation 41 and 43, of SEBI (ICDR) Regulations 2009. According to the regulation, issuers fulfilling the minimum assets, revenues and profit criteria can enter the primary markets through Profitability Route; else they can opt for QIB Route.
Figure 2 elucidates the regulation in depth. In essence, for a firm to enter through the profitability route, it must have a minimum average pre-tax operating profit of Rs. 150 million, net tangible assets of at least Rs. 30 million and net-worth greater than Rs. 10 million in each of the preceding three full years. Firms, which are unable to satisfy these preconditions, enter through the alternative route—the QIB route.
Further, allocation criteria to each investor category differ in both the entry routes. The ratio of allocation of shares to RII, NII and QIB shall be ≮35: ≮15: ≯50 respectively in the case of the profitability route and ≯10: ≯15: ≮75 respectively (earlier ≯35: ≯15: ≯50) in the case of the QIB route (Figure 3). The ratio of allocation has modified over the years with several amendments as per market requirements. The amendments that brought about a substantial change in the regulations, pertinent to the study, are—SEBI (ICDR) (Fourth Amendment) Regulations, 2012 and SEBI (ICDR) (Third Amendment) Regulations, 2014.
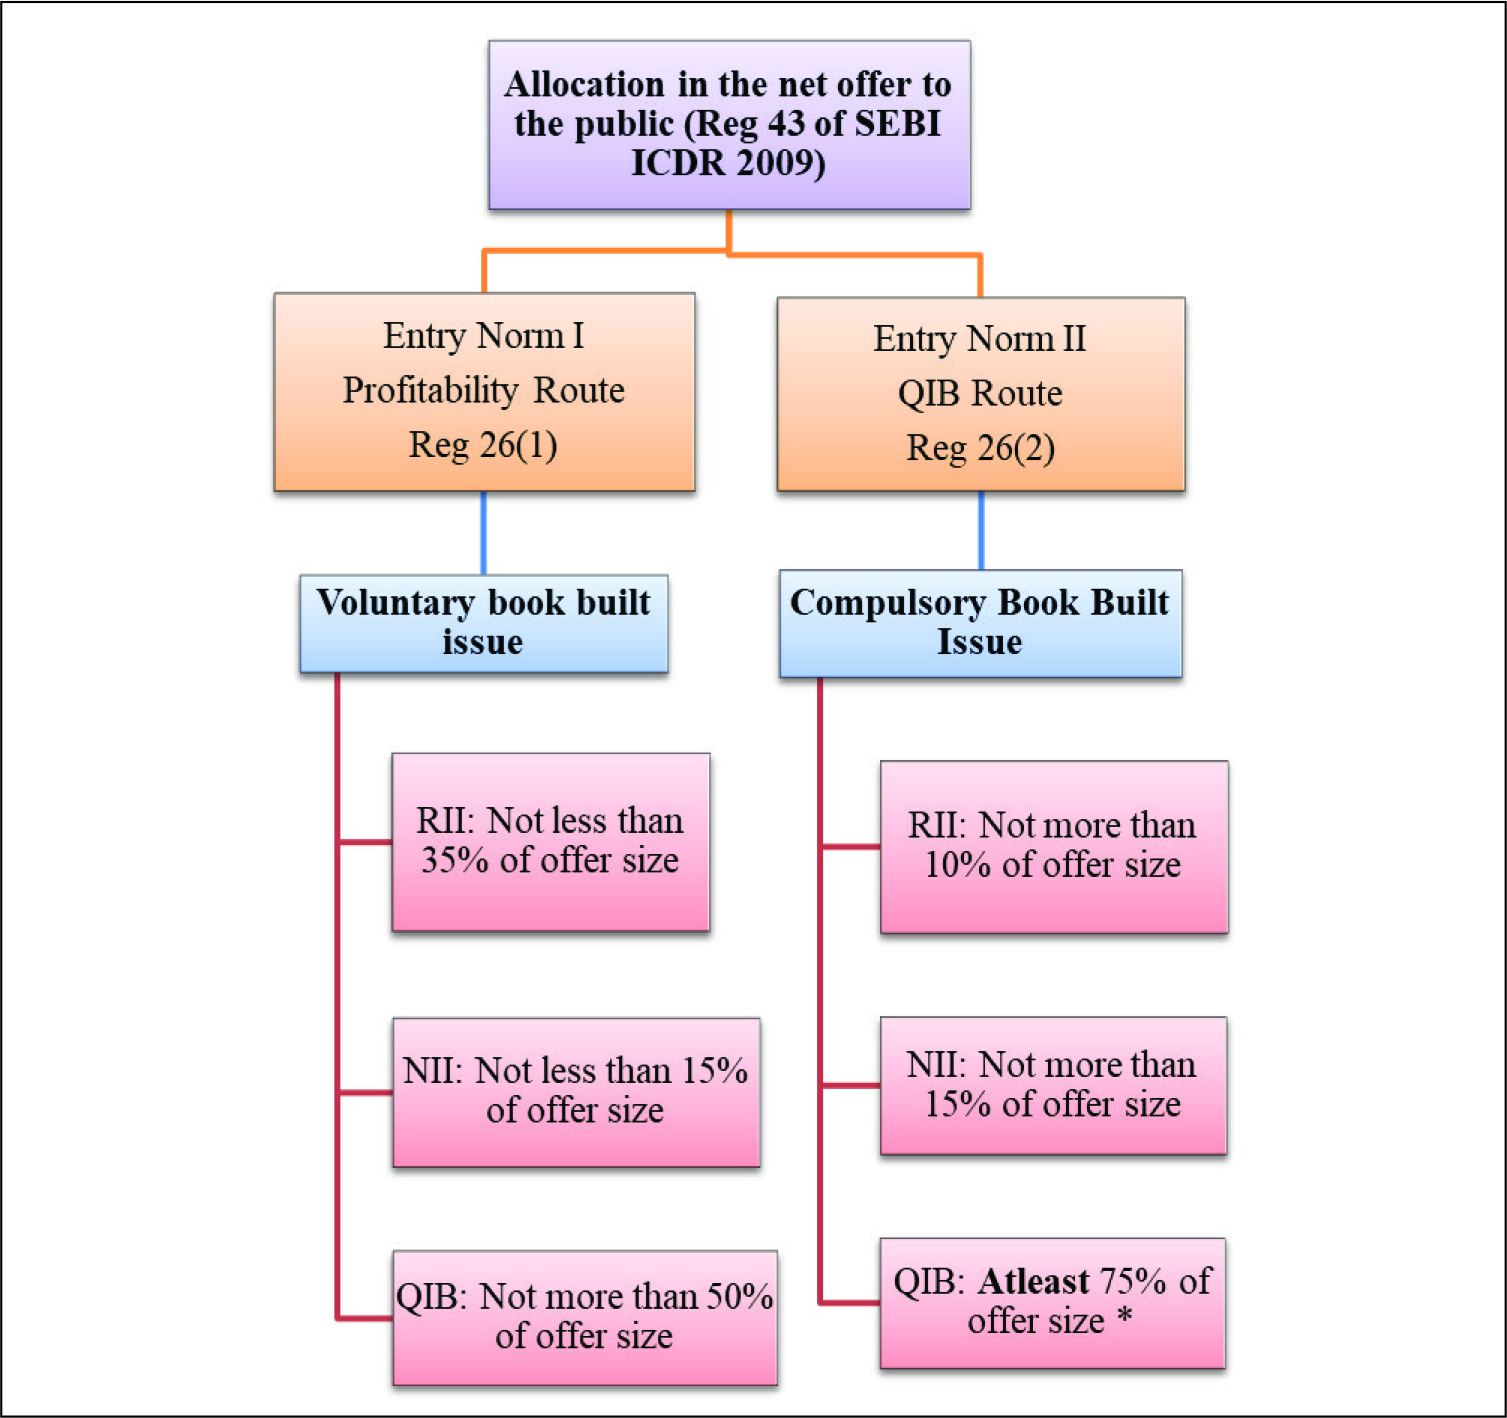
The alternative entry route allows genuine firms, which do not conform to the financial standards set by SEBI, to raise funds in the primary market. On the other hand, it also ensures retail investors’ protection by allocating a higher proportion of the net offer to the informed investors. Apart from the allocation proportions, the major differences between both the routes arising due to regulation are as follows:
Unlike profitability route firms, QIB route firms have to compulsorily price their issue with the book-building method. QIB Route firms have to compulsorily allot 75 per cent of the net offer to QIBs, failing which the full subscription amount shall be refunded. While in case of under-subscription in the QIB category of profitability route firms, the allotment shall be made to the remaining investor categories.
Objective and Rationale
The study aims to deconstruct IPO entry norms. The unique idea of permitting the less-profitable firm to enter IPO markets while providing credibility through the involvement of more informed investors has led to exploring underpricing in the context of entry norms. Keeping in mind the regulatory innovation in practice, the following objectives are drafted:
To examine underpricing trends. To empirically examine the differences between firms issuing IPO through profitability route and QIB route; To analyse the impact of different entry routes on listing day returns of book-built IPO listed on Mainboards of Indian Stock Exchanges (NSE & BSE) from 2009 to 2019.
To formulate hypotheses, the theory is divided into three sections to study each aspect of the research question individually.
Initial Performance
Studies on Underpricing in IPO Markets.
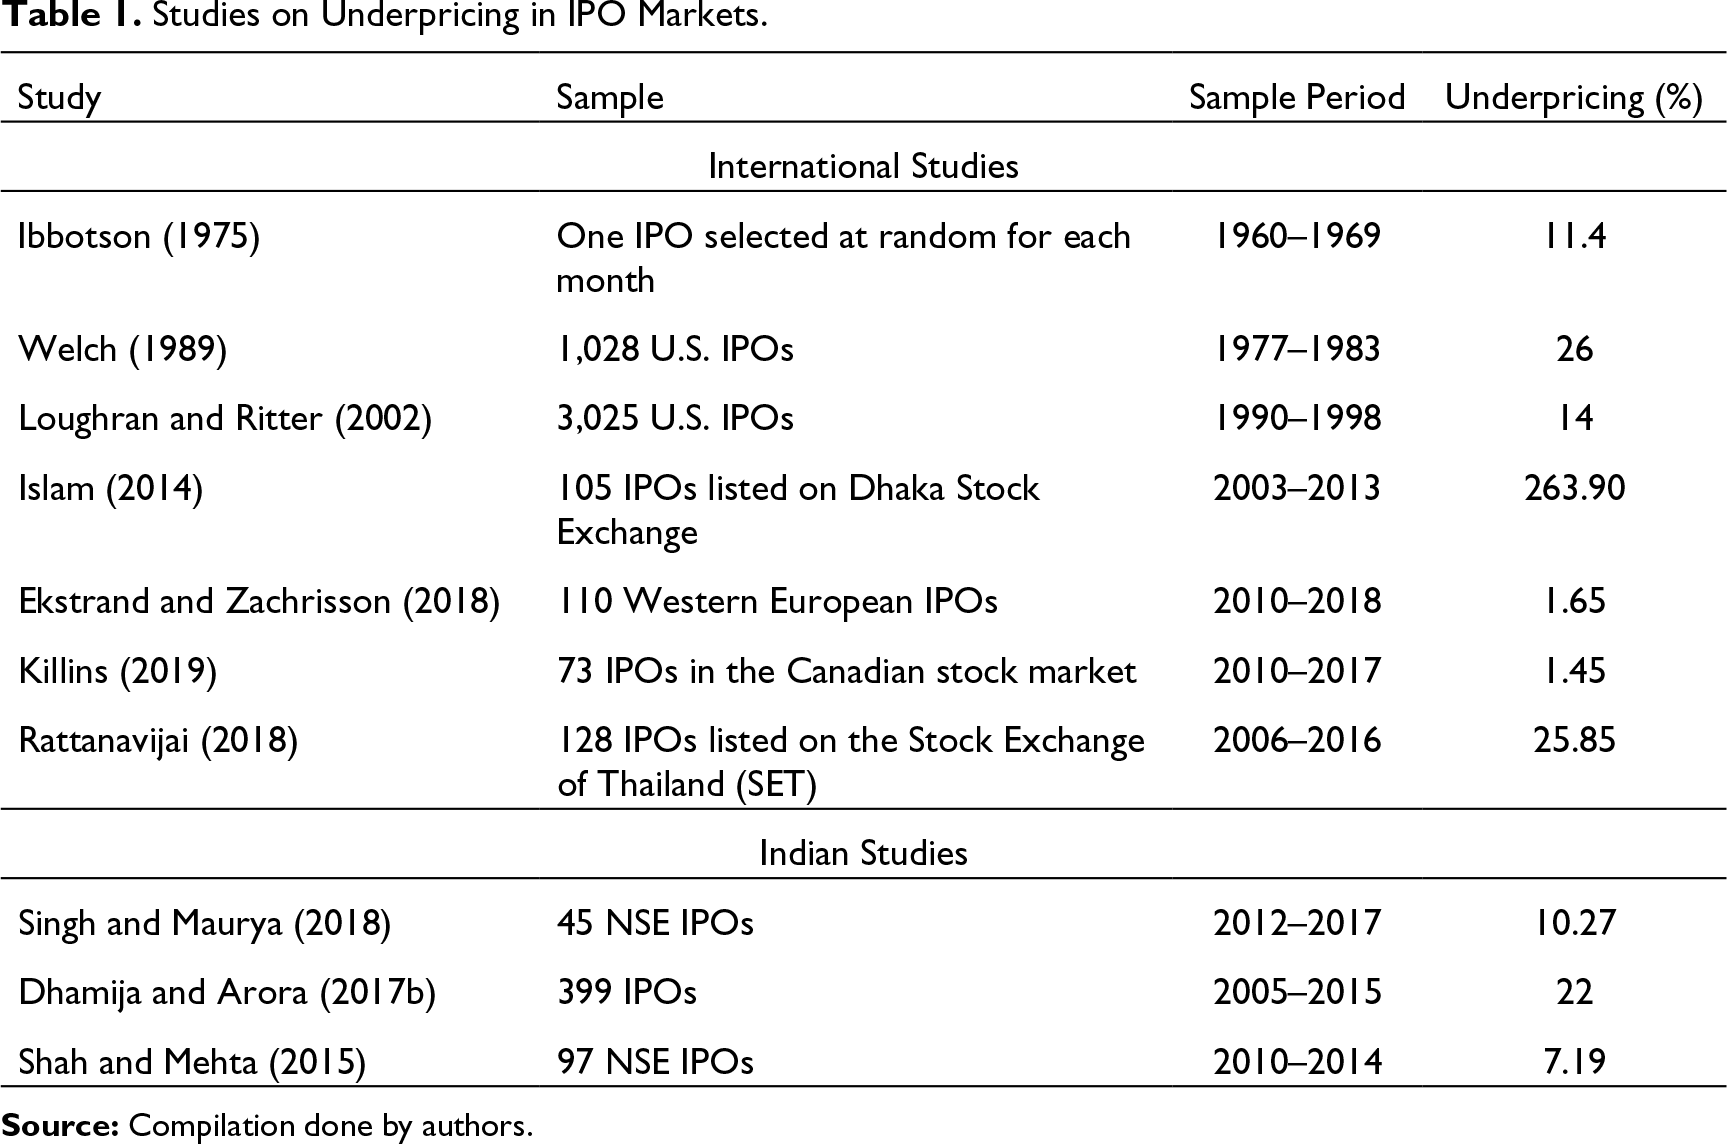
Determinants of underpricing: Several factors determine the level of initial returns from an IPO. A study by Sehgal and Singh (2008) exhibited that age, issue size, listing delay and offer price were negatively related to underpricing and oversubscription and market conditions were positively related to initial returns. All the results were found to be statistically significant. Singh and Kumar’s (2019) exploratory data analysis on a sample of 437 IPOs from 2003–2018, revealed that more book-running lead managers were employed by large firms, although they had a significant negative relationship with underpricing of medium-sized firms. Killins (2019) deliberated on the short-term performance of Canadian IPOs. While age and earnings were found to bear a negative relationship; technology firms had a positive relationship with the level of underpricing.
Impact of Entry Norms on IPO Performance
Johan (2010) highlighted that regulation in the nature of listing standards signals the quality of the firms to the investors and eliminates the less prepared firms from going public. Thus, it might impact the IPO performance more significantly than the firm and industry-related factors. The entry routes differ from each other in two aspects majorly: (1) in terms of the financial position of the firms; and (2) in terms of the percentage of net offer reserved for QIBs. Thus, the impact of entry norms on initial returns can be hypothesised by studying both these aspects individually:
Impact of company’s financial position on IPO performance: Scholars, in the past, have tested the financial position of the company and its impact on the IPO performance. Some opine that profits and assets have a negative relationship with the initial day returns (Lin & Tian, 2012), while others have established that profitability results in high-class reputation of the firm and affects the initial day returns positively (Johan, 2010). Another school of thought provided evidence of more important factors affecting returns, like IPO volume and issue size; implying that return on assets has no significant impact on listing gains (Baba & Sevil, 2020). Keeping in mind all arguments, no concrete conclusion can be drawn regarding the impact of the company’s financial position on IPO’s initial return. Impact of presence of QIBs on IPO performance: QIB route issues involve allocation of at least 75 per cent of the net offer to the QIBs, while their share is not more than 50 per cent for profitability route issues. Thus, examining the impact of the QIBs was of utmost importance. Bubna and Prabhala’s (2011) analysis affirmed the theory of QIBs acting as information providers and assisting underwriters as effective price discoverers in book-built issues. Amihud et al. (2003) and Ekstrand and Zachrisson (2018) extended the idea and highlighted that despite being perceived as more informed investors; institutional investors’ participation did not impact the IPO underpricing. A similar study by Khurshed et al. (2009) provided conclusive evidence of underpricing as a result of the unsatisfied demands of NII & RII, rather than QIBs. QIB’s reaction to an IPO was merely an assessment criterion for NII & RII, thereby removing the issues related to the winner’s curse assumption. A contradictory view was presented by Aggarwal et al. (2002). Using a sample of 174 IPOs, they established a positive relationship between allotment of shares to institutional participants and underpricing. According to them, implicit private information is conveyed through the ratio of institutional investors’ allocation. Refuting the claims of past scholars, a work by Che Yahya and Abdul-Rahim (2014) investigated that a greater allotment to QIBs suggests less flipping and thus, low underpricing.
These conflicting studies led to the formulation of the following hypotheses:
Sample Considered.
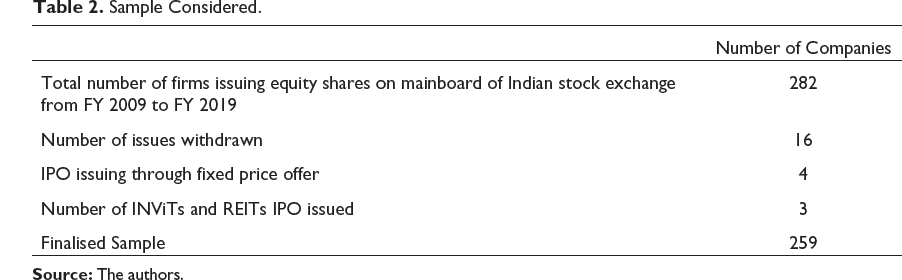
Sample Considered.
Identification and Transformation of Research Variables.
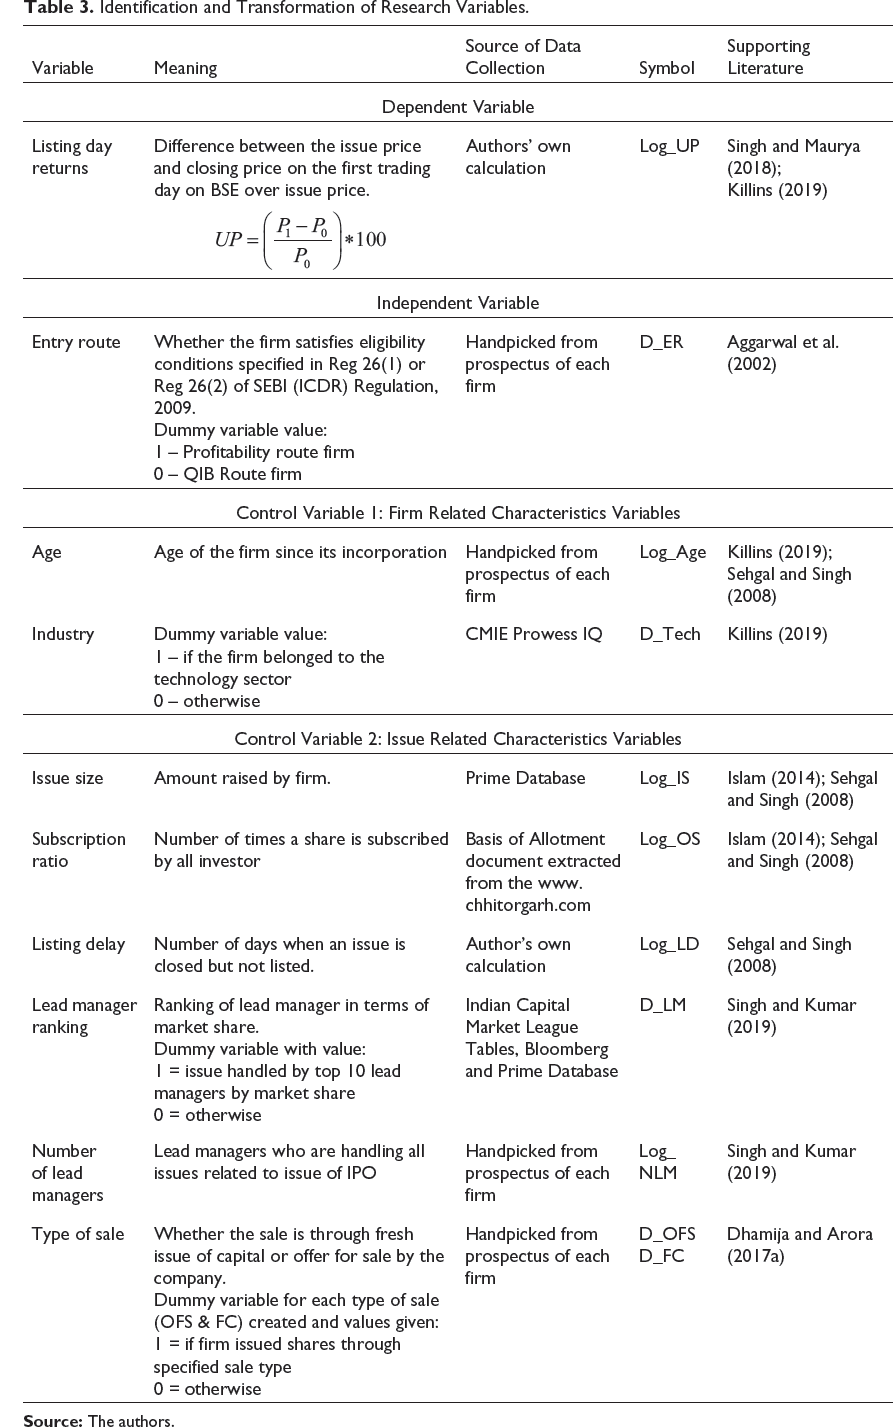
Exploratory data analysis was conducted to figure out patterns and inferences with the given dataset.
Descriptive statistics, like mean, median, standard deviation has been used along with Welch’s t-test and chi-square analysis to analyse significant differences among the metric and categorical characteristics of companies entering via either route respectively.
Further, multiple regression analysis was run to predict the model for returns. Provided the assumptions of ordinary least squares regression analysis are met; it produces the best, linear and unbiased estimators and it is also established to be as effective as machine learning techniques like random forest sampling.
For the finalised model, except for normality and heteroscedasticity, all the assumptions were duly met. Robust Standard error t statistics were used to deal with the problem of heteroscedasticity, while normality assumption was relaxed due to sufficiently large sample size.
All the data gathered was analysed using R Studio v1.3.1056, Microsoft Excel (2010) and IBM SPSS Statistics 23.
The model tested is as follows:

Initial Returns as an Individual Variable
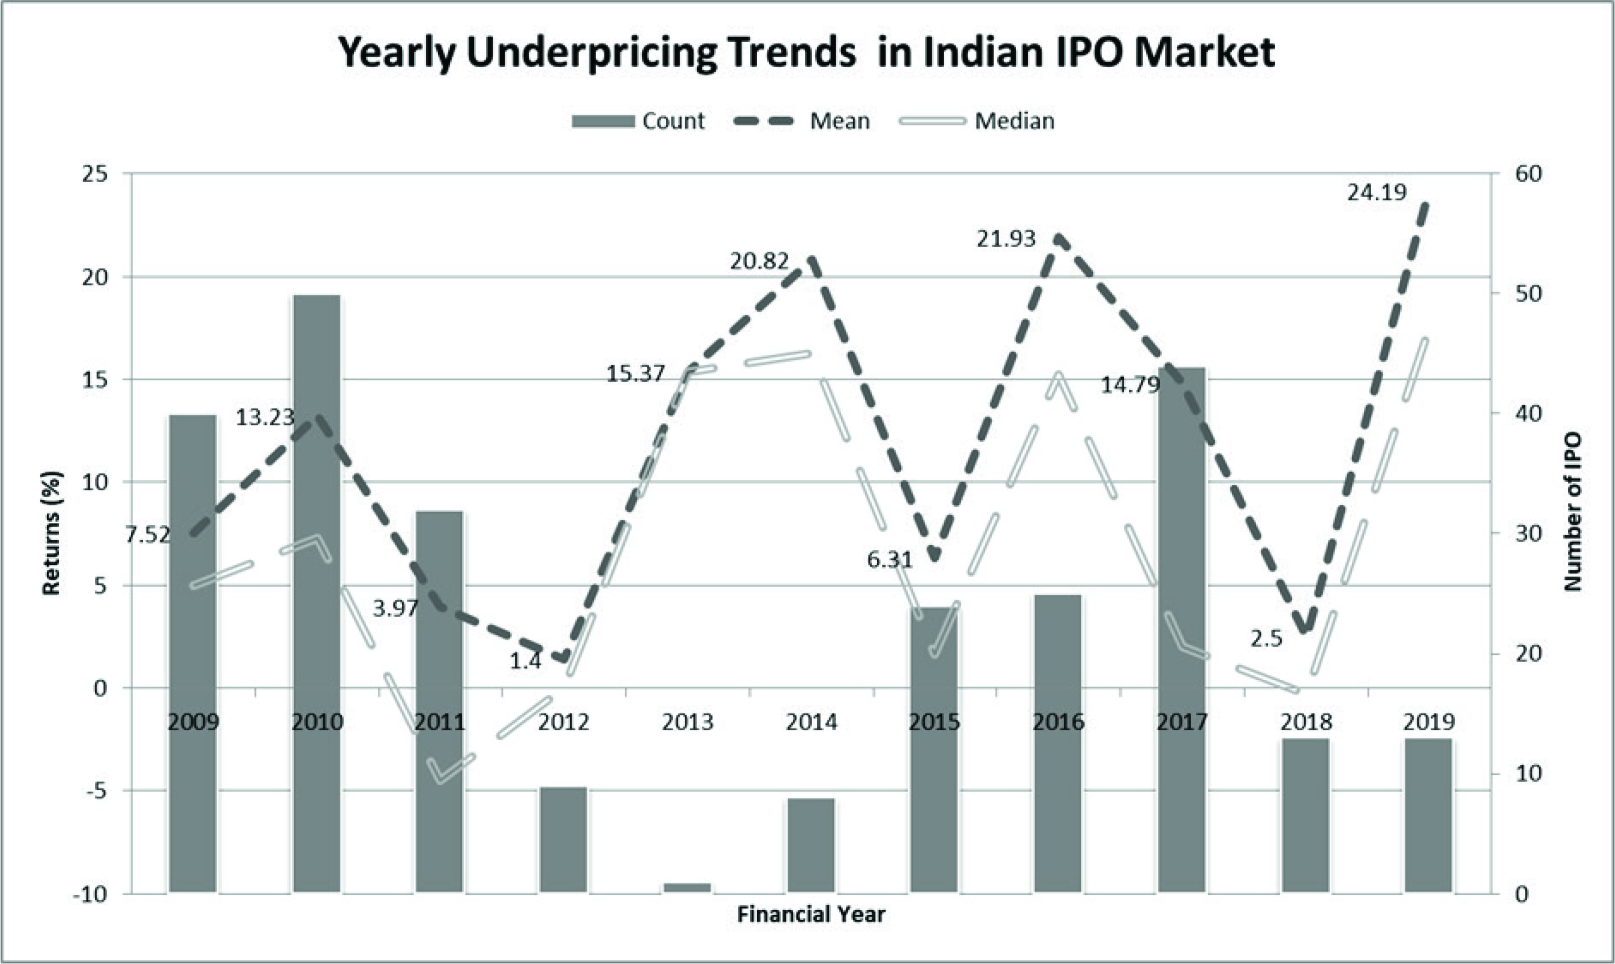
Yearly Underpricing Trends.

Yearly Underpricing Trends.
Introducing Entry Norm as a Categorical Variable
The average initial level of return turned out to be 11.68 per cent for 176 profitability route firms and 11.15 per cent for 83 QIB route firms. An insight into the data revealed that both the entry norms consisted of overpriced and underpriced issues (Figure 5). An intriguing observation is that the ratio of overpriced issues to underpriced issues in each route remains almost the same (37.5:62.5). The results are consistent with Islam (2014). Some investors made a profit for themselves on the first trading day, while others could not do so.

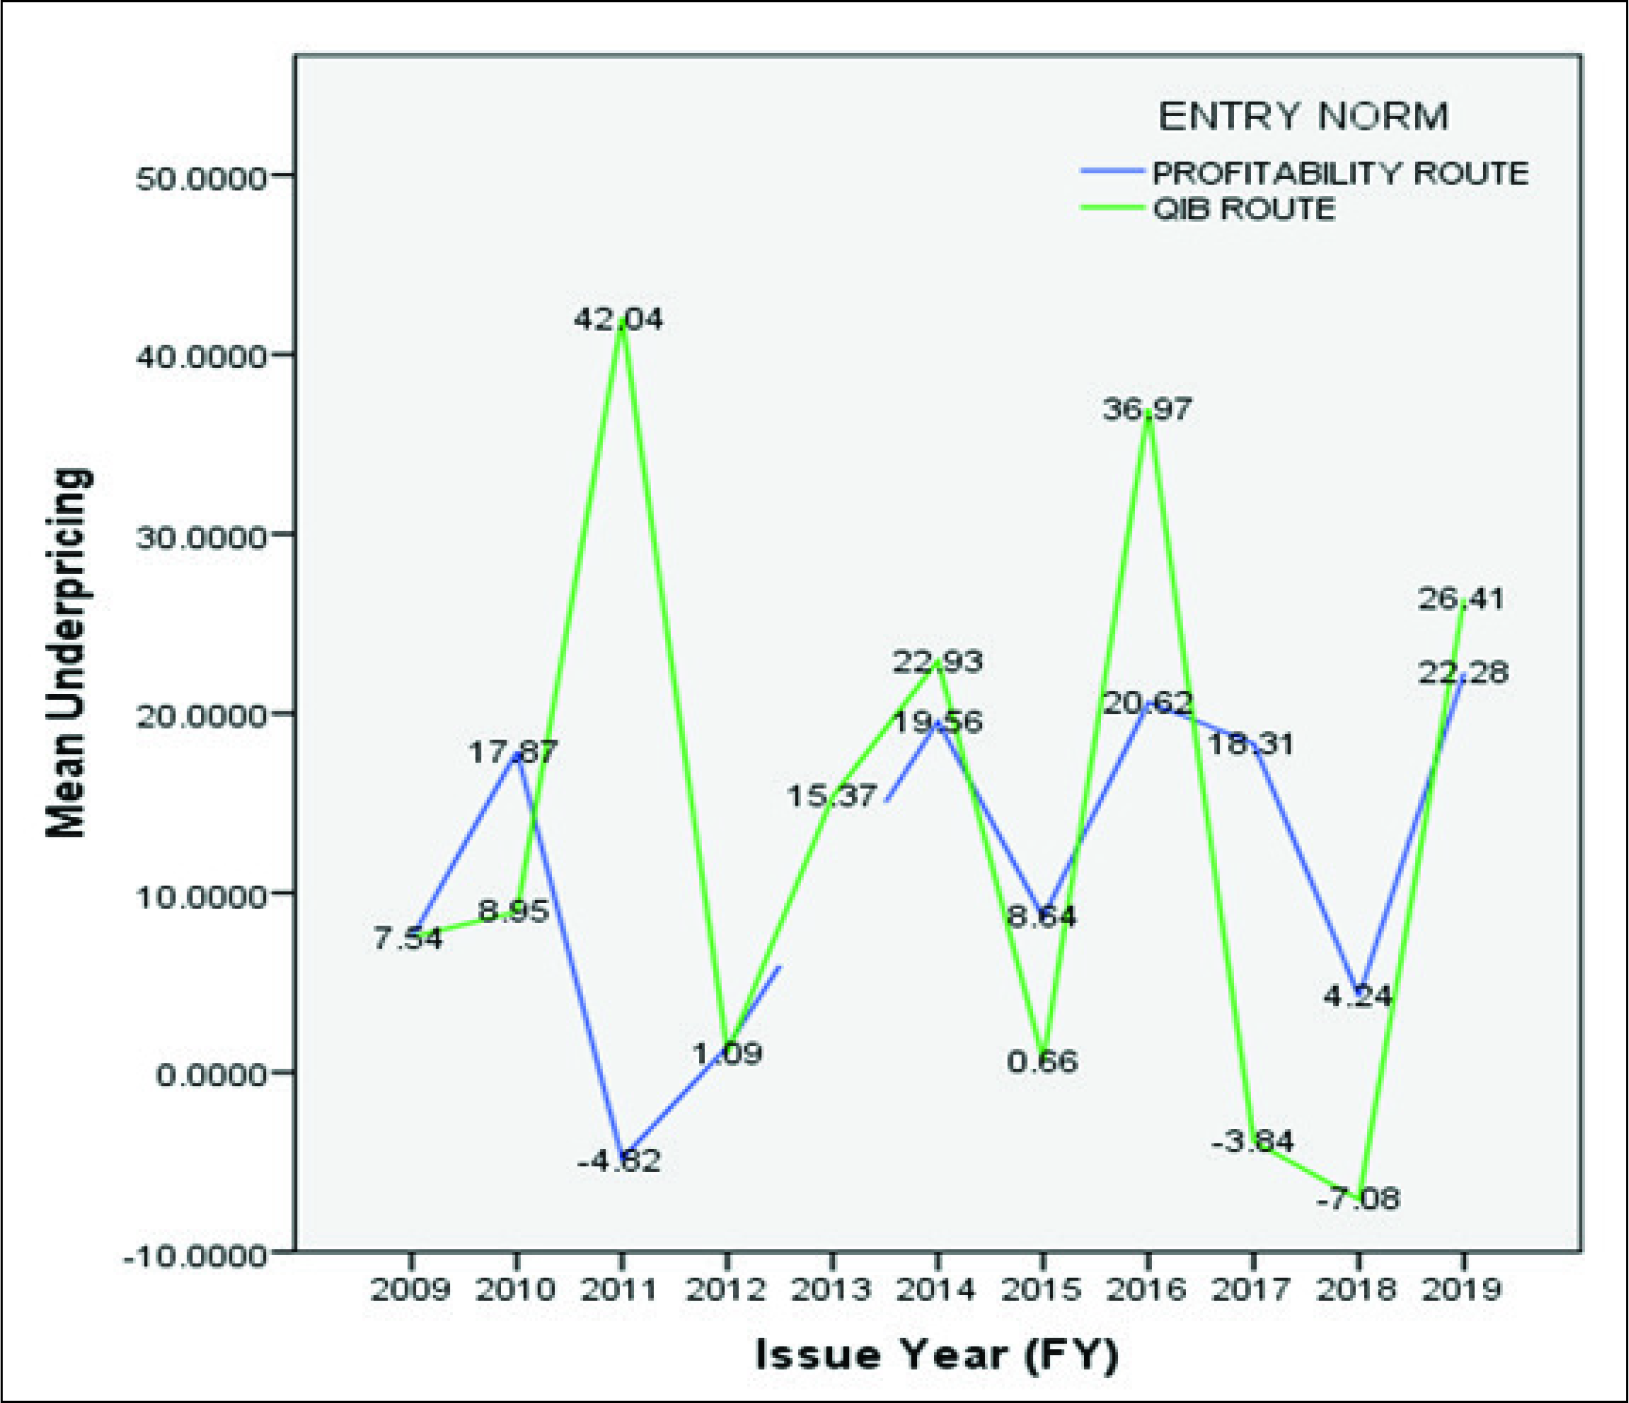
Yearly analysis of average underpricing by entry routes is depicted with the help of Figure 6. As can be noted, the average yearly underpricing of QIB route firms was inconsistent as compared to that of the profitability route firms. While the range of QIB route firms’ yearly average first-day returns stood between +42.0 per cent (FY 2011) and –7.08 per cent (FY 2018), the range of profitability firms’ yearly average first-day returns stood between +22.28 per cent (FY 2019) and –4.82 per cent (FY 2011). The break-in profitability route firm line suggests that no IPO was issued under that route in FY 2013.
Cross-Sectional Analysis
The emphasis was manifold here. The first question was to analyse the significant differences in characteristics of profitability route and QIB route firms. Secondly, do entry norms influence underpricing? Thirdly, if the entry route affects the underpricing, what is its magnitude? Lastly, how do the coefficients change in the presence of control variables?
Testing for Differences in Means and Proportions
Output Obtained for Testing of Mean Differences Using Welch’s t-Test.

The table describes summary statistics, that is, mean, median, standard deviation (SD), maximum and minimum values for each transformed metric variable under each route. Levene’s test for homogeneity of variance is conducted to see whether the data assumed equal variance or not. F-statistic of Levene’s test with p > .05 implies that null hypothesis of equal variance is retained. Further, the mean differences column consists of calculated differences in means of variables of both the entry route. When p < .05 (significance level), then it means that the null hypothesis, mean difference is statistically equal to 0, is rejected for that particular variable and is denoted by an asterisk (*).
Chi-Square Output for Categorical Variables (Test of Proportions Differences).

(2) Digit specified in parenthesis () denote the value assigned to each response of variable while running the test.
Multiple Regression Analysis
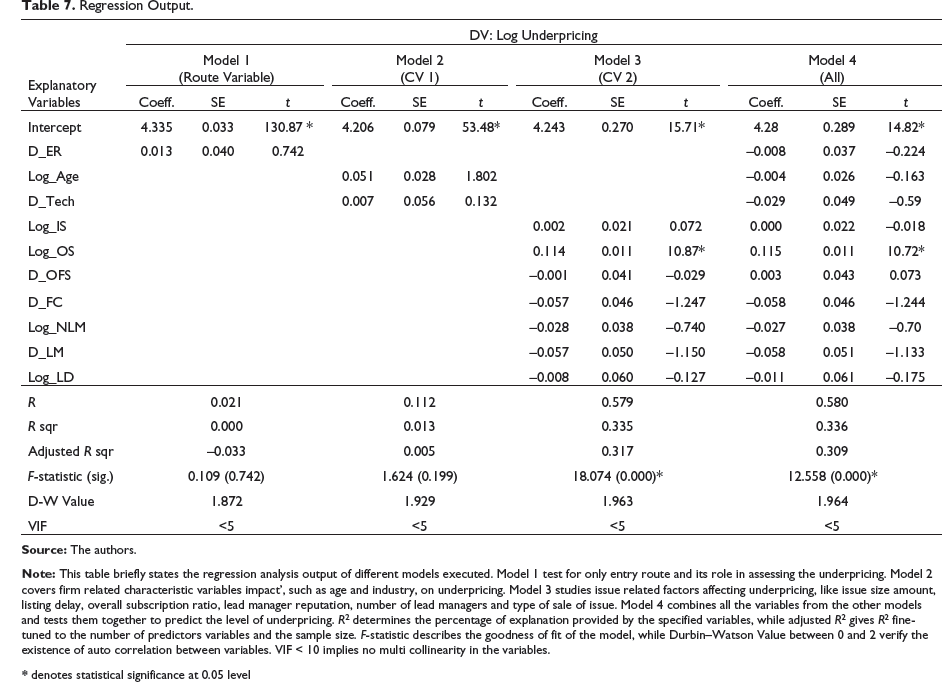
This section deals with enumerating the impact of entry norms on the initial level of returns of a firm using ordinary least squares regression. The regression output is presented in Table 7. The analysis was conducted in four models, each analysing a different set of variables. The results of Model 1 established clear evidence of the minimal impact of entry route on underpricing (coefficient: 0.013). R-squared of Model 1 was close to 0, while to model was also unfit. Model 2 tested control variables related to the firm, even before its issue. The model’s results disclose that none of the factors were a significant determinant of first-day returns. Also, the model remained unfit (F-stats. = 1.624). Model 3, based on issue-related control variables, indicated that only constant term and log of overall subscription ratio were statistically significant variables with coefficients +4.24 and +0.114, respectively.
The final model, Model 4 incorporated all the variables. The model predicted was, then, tested for assumptions. Linearity assumption was checked by Residual vs Fitted Plot and found to be roughly met. The normality of the error terms was judged using the Shapiro–Wilk normality test. The result statistics (W = 0.97244, p-value = 6.599e – 05) indicated non-normality. But due to sufficiently large sample size, this assumption was relaxed. Non-Constant Variance Score Test statistic (χ2 = 5.788, df = 1, p-value = .01613) and Studentized Breusch–Pagan test statistic (BP = 72.993, df = 14, p-value = 5.512e – 10) revealed presence of heteroscedasticity. Log transformation of the variables and Eicker–Huber–White standard errors were used to adjust the standard errors to solve the problem of heteroscedasticity. There was no autocorrelation evident in the data (Durbin–Watson, DW = 1.964, p-value = .347). Since the variance inflation factor (VIF) for all the variables was less than five, the assumption of no perfect multi-collinearity was also met.
Regression Output.
* denotes statistical significance at 0.05 level
Further, the R-square and adjusted R-square of the model lay at 33.6 per cent and 30.9 per cent, respectively. The low R-square reconciles with the ex-ante uncertainty hypothesis of underpricing, which refers to the positive relationship between uncertainty and the expected initial return of an investor (Sehgal & Sinha, 2013). Consequently, it signifies the non-predictability of actual returns of IPOs.
Scholars, around the world, have different opinions regarding the issue’s initial performance. For our study, the average underpricing across the sample turned out to be 11.51 per cent. Further, the average underpricing of profitability route issues was not significantly different from the average underpricing of QIB route issues. The differences in only mean age and mean listing delay of profitability and QIB route issues were found to be significant at 95 per cent confidence level. Industry, type of sale and lead manager rank indicated significant association with entry norms. Further, multiple regression analysis revealed the negative, yet insignificant, coefficient of entry norm with the initial level of returns. Among the control variables, issue size, subscription rate and offer for sale were found to have a positive relationship with underpricing, while age, industry, fresh issue sale, lead manager’s rank, number of lead managers and listing delay had a negative relationship with underpricing. Except over-subscription, none of the variables’ relationship was significant.
In summary, the study may be considered promising for all stakeholders. Entry norms appear as a supplementary tool that allows a greater number of firms to raise funds in the IPO market, without affecting its performance or its ability to raise funds. Higher stake to QIB in the alternative route ensures investor protection too. Profits and assets have no longer remained a bar to enter the markets. The findings are consistent with SEBI’s aim of introducing the alternate entry route, ‘…to provide sufficient flexibility and also to ensure that genuine companies are not limited from fund raising on account of strict parameters…’. These claims cannot be refuted empirically. The regulation provides enough flexibility for unlisted companies to issue shares in the primary market.
This study has important implications for all the market participants. It will help issuers in the decision-making process of ‘when to enter’. If issuers wish to plan their IPO and expect QIBs to subscribe to their issue, then they should not wait to list its issues through the profitability route. They can raise an equal amount of funds via the QIB route too. Investors, too, should be indifferent to the entry route while expecting an initial return. Lastly, regulators should bring in more such regulations, so that more genuine firms attain flexibility to raise funds in IPO markets. This regulation could be introduced to SME exchange as well.
Our study, like most, has limitations. Unavailability of investor-wise-trading data restricted the analysis. This work can be further enhanced by incorporating corporate governance variables. Moreover, a similar study can be undertaken for SME and international exchanges too.
Footnotes
Declaration of Conflicting Interests
The authors declared no potential conflicts of interest with respect to the research, authorship and/or publication of this article.
Funding
The authors received no financial support for the research, authorship and/or publication of this article.
