



Abstract
Due to the COVID-19 pandemic, public finance management (PFM) in the FY 2020–2021 and 2021–2022 have become extremely challenging. The economic contraction has created pressures on PFM in India in terms of lower revenue mobilisation and higher expenditure needs. Both the union and state governments are facing dual problem of arresting economic contraction and managing public finance with limited resources. The present article analyses public finance management of the union as well as 16 major Indian states during the time of COVID-19 pandemic. For comparison, we have also analysed pre-COVID public finance monthly data of state governments. The shock to PFM came from both the revenue as well as expenditure side. Apart from aggregate analysis of state finances of 16 major states, we present state-wise analysis to highlight measures adopted by states to deal with the unprecedented fiscal crisis.
Keywords
Introduction
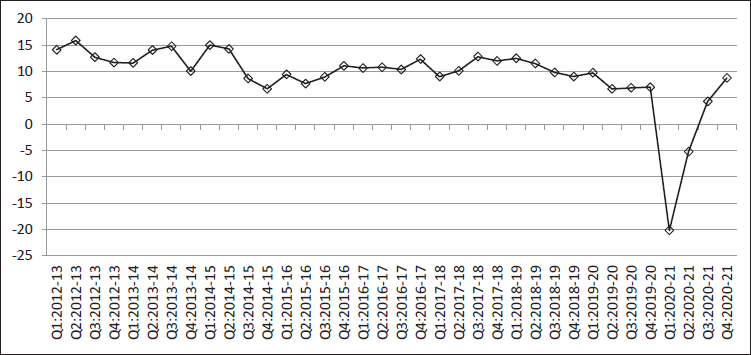
The impact of the COVID-19 crisis can be observed in three different spheres, that is, health, economic and finance (IMF, 2020). It negatively impacted the economic growth in the first quarter of 2020–2021. It started recovering after phase-wise relaxation of lockdown restrictions (Figure 1). The shock to the economy have implications on revenue mobilisation of both the union and state governments and hence on public finance management (PFM). A considerable shortfall in revenue on the one hand and increasing demand for public expenditures to provide emergency healthcare and livelihood supports on the other have created serious strain on public finances of both the union and state governments.
The revenue impact of COVID-19 pandemic would be different across different economies depending on duration and severity of the pandemic in terms of mortality and morbidity, duration; stringency and spatial spread of containment measures adopted, structure of the economy, exposure to international flows including trade and tourism, structure and composition of government revenues, and measures taken to cushion firms and households from the impact of the pandemic (OECD, 2020). Moreover, realisation of the benefits of fiscal measures adopted by different economies to stimulate the economy may differ depending on speed of the transmission of fiscal multiplier to boost economic activities. In addition, measures adopted by tax administrations to facilitate ease-of-tax compliance by allowing deferment of tax payments, extending deadlines of filing tax returns, tax holidays, and so on, either may delay in realisation of revenue or reduce revenue mobilisation. Being most responsive to economic cycles, revenue from corporate income tax (CIT) is likely to decrease more than the fall in economic activity (OECD, 2020). Any fall in employment and/or wages and salaries is likely to impact personal income tax (PIT) collections. Tax from consumption like VAT/GST is also likely to fall due to the impact of lockdown and lower consumer confidence, as well as a potential shift towards the consumption of staple goods and basic necessities, which are either exempted or taxed at lower rates (OECD, 2020).
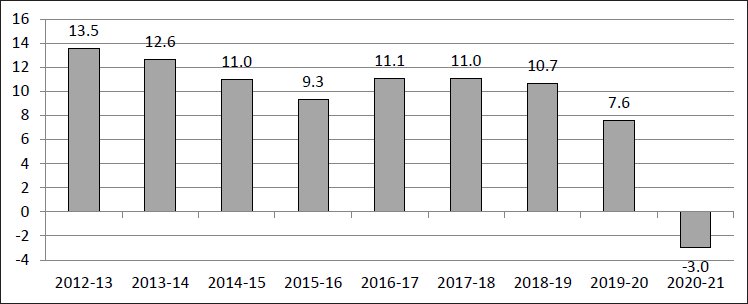
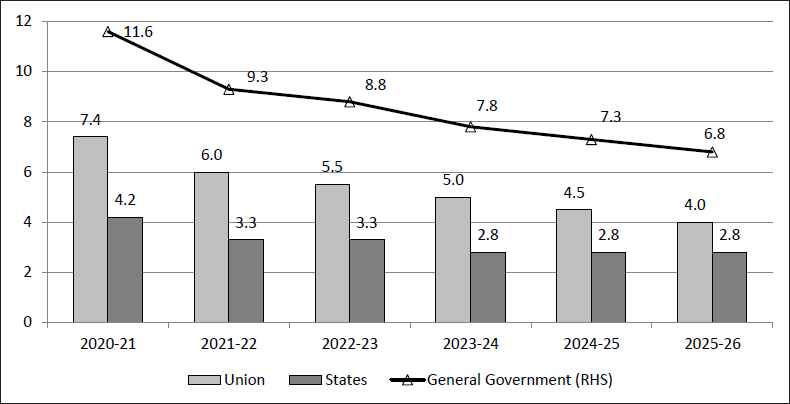
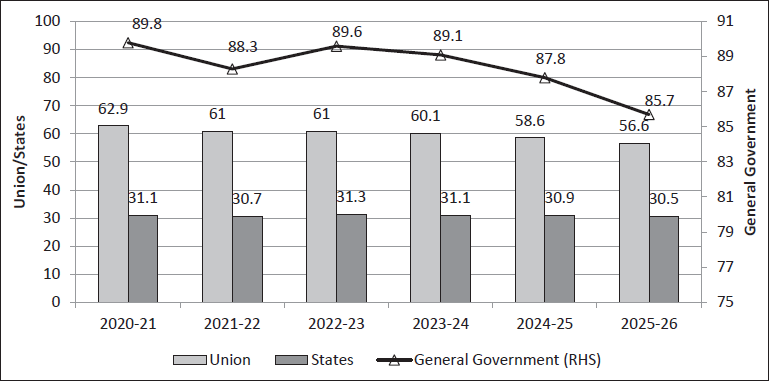
Indian states have faced revenue shortfall in 2020–2021 not only on account of their own tax revenue (OTR) collection but also on account of the decline in devolution of states’ share in Central taxes, owing to falling revenue collection in the union taxes. State’s tax base depends on level of expenditures on goods and services (State GST as well as Integrated GST settlement), consumptions of alcoholic beverages (State Excise Duties and State Sales Tax) and petrol, diesel, aviation turbine fuel (ATF), natural gas and electricity (State Sales Tax), registration of immovable properties and agreements/contracts (Stamp Duty and Registration Fees) and land revenue. It is expected that except agricultural activities, all other economic activities (including transportation of goods and passengers) are affected due to the COVID-19 pandemic. A fall in the growth rate of GDP implies that there is a fall in incomes (wages and salaries, rents, interests and profits) and therefore corresponding impacts on expenditures (Figure 2). Revenue impacts of the pandemic are different for different states depending on the severity of the COVID-19 pandemic. On the expenditure side of the state budgets, interest payments, salaries/wages, pensions and subsidies constitute a major share of total revenue expenditure and there is hardly any scope for cutting expenditures on these heads. Therefore, it is obvious that maintaining the level of capital expenditures will be a challenge in the face of the revenue shortfall. There is also a possibility of expenditure switching from other social and economic services to provide livelihood supports and emergency health care services, for example, in providing free foods through public distribution system (PDS), income support, and so on. Both rural and urban local governments may face revenue constraints due to less transfer of resources from the state governments. Shrinking fiscal space due to fall in the growth rate of the economy and high fiscal deficits are the two major constraints for the governments to expand some of the public expenditure programmes. According to the Union Budget 2021–2022, the revised estimate of fiscal deficit of the union government is ₹18.5 trillion (or 9.5% of GDP) in 2020–2021. In addition, states have incurred an additional deficit. Together, this is likely to be ₹25.5 trillion (or 13.5% of GDP) (Rao, 2021a). Total outstanding liabilities is expected to be close to 90% of GDP in 2020–2021 (Rao, 2021a). In fact, according to Rao (2021b), the pandemic has made the Fiscal Responsibility and Budget Management (FRBM) act completely irrelevant and hence there is a need for a new fiscal consolidation roadmap amidst the COVID-19 pandemic. Keeping in mind fiscal stress faced by the union as well as state governments, the Fifteenth Finance Commission has prescribed paths of fiscal consolidation by setting targets for fiscal deficits as well as debt-GDP ratio for the union and state governments for the period 2020–2021 to 2025–2026 (please refer to Figures A1 and A2 in Appendix).
Given this background of uncertainties and shocks on the fiscal front, the present article analyses public finance management of the union as well as 16 major Indian states during 2020–2021. The present article throws some light on how governments—both the union and states—have managed the fiscal situation in the time of the pandemic. Also, different states have a different experience in managing the fiscal situation during the pandemic; therefore it would be important to highlight the strategies adopted by different states to manage public finances during the time of the pandemic.
In section II we discuss public finance management of the union government. In section III, we discuss public finance management of 16 major states. This is followed by a discussion on fiscal shocks (revenue and expenditure) during the time of COVID-19 pandemic. In section IV, we provide a spatial (state-wise) analysis of public finance management strategies adopted by states. The section V draws conclusions.
The union budget for the year 2020–2021 projected growth in tax (gross tax revenue) and non-tax revenues by 12% and 11.4% respectively with reference to the revised estimates of 2019–2020 (Table 1). However, the unprecedented economic impact of the COVID-19 pandemic caused significant revenue loss for the union government. Revised estimates of 2020–2021 showed a significant fall in all sources of revenues, except for the Union Excise Duties (UED), vis-à-vis budget estimates of 2020–2021 as well as actuals of 2019–2020.
Growth in Revenues and Expenditures of the Union Government (%).
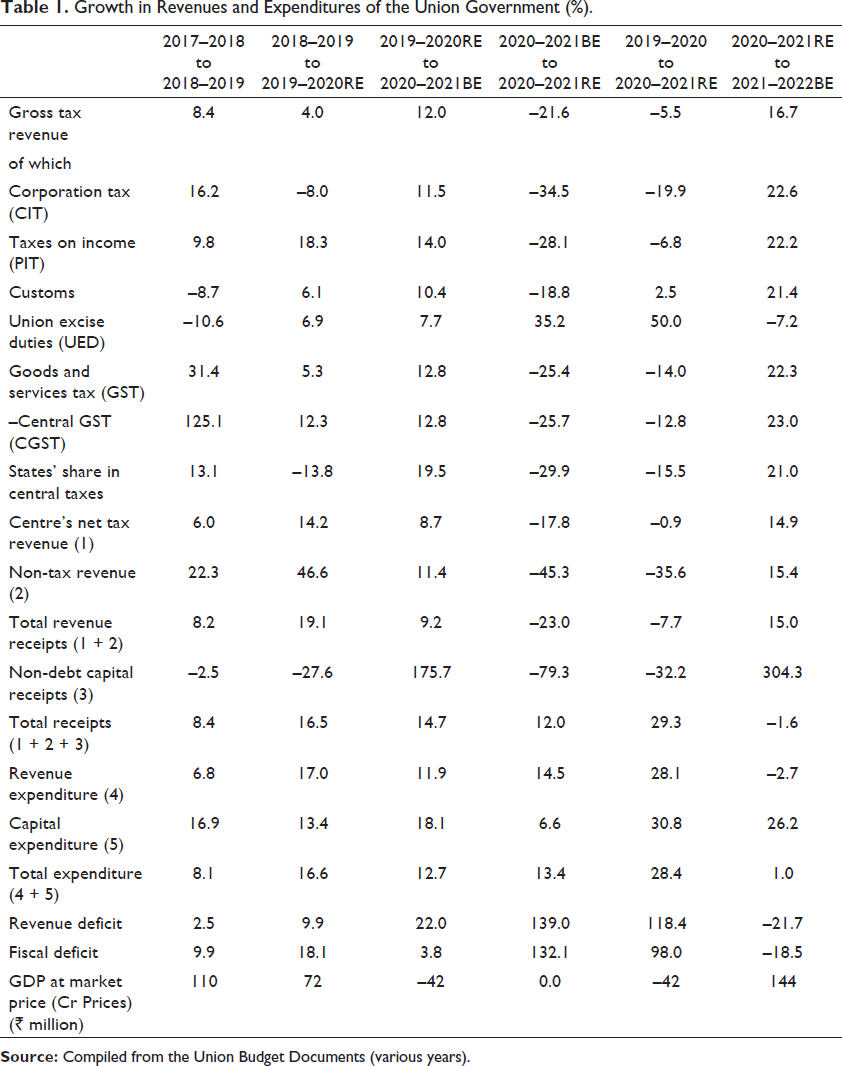
Growth in Revenues and Expenditures of the Union Government (%).
On the expenditure side of the union budget, revenue expenditure showed 28.1% growth in 2020–2021RE vis-à-vis 2019–2020 whereas capital expenditure grew by 30.8%. In the Union Budget 2020–2021, the union government assumed 11.9% growth in revenue expenditure for 2020–2021 vis-à-vis 2019–2020RE. However, due to COVID-19 pandemic, the revenue expenditure of the union government exceeded the budget estimates for the year 2020–2021. Like revenue expenditure, capital expenditure has also exceeded the budget estimate of 2020–2021.
In one side there was revenue shock in terms of contraction of tax and non-tax revenue mobilisation of the government and on the other side overshooting of expenditures on both revenue as well as capital accounts resulted in an increase in revenue as well as fiscal deficits of the union government.
In the revised estimate of 2020–2021, fiscal deficit exceeds the budget estimate of 2020–2021 by ₹10.52 trillion. This is due to fall in revenue receipts as well as increase in expenditures. With respect to budget estimate of 2020–2021, centre’s net tax revenue falls by ₹2.91 trillion in the revised estimate of 2020–2021, non-tax revenue falls by ₹1.74 trillion and non-debt capital receipts by ₹1.79 trillion. Together revenue side (Total revenue receipts + non-debt capital receipts) of the union budget shows a fall by ₹6.44 trillion in the 2020–2021RE with respect to 2020–2021BE. In the revised estimate of 2020–2021, revenue expenditures exceeds the budget estimate of 2020–2021 by ₹3.81 trillion and capital expenditure by ₹0.27 trillion. Therefore in the RE of 2020–2021, expenditure side (revenue and capital) of the union budget exceeds the budget estimate of 2020–2021 by ₹4.08 trillion. Therefore, a part of rise in fiscal deficit (FD) in 2020–2021RE by ₹10.52 trillion is due to fall in revenue mobilisation by ₹6.44 trillion (or 61.2% of rise in FD) and the other part is due to rise in expenditures by ₹4.08 trillion (or 38.8% of rise in FD). The rise in revenue deficit by ₹8.5 trillion in 2020–2021RE vis-à-vis 2020–2021BE has contributed 80.5% in the rise of fiscal deficit in 2020–2021RE vis-à-vis 2020–2021BE.
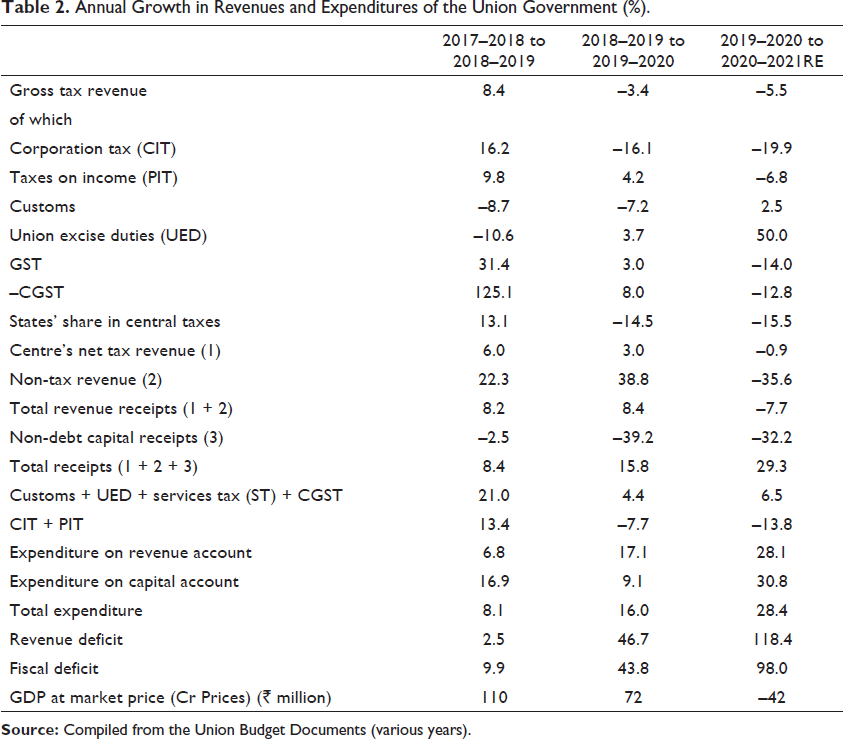
With respect to actuals of 2019–2020, centre’s net tax revenue falls by ₹0.12 trillion in the RE of 2020–2021, non-tax revenue falls by ₹1.17 trillion and non-debt capital receipts falls by 0.22 trillion. Together revenue side (Total revenue receipts + non-debt capital receipts) of the union budget shows a fall by ₹1.51 trillion in the 2020–2021RE with respect to 2019–2020. In the RE of 2020–2021, revenue expenditures rise by ₹6.61 trillion and capital expenditures by ₹1.03 trillion with respect to 2019–2020. Expenditure side (revenue and capital) of the union budget rises by ₹7.64 trillion during 2020–2021RE with respect to 2019–2020. Therefore, a part of rise in fiscal deficit (FD) in 2020–2021RE with respect to 2019–2020 by ₹9.15 trillion is due to fall in revenue mobilisation by ₹1.51 trillion (or 16.5% of rise in FD) and the other part is due to rise in expenditures by ₹7.64 trillion (or 83.5% of rise in FD). The rise in revenue deficit by ₹7.89 trillion in 2020–2021RE vis-à-vis 2019–2020 has contributed 86.3% in the rise of fiscal deficit in 2020–2021RE vis-à-vis 2019–2020.
Annual Growth in Revenues and Expenditures of the Union Government (%).
In this section, we present an analysis of state finances based on monthly statements of accounts (Monthly Key Indicators of CAG) of 16 major Indian states (excluding Goa and Bihar) 3 till December 2020, that is, up to third Quarter (Q3) of 2020–2021. We have compiled state-wise monthly data provided by the Comptroller and Auditor General (CAG) of India. To compare the performance of states in managing public finance during the pre-COVID period and after the COVID, we have also compiled the data up to Q3 of 2019–2020. It is expected that with availability of revised estimates of state finances for 2020–2021 for all states along with budget estimates of 2021–2022, an in-depth analysis of state finances would be possible. CAG’s Monthly Key Indicator (MKI) database does not provide minor head-wise expenditure details of states. So, we have avoided discussion on sectoral (General Sector, Social Sector, and Economic Sector) allocation of expenditures based on MKI database. We have discussed sectoral allocation of expenditures and annual growth rates based on State Budget database.
Growth in Key Indicators of State Finances (%).
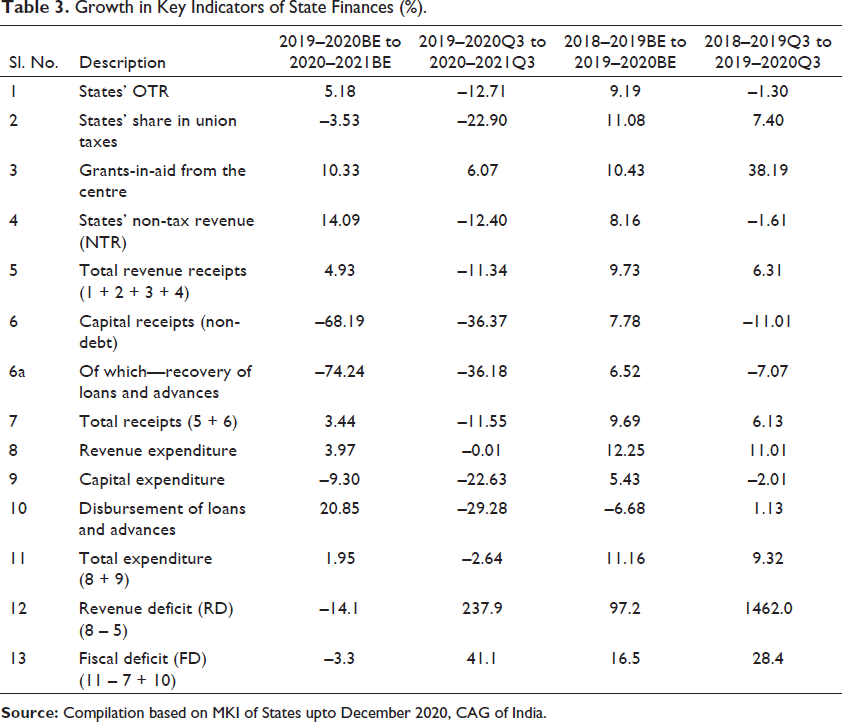
Growth in Key Indicators of State Finances (%).
States also expected contraction in non-debt capital receipts during 2020–2021, as budget estimate of 2020–2021 is 68.19% lower than budget estimate of 2019–2020. In aggregate, states have tried to augment non-debt capital receipts through recovery of loans and advances. Upto Q3 of 2020–2021, states have contained their shortfall in receipts to an extent by recovering loans and advances. At the same time, some states have also contained disbursement of fresh loans and advances.
On expenditure side, states have contained their revenue as well as capital expenditures to cope up with the revenue shock. However, the containment of expenditures was not sufficient to compensate for 12% contraction in total receipts. This has resulted in increasing public liabilities of state governments till Q3 of 2020–2021. States have contained their capital expenditures by projecting a 9.3% lower growth in 2020–2021BE vis-à-vis 2019–2020BE, as well as cutting capital expenditures substantially till third quarter of 2020–2021 vis-à-vis the same period of 2019–2020. States were hopeful to contain revenue deficit during 2020–2021 by projecting lower growth in 2020–2021BE vis-à-vis 2019–2020BE. However, revenue deficit of states has gone up by 238% till Q3 of 2020–2021 vis-à-vis the same period of 2019–2020. States already faced high revenue deficits during 2019–2020 and COVID-19 pandemic till Q3 of 2020–2021 has further aggravated the fiscal stress of states. The fiscal shocks of two consecutive years (2019–2020 and 2020–2021) have resulted in deviation from the path of fiscal consolidation.
In this context, the following observation of the Reserve Bank of India (RBI) is worthy to present here:
States have budgeted their consolidated gross fiscal deficit (GFD) at 2.8% of GDP in 2020–2021; however, the COVID-19 pandemic may alter budget estimates significantly, eroding the gains of consolidation secured in the preceding three years—the average GFD for states that presented their budgets before the outbreak of COVID-19 is 2.4% of GSDP, while the average for budgets presented post-lockdown is 4.6%. (RBI, 2020)
States have mobilised 51% of budgeted TRR till Q3 of 2020–2021 (Table 4). This is 9.37% lower than what was achieved till Q3 of 2019–2020 and 11.31% lower than what was achieved till the third quarter of 2018–2019. Since OTR of states hold the largest share in TRR (52% as per BE of 2020–2021), shortfall in budgeted OTR collection by 10.4% till Q3 of 2020–2021 as compared to the same period of 2019–2020, has impacted state finances the most. Since collections of the union taxes also declined due to the pandemic, states received 12% lower receipts in budget estimate of states’ share in the union taxes till Q3 of 2020–2021 as compared to the similar period of 2019–2020.4 Since the shortfall in the budgeted grants-in-aid transfers (including GST compensation payments) from the centre was minimum (only 2.47%) till Q3 of 2020–2021 as compared to Q3 of 2019–2020. It helped states to contain deficits. Like OTR, the non-tax revenue of states also fell short of what was achieved during the same period in 2019–2020.
On expenditure side of state finances, states have contained both revenue as well as capital expenditures during 2020–2021. Revenue expenditure constitutes the largest share in total expenditure and states have incurred revenue expenditure of 58% of the budget estimate till Q3 of 2020–2021. For the same period of the previous year (i.e., 2019–2020), revenue expenditure reached to 60.1% of the budget estimate. This shows that states have contained their revenue expenditure upto Q3 of 2020–2021 to some extent.
On capital account, states have incurred expenditure of 38% of the budget estimate till Q3 of 2020–2021. For the same period of the previous year (i.e., 2019–2020), capital expenditure reached to 44% of the budget estimate. Cutting revenue as well as capital expenditures helped states to mitigate the revenue shock to some extent. States have also reduced disbursement of budgeted fresh loans and advances upto Q3 of 2020–2021. However, expenditure compression of states was not sufficient to compensate the entire revenue shortfall, which resulted in surpassing the budgeted revenue deficit by 212% till Q3 of 2020–2021. During the same period of the previous year, states reached only 54% of budgeted revenue deficit. States have also reached 72.5% of fiscal deficit target set in 2020–2021BE by Q3 of 2020–2021. During the same period of the last year, states reached 50% of the fiscal deficit target sets in the 2019–2020BE. Therefore, states have exceeded the fiscal deficit target by additional 23% what they experienced till the same period last year.
Management of State Finances (Aggregate of 16 Major States) upto Quarter 3 of 2020–2021.

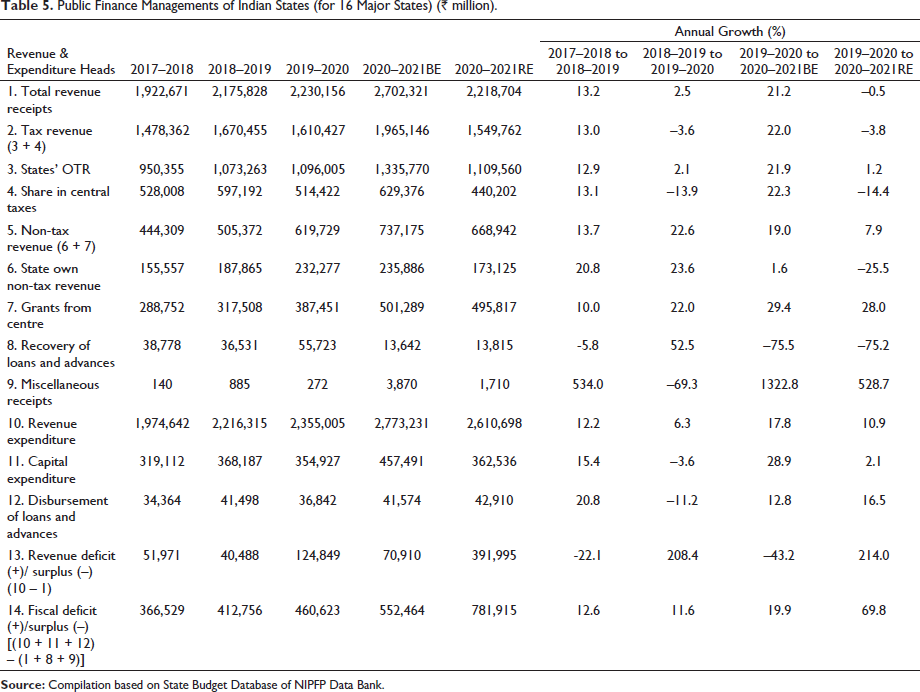
State governments have presented budget of 2021–2022 during the month of February–March of 2021. To compare state finances as presented above based on CAG’s MKI database with the revised estimates of 2020–2021 (as available from State Budget Documents of 2021–2022), we present compilation of budget data of 16 major states in Table 5. 5 Moreover, for comparison with MKI database, we have not taken into account the budget data of Bihar and Goa. Though the states have contained the revenue as well as capital expenditures to deal with the revenue shock, the expenditure contraction was not sufficient to fully compensate for the revenue shortfall which resulted in exceeding revenue as well as fiscal deficit targets (Table 5). In the revised estimate of 2020–2021, all sources of revenue fall short of budget estimates of 2020–2021. Though states’ OTR shows a positive growth in 2020–2021RE vis-à-vis 2019–2020, fall in growth rate in states’ share in Central taxes was 14.4%. This has caused fall in growth rate of overall tax revenue of states by 3.8%. Growth rate in non-tax revenue of states was 7.9% in 2020–2021RE vis-à-vis 2019–2020 and it was mostly due to 28% growth rate in grants-in-aid from the centre (including GST compensation payment). It is to be noted that some states have also received revenue deficit grants during 2020–2021 as recommended by the Fifteenth Finance Commission in the ‘Report for the Year 2020–2021’ and accepted by the union government (XV Finance Commission, 2019). We have not observed any contraction in disbursement of loans and advances as well as any impetus on recovering loans and advances by states based on state budget database. This is deviation from what we observed in our analysis based on CAG’s MKI database. Perhaps states have kept adequate provisions in the revised estimate of 2020–2021 for disbursement of additional loans and advances as well as states’ perspective of generation of additional revenue by recovering loans and advances is bleak towards the end of the financial year.
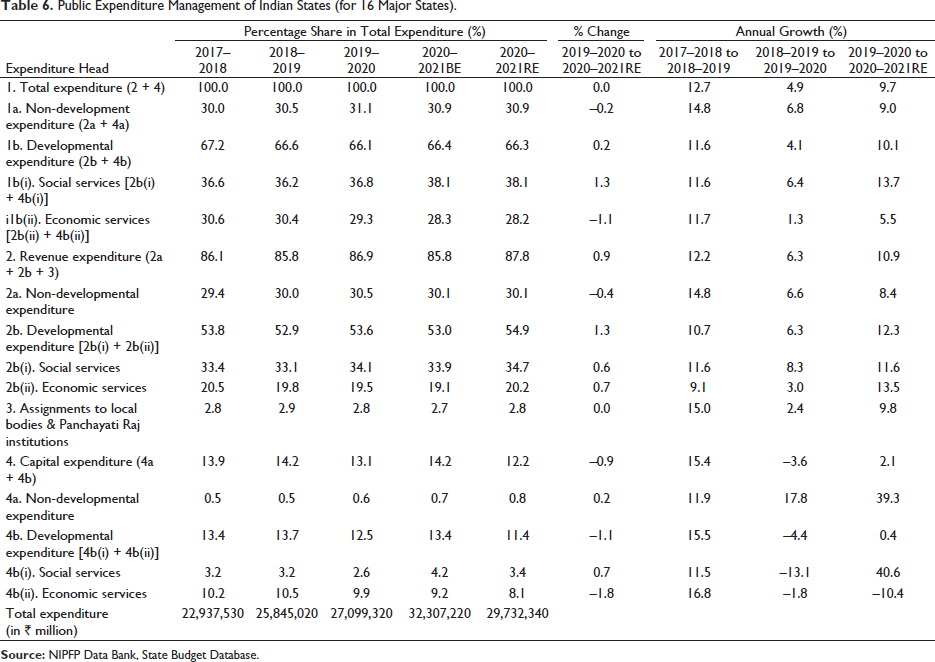
Analysis of expenditure side of state budgets may help us to understand how states have prioritised expenditures to cope up with the falling revenue. Table 6 shows that with reference to 2019–2020, structural composition of expenditure of 16 states (in aggregate) has undergone minor changes in 2020–2021RE. Developmental expenditure (comprising sum of expenditures on social and economic services) shows marginal increment (as share of total expenditure) vis-à-vis marginal fall in non-developmental expenditure. 6 Share of expenditure on social services (which includes health, education, social security benefits, etc.) shows an increase by 1.3 percentage point vis-à-vis fall in economic services by 1.1 percentage point. Share of revenue expenditure in total expenditure shows a marginal increment vis-à-vis corresponding fall in capital expenditure.
Public Finance Managements of Indian States (for 16 Major States) (₹ million).
Public Expenditure Management of Indian States (for 16 Major States).
The experience of individual state may help us to get insights into PFM of state finances in India during the pandemic in 2020–2021. It is likely that different states have experienced different level of fiscal shock due to the pandemic. The abilities of states to cope up with the fiscal shock also vary depending on capacity to contain expenditures (expenditure management) as well as augment revenues (subject to fiscal capacity). The data upto Q3 of 2020–2021 validates that all states have experienced a decline in tax devolution from the union government. The major decline of more than 20% with respect to the same period of the last year is observed for 9 major states (Table 7), whereas remaining 7 states have experienced a decline between 10% to 20%.
Receipts Side
Except Andhra Pradesh (AP) and Punjab (PB), all other states have experienced fall in total receipts upto Q3 of 2020–2021 vis-à-vis Q3 of 2019–2020. AP and PB have maintained their receipts by way of transfers from the union government and/or augmenting revenues from alternative sources. Punjab experienced 105% growth in grants-in-aid transfers from the centre upto Q3 of 2020–2021 vis-à-vis Q3 of 2019–2020 and also maintained growth in revenue collections from state sales tax and state excise duties. In Andhra Pradesh, non-debt capital receipts show impressive growth of 2132.4% upto Q3 of 2020–2021 vis-à-vis Q3 of 2019–2020. Similarly growth in land revenue collections was 690% in AP during the same period. Moreover, AP has also received 77.7% more grants-in-aid transfers from the centre till Q3 of 2020–2021 vis-à-vis the same period of 2019–2020. The increase in grants-in-aid transfers to Punjab and Andhra Pradesh may be on account of Revenue Deficit Grants as recommended by the Fifteenth Finance Commission as well as GST compensation payments.
Maharashtra (MH), AP, Odisha (OD), Uttar Pradesh (UP) and Madhya Pradesh (MP) witnessed positive growth in the non-tax revenue collections upto Q3 of 2020–2021 vis-à-vis Q3 of 2019–2020. Also MH, MP, Karnataka (KR), WB, AP and UP have registered growth in the non-debt capital receipts during the same period. Except Chhattisgarh (CG), all other states have observed fall in OTR collections upto Q3 of 2020–2021. CG has witnessed positive growth of 78% and 68.6% in land revenue collections and other taxes and duties in Q3 of 2020–2021 vis-à-vis Q3 of 2019–2020, respectively. Also fall in revenues from sales tax and stamp and registration fees were less than 3% and these taxes helped the state to maintain positive growth in OTR collections.
OTR of most of the states deteriorated mainly due to fall in revenue on account of GST collections. Most of the states have witnessed positive growth in land revenue collection, though it contributes very less in overall own-tax revenue. However, it helped states to some extent to rein in deficits. For example, AP, West Bengal (WB), OD, Karnataka (KR), Jharkhand (JH) and CG have witnessed growth in land revenue collection upto Q3 of 2020–2021 vis-à-vis Q3 of 2019–2020. The growth was comparatively high for CG, JH and AP as compared to other states. Similarly KR, PB, UP, Rajasthan (RJ), and Telangana (TL) have experienced an increase in state excise collections upto Q3 of 2020–2021 vis-à-vis Q3 of 2019–2020. Moreover, PB, RJ, MP, TL, WB show a rise in their sales tax collections despite of falling revenues from other sources.
Major shocks in TRR upto Q3 of 2020–2021 vis-à-vis Q3 of 2019–2020 are observed for five states, namely, Haryana (HR), Gujarat (GJ), KR, MH and WB, and it was –21.2%, –18.5%, –18.4%, –17.6% and –17.2%, respectively. Gujarat has not experienced any growth in tax and non-tax revenue collections as well as in non-debt capital receipts till Q3 of 2020–2021 vis-à-vis 2019–2020. Haryana (HR) experienced shocks from both the sources of revenue (tax as well as non-tax) and also in non-debt capital receipts. The state somehow tried to maintain the revenue collection from state excise and sales tax collections, as the fall was around 0.5% and 4% respectively till Q3 of 2020–2021 vis-à-vis the same period of 2019–2020. To some extent grants-in-aid transfers from the centre turn out to be the shock absorber for Haryana as growth was 1.7% in Q3 of 2020–2021 as compared to Q3 of 2019–2020.
This shows that different states have different strengths and weaknesses in managing revenue shock. Inter-governmental fiscal transfer system has played an important role in easing out fiscal stress for some states as grants-in-aid transfers (including GST compensation payments) show growth upto Q3 of 2020–2021 over the same period of 2019–2020 for MH, CG, HR, KL, AP, PB, TL and TN (Table 7). A substantial source of OTR of states is subsumed into GST and individual state did not deviate from the harmonised structure of GST to augment revenue by changing GST rates. In this context, the GST compensation payment helped states to face the revenue challenges posed by the COVID-19 pandemic. It is interesting to note that, in the face of revenue shock states have explored alternative revenue sources. Given their tax base and capacity to mobilise additional revenue, different states have experienced different levels of success in mobilising additional revenue. For example, Andhra Pradesh shows 10.7% growth in total tax revenue (TTR) despite the COVID-19 pandemic. Similarly, Maharashtra has tried to augment resources from non-tax revenue collections and non-debt capital receipts along with the grants-in-aid transfers from the centre. Kerala shows only 1% contraction in TRR, as grants-in-aid transfers show 289% growth during the time of pandemic vis-à-vis the corresponding period of the previous year. Uttar Pradesh has also tried to mobilise own revenues from sales tax, state excise duties, non-tax revenue as well as non-debt capital receipts. Moreover Madhya Pradesh, Jharkhand, Rajasthan and Odisha show positive growth in stamps and registration fees collections. Overall, for some states grants-in-aid turns out to be the major revenue shock absorber, however some states have also tried to absorb the shock by exploring own revenue sources (e.g., OTR collections, non-tax revenue and non-debt capital receipts).
Expenditure Side
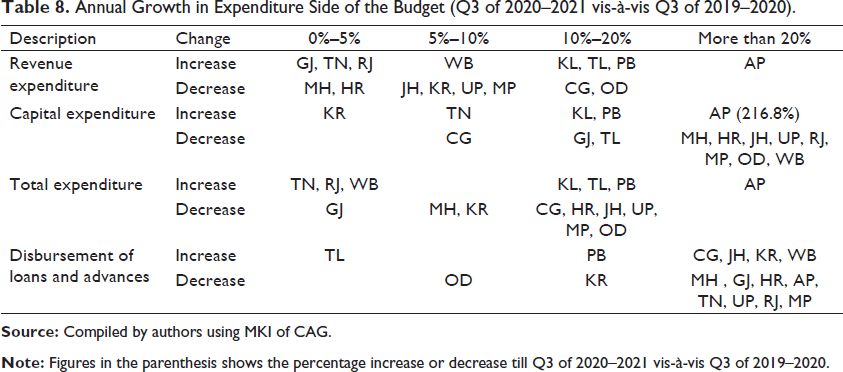
States with severe revenue shocks have tried to contain revenue as well as capital expenditures, whereas states with better revenue collections have expanded expenditures to boost the economic growth. Also some states did not contain expenditures despite facing severe revenue shocks. Revenue shocks were not severe for Andhra Pradesh, Punjab and Kerala and there was stability in revenue collections upto Q3 of 2020–2021 vis-à-vis Q3 of 2019–2020. Since revenue collections were stable, these states did not curtailed their total expenditure in the time of pandemic. The total expenditure of AP, PB and KL shows growth of 37%, 18% and 13%, respectively upto Q3 of 2020–2021 vis-à-vis Q3 of 2019–2020. In revenue expenditure, AP shows impressive growth of 26.7%, whereas for PB and KL the growth was 18% and 12.5%, respectively. In capital expenditure, AP shows growth of 217%, whereas PB and KL show growth of 13% and 18% respectively. This shows that states were responsive in providing fiscal stimulus to revive economic growth, given the revenue constraints they faced during the time of pandemic. To support public health facilities and basic livelihoods to people, expenditures on revenue account play a key role. To increase capacity of states in providing medical and public health services, expenditures on capital account are also important. Therefore, expansionary fiscal policy adopted by some states in the time of pandemic may help to boost the economy as well as providing better public services to people. Impressive growth in capital expenditure is observed for AP and this was possible due to curtailment of disbursement of fresh loans and advances by 73% and augmenting revenues from alternative sources.
Gujarat experienced severe revenue shock as revenue contracted by 18.5%, which led the state to curtail capital expenditure by 19% till Q3 of 2020–2021 vis-à-vis Q3 of 2019–2020. On revenue expenditure a positive growth of 0.5% upto Q3 of 2020–2021 vis-à-vis Q3 of 2019–2020 is observed. Gujarat has also curtailed disbursement of fresh loans and advances by 27% (approx.) during the same period. This shows that expenditure management on capital account was the strategy for Gujarat to cope up with revenue shock. Similarly, West Bengal experienced revenue shortfall of 17%, but expanded revenue expenditures by 7% and curtailed capital expenditures by 50%. On the other side, Karnataka has experienced revenue shortfall of 18%, and to cope up with the situation, curtailed revenue expenditures by 8% (approx.) whereas increased capital expenditures by 3% upto Q3 of 2020–2021 vis-à-vis Q3 of 2019–2020. This shows that states are innovative in managing their public finances, given their expenditure commitments and revenue constraints. Different states have faced different fiscal situations where some states have expanded either revenue or capital expenditures whereas some states have expanded both.
On total expenditure, Tamil Nadu, Rajasthan, West Bengal, Kerala, Telangana and Punjab have maintained growth despite of falling revenues. Whereas, states such as Chhattisgarh, Haryana, Jharkhand, Uttar Pradesh, Madhya Pradesh and Odisha have reduced total expenditure between 10% to 20% (Table 8).
Annual Growth in Receipts Side of the Budget (Q3 of 2020–2021 vis-à-vis Q3 of 2019–2020).

Annual Growth in Receipts Side of the Budget (Q3 of 2020–2021 vis-à-vis Q3 of 2019–2020).
Annual Growth in Expenditure Side of the Budget (Q3 of 2020–2021 vis-à-vis Q3 of 2019–2020).
The study highlights the major challenges faced by both the union and state governments in managing public finance during the time of COVID-19 pandemic. The analysis shows that public finance of the union government is going through stress. Except UED, the revised estimates of 2020–2021 show fall in revenue collections from all sources of tax and non-tax revenues. The lower international crude petroleum prices during 2020–2021 helped the union government to increase UED on petroleum products. However, the rise in UED collection was certainly not enough to compensate the shortfall in revenue from other sources. Despite revenue shortfalls, the union government has increased expenditures on both revenue and capital accounts to respond to the pandemic. This led to high revenue and fiscal deficit during 2020–2021.
The revenue shock faced by the union government resulted in lower tax devolution to states in nominal terms over the last two years. The article presented the aggregate picture of state finances of 16 major states based on MKI database of the CAG upto Q3 of 2020–2021 and also state specific analysis of these states. In addition, the article also presented revised estimates of 2020–2021 for 16 states (based on budget documents of 2021–2022) to confirm the trends presented using the MKI database of CAG. The analysis using two databases confirms that except for grants-in-aid from the centre (including GST compensation payment), states have experienced revenue shocks from all sources of revenue. The total revenue receipt of the states contracted by 11.34% till Quarter 3 of 2020–2021 vis-à-vis Q3 of 2019–2020. OTR collection showed a contraction of 12.7% till Q3 of 2020–2021 vis-à-vis the same period of 2019–2020. This was mainly due to fall in revenue collections from major sources of OTR such as GST, state sales tax, stamps and registration fees and other taxes and duties. Collection from state excise duties showed a positive growth but that was mainly in states where the impact of COVID-19 pandemic was not severe. Revenue from stamps and registration fee showed the highest contraction. On the expenditure side of state finances, states have responded by reprioritisation of expenditure. However, expenditure reprioritisation was not enough to absorb the revenue shock which resulted in running high deficits.
Appendix
Collection of Union Excise Duties and Annual Growth.

Footnotes
Declaration of Conflicting Interests
The authors declared no potential conflicts of interest with respect to the research, authorship and/or publication of this article.
Funding
The authors received no financial support for the research, authorship and/or publication of this article.
