



Abstract
The article investigated the effect of foreign direct investment (FDI) on Indian exports using aggregate and disaggregate data to capture macro- and micro-channels. India registers a steady rise in FDI during 1980–2018 in absolute terms but not in terms of GDP share. At the aggregate level, FDI is found to have significantly influenced Indian exports (both manufacturing and services) during 1980–2018 by suppressing its adverse effect on currency appreciation. Even at the firm-level analysis using the World Bank Enterprise Survey database, it is evident that higher participation of foreign ownership, a proxy of FDI measure, seems to have encouraged their export decisions. However, more than 50% of the capital inflows are received from two three countries which is also on limited service-related activities. The lower FDI share on manufacturing has limited the export rise.
Introduction
Gradual withdrawals of restrictions on capital mobility across the countries have accelerated the pace of globalisation during the last couple of decades. Investments outside the country to take advantage of abundant factors, resources, institutions and market conditions have become increasing evidence of globalisation and have remained steady (Antràs & Yeaple, 2014). Its effect on exports has been an area of investigation among scholars. India has gradually undertaken reforms that favour capital inflows intending to boost exportability during the last two decades. Export deceleration leading to a decline in the foreign reserve has necessitated pursuing a strategy of gradual liberalisation for capital mobility in India from the 1980s. The economy further initiated reforms on capital mobility from 2014 onward to encourage foreign direct investment (FDI), especially in insurance, infrastructure, defence and others through the automatic route. While the capital inflow does improve an economie’s foreign reserves and productive capacity, its impact on exportability is yet to be consensual in the Indian context.
Needless to say, before the economic liberalisation initiated in the early 1990s, India pursued a policy for growth acceleration that relied heavily on import-substitution strategy during the early days of the planning period. The strategy could not contribute much to the process of industrialisation. Instead, it offered a monopoly element to a limited number of domestic firms. Subsequently, economic reforms were initiated during the early 1990s to deal with it, which ensured a clear transition from import substitution to an export promotion-led strategy. Here, the FDI has been emphasised as one of the crucial inputs (Chakraborty et al., 2017; Palit, 2009). This was accompanied by the withdrawal of the ‘Licensing Raj Systems’ and explicit removal of the entry and size restrictions therein so that a firm could enjoy requisite economies of scale taking part in the export sale (Rajan & Sen, 2002). This apart, being a member of WTO, India gradually phased out trade restrictions and took part in several regional trade agreements (RTAs) for the same. More recently, comprehensive agreements involving investment provisions have been signed up with Easter countries, namely Japan, Singapore, South Korea and some others (Chaisse et al., 2011).
Although the economy has maintained a decent growth rate during the last two decades, it has been much lower than the one seen a decade ago. A major concern is that employment, especially in the formal sector, has declined significantly after the global financial crisis of 2008. Investment in the productive sector is very much required to stimulate growth and employment opportunities in the formal sector of the economy. On the other hand, even after a decade of the global financial crisis, the Indian banking sector could not yet come out of it entirely. Furthermore, the increased non-performing assets (NPA), money laundering, the liquidity crisis in the real estate sector, etc., during the period has further added to the stress level of the financial health of the banking sector. In this situation, the capital inflow can contribute to growth by accelerating capital accumulation. But, the dilemma of whether India would compete with China, the largest exporter in the global markets, and other eastern countries in the international market restrained the decision of capital market reform.
Moreover, the recent slowdown of economic growth and rising current account deficit raise a concern to maintain decent growth and sufficient foreign reserves, especially when the developed world is becoming more restrictive for trade and capital mobility. The prolonged deceleration of the Western world since 2008 has added further difficulties to sustain the export growth of the Indian economy. Hence, the immediate question is whether the capital inflows have contributed significantly to the growth of aggregate demand by expanding the exportable sector. This article aims to investigate this issue.
While a large volume of literature looked at the micro-channels, the macro-relationship on the issue is under-researched. According to Sharma (2000), the foreign investment appears to have a statistically insignificant on India’s export performance although the coefficient of the FDI variable has a positive sign. Using the autoregressive distributed lag (ARDL)-bound testing co-integration approach, Mohanty and Sethi (2019) confirmed that there is no solid long-run relationship between foreign investment and exports even during 1980–2017. In a similar study, Saini et al. (2017) found a strong co-integration between them during 1991–2012 and showed that export increases many-fold in the long run with FDI. So, there is no consensus among the scholar about their relationship and the transmission mechanism.
The mixed pieces of evidence from earlier studies encourage us to undertake a fresh study to investigate the relationship between FDI and exportability in India. Have there been any changes in recent years after the global financial crisis? Using both aggregated and disaggregated levels of data, the econometric analyses found a favourable impact of FDI on Indian exports, specifically on manufacturing exports. The service sector in India is large but has a limited possibility of exports. Hence, with the expansion of manufacturing activities, the impact would be much stronger. The rest of the article has been organised as follows. A brief review of theoretical literature has been presented in Section II. Section III outlines the aggregate and disaggregate levels of analysis respectively. Section IV ends up with concluding observations.
Literature
The FDI can benefit the host economy directly by giving a better use of the abundant factor and indirectly by creating competitive pressure and ambient productivity rise that may improve exportability. According to the conventional theory, exports and outward FDI are the alternative modes of accessing foreign markets (Horst, 1972). Hence, Bhagwati (1973, 1987) argued that a government could strategically raise import barriers to incentivise FDI decisions, which is known as the tariff-jumping argument. Further, if transport or other logistic costs are treated similarly to tariffs and non-tariff barriers, the firms may find an incentive to locate directly in the market to sell the goods (Beladi et al., 2009; Hwang & Mai, 2002). However, if the economies of scale are active at the plant level, the production may lead to concentration, thus increasing the likelihood of supplying a foreign market through exports (Brainard, 1993; Markusen & Venables, 1998). Moreover, scale advantages (Brainard, 1997), wage differences in line with the Factor Proportion Hypothesis (Ethier & Horn, 1990; Helpman, 1984; Markusen, 1984), firm productivity levels (Helpman et al., 2004; Melitz, 2003) and benefits received from internalisation (Markusen & Venables, 1998; Williamson, 1975) heavily influence the decision. So, the trade-off between the decisions of FDI and exports in the form of tariff jumping has also been dependent upon these factors. The FDI is found to have taken place in parallel to the exports to the host country, either through vertical or horizontal activities (Antràs & Yeaple, 2014). The evidence further suggests that a firm may invest simultaneously in horizontal and vertical activities (Bergstrand & Egger, 2007; Yeaple, 2003). Horizontal FDI is done with a market-seeking motive and to bypass the trade costs (Lederman, 2011), whereas horizontal FDI generally occurs between countries with comparable income and technological states (Markusen, 1984). The literature considers horizontal FDI as a trade substitute (Ito, 2013; Markusen, 2004). Whereas, a primary motivation behind horizontal FDI is to export the surplus production of the host country market to its neighbouring countries.
On the other hand, the intention behind the vertical FDI has been more to exploit the local advantages (i.e., raw material, skilled workforce etc.) by creating a production facility of an MNC in a country. Such FDI mainly occurs between a technologically advanced and a developing country to a large extent (Helpman, 1984). There exist a rich literature, which explains that vertical FDI occurs based on the agreement between the parent and the network of its subsidiaries, leading to trade in parts (or intermediate inputs) for the subsequent stages of production (or processing) (Calderón et al., 1996; Goldberg & Klein, 1999; Rodriguez-Clare, 1996; Svensson, 1996). More importantly, the vertical FDI may also result in the export of end (or final) products from the recipient country. Countries are often engaged in agreements to facilitate the exportable sectors. It is also important to note that the condition of the local market environment very much influences the choice of FDI and export. In a strategic market environment, this may depend on the relative strength of the competitiveness and technology spillover effects revealing on the marginal cost of production. If the spillover effect is stronger, the export sector will be a boost. In any case, the government policy may have some roles to accelerate both. Literature highlighting the role played by the policy environment discusses the issues of creating an investor-friendly environment for FDI that favours the host country labour market (Oxelheim et al., 2013). According to a World Bank report on indicators of FDI regulation (2010), the restrictive and obsolete laws and regulations impede FDI, red tape and poor implementation of laws create additional barriers to FDI, whereas the reasonable regulations and efficient governance encourage FDI, and effective institutions foster FDI. So, depending upon the motive of FDI and export decisions of firms, one may find their exact relation.
Empirical literature too does not offer unambiguous relation. Using 43 Indian industries data for the period from 1975–1976 to 1980–1981, Kumar (1994) did not find any significant difference in performance between the export orientation of the local counterparts and the affiliates of the MNCs. In another study using 13 Indian industries for the same period, Kumar and Siddharthan (1994) also found similar results. One may not expect a significant relation in a protective environment. However, the trade reforms, especially from the early 1990s, might have changed the relationship later. Sharma (2000) found that foreign investment was statistically uncorrelated with India’s export performance. In a much later period, some studies exhibit the presence of a positive relationship between FDI and exports (Jayachandran & Seilan, 2010; Prasanna, 2010). Whereas some studies showed that FDI does not cause export, instead, it is the export that causes FDI (Chakraborty et al., 2017; Sultan, 2013). Conversely, several studies refute a necessarily positive effect of FDI on exports (Singh & Tandon, 2015).
It is further argued that every entry of foreign funds in India has been based on the market seeking a motive and hence could not contribute to the exports (Aggarwal, 2002; Lall & Mohammad, 1983; Sharma, 2000). The international capital moved in to secure the domestic market. According to an NCEAR (National Council of Applied Economic Research) study, Sebastian (2010) has highlighted that a large part of FDI goes outside the Special Economic Zones (SEZs) regions and hence did not contribute much to the export basket. FDI explains only around 8% of the total investment made in SEZs and the contribution of export revenue to the total sales of the firms receiving FDI is merely 13%, thus validating the above argument. Banga (2006) used the US and Japanese investments in India and showed that the weak link between foreign investment and export intensity lies in the difference in technology levels between the host and home countries. Further, some scholars (Hattari & Rajan, 2011; Rajan et al., 2008) argued that the non-promoting of FDI on Indian export is also related to the perception of investors regarding the suitability of India as a manufacturing hub. On the other hand, some of the existing literature argued that the foreign investment lacked active export, which limited the exportability of the foreign-affiliated enterprises (Pradhan & Aggarwal, 2011; Sudershan et al., 2012).
While the Indian experience shows ambiguity, the favourable impact of FDI on exportability has been much pronounced and stronger in the case of other developing countries. For example, Mahmoodi and Mahmoodi (2016) found a strong relation between FDI and exports in a panel study over several developing countries. Graham (2005) noted a healthy relationship for China since the late 1970s. Since 1978, China pursued twin objectives, substantial technology upgradation as well as export orientation, and enacted suitable laws by encouraging joint ventures between the Chinese and foreign enterprises. They made to link with the town and village enterprises (TVEs) through the initiatives of such joint ventures to economise costs of production. These reforms contributed to the inflow of foreign investment in China and subsequently led to the creation of several SEZs since 1979. The combined effect enabled the creation of an environment, which led foreign investors to operate hassle-free by allowing them to import raw materials. Zhang (2005) suggested that labour-intensive industries of China have a strong export-augmenting effect. Several other studies also offered a similar conclusion (e.g., Awokuse et al., 2008). However, Sun (2001) has found that the impact of FDI substantially varies across regions in China. A strong positive relationship was found in Turkey (Alıcı & Ucal, 2003; Vural & Zortuk, 2011), East Asian economies (Johnson, 2006), US economy (Clausing, 2000), ASEAN countries (Gunawardana & Sisombat, 2008), Malaysia (Mithani et al., 2008), Thailand (Tambunlertchai, 2009), New Zealand (Bhatt, 2010) and some other countries.
Recent studies point out that FDI leads to an increase in the export share of the foreign-invested enterprise along with the export sophistication of the private-owned enterprise (Li et al., 2021). This indicates that FDI improves the capability of the recipient country enterprise. Further, Sun et al. (2020) suggest that FDI is more beneficial for export promotion compared to the trade liberalisation policy. Highlighting the spillover effect of FDI, Sasidharan (2020) suggested that FDI favours the performance of domestic firms.
All these shreds of evidence in recent times seem to suggest a simultaneous existence of FDI and exports among multinational firms, which goes against the tariff jumping argument. Antràs and Yeaple (2014) offered a framework to show the simultaneous existence and demonstrated that the most productive firms, in the distribution of heterogeneous firms in terms of productivity, invest abroad. Note that, by raising tariff and transport costs of trade, FDI cannot be encouraged. Rather it requires a better environment to attract the capital inflow.
Empirical Framework
Aggregate Scenario
According to an NCAER report, India has become the 9th largest recipient of FDI in the world in 2014 (Satyanand, 2016). India’s share of global annual FDI inflows has raised from 0.05% in 1991 to an average of 2.1% from 2010 to 2014, with a peak of 2.9% in 2009. Similarly, FDI as a percentage of gross fixed capital formation rose from 0.1% in 1991 to 12.3% in 2008 and has averaged 5.7% between 2009 and 2014. However, it was an unusual period during 2008–2014 because of the global financial crisis. Undoubtedly, the FDI has increased sharply in India during the 2000s and recovered after the global financial crisis as well in absolute terms, following a slight drop after 2011 (see Figure 1). It holds when FDI is measured in real terms. However, in a relatively long period of data from 1980, the FDI in the manufacturing sector (as a percentage of GDP) has registered a sharp improvement from 0.64% in 1980 to 3.16% in 2009 and then gradually declined to 1.54% in 2018 (see Figure 1). More importantly, the share of FDI has remained very low in the country to derive its favourable impact significantly through competitive forces and spillover effects. But, the trend looks better when one considers FDI in both manufacturing and services together. In the post-2008 period, there is a steeply rising trend.
To highlight the structural change in response to the policy reforms, one can divide the entire period into three regimes/phases. In general, India had no restrictions on remittances during 1950–1960 but did not give any special treatment to FDI much. The introduction of the Monopolies and Restrictive Trade Practices (MRTP) Act in 1969 and the Foreign Exchange Regulation Act (FERA) in 1973 were found extremely protective for domestic firms and had created hostility in the Indian economic and political environment. During 1980–1990, denoted as Phase 1, the FDI remained a negligible share of GDP and did not show any significant change. The economy was much protective for trade and followed a pegged exchange rate system with a fair amount of control on capital mobility and restrictions imposed on FDI without technology. More than 40% share of foreign capital was not allowed. FDI was heavily regulated by FERA. However, India began to allow FDI in export-oriented units and export zones from the early 1980s. A liberalised strategy was adopted for remittance flow and royalty receipts, and the FDI clearance was made faster.
In the early 1990s, the Indian economy initiated a series of reforms on industrial policies including in the area of foreign trade, capital mobility and exchange rate management practices. Trade and capital restrictions began to fall since then. MNCs were allowed to increase their shares to 49%. The exchange rates were gradually made flexible. Foreign collaborations and joint ventures were encouraged, even in core sectors and infrastructure through the direct route. The FERA was replaced by FEMA (Foreign exchange management act) in 1999 to facilitate external trade and investment as well as to promote the orderly development and maintenance of the foreign exchange market in India. The inward FDI did not require to be accompanied by technology anymore. FDI was encouraged through mergers and acquisitions in the services and financial sector, non-banking financial companies and insurance, etc. As a result, there is a sharp rise in FDI share in GDP during the period from 1990 to 2007, and this period is denoted by Phase II (see Figure 1).
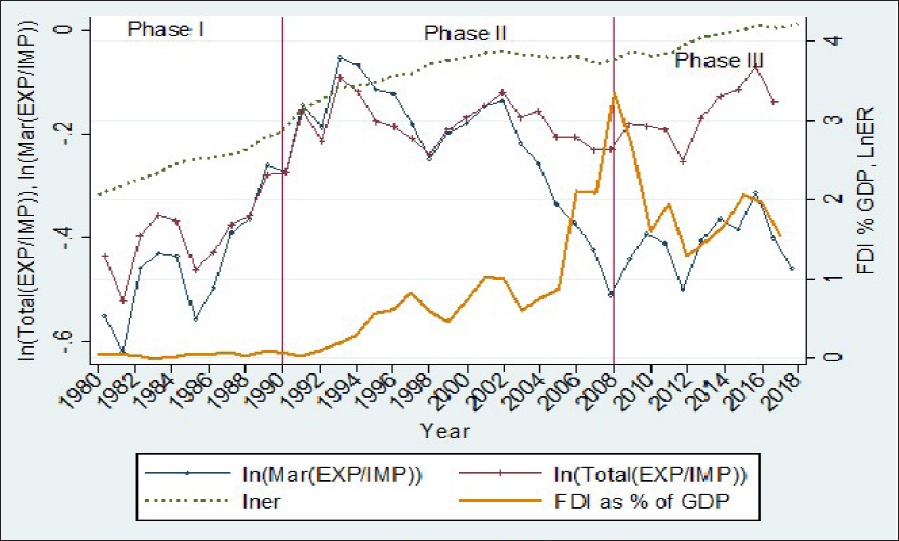
From early 2010 onward, the focus of FDI began to change substantially. FDI was encouraged in several sectors selectively for job creation in domestic manufacturing. But, full Indian management and control through a route of Foreign Investment Promotion Board (FIPB), a national agency of the Government of India that deals with the recommendations of remittance and FDI for those, had been retained. From 2014 onward, FDI has been allowed to flow into the development of smart cities, and the limit was brought down from 50,000 square meters to 20,000 square meters. FDI in manufacturing can flow through an automatic route. Manufacturers were allowed to sell through the retail sector including e-commerce platforms. The limit of FDI has been increased from 26% to 49% in the insurance sector and from 74% to 100% in civil aviation through the automatic route. FII/FPI (foreign portfolio investor) is allowed to invest in the power exchanges through the primary market. And, 100% FDI in asset reconstruction companies and construction was permitted. The limit for investment by FPIs in the central public sector enterprises, other than banks, listed in stock exchanges raised from 24% to 49%. The investment limit for foreign entities in Indian stock exchanges has been enhanced from 5% to 15%. Incidentally, in the recent year, the developed world initiated a few restrictions on free mobility of trade, capital and labour (e.g., Brexit, US’s foreign policies on trade and outsourcing) after the global economic crisis and hence led to a drop in FDI even when the Indian economy has liberalised the policies to encourage it. This period is referred to as Phase III.
Since the effect of FDI on exportability from India would be explored, it is important to understand its effect through the exchange rate movement and terms of trade dynamics at the macro-level. The conventional understanding suggests that any FDI inflow should appreciate the domestic currency, there discouraging exports a bit, and vice versa. During the period of FDI expansion, the exchange rate has been appreciated a bit in Phase II. But, this did not affect much of the net exportability. However, the exchange rate has sharply depreciated along with a sharp decline in FDI share in GDP in Phase III. We cannot confirm any causal relationship between them unless a proper econometric exercise is undertaken. To investigate whether FDI contributes to exports, we have undertaken a co-integration analysis.
It is expected that FDI raises the capital intensity and creates an externality that improves productivity and hence, is expected to increase exportability because of the increased productivity. At the same time, the FDI can appreciate domestic currency that may go against a rise in net exports. On the other hand, the rise of exports contributes to the GDP acceleration. Both the exchange rate appreciation and GDP rise tend to push the domestic inflation. If the central bank wants to limit inflation, the lending rate (a proxy for the policy rate) will be monitored. If the interest rate is reduced to curb inflation, it may discourage the FDI a bit. we would like to investigate whether this transmission mechanism is empirically true for the Indian economy.
Among the other variable to be affecting net exportability, the real effective exchange rate is widely used as one of the explanatory variables according to the Mundle-Fleming model. However, we do not want to include the real effective exchange rate. Because the FDI may influence the nominal exchange rate and domestic inflation at different rates. They could be captured by separating from the nominal exchange rate. If
Schematic Representation of the Transmission Process of FDI.

To investigate the short- and long-run dynamics, we have applied the vector error correction model (VECM) (see Equation 1). Dickey−Fuller tests suggest that all variables are stationary at order one. Moreover, Johanson co-integration test further suggests that there exists at least one co-integrating vector. The Akaike Information Criterion (AIC) tell that the optimal lags in the model should be four. To capture the effect of FDI on exports, the following model will be investigated econometrically:

where Y is defined as dependent variables, X represents a set of other exogenous variables. So, there are five equations in the system with four lags of each endogenous variable. We estimate the long run as well as the short-run model with net export (in log term) separately for manufacturing and total exports (including service exports).
FDI and Exports during 1980–2018: The Long-Run Relation of VECM.

The econometric result of the long-run relationship has been reported in Table 1 and the short-run estimates in the appendix table (respectively Table A1 and A2). Table 1 shows a positive relationship between FDI and net exports in the long run and the impact seems to be high for manufacturing exports. So, FDI has significantly influenced the net exports of Indian manufacturing and both manufacturing and services combined. The FDI has been encouraged to flow into the real state, defence, insurance and telecommunications, by the reform measures, and these are consumed domestically to a large extent. As a result, the impact seems to be a bit lower when service exports are included. It is also noteworthy to report that lnGDP has positively contributed to the expansion of exports both for manufacturing and services. The depreciation of the currency, defined by a rise of lnER, has worked favourably to improve net exports. On the other hand, the net exports are negatively affected by the rise of terms of trade. Note that the terms of trade can be presented as an inflation gap. If the domestic price rises faster than that of foreign, the terms of trade go against the domestic economy and the net exports are expected to be adversely affected. A rise in the lending rate seems to have adversely affected the net exports. These are quite standard results.
Since the regression used annual data, the degree of freedom becomes very low for a VECM model with four lags. Hence, the coefficients of short-run dynamics are not all significant. This does not allow us to infer much on the short-run dynamics. Still, a few relations have been highlighted. We find a positive impact of FDI on net exports up to three lags both for manufacturing and total exports, though they are not statistically significant. The rise of net exports contributed favourably to the GDP after one lag for the regression with manufacturing exports and after two lags for the regress with total exports. The domestic currency is appreciated directly by the FDI and indirectly by the exports rise as their respective coefficient are negative. While the currency appreciation and export jointly raise the domestic price immediately, the GDP rise serves as a limiting force on it by supplying products to the economy. Since domestic supply of output moderates inflation, its relation with lending rate does not appear statistically significant. In other words, when FDI improves exportability, it might appreciate the domestic currency and raise inflation. But, the real exchange rate does not change much on the whole. On the other hand, the inflation is moderated by the GDP rise and hence does not invite Central Bank intervention much for the stability. The effect of interest change in FDI has been found insignificant from the short-run analysis. But, the positive relation between FDI and exportability is restored in the long run. However, this analysis using macro-data could be heavily influenced by the limited observations, hence further disaggregated analysis is undertaken using industry and firm-level information. The plausible transmission channel of FDI on exports found in the regression has been presented schematically in Figure 2.
Disaggregate Level of Analysis
According to RBI data, it is noticed that almost 50% of total FDI inflows are routed from Mauritius and Singapore, the countries that are known as tax-free heaven economies and popular trading/tourist destinations in the world. The investment from the developed world is also routed through these countries to take advantage of these favourable policies. However, these two countries are not industrially developed and the direct FDI flow from the developed countries could play a greater spillover effect in the domestic economy. Note that the flow from the UK has substantially dropped from 17.86% in 2013 to 2.73% in 2019. This is also true for Germany and the Netherlands, which are industrially developed countries. A drop has also been registered in for the flow from Hong Kong, but there is an improvement from South Korea.
On the other hand, a larger share of FDI is invested into the banking and construction sectors in the recent past. This has further contributed to expanding the entire service sector (mainly finance, banking, outsourcing, courier etc.) from 10.52% in 2013 to 23.68% in 2019 in six-year terms. This is true for trading as well, whereas the share of FDI inflows to the telecommunication and pharmaceuticals are very low and has been declining too. However, there has been a substantial rise in FDI in the computer software and hardware sector. So, the foreign investment is largely confined to the service sector and does not enter much into the manufacturing sector. Of course, the investment in service sectors can help to reduce manufacturing costs a bit. But, whether this has raised innovation capacity and productivity required for the export of Indian manufacturing is not clear in the existing literature. Note that more than 65% of total FDI in 2019 is confined within the metro cities in India, namely Mumbai, New Delhi and Bangalore. These are the main trading business hubs in India, not manufacturing. This further confirms that FDI tends to enter mainly in the service sector, not much to the manufacturing.
This apart, more than 25% of total Indian exports are originated from minerals, fuels, oils, gems and stones and similar items. These are FDI intensive sectors. The sectors, like pharmaceuticals, electricals, clothing, cotton, register a lower share of total exports. On the other hand, the largest imports come from mineral fuels and oils, gems and stones, electrical machinery and equipment. These three types of products count more than 50% of total imports to India.
The above information suggests that the investment does not arrive much into the manufacturing sector, which could raise productivity to compete with international competitors. For the disaggregated analysis, we have used a unique data set offered by the World Bank Enterprise Survey (WBES) during 2002–2015. The sample firms in the survey from respective countries are chosen on stratified random sampling with weight given to firm size (in terms of the number of workers engaged) and industry contribution to local country GDP. Indian firms were surveyed thrice during 2002, 2006 and 2014. Altogether more than 15,000 firms were surveyed and they are arranged in a pooled database for the regression analysis.
To examine the effect of FDI on firms’ export decisions, the percentage share of foreign ownership is considered as a proxy variable in probit and logistic regression models respectively. In the logistic model, the percentage share of exports in the total sales of a firm is defined as the ‘Export’ variable. On the other hand, the dependent variable is dichotomous in the probit model. Then, export takes value 1 if the firm export to sales share is more than 10% and 0 otherwise. The main explanatory variable, which proxies FDI, is available in the dataset as the percent of foreign share in the enterprise ownership. Following international practices, FDI is defined as the foreign ownership share in the firm.
Following the study undertaken by Singh and Maiti (2019), this work includes firms age, capacity utilisation, size, location, ICT uses and access to finance as other important control variables. Firms’ age is calculated as the difference between the firms’ year of inception and the year of the survey, taken in the log form. This captures the experiences and knowledge capital of the industry. Capacity utilisation is used as the proxy for firm productivity (in log form). Firm size is a categorical variable with ‘small size’ as the reference category. A firm falls under the small category if the number of workers (permanent and temporary adjusted for the number of hours worked) is less than 20; the firm is classified as a medium if the number of workers is more than equal to 20 and less than equal to 99 and the large firm hires more than 99 workers. The variable ‘location’ is also a categorical variable used to capture the effect of location (i.e., whether the firm is operating from a business-friendly place or away from it) and it takes value 1 if the firm is operational from capital or million-plus city and otherwise zero. The variable ‘ICT uses’ captures the application of ICT in business operations. It takes value 1 if the firm uses a website or email to procure, sell, communicate with the seller and buyer, and otherwise zero. Further, we have included country, year and industry fixed effects to control for a year or industry-specific changes. Both probit and logistic regression results are presented respectively in Table 2 and 3. In the first two columns, the probit regression takes the value one for any positive share of direct and indirect exports combined. The regression was repeated separately for bank and formal finances. The last two columns report the results of probit regressions. Similarly, the export share is presented in the percentage share form in the logistic regression in the first two columns. Both direct and indirect exports are considered. Whereas, the share of only direct exports is considered in the regression results presented in the last two columns. The results in both the tables show that the share of foreign ownership is found positive and significant in explaining the exportability of firms. This supports that the findings received from the macro-data analysis above. The firms that hold a share of foreign ownership are exporting more compared to the others. The regressions have been repeated with access to bank finance and access to formal finance separately. In all the regressions, year and industry effects are controlled for. Note that all other control variables register usual signs and significance levels. The results are almost similar in logistic regressions as well. This suggests that FDI inflow has significantly influenced the exportability of firms.
Foreign Ownership and the Export Share of Indian Firms Firm-Level Probit Regression (WBES Survey Data).

Foreign Ownership and the Export Share of Indian Firms Firm-Level Logistic Regression (WBES Survey Data).

The above analysis using both aggregate and firm-level information suggests that the FDI significantly contributes to India’s exportability. The impact is much bigger if the foreign capital happens in on manufacturing sector. Indian economy still maintains a high level of protection for their manufacturing activities. Although the mean tariff rate was reduced to less than 10% for the Indian imports, it started to rise recently. Still, the Indian industry gets huge protection from non-tariff barriers. According to WTO, India has become the highest anti-dumping initiator in the world during 1995–2018. There are other barriers like countervailing duties, technical barriers, special safeguards, etc., showing a similar trend. They must be limiting the effect of FDI on exportability.
India has gradually liberalised capital mobility and shifted away from import substitutions to export promotion strategies during the last three decades. The reform measure on capital investment was largely initiated during the 1990s, and then especially from 2014 onward. This article attempted to investigate whether FDI inflow has contributed to the exportability in Indian industries. It was observed that FDI has increased in absolute terms from the early 1990s onwards. But, the FDI share of GDP has increased during 1990–2007 and did not show any uniform pattern thereafter. To investigate the relationship, the VECM has been applied to the annual data from 1980 to 2018. GDP, nominal exchange rate, terms of trade and lending rate are other endogenous variables in the model. We do find a significant long-run relationship between FDI and net exports at the aggregate level. However, this has a stronger effect on the net exports of manufacturing. Moreover, using the WBES data, the presence of foreign ownership has been found significant on the export sales in both probit and logistic regressions. They complement the overall results found in the macro-analysis. It is further found that FDI is mainly concentrated within the service sector, located in three main cities in India. A very negligible share of FDI falls into the manufacturing sector. Industry- and firm-level information further show that FDI is routed from mainly two countries, Mauritius and Singapore, but did not directly come from the industrially developed world.
India could not attract foreign investment in the core manufacturing sector much. The policymaker should encourage competition, which enhances the innovation and productivity required for exportability. Second, to attract foreign capital, an improvement is necessary for the investment climate, including the quality of infrastructure. India severely lacks on both accounts. Third, more bilateral or multilateral negotiations including the countries in the East must be executed to accelerate regional trade and competitiveness. Fourth, India needs to connect the informal sector to take advantage of low-cost production. The Chinese performance of state-owned enterprises (SOEs) through the TVEs on vertical relations seems a great example of export success. Whether the FDI has benefited the job creation, a desired objective of policy-makers, has not been dealt in this study.
Supplementary Material
Supplementary files are available online.
Supplemental Material for Foreign Capital Inflow, Exportability and the Indian Economy by Dibyendu Maiti, Prakash Singh, in The Indian Economic Journal
Footnotes
Acknowledgement
I acknowledge research support received from the Reserve Bank of India to write this article under Scholarship Scheme for Faculty Members from Academic Institutions—2019. I thank Suranjana Kundu for the research supports. Usual disclaimers apply.
Declaration of Conflicting Interests
The authors declared no potential conflicts of interest with respect to the research, authorship and/or publication of this article.
Funding
The authors received no financial support for the research, authorship and/or publication of this article.

References
Supplementary Material
Please find the following supplemental material available below.
For Open Access articles published under a Creative Commons License, all supplemental material carries the same license as the article it is associated with.
For non-Open Access articles published, all supplemental material carries a non-exclusive license, and permission requests for re-use of supplemental material or any part of supplemental material shall be sent directly to the copyright owner as specified in the copyright notice associated with the article.
