
Abstract
We examine if policy interventions to curb the spread of COVID-19 were driven by political factors. We focus on the period between 1 June and 31 August 2020 when lockdowns and testing were the only responses available with governments and policymakers across the world. These instruments are costly. Stringent lockdowns post challenges to livelihoods while only testing without any lockdown accentuates health risks. This choice between life and livelihood becomes all the more pertinent in a developing country like India. We find that state governments in India that had upcoming elections, faced close margin victory in the last election, were non-incumbents and were aligned with the party at the centre adhered to aggressive testing as a strategy and did not impose strict lockdowns to avert losses in economic activity. Such policy responses indicate an attempt to avert possible losses in future elections. These findings confirm the strong role of political factors in policy decisions.
Introduction
Early evidence of COVID-19 pandemic management from China indicated that social distancing was an immediate effective tool (Fang et al., 2020). As a result, several countries quickly adopted this by introducing measures ranging from travel restrictions to stringent lockdowns. Such non-pharmaceutical interventions imply a trade-off between the smooth functioning of economic activity (livelihoods) and a rise in the level of infections (lives) thus causing adverse health consequences (Alvarez et al., 2020; Ghosh et al., 2020).
Testing is another effective policy tool to gauge the spread of COVID-19 infection. Abundant and accurate tests are critical in containing the infection spread by timely detection of the infected, isolation and adequate care of the infected. Moreover, testing is an effective signal for community transmission. A higher proportion of positive test signals the need to practice social distancing, wear masks and avoid further spikes in transmission. Thus, testing is instrumental in constraining future infections and deaths.
Against this background, we use the two policy interventions of lockdown and testing to examine the state-level COVID-19 response in India. After a strict six-week nationwide lockdown in India spanning over April and May, the Centre transferred the decision of lockdown imposition to individual states. What followed was a huge variation in state-level lockdown policies with stringency varying within states and over days of the week. This provides us with an excellent opportunity to examine the difference in approaches state governments undertook to control the pandemic at the subnational level. Based on election timings, political competition, federal structure and anti-incumbency sentiments that dominate the landscape of political systems in India, we identify four salient political factors that could influence COVID-19 response by the state governments. Next, by grouping states according to these measures, we explore if there is a specific pattern in which the two instruments of testing and lockdown were implemented.
It is likely that the spread and severity of COVID-19 determined the policy choices made by the governments. Therefore, while analysing the role of political factors we control for the same in a unique manner. Instead of comparing states at a daily interval, we deviate from the calendar-based approach to the timescale defined as the rise in COVID-19 spread. This ensures a fair comparison of interstate responses after taking explicit account of the pace of COVID-19 spread. Additionally, this approach allows us to indirectly control for all pre-existing differences including institutional quality, medical infrastructure and other socio-economic characteristics among states through the rise of COVID-19 spread. 1
Our main findings are as follows. All Indian states have increased their testing rate and lockdown stringency overtime and exhibit a pattern where states with upcoming elections have a higher testing rate as compared to states with elections on a later date. Similarly, state governments facing a strong opposition, that were not in power in the previous term and that belong to the same party that runs at the Centre, have a higher testing rate as compared to the other relevant groups. We also find that this group of states responded with a less stringent lockdown for the same rise in COVID-19 spread implying that along with aggressive testing, these states were also trying to avoid disruptions in economic activity, which may be beneficial in gathering higher vote banks for the next elections.
Overall, we find strong evidence of the role of political factors in panning out COVID-19 policy responses by the states of India. We validate these findings by using an alternate measure of lockdown stringency. We also try to compare the state-level responses to the rise in mortality rates as against the case spread. Our findings are valid for both extensions.
Conceptualising State Response to COVID-19
The objective of a government in pandemic management can be to reduce infections and casualties at the cost of output losses due to lockdowns. Alternatively, the government can minimize output losses at the cost of losing lives. Testing and lockdown restrictions can be viewed as policy actions that reflect the government’s stand on balancing health and economic costs related to COVID-19. If the government pursues aggressive testing policies and tracing without a lockdown, it prioritises livelihoods. One may argue that less stringent lockdowns may also be a consequence of contact tracing where only the infected are quarantined without hampering economic activity. However, effective contact tracing involves adequate testing to identify the infected group of people. Further, governments that pursue aggressive testing can use it as a reliable signal of community transmission. If tests indicate a high number of positive cases, governments can use it to encourage people to practice social distancing more effectively (Jain & Chatterjee 2020). On the other hand, if a state government uses lockdowns as the major policy intervention, it reflects the state’s focus on saving lives over livelihoods.
Table 1 suggests that the pace of economic activity is directly dependent on lockdown stringency. In contrast, the spread of infection is dependent on both lockdown and testing effects. For instance, a stringent lockdown with a less aggressive testing strategy may lead to high or low infections depending on the level of infection spread. At very low levels of infection rate, low testing and stricter lockdowns may or may not work but at high levels of infection, they will certainly not work. Thus, the effect of lockdown and testing is dependent on the extent of the spread. Hence, any attempt to examine the state’s response must take explicit account of the spread of COVID-19.
Effect of Testing Strategies and Lockdown Stringencies.
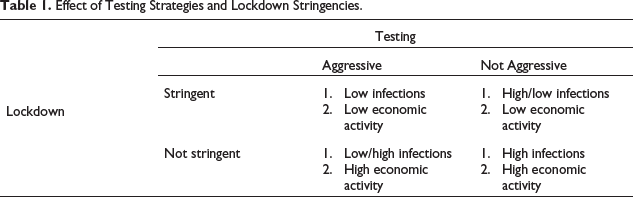
Effect of Testing Strategies and Lockdown Stringencies.
In Figure 1(a), we plot the testing response of two hypothetical countries A and B against the same level of case spread. Since Country A’s testing response curve is higher than Country B’s for the same case spread, Country A has a more aggressive approach to screening its population and identifying the infected. Similarly, Figure 1(b) indicates that Country A’s lockdown is less aggressive as compared to Country B. Combining the two implications, Country A’s strategy seems to be more inclined towards containing the health adversities of COVID-19 without compromising on the loss of economic activity. In contrast, Country B’s response to the same infection levels seems to be more inclined towards avoiding any disruptions in economic activity. We apply this framework to capture the state-level responses to COVID-19 in India.
Testing and Lockdown Stringency According to Case Spread.

The government of India implemented a 40-day strict nationwide lockdown on 25 March 2020 that was later extended for two additional weeks. The nationwide lockdown ended on 31 May, beyond which India started a phase-wise reopening of the economy. With the lifting of the lockdown on 1 June, except in the containment zones, 2 the state governments were given authority to devise lockdown restrictions and relaxations. Several state governments came up with various guidelines including relaxations on interstate travels, reopening of restaurants, shopping malls and religious places. These guidelines related to unlocking varied considerably across states in India.
We apply the conceptual framework built in the second section to examine the differences in state responses across India. Instead of using calendar dates, we focus on how different state governments responded to the same spread of COVID-19 infections. This enables us to account for other factors such as medical infrastructure, better quality of institutions, population vulnerability in our analysis through the spread of infections. To avoid the effect of national lockdown, we limit our analysis to the period when lockdown decisions were under the various state governments’ jurisdiction.
India, a federal democracy has national and state elections every five years separately. Party alignment at the centre and state level may affect policy responses and actions at the state level. In the Indian context, the federal structure has been modified tremendously due to a rise in the number and power of regional parties. The current Indian political era shapes a typical feature where a party that is accepted widely at the centre, maps a disproportionately low representation at the state level (Jain, 2017). To incorporate this aspect, we examine the political alignment at the centre and state levels.
Additionally, we examine two standard measures of political factors that may moderate the state-level response to the pandemic closeness of elections and political competition. The closeness of elections, derived from election cycles suggests that the type of policies adopted by political parties is strongly motivated by how close the next elections are (Carvalho, 2014; Dinc, 2005). Similarly, political competition at the state level may condition the type of response. If the current government came into power with a narrow margin of votes in the most recent elections, the government faces a strong political opposition that shapes the type of government response. Finally, the incumbency of the current government may also influence government response.
We try to integrate these four political factors (closeness of elections, political competition, incumbency and political alignment) into our framework. The main aim is to examine if there is a differential pattern in state-level responses to the pandemic driven by these political factors. We use descriptive statistics and diagnostic plots to check for the presence of patterns in state responses to the rise in COVID-19 spread.
Data and Variables
Data
We collect data on COVID-19 cases and testing from
Using a GPS-based mobility measure requires a careful discussion on its relevance in a country like India. India has experienced rapid diffusion of information and communication technology since the early 2000s. According to the second report of the Internet and Mobile Association of India and Neilson, as of November 2019, India had 504 million active internet users (40% of the total population). 3 Second, the report highlights the narrowing rural–urban gap with rural penetration growing by 5% while urban penetration by 3% between March and November 2019. The report also finds that 99% of these users access the internet using a mobile device and 77% of mobile phone users in India access wireless broadband through these smartphones. 4 Android, which has Google pre-installed as the default search engine captures 95% of the Indian smartphone market. 5 Finally, Google uses multiple ways based upon the products being used, apps and services accessed in which it can access the location data of users. 6 These broad trends suggest that mobility patterns may be roughly representative of the actual mobility in India.
Our final dataset spans between 1 June and 31 August 2020, and covers all major states of India except the North Eastern states and Jammu and Kashmir. The prime reason for limiting our analysis to 31 August is related to election timings. Opportunistic behaviour by political parties is strongly associated with election timing (Kayser, 2005). Economic manipulation just before elections may distort or modify the perception of policies influencing voter perceptions (Banducci et al., 2015; van der Meer et al., 2016; Zeynep et al., 2020). In order to avoid distortion of policy responses, we end our analysis period on 31 August since election campaigning had started in early September. This ensures that our period of analysis does not include the time span when state interventions/actions could be more focused on ensuring victory in the forthcoming elections rather than controlling the pandemic. This could constrain us from comparing state responses to the pandemic.
Second, election campaigns would increase the overall level of mobility in the state. This will be directly in conflict with social distancing and mobility. Despite COVID-19 guidelines announced by the Election Commission of India, Bihar election rallies experienced participants clustering together, ignoring social distancing and most not wearing masks. 7 This behaviour continued in elections in other states in the coming months such as West Bengal, Tamil Nadu and Kerala. 8 Hence, the extension of the study period would make it difficult to disentangle the effect of lockdown and election campaigns on mobility. Thus, we limit our analysis to 31 August 2020, a period that does not coincide with any state-specific event. As a final step, we merge the state-level assembly election data from the Election Commission of India website.
Variables
Case Time
We use the total number of cumulative confirmed cases per hundred population to measure the spread of COVID-19 infections in a state. Based on this, we define our case time variable as the increase in cases per hundred population by a fixed interval of 0.001. Thus, first time point is the beginning of the timescale when the state records its first case. Case time takes a value of 2 if the case per hundred population is between 0.019 and 0.02. We limit case time between 0 and 100. We use this time indicator to compare state responses using testing and lockdown measures for each of the states.
Testing
We use the cumulative number of tests conducted per hundred population. Due to the unavailability of testing data at a regular interval for all states, we interpolate the missing data points. We define the testing response of a state as the average testing rate in the next seven days. 9
Non-pharmaceutical Intervention-lockdown Stringency
We evaluate lockdown stringency as the second state-level response measure. State-level announcements and circulars related to restrictions and mobility across various sectors in the state are an ideal measure of lockdown stringency. However, the nature and duration of lockdown varied across states. For instance, in the first week of June, states such as Bihar and Sikkim had complete lockdowns, West Bengal announced a two-day lockdown every week and Uttar Pradesh, Madhya Pradesh and Punjab opted for a weekend lockdown. 10 Selected urban areas of certain districts in Chhattisgarh were in lockdown. 11 Similarly, Kerala had containment zones according to ward numbers within a district. Further, the identification of containment zones changed according to the spread of COVID-19 infection in the local zones.
While studying each of these restrictions in a detailed manner will be an excellent attempt but it is likely that despite all our efforts, the data will not be exhaustive since many of these restrictions were not even documented. Given this dearth of exhaustive data on state-level restrictions, GCM provides an excellent alternative measure to capture restrictions in mobility. India GCM reports are representative of the broad patterns of lockdown restrictions (Ravindran & Shah, 2020). We use the workplace mobility and the moving average of the next five working days as the state’s response at a particular time point. Several studies have used GCM data (Kumar et al., 2020; Mendolia et al., 2021; Sampi Bravo & Jooste, 2020).
Political Factors
India is a federal republic with organizational powers and limitations divided between the central government and 29 state governments. Election Commission of India, the body responsible for monitoring, administering and conducting elections, organizes the Lok Sabha elections at the centre level every five years. Similarly, state-level elections are conducted for members of state-level legislative assembly who hold their seats for five years. However, the election timing varies across states. We use the federal structure of the Indian political system and the variation in elections for different states to capture our political factors.
We use four measures—election closeness, political competition, incumbency and political alignment. We define election closeness as a dummy variable that takes a unit value if the next election of a state is before the average election date of all states. Political competition is measured as the absolute difference in vote share between the winning party and the first runner-up party in the most recent state-level assembly elections. We use incumbency as a dummy variable that takes a unit value if the current party has come into power for the second time. Finally, political alignment is defined as the dummy variable that takes a unit value if the same party is in power at the centre and the state-level government.
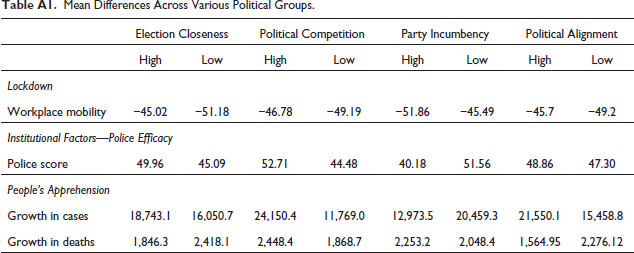
Before our main analysis, we examine the suitability of GCM to capture lockdown stringency. Mobility may reduce due to either one or a combination of three factors—(a) nature of state-level announcements and circulars related to restrictions and mobility; (b) institutional quality—the efficacy of police to enforce the law; and (c) apprehension among people to step out due to unusual bursts in COVID-19 infections.
Mobility may work as a well-suited de-facto measure of lockdown stringency if both institutional quality and apprehension among citizens did not vary a lot across states. Tata (2019) compiles the state of policing in India at the subnational level and captures the institutional quality in our study. 12 Next, apprehension among people is measured by examining the growth in cases and deaths during the study period since unusual spikes in infections may make more people averse to stepping out irrespective of lockdown stringency. We conduct a means test to examine if these measures are different across the two groups for each of our political variables. We compile these results in Annexure I. There is no statistical difference in any of these measures across groups. This affirms our use of GCM as a lockdown measure.
Results
Overall Trends
We start with presenting the trend followed by both our policy instruments, testing and lockdown stringency in India between April and August (Figure 2).
COVID-19 Response in India.
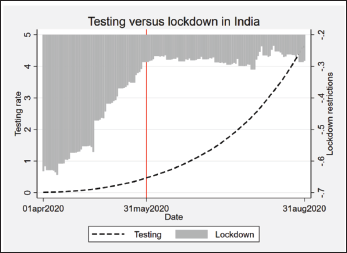
COVID-19 Response in India.
Figure 2 shows the change in testing rate and lockdown restriction in India before and after the nationwide lockdown (denoted by the red line). The testing rate becomes steeper in the later months wherein responses were under the jurisdiction of states. Even with lockdown, mobility increased drastically under the nationwide lockdown whereas in the second period, it stagnated. 13 An important point here is that Figure 2 does not take into account the pace of infection spread. Analysing responses to COVID-19 without controlling for the actual spread of COVID-19 may lead to the problem of ignoring other pre-existing socio-economic and institutional factors that affect COVID-19 spread. We integrate the case spread in our analysis and use our case time indicator to plot the responses in Figure 3.
COVID-19 Response in India According to Case Time Since April.
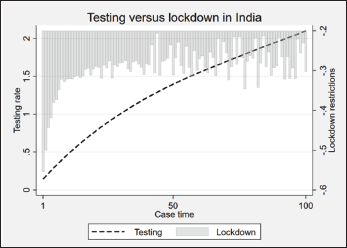
Figure 3 indicates the average testing and lockdown response in India. It spans across the months of April to August, thus combining the centre and the state governments in the same figure. However, the horizontal axis in Figure 3 is not the calendar dates but the case time indicator. In line with our conceptual framework, we consider this as a better representation of the response as compared to Figure 2. A closer inspection of Figures 2 and 3 reveals that the initial impression of the testing pace picking up in the later months of July and August in Figure 2 was driven by the rapid rise in the spread of COVID-19 infections in India. After controlling for this in Figure 3, there are no signs of the rapid rise in testing for higher case time.
However, Figure 3 combines both the central and the state government responses. To disentangle these two effects, we remove the nationwide lockdown by dropping all the observations before 1 June 2020 (Figure 4).
COVID-19 Response in India According to Case Time Since June.
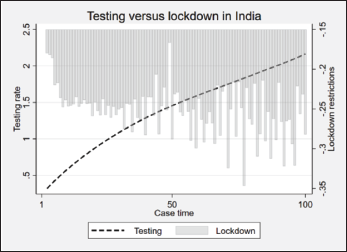
Figure 4 indicates a rough rising pattern in lockdown stringency that was completely subdued in both Figures 2 and 3. Figure 4 also presents huge fluctuations in lockdown restrictions for higher case spread. 14 Given the huge spatial variation in India, we next examine if political factors may influence these patterns.
Political Factors and State-level Responses to COVID-19
Our political variables are pre-existing time-invariant factors whereas our COVID-19 case measures and state responses are available at a daily frequency. We start with a simple means test for these measures. For election closeness and political competition, we group states into high and low categories according to their deviation from the mean. For party incumbency and political alignment, we divide states into two categories of high and low if the variables take a value of 1 or 0. Classification of states into the high and low categories is presented in Annexure II. Next, we examine if the mean state responses for each of these groups are statistically different.
Table 2 indicates that average testing is higher for states that have elections in the near future as compared to those that have elections on a much further date. Similarly, states that faced a higher political competition in the last elections were not incumbents and that were run by the same party that was at the centre also had higher testing rates. This suggests that testing rates exhibit patterns influenced by political factors. Next, we find that states that had elections further away in time, states that were under the same party for two consecutive terms and states that were not run by the same party as the centre, had significantly lower workplace mobility as compared to their opposite counterparts.
Differences in State Response Variables for Different Political Factors.
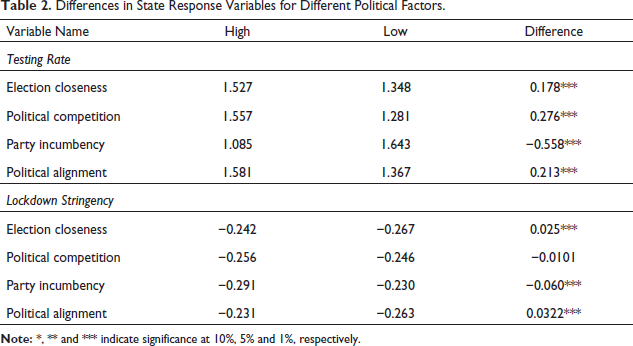
The overall results hint at an aggregate pattern wherein states categorised under the high group for all political factors except incumbency use a combination of high testing and low lockdown stringency. To explore this pattern in detail, we examine the trend followed by the state response according to the closeness of elections.
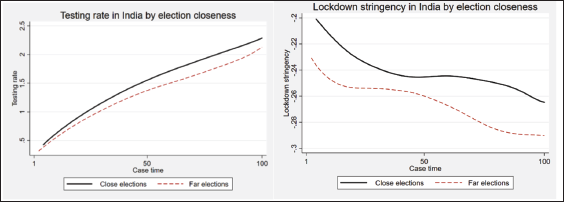
Figure 5 presents testing response and lockdown stringency for the two groups of states in the left and right panels, respectively. Both panels confirm a rise in testing rate and lockdown stringency with a rise in case spread. Moreover, we find that states going into elections in the near future have a higher testing rate for the same rate of case spread as compared to their counterpart group and this pattern is consistent for all levels of case spread. Simultaneously, the same group of states had higher workplace mobility as compared to the other group. This confirms that these groups of states are attempting to detect infections more promptly and simultaneously trying to avert loss of economic activity. Figure 5 suggests a strong association between the closeness of election and the type of policy response used. We present the same responses for states grouped according to political competition in Figure 6.
State Responses by Closeness of Elections.
State Responses by Political Competition.
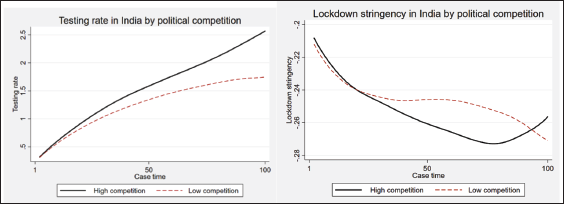
Figure 6 presents a pattern where the two groups have similar responses (both testing and lockdown) during the early stages of infection spread. However, as COVID-19 infections continue spreading, states facing higher political competition test more people for the same rise in cases per hundred as compared to states with lower political competition. In contrast, the lockdown stringency of states with high competition has a non-linear pattern. While testing patterns are more aggressive in states with higher political competition, we do not observe a clear pattern for lockdown stringency. Next, we present the state-level response pattern for party incumbency in Figure 7.
State Responses by Party Incumbency.
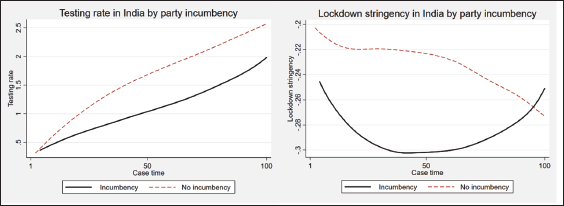
Figure 7 also presents a similar pattern as observed in Figure 5. Non-incumbents test more people and have less strict lockdowns for the same spread of COVID-19 infections. Despite the non-linear trend, the level of workplace mobility is lower for the incumbent states for almost the entire period than the workplace mobility for non-incumbent states. Finally, we present the state-level response pattern according to political alignment in Figure 8.
State Responses by Political Alignment at the Centre-state Level.

Figure 8 also suggests a similar pattern as exhibited in the previous figures. States that are run by the same party that is in power at the centre conduct higher tests and impose less stringent lockdowns for the same spread in COVID-19 cases as compared to states that are governed by a different party. The overall results from Figures 3–8 suggest that the group of states that test more aggressively do not impose stringent lockdowns.
Robustness Tests
We examine the validity of our findings by conducting two robustness tests. Our first robustness exercise involves using park and museum mobility as indicators of lockdown stringency. We observe roughly a similar pattern in lockdown stringency as measured by park and museum mobility changes. 15 Additionally, we examine the state response to COVID-19 by benchmarking it on the severity of the infection. Thus, we replace case time with a death time that captures the rise in mortality rates in states over time. We use the mortality rate, defined as cumulative deaths per ten thousand population, to generate a death time that increases with a fixed interval of 0.0005 units (similar to Balakrishnan & Namboodhiry, 2021). The state-level responses for the period after the countrywide lockdown are presented in Figure 9 (equivalent to Figure 4).
State-level Responses to Increase in Severity of COVID-19.

Figure 9 indicates a similar pattern exhibited by testing and lockdown restrictions mapped against a rise in the mortality rate as observed in Figure 4. To affirm the effect of our political variables, we present the trends followed by various groups in Figure 10. We observe a similar pattern in the effect of political factors on the state-level responses to COVID-19 deaths.
State-level Responses to COVID-19 Deaths.

The overall results indicate that the choice of pharmaceutical and non-pharmaceutical interventions at the state level in India faces a more substitutable than complementary relationship. Particularly, groups of states that pursue aggressive testing practices also are the ones who impose less stringent lockdowns. This pattern seems to corroborate with these groups of states attempting to minimize health adversities due to COVID-19 without compromising on the level of economic activity. An interesting dimension of this group of states is related to their political situation. Pre-existing political factors such as facing elections in the near future, coming into power with a less margin of votes and non-incumbency indicate that these parties care more about their winning possibilities in the next elections than the other groups. In such situations, when these governments have to manage the economic and health costs associated with a pandemic, the policy actions are systematically different from the other group.
Most governments had used a combination of testing and non-pharmaceutical interventions to manage the pandemic in the first few months of 2020. This article examines the difference in policy responses across states in India between 1 June and 31 August 2020, and explores whether there is a pattern between policy choice and political factors.
We find that state governments that had upcoming elections that faced close margin victory, which were non-incumbents and were aligned with the party at the centre tested more number of people for the same rise in COVID-19 spread and severity and did not impose strict lockdowns to avert losses in economic activity. Both these policy actions indicate an attempt to avert possible losses in elections in the future. This finding confirms the strong role of political factors in policy decisions. The unique contribution of our article is to compare the interstate policy responses to a proportional rise in cases across states. Policy responses to COVID-19 will be determined by pre-existing socio-economic conditions and infrastructure quality of each state along with the political factors.
The current analysis incorporates the role of these pre-existing socio-economic factors and the infrastructure quality in policy responses through a unique approach. Our approach is based on how the respective state governments respond to a proportionate rise in cases. The rise in cases will be driven by pre-existing factors such as poverty, corruption, governance, medical infrastructure, population vulnerability, population density and so on. There are few limitations to this analysis. The policy responses are limited to only two actions—lockdown stringency and testing. We do not include the fiscal stimulus and other relief measures announced by various state governments. We use a de facto measure of lockdown stringency instead of actual state-level actions taken by various state governments.
Annexure A
Mean test of police efficacy and case growth by political factors (Table A1).
Mean Differences Across Various Political Groups.
Annexure B
Table B1 compiles the state-wise composition of each of the political factors.
Classification of States According to Political Factors.

The state codes are as follows: AP (Andhra Pradesh), BR (Bihar), CT (Chhattisgarh), GJ (Gujarat), GA(Goa), HR (Haryana), HP (Himachal Pradesh), KA (Karnataka), KL (Kerala), MH (Maharashtra), MP (Madhya Pradesh), OR (Odisha), PB (Punjab), TG (Telangana), TN (Tamil Nadu), UT (Uttarakhand), UP (Uttar Pradesh), WB (West Bengal).
Footnotes
Acknowledgements
We would like to thank Professor Sudip Chaudhuri for his comments. We also thank the editor and the reviewers of the journal for their insightful comments and suggestions.
Declaration of Conflicting Interests
We declare that this manuscript has not been published and is not under consideration of publication elsewhere.
Funding
The authors received no financial support for the research, authorship and/or publication of this article.