
Abstract
Using a data set of US tax records spanning 2008 to 2013, the authors study the impact of the Affordable Care Act (ACA) young adult dependent coverage requirement on labor market–related outcomes, including measures of employment status, job characteristics, and postsecondary education. They find that the ACA provision did not result in substantial changes in labor market outcomes. Results show that employment and self-employment are not statistically significantly affected. Although some evidence supports the increased likelihood of young adults earning lower wages, not receiving fringe benefits, enrolling as full-time or graduate students, and young men being self-employed, the magnitudes imply extremely small impacts on these outcomes in absolute terms and when compared to other estimates in the literature. The authors find these results to be consistent with health insurance being less salient to young adults, compared to other populations, when making labor market decisions.
A growing literature draws attention to the effects of health insurance expansions on outcomes other than health insurance coverage and access to medical care, and important questions concerning the labor market consequences of new health insurance mandates continue to be debated. In this article, we examine whether providing young adults with a source of health insurance unconnected to their own employment (through their parents’ insurance plans) may affect work attachment, affect job characteristics, or encourage educational enrollment.
As an early provision of the Affordable Care Act (ACA), insurers and sponsors of self-insured plans were required to allow dependents up to age 26 to remain on their parents’ private health insurance policies. Prior to the passage of this provision of the ACA, employer-sponsored health insurance benefits for dependents were only excludable from federal income taxes if the dependent was under age 19, or under age 24 and a full-time student, and so health insurance policies often limited dependent coverage to young adults who satisfied these criteria. Those who were not eligible for parental insurance could purchase health insurance through their own employer (or their spouse’s employer, if married), purchase insurance in the non-group market, enroll in Medicare or Medicaid if disabled or if their income was sufficiently low, or be uninsured.
Though several studies have found that this provision increased insurance coverage among those under age 26, few studies have examined labor market outcomes, and all have methodological weaknesses. Compared to the extant literature, our work examines new outcomes that have not been studied to date, uses larger and better-measured data than was previously available, and uses a method that explicitly estimates effects among young adults whose parents have access to employer-provided benefits.
By making parental health insurance an option for young adults up to the age of 26, the ACA young adult (YA) provision may reduce the incentive to work in employment arrangements that offer employer health insurance and may also reduce labor supply through an income effect. In addition, the availability of an alternative source of health insurance might make young adults more likely to undertake activities that involve lower labor force attachment (such as enrollment in postsecondary education). Conversely, the YA provision might reduce the incentive to be a full-time student among those age 19 to 23, as those individuals could now stay on their parents’ plan even if they were not enrolled as a full-time student. Young adults may place little value on the availability of health insurance, however, either because they are in good health and so face low insurance costs, or because they feel invincible and do not consider health insurance to be necessary, which may mute any labor market effects of gaining insurance.
Longitudinally linked tax data spanning 2008 to 2013 provide a unique opportunity to study labor market outcomes of the YA provision. Using data self-reported under penalty of law among tax return filers (Form 1040) and data reported by third parties on wage statements (Form W-2), miscellaneous income statements (Form 1099-MISC), and tuition statements from colleges and universities (Form 1098-T), we are able to examine whether an individual works in the formal sector or is self-employed, his or her total annual wages and receipt of employer-provided retirement and health benefits, and his or her educational enrollment. Our article is also the first to study any ACA labor market outcomes using tax data.
Using these data, we estimate reduced-form difference-in-differences (DD) specifications that compare young adults of slightly different ages over time, as in the prior literature. Since DD effects may mute causal effects that occur only among those whose parents have employer insurance benefits, we also estimate specifications that include only young adults whose parents have access to employer-provided fringe benefits.
Studying the impact of the ACA YA provision on labor market outcomes is important because the provision affects individuals during a crucial period of human capital formation—when those individuals are engaged in postsecondary education, attaining initial employment, and embarking on careers. In addition, studying the YA provision may help us understand the response of a key age group to the Health Insurance Marketplace and Medicaid expansions that followed in 2014, as young adults were the age group least likely to carry health insurance prior to the reforms.
Background and Literature Review
Several studies have documented the impact of the ACA YA provision on insurance and medical care access (e.g., Monheit, Cantor, DeLia, and Bello 2011; Cantor, Monheit, DeLia, and Lloyd 2012; Akosa Antwi, Moriya, and Simon 2013, 2015; Sommers et al. 2013; Busch, Golberstein, and Meara 2014; Saloner and Lê Cook 2014; Barbaresco, Courtemanche, and Qi 2015; Golberstein et al. 2015). Further, a growing literature draws attention to the effects of health insurance expansions on outcomes other than health insurance coverage and access to medical care. In this section, we briefly survey the extensive literature on the effect of health insurance on labor outcomes in general, 1 and the much more limited literature focused on young adults.
A substantial amount of research in health economics investigates the connection between health insurance and the labor market. One strand of this work focuses on the “job-lock” effect of public and private insurance (Cooper and Monheit 1993; Madrian 1994; Yelowitz 1995; Kapur 1998; Ham and Shore-Sheppard 2005; Hamersma and Kim 2009; Strumpf 2011; Decker and Selck 2012; Pohl 2014; Dave, Decker, Kaestner, and Simon 2015) and finds mixed evidence concerning the impact of access to a non-employer source of health insurance on job outcomes and labor supply. A small number of studies have examined whether the availability of health insurance affects the decision to be self-employed, with Madrian and Lefgren (1998) and Wellington (2001) finding a significant effect, contrary to Holtz-Eakin, Penrod, and Rosen’s (1996) findings.
Another relevant strand of research examines the effect of health insurance benefits on wages, as the possibility of a compensating differential suggests that workers would accept lower wages in response to health insurance (e.g., Gruber 1994; Kolstad and Kowalski 2016; and others). These studies have also produced mixed evidence, perhaps because workers may take into account additional factors beyond wages or benefits when making employment choices. In addition to labor supply, labor demand could also be affected by a health insurance expansion. For example, employers may now find that young adults with access to parental insurance can be hired less expensively, and these employers may increase their demand for young adult workers in response. If workers bear the full incidence of employer-sponsored health insurance, however, the cost to the employer would not change. In this case, we would expect young adult workers to receive higher wages when the employer no longer has to provide this fringe benefit to employees covered by a parent’s plan, resulting in unchanged labor demand.
The receipt of health insurance through a parent may affect labor market incentives through similar mechanisms as the receipt of Medicaid; neither derives from an employer and both are ostensibly “free.” 2 Medicaid eligibility is contingent on low income though, and thus may impose additional disincentives for labor supply that are absent in the receipt of parental coverage. Several recent studies examine the effect of Medicaid expansions in Oregon, Massachusetts, Tennessee, and Wisconsin (Baicker, Finkelstein, Song, and Taubman 2014; Dague, DeLeire, and Leininger 2014; Garthwaite, Gross, and Notowidigdo 2014; Kolstad and Kowalski 2016) to anticipate possible effects of the ACA. The study with the most rigorous design, a random assignment experiment in Oregon that expanded Medicaid to adults below the federal poverty level, showed very little effect on labor supply or earnings as a result of receiving Medicaid (Baicker et al. 2014). Dague et al. (2014) found in Wisconsin that those who were not enrolled in the program because of an enrollment cap worked more than those who were able to enroll in Medicaid, but effect size ranged from modest to medium. Garthwaite et al. (2014) used the case of Tennessee and found extremely large increases in labor supply following loss of Medicaid coverage.
Though little work has been done on the impact of health insurance on educational choices, the literature in education economics does find that young adult educational enrollment is sensitive to outside options. Cascio and Narayan (2015) found that the low-skill biased technological change represented by fracking (an innovation linked to rapid growth in the field of natural gas development) caused an increase in the high school drop-out rate among males, and Charles, Hurst, and Notowidigdo (2015) found that the housing boom of the early 2000s improved labor market outcomes and reduced college enrollment by marginal workers. Improved job openings, however, likely represent a more attractive reason to leave school compared to health insurance availability through one’s parents as a reason to remain in school.
Although the literature on health insurance and labor has looked at subgroups such as those near retirement (Blau and Gilleskie 2001; Kapur and Rogowski 2007; Strumpf 2010), those who are unemployed (Gruber and Madrian 1995), and married women who have health insurance available through their husband’s work (Buchmueller and Valetta 1999), no studies prior to the passage of the ACA focus on young adults, despite the implications for future earnings trajectories that would have resulted from such research. This omission can be explained by an earlier lack of policy variation that could be used to design a causal study.
Economic intuition formalized in prior literature such as Madrian (1994) suggests that providing access to health insurance through a parent would reduce the demand for health insurance through employment and thus reduce labor supply on extensive and intensive margins. Young adults would pursue alternatives to working full time for firms that offer benefits, such as self-employment, education, or leisure, as the opportunity costs of such activities would decrease. Those workers who no longer require employer-provided health insurance could experience wage gains as a result of the compensating wage differential for employer-provided benefits. Conversely, these workers may appear to have lower annual wages as a result of a reduction in hours or a shift toward employment that maximizes utility in ways other than financial remuneration. These effects would logically be present only for those young adults whose parents have access to employer-provided health insurance, and employment effects may be larger for those who are past traditional college age and may otherwise pursue full-time employment. Recent evidence, however, shows that many individuals place very low value on public health insurance availability (Finkelstein, Hendren, and Luttmer 2015), and young adults are especially likely to have high myopia (Gruber 2001) so any such labor market effects of gaining insurance may be muted.
A few recent articles shed some light on the effect of insurance for young adults on a limited set of labor market outcomes. A recent study by Akosa Antwi et al. (2013) that examined the impact of the YA provision on health insurance also provided a cursory look at labor supply. Three papers utilize variation from state laws prior to the ACA. 3 Dillender (2014) examined the long-term labor market consequences of insuring young adults through state dependent-coverage laws and found an increase in wages. Depew (2015) and Hahn and Yang (2016) estimated the impact of state laws on work outcomes. Depew’s findings suggested state mandates cause a decrease only in the hours worked, not in the probability of employment, though Hahn and Yang found that labor supply decreased on both the intensive and extensive margins from the state mandates. Finally, two papers examined the impact of the ACA provision on labor market outcomes. Bailey (2017) found that the ACA YA law increased entrepreneurial activity, though the specifications generally did not pass placebo tests and so the estimates are not likely to be reliable, and Bailey and Chorniy (2016) found that the law did not have any impact on job lock.
In sum, a substantial literature addresses the connections between health insurance and labor market outcomes, though only a budding literature has studied the labor market effects of extending health insurance coverage specifically to young adults. Compared to the extant literature, the current article studies a wider variety of outcomes, including employment, job characteristics, and educational attainment. Further, our study utilizes several methodological improvements, including estimating DD models while focusing on those young workers whose parents are likely to have employer-sponsored insurance and thus are potentially affected by the YA provision.
Method
Since almost all previous studies of the ACA YA provision use a DD design comparing access outcomes after the law to outcomes before the law for those in the affected age group (usually 19 to 25-year-olds) and those outside it (usually 27 to 29-year-olds), we first estimate the impact of the YA provision by estimating a simple DD specification. Similar to those previous studies, we compare those in treatment age to those outside treatment age (24–25 being treatment age and 27–29 being control age; 26 is excluded 4 ) before and after the law, and estimate an equation of the form

where
We next conduct regression-adjusted versions of the DD calculations in which we account for the national annual unemployment rate, age fixed effects, and an interaction of age fixed effects and the national unemployment rate. The estimating equation for these specifications is

Such a DD design suffers from the fact that, absent general equilibrium effects, the law should impact only those whose parents have employer-sponsored health insurance. As such, since some untreated young adults are included in the treatment group, they are unable to show in a convincing manner that the estimated impact of the YA provision arises among the treated group. To correct for this concern, one could in theory cut the estimation sample to include only those whose parents have employer-sponsored insurance to demonstrate that effects are being driven by these individuals. Most data sets that have been used in prior studies do not contain information on non-co-resident parents, and so this distinction has not been possible. Our tax data contain longitudinal links, however, so we are able to utilize parental information on employer benefits to focus on the portion of those under age 26 who are likely to be treated by the ACA YA provision. Thus, in our preferred specification, we re-estimate our DD model, focusing on those whose parents are likely to be covered by employer-based health insurance. 6 In addition to providing information on the impact of the YA provision on labor market outcomes, such a specification also offers information on the reliability of estimates from DD designs that lack parental data. 7
In all specifications, we exclude data from 2010 as a period of staggered implementation; some insurers complied as early as spring 2010, but because most insurance plans renewed on January 1, 2011, we consider this the full implementation date. We conduct statistical checks to ascertain that prior trends in labor markets are similar among the control and treatment ages, although, as we explain in the next section, we have limited years of data prior to policy implementation for these tests. Finally, because the identifying variation comes from a difference in policy by age group and year, we cluster standard errors at the age*year level.
Data
In this study, we use a panel of US tax return data spanning 2008 to 2013 drawn from the population of US income tax filers. Although such data have been used in prior tax and labor studies (for example, Chetty, Friedman, and Saez 2013), research has been limited by severely restricted access, and the present study advances the literature by using these data to examine the labor market impacts of the ACA.
Since non-dependent children are not listed on their parents’ tax forms, it is not possible to link young adults and parents using only tax returns from recent years. However, a dependent file from 1997 matches the social security numbers (SSNs) of primary and secondary filers to the SSNs of their dependent children, if any, 8 which makes it possible to match parents’ and children’s information if those children were claimed as dependents in 1997. So, to create a data set that links parents’ and children’s information, we gather filing and other tax information reporting from 2008 to 2013 for the children represented in the 1997 file, as well as information from their parents’ W-2 forms; we then merge each young adult’s information to that of the individuals listed as their parents in 1997.
Because individuals who were older than 18 years or younger than 2 years in 1997 were less likely to be claimed as dependents in 1997, we consider information only on birth cohorts from 1979 through 1995 when utilizing information on parental insurance. This structure means that we are limited in conducting pre-trends tests: We cannot go back farther than tax year 2008 and still have the full set of control individuals aged 27 to 29, which limits our pre-trends tests to 2008 to 2009 (see Appendix Table A.1).
Ideally, we would know for each year of our data (2008–2013) whether parents had access to employer-sponsored health insurance. Since 2012, employers that filed more than 250 W-2 forms in the previous year have been required to report employer provision of health insurance on W-2s. Because this requirement started in 2012, however, we have this information beginning only in that year. In addition, the ACA reporting requirement applies only to firms with more than 250 workers, whereas approximately 40% of the US workforce is employed in firms with fewer than 250 workers. 9 By our (unreported) calculations using publicly available data from the Medical Expenditure Survey (MEPS) Insurance Component, however, it appears that compliance with this requirement by large firms is high. We attempted to backfill data on employer provision of health insurance for years prior to 2012 using the following steps: From 2012 data, we know whether an employer with a certain employer identification number (EIN) offers health insurance if any of the workers of that EIN have a W-2 form that reports health insurance. From that, we create a data set of EINs known to offer health insurance in 2012. Under the assumptions that these employers also offered health insurance during 2008 to 2011, and that they offer insurance to all their workers when they offer to any, we have information on employer health insurance offers for 2008 to 2013. When we examine these data, we find that the rate of employer health insurance increases sharply over time, which might be expected because our method of imputing works best for more recent data. Even though data missing at random would not pose a large threat to identification, our use of an imputation method for years before 2012 implies caution is advisable in using this measure.
As an alternative method of determining coverage, we use information on whether parents have employer-sponsored retirement plans. Participation in an employer’s retirement plan is recorded on W-2 forms in all years of our data (and is available for all employers). Further, tabulations from the Current Population Survey (CPS) and the MEPS suggest that more than 90% of families in which at least one parent had an employer-sponsored retirement plan were also covered by employer-sponsored insurance (ESI); accordingly, we use participation in a retirement plan as a proxy for parental availability of health insurance. Note that, in this specification, the retirement plan participation proxy for health insurance coverage is used for all individuals, not just those who worked for small firms. Approximately 20% of families in the MEPS who do not have employer-sponsored retirement plans are covered by ESI, however. For this reason, not contributing to a retirement plan is a weaker proxy for lack of health insurance. 10
The outcomes we analyze fall into three groups: 1) employment status (including whether the individual received a W-2 form indicating receipt of wage and salary income, and whether the individual received any amount of self-employment income reported either on Schedule SE or on 1099-MISC forms); 11 2) job characteristics from W-2 forms (including log annual wage income, whether the individual’s primary 12 employer offered health insurance, and whether the individual had a retirement plan through his or her primary employer); and 3) educational enrollment from 1098-T forms 13 (including whether the individual was a student at a postsecondary institution, whether he or she was a full-time student at such an institution, and whether he or she was a graduate student at such an institution). A potential concern occurs if individuals select into the sample because of a change in filing behavior in reaction to the policy changes studied here. Most of our outcome variables, however, come from forms that are filed regardless of whether the person filed an income tax return. 14
For our analysis, we use a 1% sample of the population of 1997 parent–child matches, consisting of 571,028 unique individuals who range in age from 13 to 29 years. When we limit to those of ages 24 to 29, excluding 26-year-olds, and use all data on 2008 to 2013 except 2010, we obtain 823,249 person–year observations, corresponding to about 361,179 unique individuals. 15 We examine the breakdown of our sample by year and age and observe that the number of individuals does not change in any systematic way over time as we construct a balanced panel. We do find, however, that the number of older young adults is consistently lower than the number of younger individuals. This imbalance might be explained by the fact that in 1997 those who were 17 and 18 years old were more likely to be already living outside of the parental household and not claimed as dependents. We conduct statistical tests to ensure that no systematic difference in sample size aligns with our main identification method and find no evidence of systematic difference (for example, between treatment and control, before and after the policy, for the DD).
Table 1 presents sample statistics for three samples: 24- to 29-year-olds, 24- to 29-year-olds whose parents contributed to a retirement plan, and 22- to 29-year-olds whose parents contributed to a retirement plan. In the sample of 24- to 29-year-olds, 80.7% had some wage and salary income and 10.0% had some self-employment income; the primary employer offered health insurance for 46.2% and a retirement plan for 32.4%; and 19.4% were enrolled as postsecondary students. When the sample is restricted to those whose parents contributed to a retirement plan and so were likely to be covered by health insurance, the employment outcomes are generally higher, as more of this subsample have wage and salary income, are offered health insurance or a retirement plan, and are enrolled as postsecondary students. When 22- to 23-year-olds are added to the sample of 24- to 29-year-olds, the employment outcomes are generally lower, but enrollment as a postsecondary student is higher, as would be expected.
Sample Statistics

Source: Data from 1% Sample of Internal Revenue Service (IRS) unedited population files.
Results
Full Sample Results
Table 2 presents the results from our main specification. In column (1), we present results from a simple DD specification to examine the raw differences between the treatment and the control groups, pre- and post-reform. Across outcomes, only one of the coefficients is statistically significant. The YA provision is estimated to have increased the prevalence of young adults working at a primary employer that offered health insurance by a marginally statistically significant 0.5 percentage point (or 1.1%). Note, however, that this effect is contrary to expectations given the theory discussed above.
Estimation Results

Source: Data from 1% Sample of Internal Revenue Service (IRS) unedited population files.
Notes: Each cell presents results from a separate regression. Standard errors are in parentheses, and the means of the dependent variable among the treatment group in the pre-reform period is in italics. Control variables include indicator variables for year, age, and gender; unemployment rate; and the interaction between age and unemployment rate. Standard errors are clustered at the age*year level. Sample includes young adults between the ages of 24 and 29.
Indicates statistical significance at the 1% level; ** at the 5% level; * at the 10% level.
This significant result is robust to including additional controls in column (2). When controls are added, however, the YA provision is estimated to significantly affect a number of other labor market outcomes. The YA provision is now estimated to lead to young adults earning 1.8 percentage points lower annual wages. 16 Further, consistent with theoretical expectations, young adults are estimated to be 0.5 percentage point (1.6%) less likely to work at an employer that offers a retirement plan, and a marginally statistically significant 0.2 percentage point (3.6%) more likely to attend graduate school. Contrary to expectations, the fraction of young adults not earning any wage and salary income is estimated to have declined by 0.4 percentage point (2.3%), and the fraction attending postsecondary school of any type is estimated to have declined by 0.2 percentage point (0.8%).
As noted above, the estimation samples in these specifications include a number of individuals whose parents do not have employer-sponsored insurance, and so are not actually affected by the ACA provision. In column (3), therefore, we limit the sample to those who are likely to be “treated” by the YA provision by including only those whose parents have an employer-based retirement plan. This specification is our preferred specification.
With this restriction in place, the effects on all outcomes are generally either consistent with theory or are statistically insignificant. In the top panel, the estimated impact on having any W-2 forms and on reporting self-employment income are both statistically insignificant. In the second panel, the YA provision is estimated to decrease annual wages by 0.9 percentage point and decrease the fraction working at an employer that offers a retirement plan by 0.5 percentage point; the impact on working at an employer that offers health insurance is now statistically insignificant. Finally, in the bottom panel, though the fraction of postsecondary students is estimated to have decreased by 0.2 percentage point, (1.5%), the fraction of full-time students increased by 0.5 percentage point (2.3%), and the fraction of graduate students increased by 0.3 percentage point (4.3%).
Since full-time and graduate education are estimated to have increased and overall postsecondary education is estimated to have marginally significantly decreased, our results imply that part-time schooling decreased. These results may indicate that the YA provision had an income effect that enabled students to attend school full time rather than part time. Further, universities often mandate that full-time (but not part-time) students be covered by health insurance. Thus, the YA provision may have made it less expensive for students to satisfy this requirement and enroll full time.
Overall, these results suggest that the ACA YA provision did influence some of the labor market outcomes, albeit by modest margins. 17
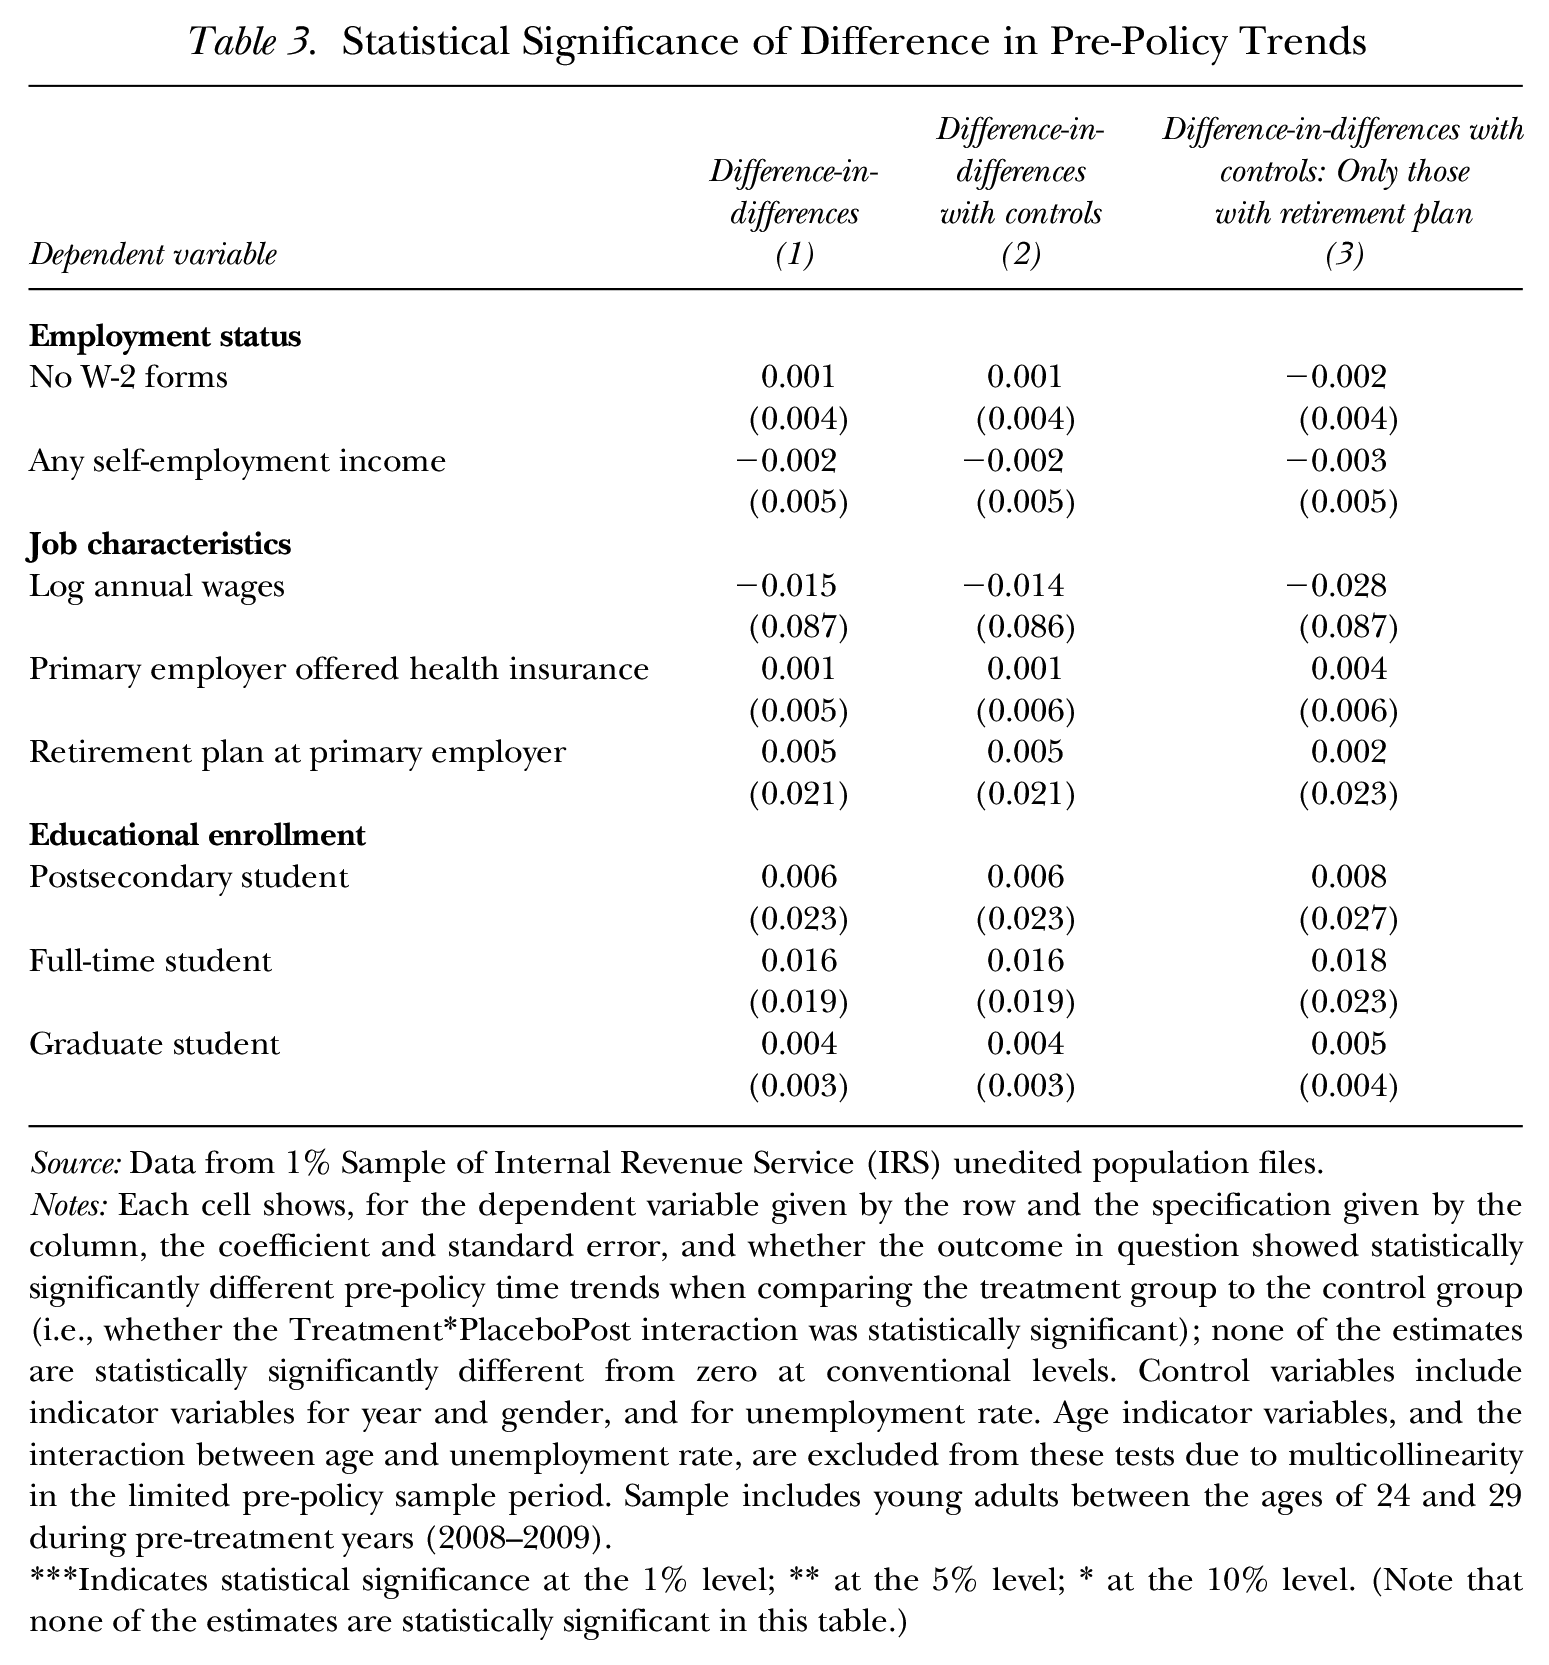
Of course, these estimates could be driven by differential pre-existing trends between the treatment and the control groups. To determine if this is the case, we test whether time trends in the outcomes differed between the treatment and the control groups in the years prior to the policy change. These “parallel trends tests” indicate whether there had been significantly divergent trends in outcomes even before the policy change, which would signal unreliability in the DD estimates. Unfortunately, our data contain only two pre-reform years, and so we are able to test for differential pre-reform trends in only these two years.
We present the results of these tests in Table 3. 18 Reassuringly, for all of the specifications in Table 2, the differences in pre-policy trends are statistically insignificant. Nevertheless, since our pre-treatment period contains only two years, one might be concerned that pre-treatment trends differed in years prior to the start of our sample. Slusky (2017) found, however, that across a variety of commonly used data sets, the pre-policy trends are most similar for labor market outcomes when defining the treatment group as we do here, as those aged 24 to 25, and the control group as 27- to 29-year-olds. Caution should be exercised if other age ranges are used in labor market analyses.
Statistical Significance of Difference in Pre-Policy Trends
Source: Data from 1% Sample of Internal Revenue Service (IRS) unedited population files.
Notes: Each cell shows, for the dependent variable given by the row and the specification given by the column, the coefficient and standard error, and whether the outcome in question showed statistically significantly different pre-policy time trends when comparing the treatment group to the control group (i.e., whether the Treatment*PlaceboPost interaction was statistically significant); none of the estimates are statistically significantly different from zero at conventional levels. Control variables include indicator variables for year and gender, and for unemployment rate. Age indicator variables, and the interaction between age and unemployment rate, are excluded from these tests due to multicollinearity in the limited pre-policy sample period. Sample includes young adults between the ages of 24 and 29 during pre-treatment years (2008–2009).
Indicates statistical significance at the 1% level; ** at the 5% level; * at the 10% level. (Note that none of the estimates are statistically significant in this table.)
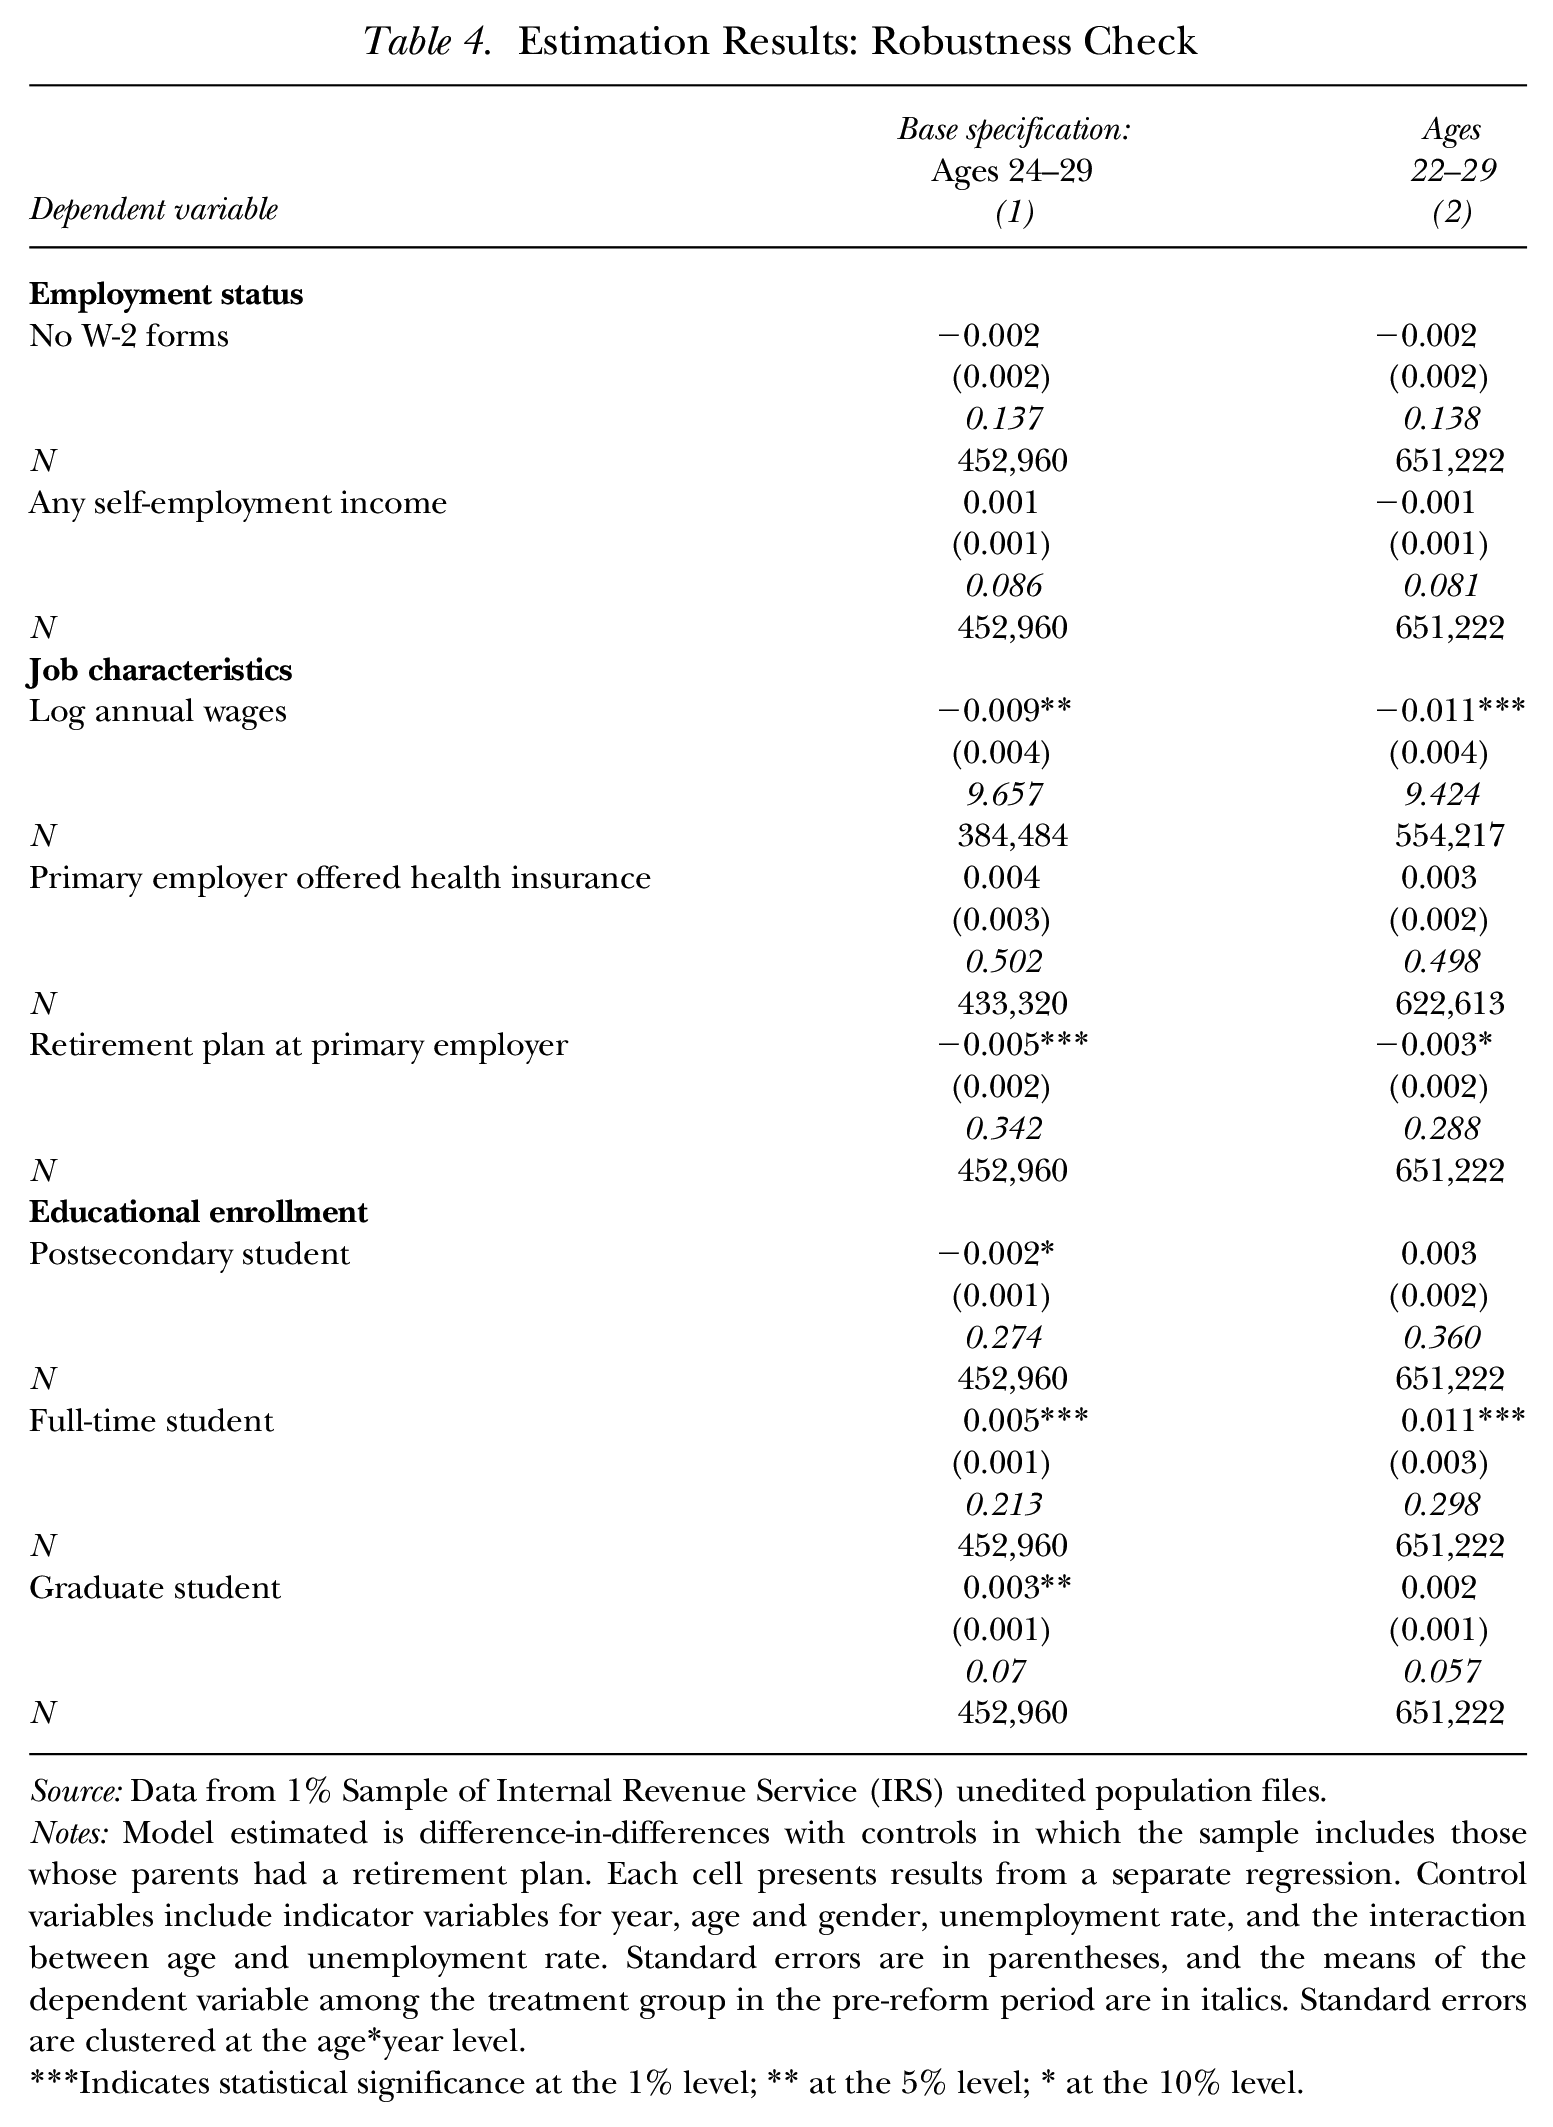
To examine the robustness of the results in our preferred specification to the choice of ages included in the sample, in Table 4 we expand the estimation sample to 22- to 29-year-olds. These results are generally similar to those when the 24- to 29-year-old sample was used, with the YA provision estimated to have led to a 1.1 percentage point decrease in annual wages, a 0.3 percentage point decline in working for a primary employer with a retirement plan, and a 1.1 percentage point (3.7%) increase in full-time student status. The one qualitative difference in the two samples arises for being a postsecondary student, in which the coefficient switches sign and is now statistically insignificant.
Estimation Results: Robustness Check
Source: Data from 1% Sample of Internal Revenue Service (IRS) unedited population files.
Notes: Model estimated is difference-in-differences with controls in which the sample includes those whose parents had a retirement plan. Each cell presents results from a separate regression. Control variables include indicator variables for year, age and gender, unemployment rate, and the interaction between age and unemployment rate. Standard errors are in parentheses, and the means of the dependent variable among the treatment group in the pre-reform period are in italics. Standard errors are clustered at the age*year level.
Indicates statistical significance at the 1% level; ** at the 5% level; * at the 10% level.
Results for Subsamples
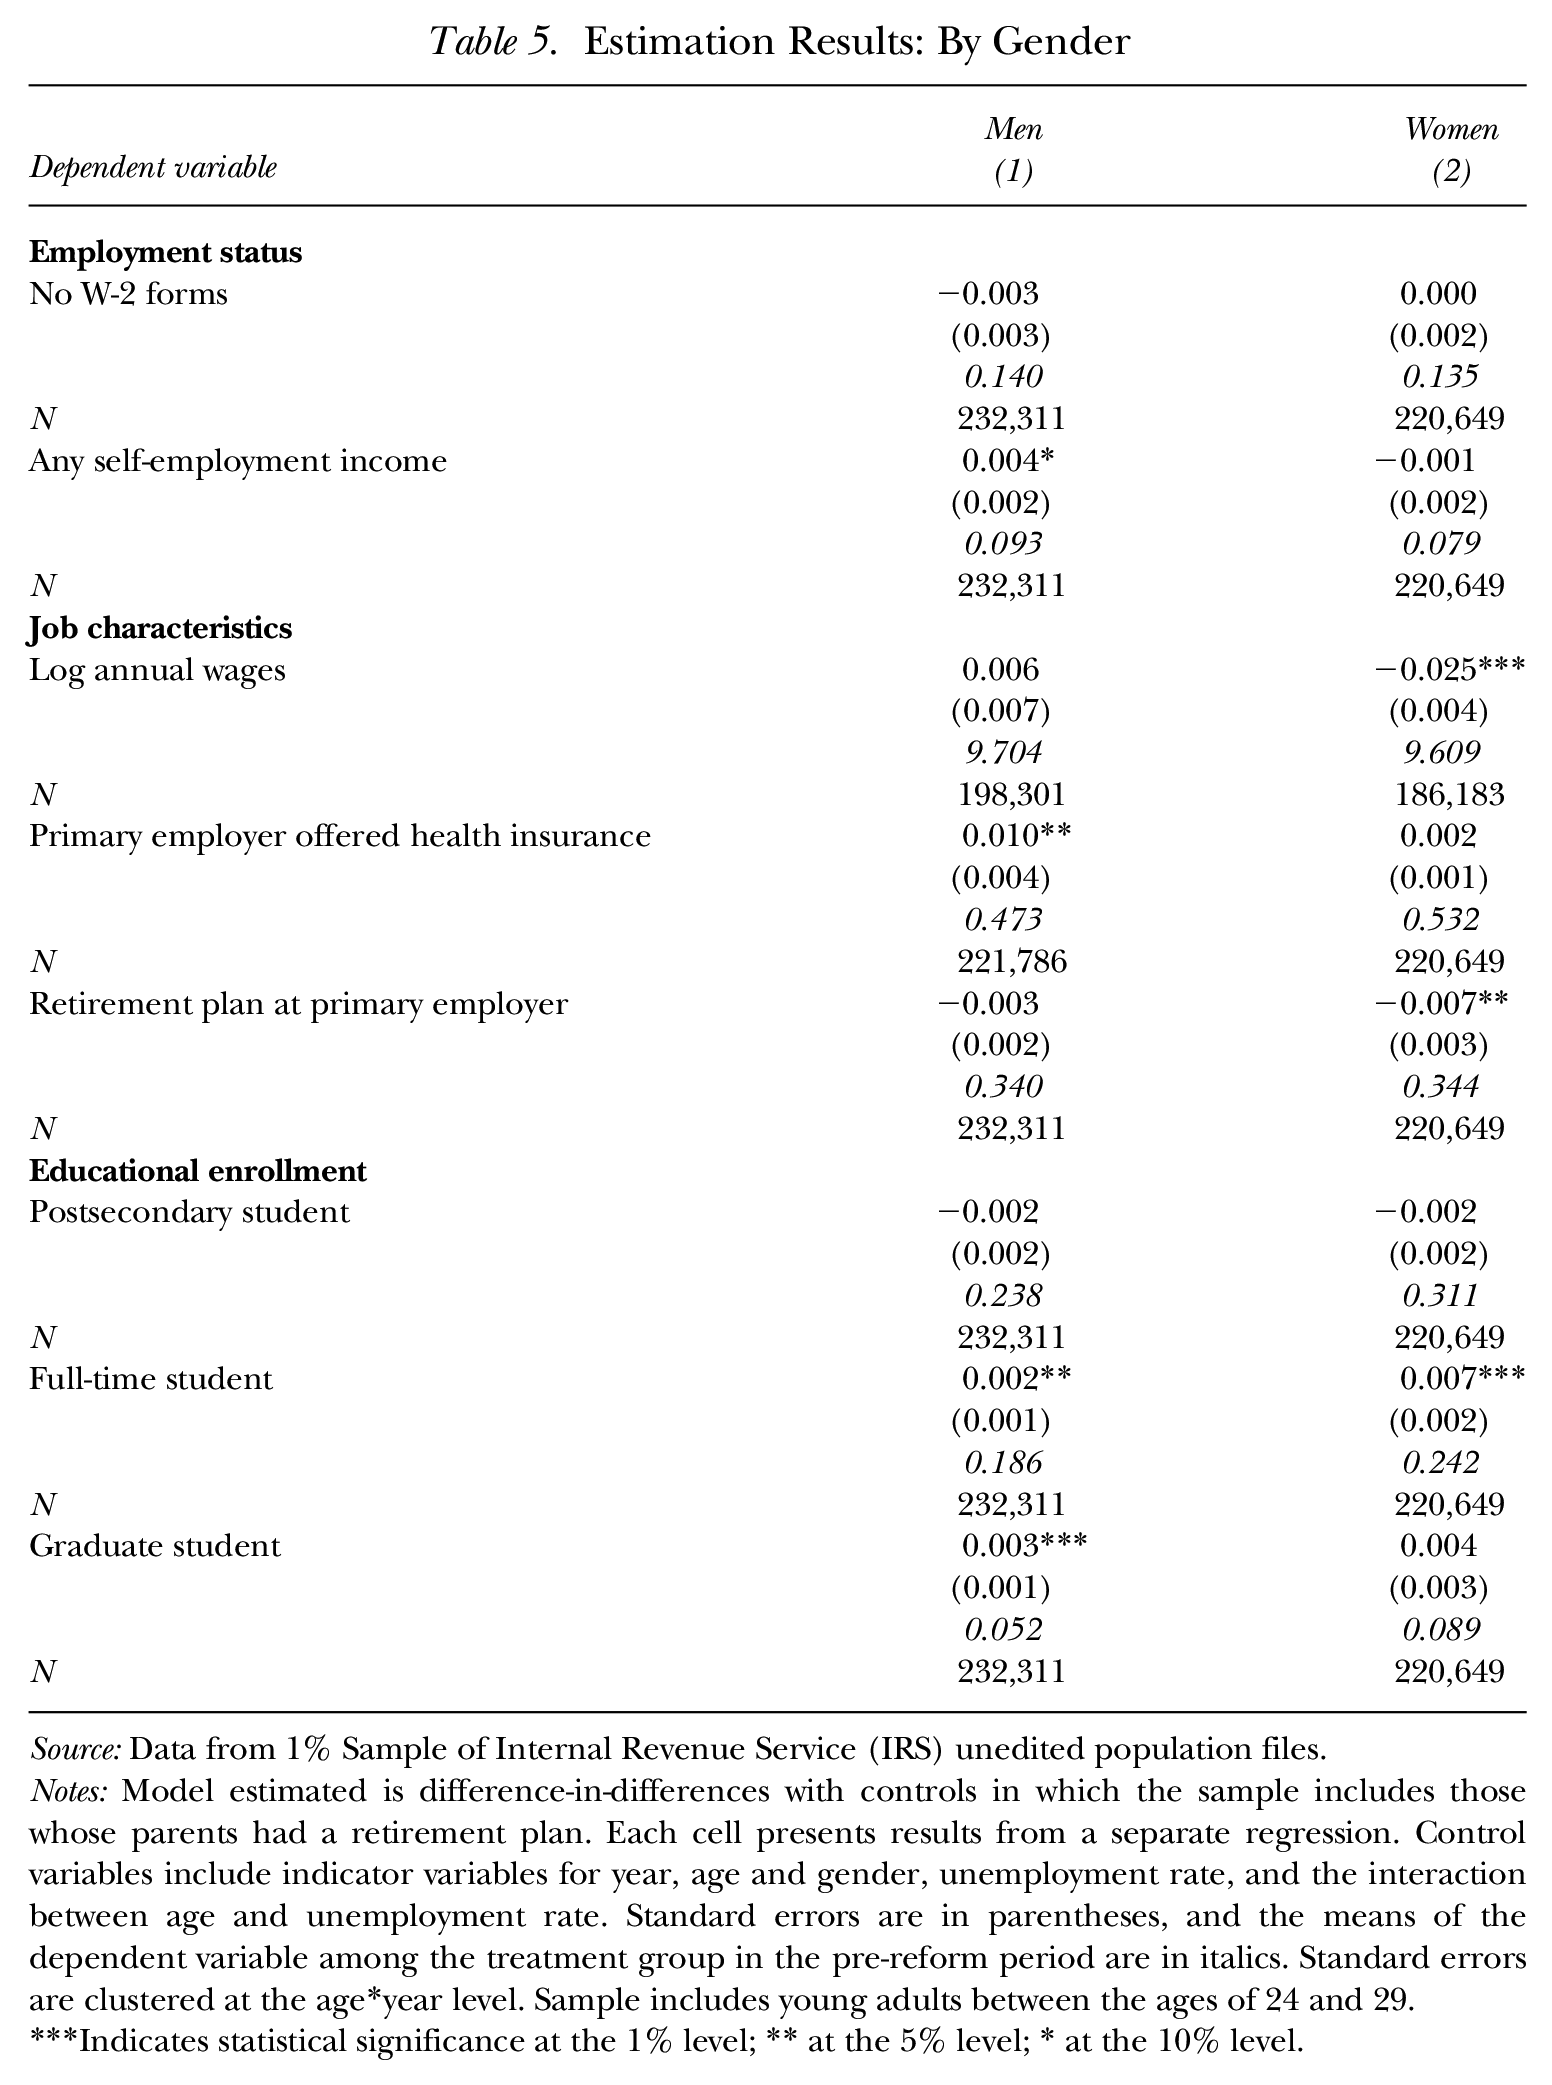
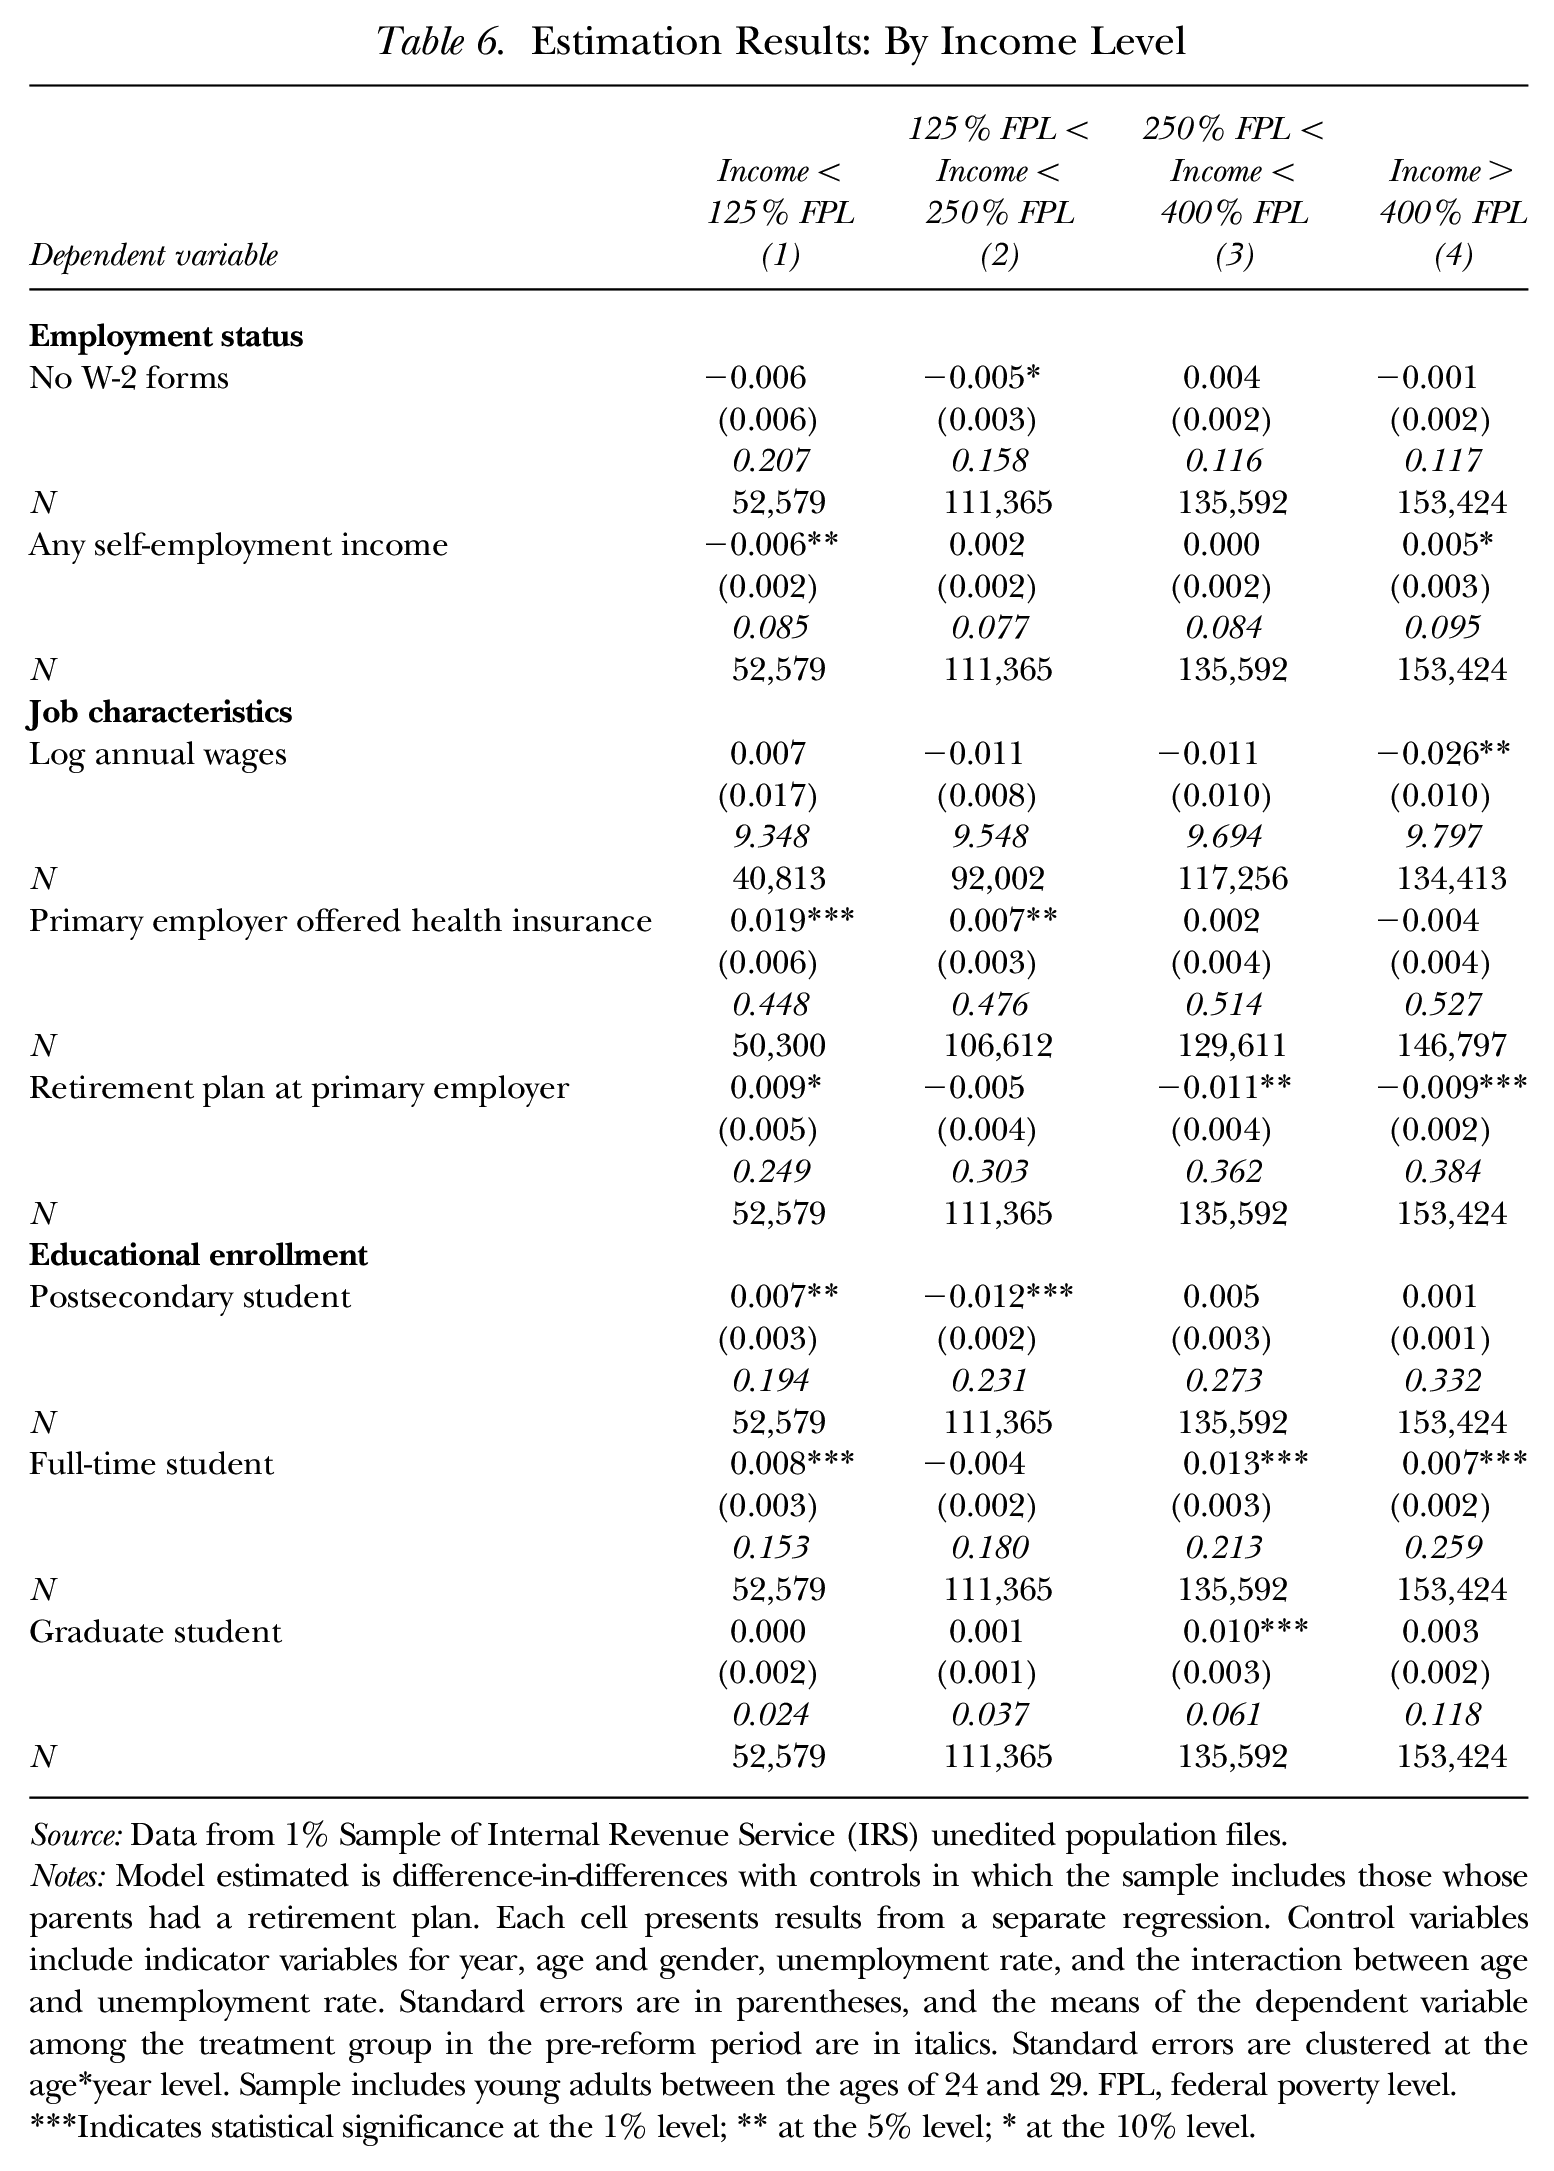
To examine whether the impact of the YA provision differed according to the demographic characteristics of the young adults it covered, in Table 5 we re-estimate our preferred specification (from column (3) in Table 2), but split the sample according to whether the young adult is male or female. In Table 6 we split the sample according to the income of the young adult’s parents in 1997.
Estimation Results: By Gender
Source: Data from 1% Sample of Internal Revenue Service (IRS) unedited population files.
Notes: Model estimated is difference-in-differences with controls in which the sample includes those whose parents had a retirement plan. Each cell presents results from a separate regression. Control variables include indicator variables for year, age and gender, unemployment rate, and the interaction between age and unemployment rate. Standard errors are in parentheses, and the means of the dependent variable among the treatment group in the pre-reform period are in italics. Standard errors are clustered at the age*year level. Sample includes young adults between the ages of 24 and 29.
Indicates statistical significance at the 1% level; ** at the 5% level; * at the 10% level.
Estimation Results: By Income Level
Source: Data from 1% Sample of Internal Revenue Service (IRS) unedited population files.
Notes: Model estimated is difference-in-differences with controls in which the sample includes those whose parents had a retirement plan. Each cell presents results from a separate regression. Control variables include indicator variables for year, age and gender, unemployment rate, and the interaction between age and unemployment rate. Standard errors are in parentheses, and the means of the dependent variable among the treatment group in the pre-reform period are in italics. Standard errors are clustered at the age*year level. Sample includes young adults between the ages of 24 and 29. FPL, federal poverty level.
Indicates statistical significance at the 1% level; ** at the 5% level; * at the 10% level.
In Table 5, several differences by gender are apparent. The YA provision is estimated to have increased the likelihood that young men will earn self-employment income, which is consistent with theory. 19 The declines in annual wages and in working for an employer with a retirement plan, by contrast, are centered among women. 20 Finally, both genders appear more likely to enroll in full-time postsecondary and graduate education in response to the YA provision (though the impact on graduate education is statistically insignificant for women). Thus, the ACA YA provision appears to have led young men to increase their education and self-employment and to have led women to increase their education while taking jobs with fewer fringe benefits and lower wages.
In Table 6, the sample is split according to whether the parents of the young adult have income of less than 125% of the federal poverty line (FPL), between 125% and 250% of FPL, between 250% and 400% of FPL, or in excess of 400% of FPL. Here, it appears that the impacts on self-employment and working for an employer who offers a retirement plan are centered among the highest income group, as is the decline in wages, 21 though significant wrongly signed effects are found for the first two of these outcomes among the lowest income group. The impact of postsecondary enrollment overall is centered among the lowest income group, 22 though the impacts on full-time schooling and graduate school tend to center among higher income groups. 23
Discussion
Taken together, the results above suggest that the ACA YA provision did not significantly affect wage and salary employment or self-employment overall. We find a number of statistically significant effects consistent with predictions from theory, however, including a decline in log annual wages, an increase in being a full-time student or graduate student (though there was a marginally significant decline in being a postsecondary student), a decrease in wage and salary employment (among the 22- to 29-year-old sample), and an increase in self-employment (among men).
To gauge the size of our estimated impacts relative to other findings in the literature, in Table 7 we compare the elasticity with respect to gaining insurance through an alternate source implied by estimates from our preferred DD specification (using those whose parents had a retirement plan) to the largest statistically significant estimates available in the literature. To convert our reduced-form estimates into elasticities of the labor market outcome with respect to gaining health insurance, we utilize an estimate from Akosa Antwi et al. (2013) that found a 30% increase in dependent coverage due to the YA provision. 24 We perform this comparison for four outcomes for which we could find a relevant literature: no W-2 forms (wage and salary employment), any self-employment income (self-employed), log annual wages, and full-time student.
Comparisons to Largest Estimates in Literature
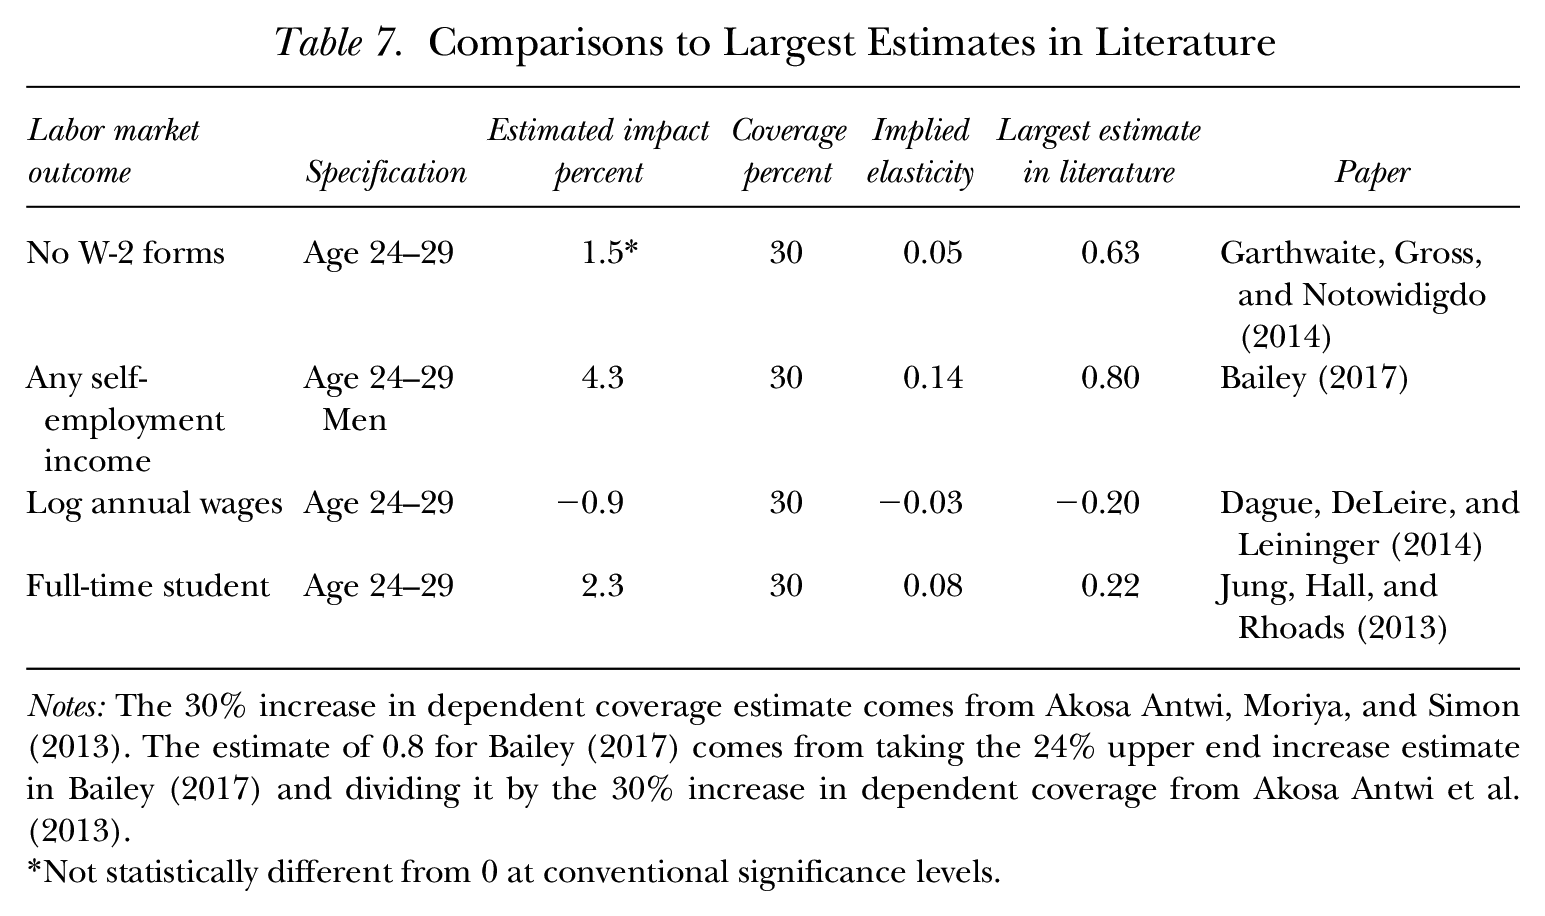
Notes: The 30% increase in dependent coverage estimate comes from Akosa Antwi, Moriya, and Simon (2013). The estimate of 0.8 for Bailey (2017) comes from taking the 24% upper end increase estimate in Bailey (2017) and dividing it by the 30% increase in dependent coverage from Akosa Antwi et al. (2013).
Not statistically different from 0 at conventional significance levels.
Each of four literatures includes several studies (except for the full-time student outcome, for which Jung, Hall, and Rhoads [2013] is the only study we were able to find), and in almost all cases studies exist that found no statistically significant effects on relevant outcomes. Often the studies cited did not explicitly state an elasticity, and, as mentioned, our research did not estimate an insurance effect itself; thus, these numbers should be viewed as back-of-the-envelope calculations. Nonetheless, Table 7 shows our implied elasticities compared to the largest estimates available in the literature. When considering this comparison, note that two of the papers (Dague et al. 2014 and Garthwaite et al. 2014) do not specifically estimate impacts among young adults, so the differences in results could also be attributable to variation in the way health insurance affects labor market behavior for different ages. Nevertheless, our implied elasticity estimates are extremely small compared to the largest in the literature. Specifically, our implied elasticity for whether an individual works is a statistically insignificant 0.05 among 24- to 25-year-olds, whereas the largest estimate in the literature (Garthwaite et al. 2014) found an elasticity of 0.63. For self-employment, our estimate among 24- to 25-year-old men is 0.14, much smaller than the largest estimate in the literature (0.8). Similarly, for log wages and for full-time student status, our estimates for all 24- to 25-year-olds are small compared to the largest existing estimates (−0.03 compared with −0.20 and 0.08 compared with 0.22, respectively). Thus, even when we do estimate statistically significant coefficients, our estimated effects are nowhere near the upper bounds on the responses found in other studies.
Several caveats to our tax data measures should be mentioned. Most notably, we were unable to examine dependent health insurance as an outcome. Almost all prior papers on the YA requirement have ascertained that the provision increased dependent coverage as intended, however, and we take as a given that were this information reported, our method would also show an increase in dependent coverage. Estimates in Akosa Antwi et al. (2013, table 2) showed an approximately 30% increase in employer-dependent coverage for 19- to 25-year-olds in the period after the law, compared to before the law. Nevertheless, having the outcome of dependent coverage in our data would enable us to provide a definitive estimate on the insurance impact of the law and ascertain an instrumental variable equivalent within the same data set.
Conclusion
Very little pre-ACA evidence exists that demonstrates how access to health insurance affects the labor market and socioeconomic outcomes of young adults. Tax data provide a unique opportunity to estimate the impact of the ACA YA provision using a large sample of administratively reported data and focusing on young adults whose parents were likely to have employer-sponsored insurance. Prior evidence on effects of the YA provision is limited and shows a reduction in hours but no effect on employment or job lock. The outcomes we investigate are whether the individual worked in the formal sector, whether he or she was self-employed, total annual wages, whether he or she had employer-provided health and retirement benefits, and educational enrollment.
Taken as a whole, our results suggest that the YA provision did not substantially affect labor market behavior. Our results show that employment and self-employment were not statistically significantly affected in the sample overall. Further, though we find that the YA provision likely influenced young adults to: 1) earn less annually (through some combination of lower hours and/or lower wages); 2) work for employers that were less likely to offer fringe benefits; 3) enroll as full-time or graduate students; and 4) (for young men) be self-employed, our estimated impacts on all of these margins are relatively modest.
Although it is possible that labor market outcomes have changed in ways not captured by tax data (e.g., the number of hours of work may change even though total wages do not, and non-reported self-employment may change), our evidence suggests that the extension of health insurance to young adults has led to very modest impacts on labor market outcomes thus far.
Tax data have been used to study the labor market impacts of health insurance in the past (e.g., Heim and Lurie 2010); however, the current study is the first to use tax data to examine the effect of the ACA on labor market outcomes. Researchers will be able to analyze other features of the ACA with respect to public finance consequences as more years of these tax data become available. For example, our research can be extended to study health insurance changes and labor market outcomes for young adults who do not have access to parental benefits in response to Marketplace and Medicaid expansions that occurred in 2014.
Footnotes
Appendix
Sample Sizes by Age and Year

| Age | Year |
||||
|---|---|---|---|---|---|
| 2008 | 2009 | 2010 | 2011 | 2012 | |
| 22 | 33,176 | 33,981 | 34,323 | 35,453 | 36,457 |
| 23 | 33,353 | 33,176 | 33,981 | 34,323 | 35,453 |
| 24 | 32,756 | 33,353 | 33,176 | 33,981 | 34,323 |
| 25 | 32,678 | 32,756 | 33,353 | 33,176 | 33,981 |
| 26 | 33,120 | 32,678 | 32,756 | 33,353 | 33,176 |
| 27 | 32,441 | 33,120 | 32,678 | 32,756 | 33,353 |
| 28 | 31,961 | 32,441 | 33,120 | 32,678 | 32,756 |
| 29 | 27,952 | 31,961 | 32,441 | 33,120 | 32,678 |
Source: Data from 1% Sample of Internal Revenue Service (IRS) unedited population files.
Note: Data from 2010, and data for 26-year-olds, are not used in the differences calculations.
Acknowledgements
The views expressed are those of the authors and are not necessarily those of the US Department of the Treasury. We thank Angshuman Gooptu and Kate Yang for research assistance. We thank Jeff Brown, Janet McCubbin, and participants of the 2014 Tax Policy and the Economy conference for helpful comments.
A preliminary version of this analysis that did not include regression analysis, titled “The Impact of the Affordable Care Act Young Adult Provision on Labor Market Outcomes: Evidence from Tax Data,” was presented at the 2014 Tax Policy and the Economy conference, and appears in the conference volume Tax Policy and the Economy, Volume 29 (2015). For information regarding the data and/or computer programs utilized for this study, please address correspondence to the lead author at
1
See Dave et al. (2015) for a more detailed literature review. In addition to the papers noted here, Mulligan (2013), Sommers et al. (2013), and ![]() all study the impact of recent health market reforms on labor market outcomes.
all study the impact of recent health market reforms on labor market outcomes.
2
Of course, adding a child to a parent’s plan may necessitate switching from an individual or individual-plus-one plan to a family plan, which likely increases health insurance costs for the parent. In addition, ![]() found that the ACA YA provision led to an increase in premiums of 2.5 to 2.8% among plans that covered children, relative to individual plans.
found that the ACA YA provision led to an increase in premiums of 2.5 to 2.8% among plans that covered children, relative to individual plans.
3
Although more than half the US states had some young adult provision in place prior to the ACA, those laws have weaker requirements than the ACA YA provision. The majority of employer-provided health insurance is self-insured and thus exempt from state mandates. State mandates also do not affect Internal Revenue Service (IRS) tax obligations, meaning that employers could not provide tax-exempt compensation when covering those over age 18 (unless disabled or under age 23 and a full-time student), a further constraint on state YA mandates’ effectiveness. Many state laws contained other stipulations, such as requiring that covered dependents be full-time students or unmarried.
4
Ages are based on the age at the end of the calendar year. We exclude 26-year-olds because such individuals could be in the treatment group (under 26) in some months of the year and in the control group (26 and over) in the other months. This problem is ameliorated somewhat by the fact that insurers are allowed to keep 26-year-olds on parental plans until the end of the plan year (so some 26-year-olds would belong in the treatment group), but the problem still exists for plans that do not end at the end of the calendar year. So, to keep such partially treated individuals out of the treatment and control groups, we omit the 26-year-olds.
5
Note that we do not include state fixed effects, as we cannot observe state of residence for those young adults who do not file tax returns and do not receive W-2 or 1098-T forms.
6
Even though we have panel data, a specification that includes individual fixed effects is problematic, since the effect of the YA provision in such a specification would be identified based solely on the 1986 birth cohort. Note that including individuals’ fixed effects essentially de-means the data, and so the coefficient on Young*Post is identified only from those for whom Young*Post is not always 0 or 1. Young*Post always equals 0 for birth cohorts from 1979–1985 (1979–1982 birth cohorts never have Young = 1, and birth cohorts from 1983–1985 have Young = 1 only in the pre-period), while Young*Post always equals 1 for birth cohorts from 1987–1989. Only for the 1986 cohort is Young*Post equal to 1 in one year (2011) and 0 in another (2013).
7
An additional potential concern is that the period after the YA policy change coincides with a labor market recovery, and so any differential recovery patterns by age could be incorrectly estimated as having been caused by the YA provision, even if pre-trends tests did not signal concerns. Given that the law affects only young adults whose parents have private insurance, young adults whose parents do not have employer benefits could form an additional control group in a triple difference (DDD) specification. The use of this additional control group would rest on the assumption that the law did not cause selection. Evidence in the literature suggests that the YA provision did not cause parents to seek insurance or to change parental labor supply (Akosa Antwi et al. 2013; Depew 2015), and a DD specification similar to ![]() , in which the dependent variable was our proxy for parental health insurance, suggested that the YA provision did not affect parental insurance coverage. However, the pre-trends tests failed in some of the DDD specifications, suggesting that estimates of the effect of the YA provision in these specifications may not be reliable. Nevertheless, we tried such specifications and summarize the results below. Detailed results are available from the authors upon request.
, in which the dependent variable was our proxy for parental health insurance, suggested that the YA provision did not affect parental insurance coverage. However, the pre-trends tests failed in some of the DDD specifications, suggesting that estimates of the effect of the YA provision in these specifications may not be reliable. Nevertheless, we tried such specifications and summarize the results below. Detailed results are available from the authors upon request.
8
Empirically, most children who are 18 years old and younger are claimed on a parent’s tax returns, given the substantial tax benefits of claiming dependents. The dependent file, which is based on claiming dependents on tax returns, is comprehensive in tax year 1997 and from 2001 forward but is very limited in tax years 1996 and 1998 to 2000.
9
Author calculations using data at http://www.bls.gov/web/cewbd/table_f.txt. The calculation shows that in Q1 2013, 51.6M worked in private firms with fewer than 250 employees, out of a total payroll number of 135.7M. Accessed at ![]() (April 12, 2016).
(April 12, 2016).
10
Full-time employment in a large firm is another potential proxy. However, tax data do not contain information on number of hours worked.
11
That self-employment income is underreported in tax data is well established, and so this variable may miss some individuals who are self-employed. Hurst, Li, and Pugsley (2014) found that misreporting of self-employment income plagues survey data as well, and estimated that self-employment income is underreported by about 25% in the Consumer Expenditure Survey and the Panel Study of Income Dynamics.
12
We define the primary employer (job) as the employer (job) from which the individual receives the most in wages in a given year.
13
The instructions for Form 1098-T note that the form is required to be filed by any “college, university, vocational school, or other postsecondary educational institution that is described in section 481 of the Higher Education Act of 1965 as in effect on August 5, 1997, and that is eligible to participate in the Department of Education’s student aid programs. This includes most accredited public, nonprofit, and private postsecondary institutions.” The educational institution files the form for any students who are enrolled for credit and who pay a qualified tuition or related expense. Educational institutions are not required to file the form for students whose expenses are entirely waived or paid entirely with scholarships. As a result, if a student has a full scholarship, or if a student is a graduate student whose tuition is waived, he or she might not have received a 1098-T, in which case we would wrongly assume that the individual was not a student.
14
For example, job characteristic variables come from W-2 forms, which (in addition to being attached to income tax returns) are filed by employers with the IRS; some self-employment income comes from 1099-MISC forms (which are also subject to third-party reporting); education variables come from1098-T forms (which are filed by colleges and universities with the IRS indicating that tuition payments were received on behalf of a student).
15
16
Recall that this reduction in annual wages could be driven by some combination of lower hourly wages, lower annual hours, or both.
17
As noted above, we also tried DDD specifications using two different proxies for the presence (or absence) of parental employer-sponsored insurance: the presence of a parental retirement plan in a given year, or the parent working for an employer that reported offering health insurance to any employee in 2012. Since these specifications measure the presence of parental ESI with error, the estimated effects may be downward biased. These specifications generally revealed insignificant effects of the YA provision on the outcomes studied, though the estimated effect on log annual wages, having an employer that offers a retirement plan, and being a graduate student were statistically significant and similar in magnitude to our preferred specification when the 2012 health insurance proxy was used. These results are available upon request from the authors.
18
As noted above, since our data start in 2008, the pre-treatment period contains only two years (2008 and 2009). In these pre-trends tests, age indicator variables and the interaction between age and unemployment rate were excluded because of multicollinearity in the limited pre-policy sample period.
19
20
The larger effects for women may be driven by the fact that women tend to have higher health costs than men have (Alemayehu and Warner 2004) and have been found to be more risk-averse (see, for example, the survey in ![]() ), and so they may place greater value on parental insurance.
), and so they may place greater value on parental insurance.
21
This result may be driven by young adults from high income families having greater access to parental resources that might be needed to start a new business or to allow the young worker to choose a lower-paying job.
22
The impact on the next highest income group, however, is wrongly signed. In addition, the wrongly signed effect for primary-employer-sponsored health insurance is centered among the lowest two income groups.
23
These results may be reflective of lower income young adults being more likely to be on the margin between attending and not attending postsecondary education, with higher income young adults being more likely to be on the margin between attending or not attending graduate school.
24
Since the Akosa Antwi et al. (2013) estimate comes from studying the same age groups that were affected by the same policy during the same time period, their estimate should be applicable to our estimation sample. Note, however, that the estimate from this earlier study is based on a sample of all young adults, not those whose parents had access to employer-sponsored insurance. Nevertheless, if we use estimates from the specification in column (2) of Table 2, which (like ![]() ) includes all young adults, the elasticities would be very similar, because the coefficients are very similar.
) includes all young adults, the elasticities would be very similar, because the coefficients are very similar.