
Abstract
In the 2011–12 school year, the Newark Public School district (NPS) launched a set of educational reforms supported by a gift from Facebook CEO Mark Zuckerberg and Priscilla Chan. Using data from 2008–09 through 2015–16, the authors evaluate the change in Newark students’ achievement growth relative to similar students and schools elsewhere in New Jersey. They measure achievement growth using a “value-added” model, controlling for prior achievement, demographics, and peer characteristics. By the fifth year of reform, Newark saw statistically significant gains in English language arts (ELA) achievement growth and no significant change in math achievement growth. Perhaps because of the disruptive nature of the reforms, growth declined initially before rebounding in later years. Much of the improvement was attributed to shifting enrollment from lower- to higher-growth district and charter schools.
Keywords
In the fall of 2010, Facebook CEO Mark Zuckerberg, New Jersey Governor Chris Christie, and Newark Mayor Corey Booker announced a school improvement effort in the Newark Public School district (NPS), to be aided by a $100 million gift from Zuckerberg and Priscilla Chan. This gift—combined with $100 million in matched funds from other donors—represented approximately 4% of Newark’s school budget over the five years of the grant (2011–12 to 2015–16). Yet, it provided the city and the district with the flexibility to implement an ambitious slate of reforms. With the appointment of a new school superintendent, Cami Anderson, the reforms were launched in the fall of the 2011–12 school year. We provide a summary of the results through the reforms’ fifth year.
“Reform” in Newark was not a single intervention but rather a package of measures that included a new teacher contract, new school leaders, a new curriculum aligned to the Common Core standards, school turnaround efforts (known as “renew schools”), charter school expansion, school closures, and, eventually, a universal choice plan (which allowed parents to submit a single application for their child(ren) to attend a district or local charter school). Rather than attempt to parse the effect of each reform component (likely an impossibility), we divide the reforms into two broad categories: “within-school” reforms (such as personnel changes, Common Core implementation, and school turnaround efforts aimed at improving the results of existing schools) and “between-school” reforms (such as school closures, charter expansion, and universal choice, aimed at re-allocating students toward more effective schools). Using a value-added model to compare the achievement growth of students in Newark to similar students attending similar schools elsewhere in New Jersey, we decompose the change in average annual achievement growth into its within-school and between-school components.
A similar framework has been used to measure the sources of productivity growth in other countries (e.g., Bartelsman, Haltiwanger, and Scarpetta 2013) and industries (e.g., Chandra, Finkelstein, Sacarny, and Syverson 2016). In those studies, productivity growth was often driven by gains in market share by more efficient firms—as opposed to productivity improvements within existing firms. In K–12 education, the contributions from changing market share are typically blunted when school assignment is based on the location of a student’s residence. By closing some schools, allowing students to move to charters, and instituting a universal choice plan, however, the Newark reform strategy allowed parents to switch schools without switching residences. We assess the degree to which this opportunity improved the system’s overall productivity.
Compared to the two academic years preceding the reforms (those ending in spring 2010 and spring 2011), we find that by spring 2016 achievement growth in Newark improved significantly in English language arts (ELA) and showed no significant change in mathematics. Overall progress was not linear. In the initial years of the reform, annual average achievement growth declined in math and ELA, in both the charter and the district schools, only to increase in later years. After bouncing back in 2014–15, achievement growth in the average Newark school is now significantly higher than for similar students in the rest of the state in ELA and higher, though not significantly so, in math.
A distinguishing characteristic of the Newark reforms is the shift in enrollment toward higher value-added schools. The relationship between achievement growth and shifting enrollment is much stronger in Newark than elsewhere in New Jersey. The shifts occurred for several reasons, including the closure of schools with below-average achievement growth, expansion of charter schools with higher growth, and the introduction of universal choice (allowing parents to apply for district schools, magnet schools, and charter schools with a single application). Indeed, 61% of Newark’s improvement in English achievement growth between the baseline years and 2015–16 was attributable to shifting enrollment. In mathematics, the sole source of improvement was between-school movement, as math achievement growth would have declined in Newark relative to the rest of the state if not for enrollment shifts toward schools with faster achievement growth in math.
Our article adds to a growing literature on school and district turnarounds (e.g., Gill, Zimmer, Christman, and Blanc 2007; Young et al. 2009; Dee 2012; Fryer 2014; Papay 2015; Abdulkadiroglu, Angrist, Hull, and Pathak 2016; Harris and Larsen 2016; Heissel and Ladd 2016; Strunk et al. 2016; Schueler, Goodman, and Deming 2017; Zimmer, Henry, and Kho 2017). As other research has begun to show, turnaround efforts can produce both positive and negative externalities for student achievement growth. For instance, school choice and closures may increase pressure on schools to improve. Conversely, large movements of students and teachers can be disruptive, both for students who move and for their new classmates. By examining district-wide productivity change, our study incorporates both types of spillover effects.
Furthermore, existing studies tend to focus on the impact of reform on students in schools while they are undergoing turnaround. Less attention has been paid to understanding how disruptions in one set of schools could affect other schools and eventually alter system-wide productivity for future cohorts. For example, several studies examined the effect of school closure on displaced students (e.g., de la Torre and Gwynne 2009; Engberg, Gill, Zamarro, and Zimmer 2012; Brummet 2014; Kemple 2015; Carlson and Lavertu 2016), but few considered the impact of closure on students who avoid attending a low-performing school because it had been closed prior to their entry into the district. By contrast, we apply a framework that examines the relative contributions of various turnaround mechanisms—within-school improvements and between-school reallocation of students—to overall district-wide productivity change over time.
Newark Reforms
The Newark Public School district (NPS) has long been the focus of reform efforts. In its 1985 Abbott v. Burke ruling, the New Jersey State Supreme Court declared the state’s reliance on local property taxes for financing K–12 schools unconstitutional, and classified Newark as one of 28 districts needing additional state assistance (Hess 2007). 1 These “Abbott districts” are characterized by poor academic performance and high concentrations of economically disadvantaged students. NPS was placed under state control in 1995 after the New Jersey Department of Education determined Newark was not meeting district certification standards (Morel 2018). It was not until September 2017 that the state Board of Education voted to fully restore local control. Therefore, the district was under state takeover for the full period we study.
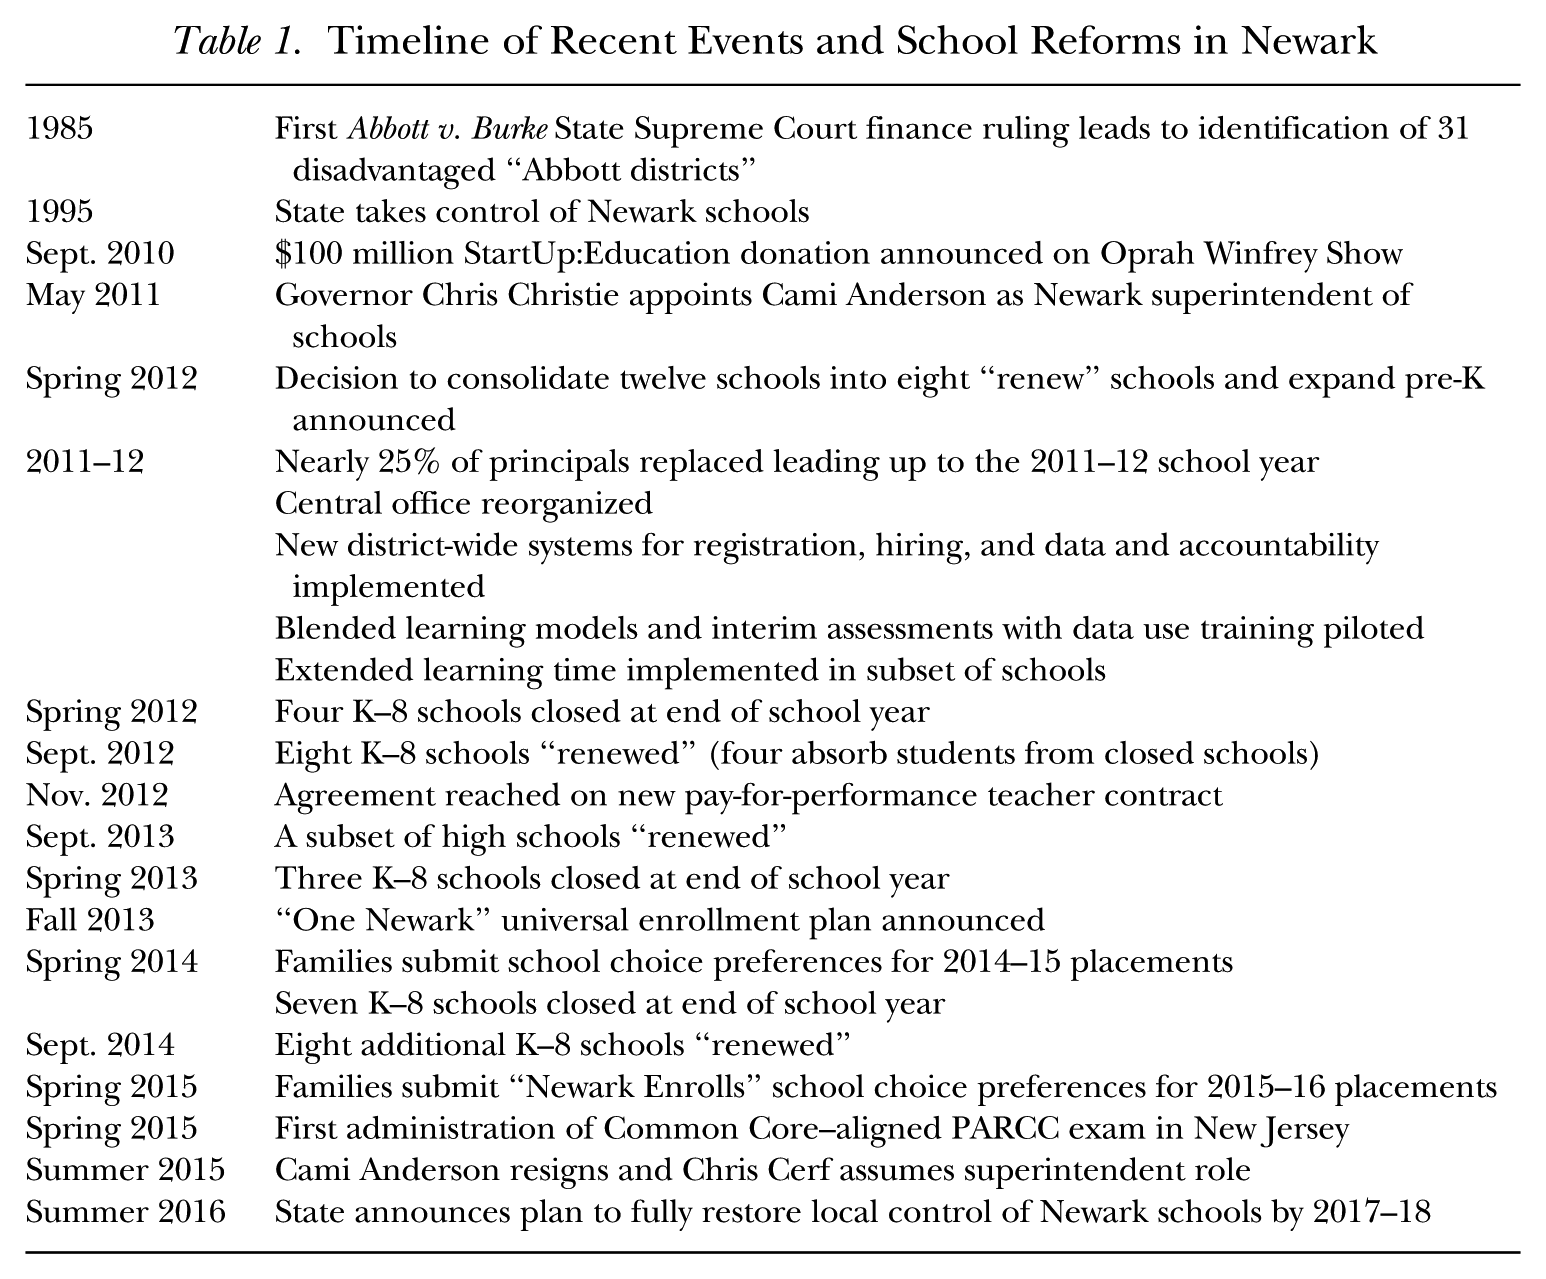
In 2010, then Mayor Cory Booker and Governor Chris Christie began collaborating on an effort to reform the Newark school system. They found a willing investor in Mark Zuckerberg, chief executive of the social networking website Facebook. Zuckerberg and Priscilla Chan (cofounder of the Chan-Zuckerberg Initiative) committed $100 million to NPS, matched by an additional $100 million from primarily foundations and private donors (Fulbeck et al. 2016). Zuckerberg, Booker, and Christie announced the donation on the Oprah Winfrey show in September 2010. To put the magnitude of the donation in perspective, the $200 million (which was to be spent over five years) was approximately 4% of the district’s five-year $5 billion budget. To carry out the reforms, Christie appointed Cami Anderson as superintendent of schools in May 2011. Anderson had led New York City’s alternative high school program under Chancellor Joel Klein. We provide a timeline of the Newark reforms in Table 1.
Timeline of Recent Events and School Reforms in Newark
The reforms can be grouped into two broad categories: those that aimed to improve existing schools (within-school reforms) and those that aimed to reallocate students to more effective schools (between-school reforms).
Within-School Reforms
Over her first three years as superintendent, Anderson replaced more than half of the district’s principals, including one-third in her first year (Russakoff 2015). She reorganized the central office, cutting 120 positions and bringing in new leadership (Meyer 2013). The new team implemented district-wide reforms such as monthly training sessions with principals, an online platform to facilitate mutual consent hiring, an early warning system to prevent drop out, changes to data and accountability systems (e.g., school data dashboards), a revamped student registration system, and extended learning time in a subset of schools (Russakoff 2015). Newark also piloted blended learning models, incorporating educational software in classrooms (NPS 2013).
In November 2012, the district ratified a new contract with the Newark Teachers Union (NTU). The four major contract provisions included 1) a new system to evaluate teachers (combining classroom observations, student growth, and other indicators such as lesson plans and teacher attendance); 2) differentiated teacher compensation, including incentives for high-performing teachers to stay in low-performing schools; 3) extended learning time in 28 schools; and 4) greater school-based decision making (including the ability for teachers to vote to overturn portions of the collective bargaining agreement). In return, NTU members received a $31 million one-time payment to resolve outstanding wage demands from prior years and $20 million in stipends during the first year of implementation. A majority of teachers perceived the new evaluation system to be fair and accurate, and reported that the extended learning time was helpful to students (Fulbeck et al. 2016). Although teachers had mixed support for differentiated compensation, Newark was able to retain teachers with higher ratings at higher rates under the new contract (Fulbeck et al. 2016).
Newark also began emphasizing the Common Core state standards before many other New Jersey districts, adopting Common Core–aligned math and literacy instructional materials in grades K–8 starting in 2013–14. For example, nearly 90% of NPS schools serving grades 3–8 adopted the Expeditionary Learning (EL) curriculum in English. These resources have been highly rated by EdReports.org for Common Core alignment. The change in curriculum may have contributed to temporary declines in performance on the New Jersey Assessment of Skills and Knowledge (NJASK) test, as the materials were less aligned with NJASK and teachers and students likely needed time to learn how to use these new resources effectively.
The final major within-school reform was the attempted turnaround of underperforming schools. Eight K–8 schools were chosen for turnaround during the 2012–13 academic year, and an additional eight were chosen for 2014–15. 2 The schools—labeled “renew schools”—were the focus of a multi-pronged effort. First, principals were required to reapply for their jobs; in the first round, half of the principals were replaced (Russakoff 2015). Once hired, principals were able to rehire or replace teachers (Calefati 2012; McGlone 2013). About half of the teachers were replaced in the first round. 3 Beyond staffing changes, students were given extended learning time and teachers received additional professional development opportunities. Renew schools also conducted extra outreach to families and offered students better access to nurses, social workers, and community-based mentoring (Kamenetz 2013; Fulbeck et al. 2016).
Between-School Reforms
While working to improve the district schools, Newark leaders also sought to shift students into higher-quality schools. School closures were one component of that strategy. Between 2011–12 and 2014–15, 11 traditional district schools serving grades K–8 were closed based on low enrollment and poor performance. 4 Some students from closed schools transferred to charter schools; others were reassigned to nearby district schools, some of which were renew schools. Four of the eight schools in the first round of renewal received students from one of the four schools that closed that year. In addition to district school closures, three charter schools were closed between 2011–12 and 2014–15 for several reasons, including poor academic performance and financial and legal concerns (Mooney 2013). Students affected by the 2013–14 school closures were offered transportation from several shuttle hub locations to their new schools. The district also opened seven new schools, including two single-sex schools, to serve students in grades 6–12.
Meanwhile, enrollment in Newark’s charter schools grew rapidly. In spring 2011, 14% of all NPS students were enrolled in charters. By 2015–16, the percentage had doubled to 28% and was even higher among K–8 students (32%). The charter sector included 20 different operators by 2015–16. The largest were TEAM Academy, affiliated with the national Knowledge is Power Program (KIPP) network, and North Star Academy, affiliated with the national Uncommon Schools network. These two operators accounted for 46% of Newark’s charter enrollment in 2015–16 and 56% of the growth in charter enrollment between 2010–11 and 2015–16.
In the winter and spring of 2014, Newark instituted a universal choice system (now known as “Newark Enrolls”). This system allowed families to rank their preferred schools on a single application, choosing from traditional district schools, magnet schools, and nearly all of Newark’s charter schools. Students were then matched to schools. 5 Previously, families were assigned to a district school based on the location of their residence; if they wanted their children to attend a charter school or a magnet school, they were required to submit a separate application to each school. Beyond the shuttles mentioned above, NPS directly provided transportation only to students with an Individualized Education Program (IEP) and provided public bus tickets to students living two or more miles from their school (NPS 2016). TEAM Academy (KIPP) was the only charter network that provided busing (Russakoff 2015).
Despite the national attention on Newark, the impact of the reforms on student achievement growth has not previously been evaluated. 6 We focus on annual achievement growth—rather than levels of achievement—given the changes in the composition of students attending district and charter schools in Newark.
Data
Our data cover all New Jersey public school students in grades 4–8 for seven academic years (2009–10 through 2015–16). The data include student demographic and program participation indicators including age, gender, race or ethnicity, limited English proficiency status (LEP), eligibility for free or reduced-price lunch (FRPL), and disability classification, as well as current- and prior-year test performance on state mathematics and English language arts (ELA) standardized tests.
For the academic years ending in 2009 through 2014, our student outcomes are NJASK state test scores. 7 In spring of 2015 and 2016, New Jersey administered the Partnership for Assessment of Readiness for College and Careers (PARCC) assessment, designed to reflect the Common Core State Standards. For both tests, we standardized scores by grade and year. We limited our analysis to students with non-missing outcomes and covariates. We also dropped those in schools and grades with fewer than five students in a year.
In Table 2, we report mean characteristics for four subgroups: students attending Newark district schools, Newark charter schools, other Abbott district schools, and the remainder of New Jersey schools. Similar to the students in the other Abbott districts, students in Newark district schools were more likely to be African American or Latino and more likely to be eligible for subsidized lunches than were students in the rest of New Jersey. They were also lower achieving, with mean standardized test scores in the prior year two-thirds of a standard deviation below the state average in mathematics and ELA. Compared to students in Newark district schools, students in Newark charters were more likely to be African American, but less likely to be Latino, special education, or LEP students. Newark charter school students had somewhat higher achievement in the prior year than did the Newark district students, scoring 0.16 standard deviations (SD) below the statewide average, rather than two-thirds of a SD below.
Student Sample Characteristics, 2009–10 to 2015–16
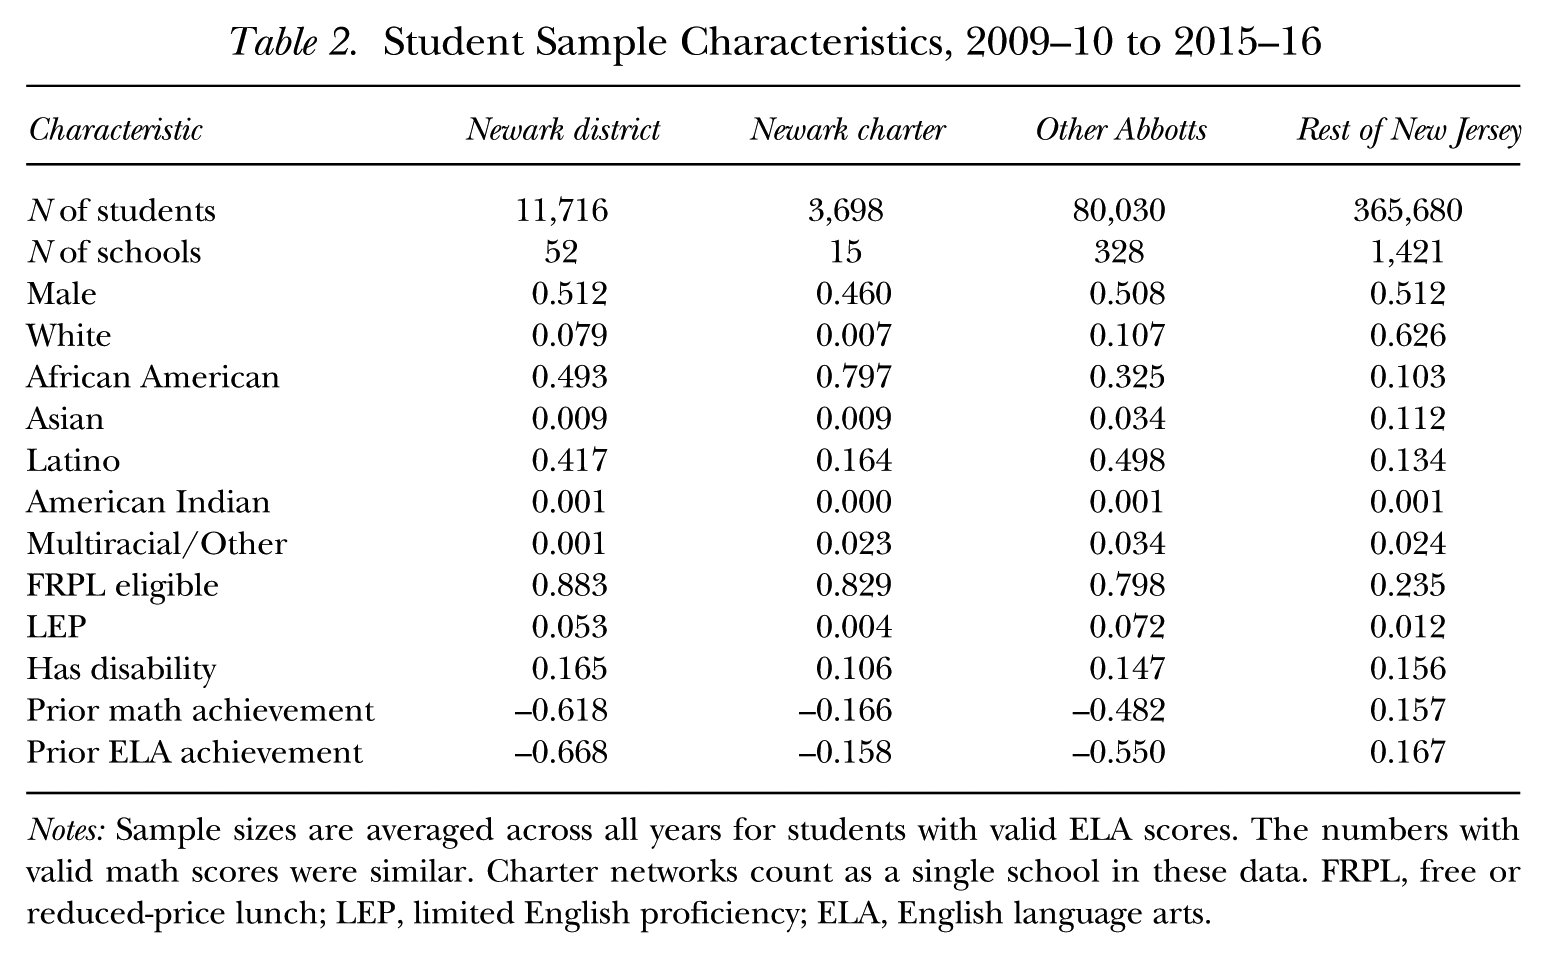
Notes: Sample sizes are averaged across all years for students with valid ELA scores. The numbers with valid math scores were similar. Charter networks count as a single school in these data. FRPL, free or reduced-price lunch; LEP, limited English proficiency; ELA, English language arts.
Methods
To assess the impact of the Newark reforms, we measure the rate of annual achievement growth for all Newark students (including those attending charter schools) relative to other students in New Jersey with similar baseline achievement and demographics who attend schools with similar mean baseline achievement and demographics.
Specifically, we estimate the following value-added model:

where
We include district-by-year fixed effects to avoid conflating the influences of student and school-level characteristics (for which we seek to adjust) and the effect of district-level policy changes (which we seek to measure). In other words, we estimate the effect of student and school characteristics based only on within-district-year variation in those covariates, which may be correlated with district-level policy changes. (For instance, other low-income districts may have been pursuing the same policies as Newark.) Accordingly, our estimates adjust Newark’s performance relative to other schools based solely on the measured effect of those school characteristics within districts in each year.
We then estimate the difference in adjusted achievement growth between Newark and other New Jersey districts with the following second-step equation:

where
The coefficient in Equation (2) on the Newark indicator,
Within-School Changes in Achievement Growth
We also explore the within-school changes in achievement growth in Newark by estimating a model identical to the one depicted in Equation (2), except that we 1) include school fixed effects,
Enrollment Growth and Achievement Growth
Given Newark’s efforts to allow children to move between schools, we estimate the relationship between baseline measures of school achievement growth and subsequent school enrollment changes. Specifically, we follow Chandra et al. (2016) and estimate the following model at the school level, by year and subject, separately for Newark and for comparison districts:

where
Finally, we decompose the change in district-wide average school value-added to assess the extent to which productivity changes in Newark were attributable to within-school change versus between-school movement. We follow Chandra et al. (2016) in their adaptation of Foster, Haltiwanger, and Krizan (2001), Foster, Haltiwanger, and Syverson (2008), and Baily, Hulten, and Campbell (1992). Our decomposition takes the following form:
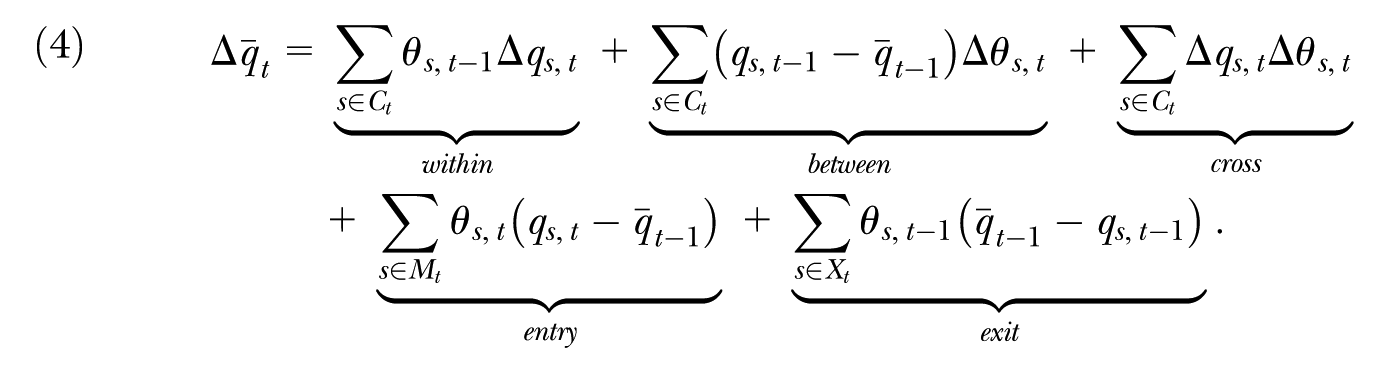
In Equation (4),
The above model decomposes average change in a district’s productivity into five terms. The within term reflects changes in average value-added in the district attributable to value-added improvements among schools holding their share of the district’s enrollment constant. The remaining terms reflect the various ways students reallocate across schools. The between term represents the extent to which productivity improvements resulted from students moving from lower value-added schools to schools that were already higher value-added in year
The cross term represents enrollment growth at schools with value-added that improved between the two periods. If schools that were growing in enrollment were also seeing declines in the average achievement growth, this term will be negative. We categorize the cross term as a “between school” movement, since it captures the degree to which enrollment shifted toward improving schools. (Some authors categorize this term as neither within nor between, but as its own category.)
The entry term captures improvements in value-added due to new schools opening with higher value-added than the previous district average. The exit term captures productivity gains attributable to lower than average value-added schools closing. Each of these terms could be negative if changes in value-added, enrollment shares, or the district’s portfolio of schools contributed to reductions in average district-wide value-added.
We decompose the change in value-added into a “long difference” in which
Results
Figure 1 portrays the trend in district-by-year effects (

Trends in Math and ELA Value-Added in Newark and the Abbott Districts Relative to the Rest of New Jersey
Relative to the rest of the state and the Abbott districts, Figure 1 illustrates that value-added in Newark declined (or, at the very least, showed no obvious improvement) in the first years of the reform (2012–2014) in both math and ELA. However, value-added increased sharply for Newark in 2015 in both subjects. In that single year, Newark’s achievement growth increased by 0.09 SD in math (from 0.03 to 0.12) and 0.11 SD in ELA (from –0.05 to 0.06). Compared to the largest districts in New Jersey over this time, Newark’s change was larger than 1 SD of the change that the average large district experienced. 11
Newark was not the only low-income district to see achievement growth increase with the administration of the new Common Core–aligned PARCC assessments in 2015. During the same year, growth in the Abbott districts also increased (although less than in Newark) by 0.01 and 0.06 SD in mathematics and English, respectively. In data published by the state, both Newark and the average Abbott district also saw large increases in their 2015 Student Growth Percentiles in English and math. 12 In 2016, achievement growth in Newark remained well above the state and the Abbott districts in English, but declined in math (remaining above the Abbott districts and the state, but no longer significantly so).
Table 3 reports estimates from Equation (2) showing the achievement growth trends, overall and separately for traditional and charter schools in Newark. 13 The first row of the table reports the difference between Newark and the rest of the state in value-added in the two years prior to the reforms. As reported in column (1), the combined achievement growth of Newark district and charter schools in math was 0.068 SD higher than for similar students elsewhere in New Jersey pre-reform. In column (4), the 0.017 SD difference in ELA growth was not statistically different from zero. As reported in columns (3) and (6), however, the Newark advantage in achievement growth before the reforms was primarily attributable to the Newark charter schools, for which annual achievement growth was 0.319 SD higher in math and 0.215 SD higher in ELA. To put the magnitude of these estimates in context, one standard deviation in value-added across the largest statewide districts was .08 in math and .05 in ELA in the baseline years. In other words, Newark charters were more than one SD above the highest district value-added in math and almost two SDs above the highest district in ELA. By contrast, the Newark district schools had comparable achievement growth to similar schools elsewhere in New Jersey in both subjects in the two baseline years.
Trends in Value-Added in Newark Schools Relative to the Rest of New Jersey
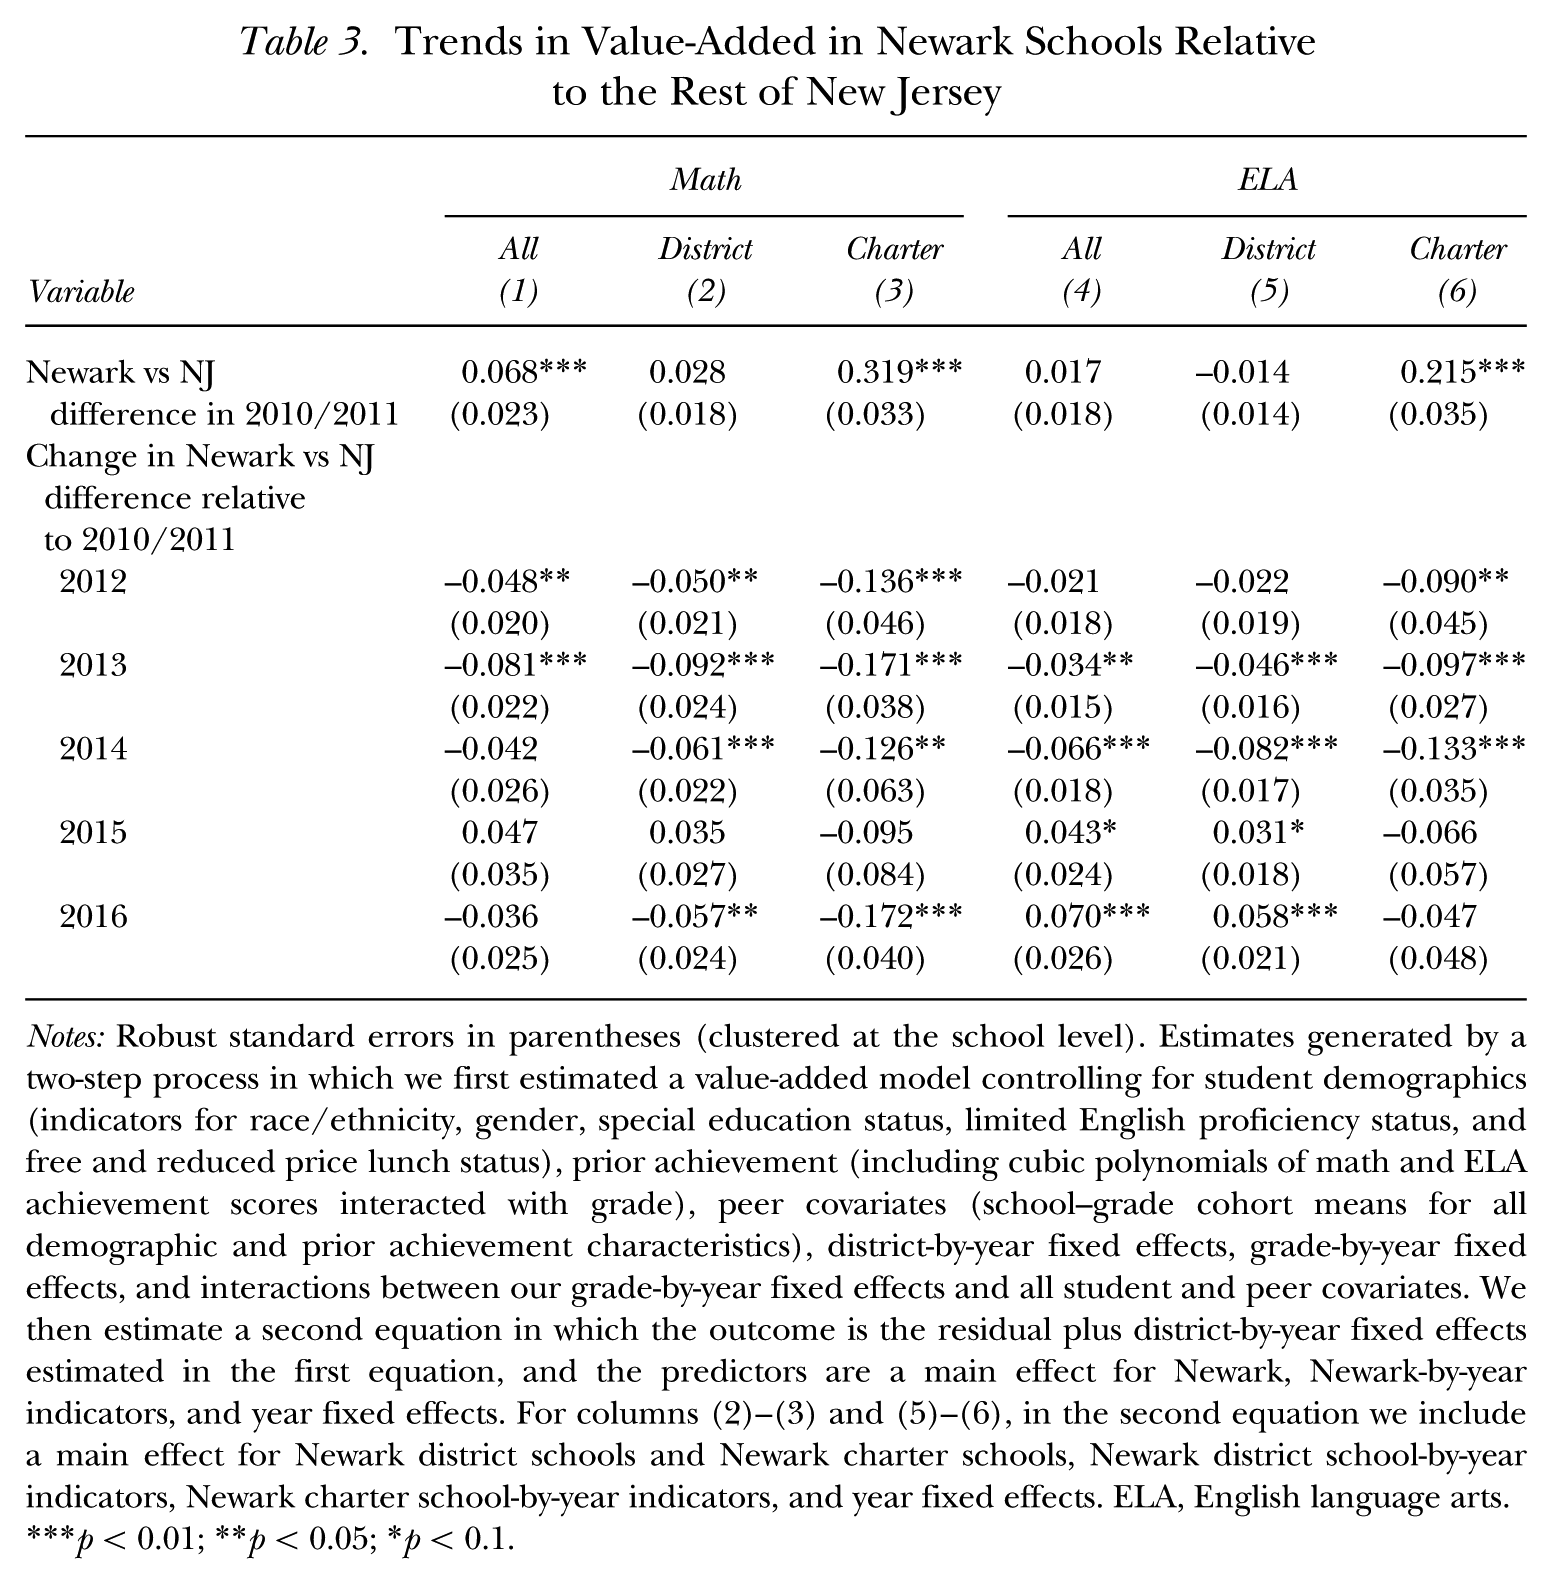
Notes: Robust standard errors in parentheses (clustered at the school level). Estimates generated by a two-step process in which we first estimated a value-added model controlling for student demographics (indicators for race/ethnicity, gender, special education status, limited English proficiency status, and free and reduced price lunch status), prior achievement (including cubic polynomials of math and ELA achievement scores interacted with grade), peer covariates (school–grade cohort means for all demographic and prior achievement characteristics), district-by-year fixed effects, grade-by-year fixed effects, and interactions between our grade-by-year fixed effects and all student and peer covariates. We then estimate a second equation in which the outcome is the residual plus district-by-year fixed effects estimated in the first equation, and the predictors are a main effect for Newark, Newark-by-year indicators, and year fixed effects. For columns (2)–(3) and (5)–(6), in the second equation we include a main effect for Newark district schools and Newark charter schools, Newark district school-by-year indicators, Newark charter school-by-year indicators, and year fixed effects. ELA, English language arts.
p < 0.01; **p < 0.05; *p < 0.1.
The Newark charter schools’ advantage in achievement growth on the eve of the Newark reforms was quite large—two to three times as large as the difference in achievement growth associated with having a novice teacher versus an experienced teacher. As other research suggests, Newark is home to one of the most effective charter sectors in the nation in terms of student growth on standardized exams (CREDO 2015). The only other city known to have a similarly effective charter sector is Boston, Massachusetts (Angrist et al. 2010, 2012; Abdulkadiroglu et al. 2011). As we discuss below, the close proximity of an unusually effective charter sector played a major role in the impact of the Newark reforms.
The remaining rows of Table 3 report the change in Newark’s value-added during the reform years relative to the rest of New Jersey. In the first three years of reform, Newark’s achievement growth declined in mathematics, in both district and charter schools. By 2013, achievement growth in math was 0.092 SD lower in district schools and 0.171 SD lower in charter schools than in the pre-reform years.
By 2015, across all Newark schools, achievement growth recovered to be a bit above pre-reform levels, although the difference was only marginally significant for ELA. Achievement growth by 2015 was slightly higher than in the baseline years for district schools and slightly lower for charter schools.
The improvements in ELA achievement growth persisted and were significantly above baseline by 2016, although some backsliding occurred in math, with achievement growth significantly below the baseline years in both the charter and the district sectors. Yet, despite the decline within both sectors, when the charter and district schools are combined in column (1), the Newark achievement growth advantage in math in 2016 was not statistically different from the baseline (2010/2011). The reason for this apparent contradiction is the sizeable shift in enrollment toward the charter sector, which we discuss below.
In terms of ELA achievement growth, in 2016 the Newark district schools were ahead of where they were in 2010/2011, relative to comparable schools in New Jersey. In contrast to having achievement growth of 0.014 SD below average, Newark district schools had achievement growth of 0.044 SD above average (–0.014 + 0.058) in English. Meanwhile, Newark charter schools largely maintained their advantage in English, generating 0.168 SD more growth than did schools working with similar students in New Jersey (0.215 – 0.047).
Understanding the 2015 Increase
The timing of the sharp rise in Newark’s achievement growth in 2015 corresponded with two other events that could have affected Newark’s measured performance: the transition from the NJASK to the PARCC assessment and an increase in the proportion of students with no reported score on the state tests. We investigate both possible factors.
The PARCC differed from the previous NJASK assessment in both subjects. In math, the new tests placed greater emphasis on mathematical reasoning over procedural knowledge. And in ELA, the new tests placed more emphasis on written responses that employed critical thinking skills to analyze reading passages (NJDOE 2016). Moreover, the PARCC test in New Jersey was almost exclusively administered by computer (in contrast to the paper-based NJASK format). It is possible that PARCC assessed different content than did NJASK, and that Newark students may have performed better on this content even in the years prior to 2015, had they been tested on it. Although we have no way to test this theory, it seems plausible given that Newark schools began emphasizing the Common Core State Standards earlier than did other school districts in New Jersey.
At the student level, the relationship between a student’s achievement score one year to the next did not change with the transition to the new test. A student’s performance on the 2015 PARCC test was only slightly less correlated with her performance on the prior year test as it had been in 2014 (0.82 compared to 0.84 in math and 0.80 compared to 0.83 in English). In other words, a student’s prior performance on NJASK was equally predictive of her PARCC achievement as it was of her subsequent performance on NJASK in prior years. Kane et al. (2016) reported similar findings regarding the year-to-year correlations in test scores in four states administering Common Core aligned assessments in 2015 (Massachusetts, New Mexico, Maryland, and Delaware).
A student’s performance on any test reflects a combination of factors, however: those that are stable (such as their family background, test-taking behaviors, prior learning) as well as recent additions to their knowledge (their improved understanding of the new standards). Student-level correlations could be attributable to family background and prior learning—which we would expect to be stable—even if the school-based additions to their knowledge changed with the switch in assessment.
As a result, we estimated district-level differences in achievement growth within New Jersey in each of the years (which reflect additions to knowledge, after differencing out the effect of students’ background and prior learning). During the NJASK years (2010–2014), the year-to-year correlation between district-level value-added averaged 0.64 for math and 0.66 for ELA. 14 Even after excluding Newark, the correlation between district value-added in 2015 (with PARCC) and district value-added in 2014 (with NJASK) fell to 0.47 in math and 0.29 in ELA. Thus, the introduction of the PARCC test reshuffled district rankings in value-added more than in pre-PARCC years. Assuming both tests have similar levels of measurement error, these results imply that the PARCC and NJASK were assessing different sets of skills, and the districts that excelled in preparing students for PARCC were not necessarily the same as the districts that excelled at preparing students for NJASK. Thus, what appears to be a single-year gain in performance may have been present before 2015, but was simply undetected by earlier NJASK tests.
We also investigated whether the 2015 increase in Newark value-added was related to the increase in the proportion of students with no assessment results in the state data. Figure 2 reports the proportion of New Jersey students with missing math scores. 15 Parent and teacher groups opposed to standardized testing (e.g., United Opt Out) were especially active in New York and New Jersey in spring 2015. Across New Jersey, the proportion of students without test scores spiked in 2015. Although we cannot distinguish between students who actively opted out and those lacking scores for other reasons, it is likely that the sharp increase was because students and parents opted-out of the PARCC test at greater rates (Ujifusa 2015). The 2015 rise in the proportion of students missing scores was particularly large in Newark.
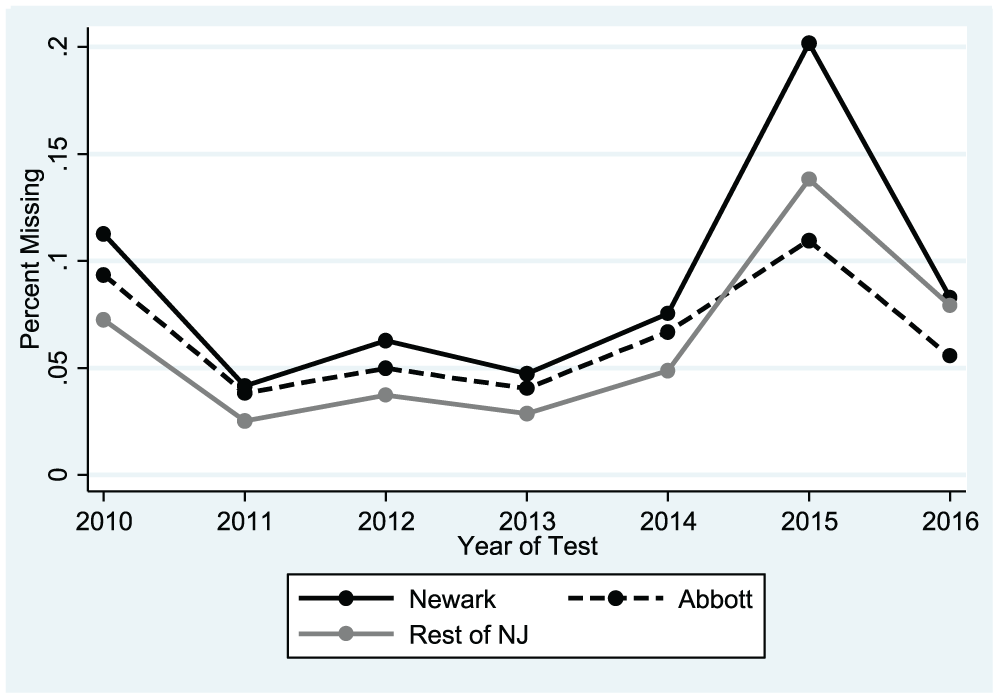
Percentage of Students Missing Valid Math Test Scores over Time
The increase in the proportion of students missing test scores does not seem to have caused the increase in Newark’s 2015 student achievement, however. Figure 3 plots the change in school-level value-added against the increase in the proportion of students with missing scores between 2014 and 2015, separately for Newark and the remaining New Jersey districts. If the opt-out movement explained Newark’s 2015 value-added increase, the schools with greater increases in the proportion of missing scores would experience greater value-added increases. However, the opposite seems to be true. The increase in the proportion of students missing scores was negatively related to the increase in a school’s value-added, indicating that the rise in the proportion of missing test scores did not drive the increase in value-added in Newark.

Change in Percentage Missing Valid Test Scores and Change in Value-Added by School between 2014 and 2015
Within-School Changes
Table 4 shows the change in value-added within existing Newark schools, both overall and separately, for three categories of schools: charter schools, the eight district schools renewed in 2013, and the remaining district schools. Columns (1) and (5) represent the overall estimates with the inclusion of school fixed effects to isolate within-school changes. In both math and ELA, continuing declines in achievement growth within schools through 2014 were evident. Charter schools had the largest within-school declines in achievement growth in both subjects in 2012 (columns (2) and (6)). There were especially large declines in renew schools in 2013 (the first year of renewal), when achievement growth declined by 0.17 SD in math and 0.13 SD in ELA relative to the baseline years. These declines were followed by a rebound in 2015 in both subjects. For ELA this rebound persisted into 2016, but within-school math value-added declined below pre-reform levels again in 2016. On a within-school basis, the average charter school achievement gain in math was still 0.19 SD below the pre-reform years in 2016. In the district schools that were neither renewed nor closed, achievement growth was 0.081 SD below pre-reform levels. By 2016, however, annual achievement growth in the renew schools had recovered to the point that they were not statistically different from pre-reform levels in either subject.
Within-School Changes in Value-Added in Newark (Including School Fixed Effects)
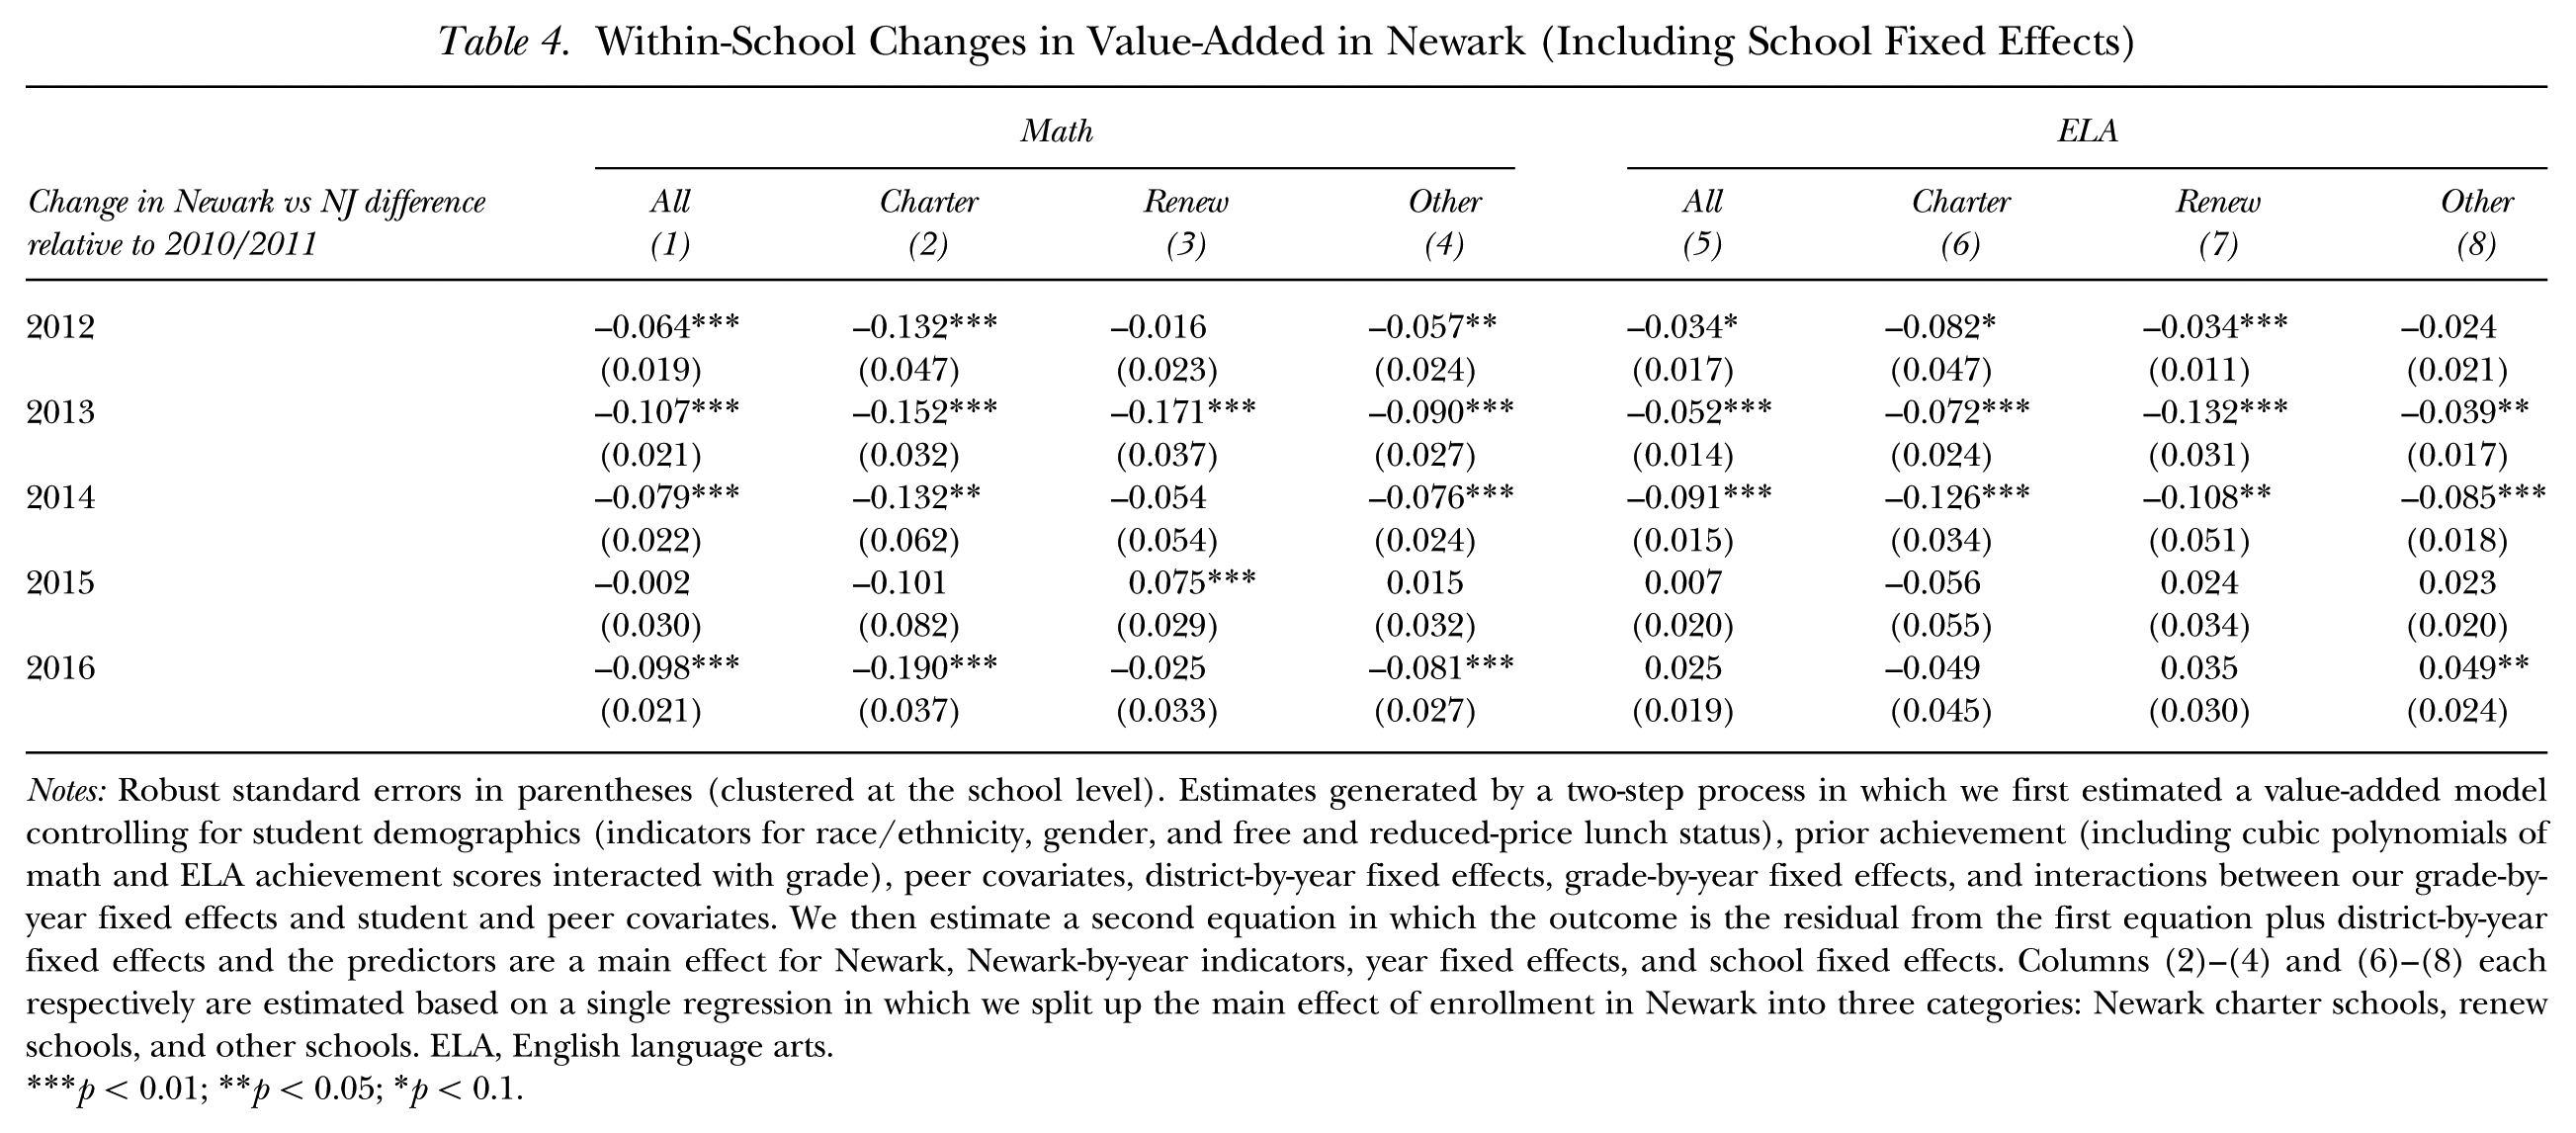
Notes: Robust standard errors in parentheses (clustered at the school level). Estimates generated by a two-step process in which we first estimated a value-added model controlling for student demographics (indicators for race/ethnicity, gender, and free and reduced-price lunch status), prior achievement (including cubic polynomials of math and ELA achievement scores interacted with grade), peer covariates, district-by-year fixed effects, grade-by-year fixed effects, and interactions between our grade-by-year fixed effects and student and peer covariates. We then estimate a second equation in which the outcome is the residual from the first equation plus district-by-year fixed effects and the predictors are a main effect for Newark, Newark-by-year indicators, year fixed effects, and school fixed effects. Columns (2)–(4) and (6)–(8) each respectively are estimated based on a single regression in which we split up the main effect of enrollment in Newark into three categories: Newark charter schools, renew schools, and other schools. ELA, English language arts.
p < 0.01; **p < 0.05; *p < 0.1.
One possible explanation for the within-school declines in achievement growth is the disruption that occurred as new curricula were introduced, schools closed, their students were absorbed into other schools, and renew schools hired new teachers. In 2013, a spike in new students entering schools in Newark occurred, particularly in the renew schools that absorbed the lion’s share of students from closed schools. This surge of new students may have contributed to the decline in value-added in both Newark’s district and charter schools. In supplemental analyses not reported here, however, we control for the proportion of students in non-entry grades new to a school. This turnover did not explain the within-school decline in value-added.
In addition to student turnover, Newark’s schools were experiencing significant teacher turnover during the early reform years. A surge in new teachers entered renew schools in 2013, many of whom were in their first year of teaching in the state. Specifically, nearly half of the renew school teachers were new to their school in 2013. Roughly a quarter of teachers were new in other district schools that year. This factor may help explain the initial decline in value-added in these schools. Moreover, we might have expected achievement to subsequently rise simply as new teachers gained experience.
Between-School Reallocation
In Table 5, we investigate the reallocation of students into higher value-added schools. In Newark, a significant positive relationship exists between a school’s value-added and its subsequent enrollment growth. The relationship between value-added and enrollment growth holds in both the tested grades (4–8) and the younger grades (1–3). Looking over the entire 2011–2016 period, the estimates suggest that in Newark a school with 0.10 higher value-added in 2011 gained roughly 40 additional students.
Regressing Growth in School Enrollment on School Math Value-Added
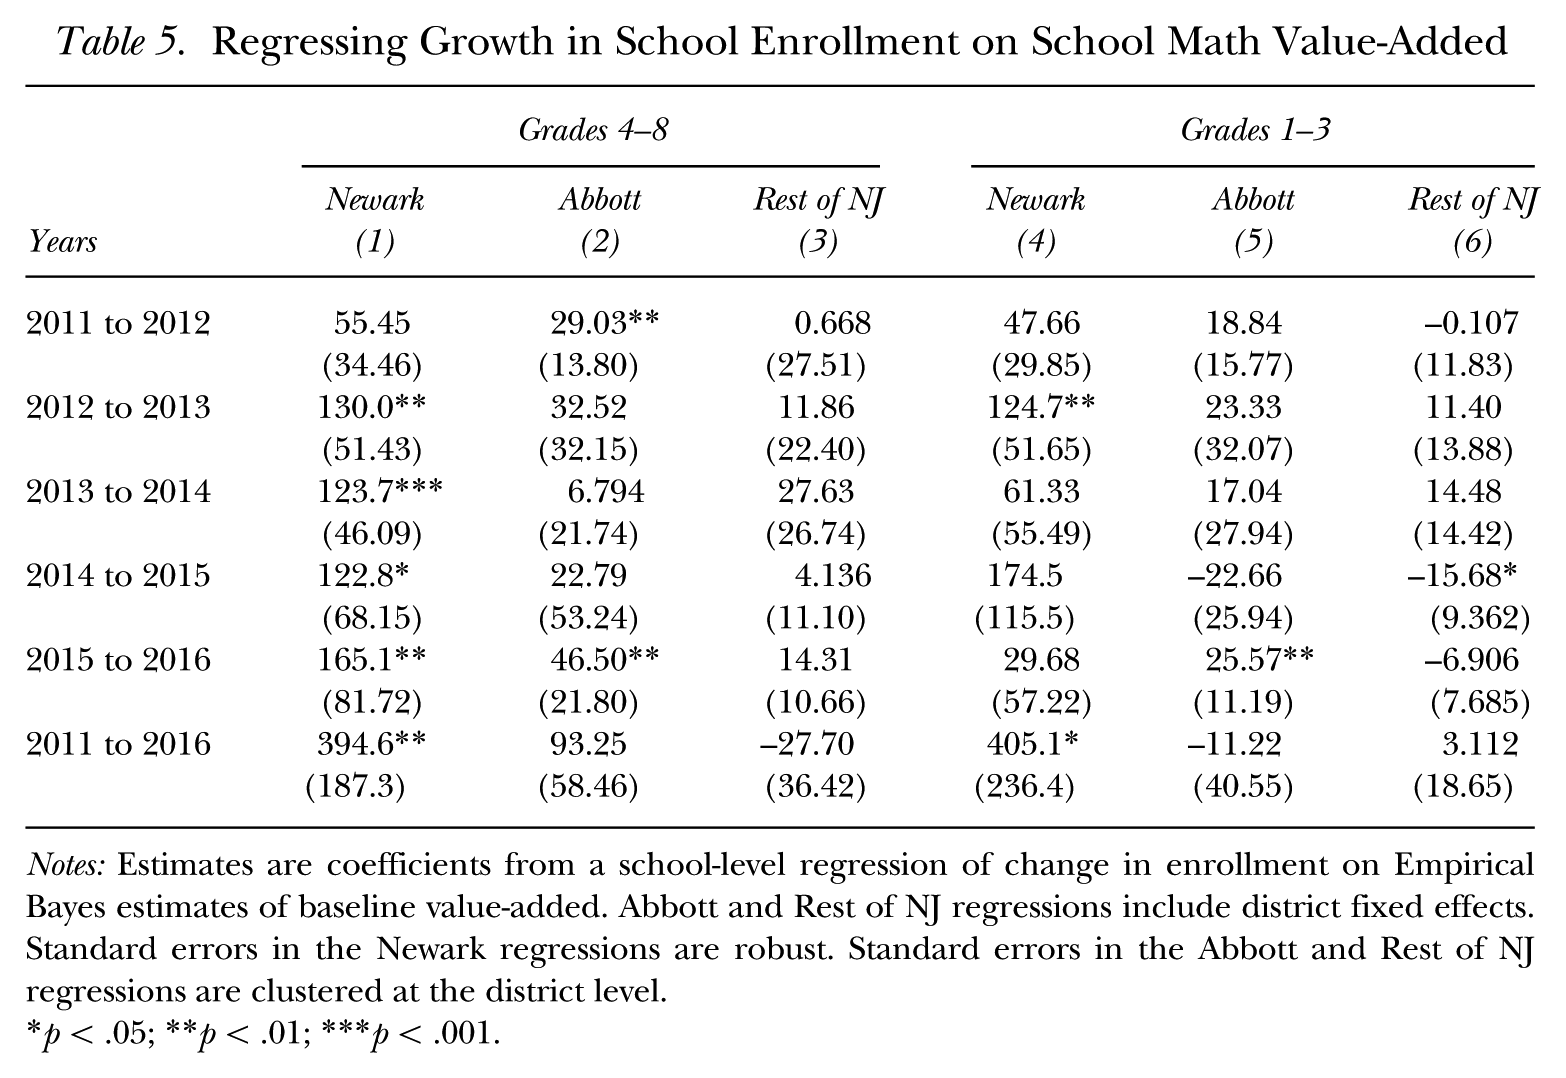
Notes: Estimates are coefficients from a school-level regression of change in enrollment on Empirical Bayes estimates of baseline value-added. Abbott and Rest of NJ regressions include district fixed effects. Standard errors in the Newark regressions are robust. Standard errors in the Abbott and Rest of NJ regressions are clustered at the district level.
p < .05; **p < .01; ***p < .001.
Enrollment changes were much less related to differences in value-added in the Abbott districts and in the rest of New Jersey school districts. For these districts, no statistically significant relationship existed between enrollment growth and value-added differences in most years, and the magnitude of the coefficient in each year and over the whole period (2011 to 2016) was much smaller than in Newark.
Figure 4 plots enrollment growth in grades 4–8 from 2011 to 2016 against school math value-added in 2011 for all Newark schools. Substantial variation in value-added across schools in Newark is evident, ranging from below –0.30 to above 0.40, and a clear upward slope indicates that higher value-added schools grew faster. The graph emphasizes that much of this relationship is attributable to the growth of charter schools and the closing of less effective district schools. Also, we highlight schools that were oversubscribed in the first year of universal choice (2015). Since most of these schools had higher value-added, there would have likely been even more reallocation toward high value-added schools had it not been for capacity constraints that prevented even larger enrollment shifts.
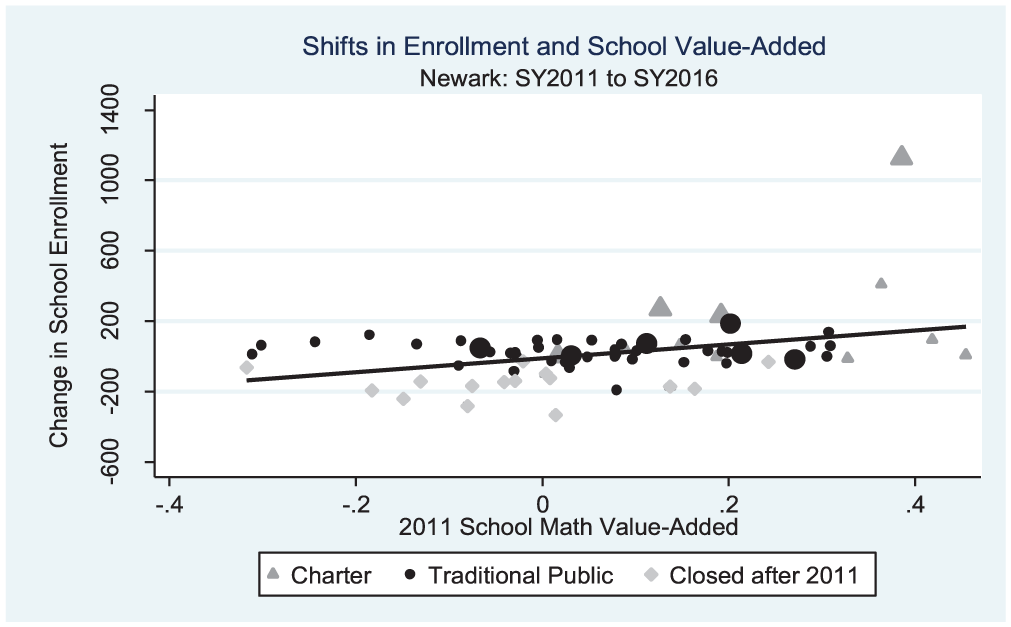
School Math 2011 Value-Added and Enrollment Changes from 2011 to 2016 in Newark
Decomposition
Table 6 decomposes the change in value-added from the pre-reform baseline years (2010–2011) to 2016 into within- and between-school components separately for Newark and the other Abbott districts. Between the baseline period (2010–2011) and the most recent available year (2016), average value-added in Newark grew by 0.07 SD in ELA—a sizeable gain comparable to the impact of being assigned to an experienced rather than novice teacher (Gordon, Kane, and Staiger 2006). However, 62% of the difference in ELA was attributable to the reallocation of students from lower to higher value-added schools.
Decomposing the Change in Value-Added from 2010/2011 to 2016

Notes: Change in average value-added of the schools attended by Newark students broken down into two components: improvements (or declines) in value-added within existing schools and changes due to the movement of students between schools with differing value-added. Change in value-added due to movement between schools is further broken down into four components: enrollment shifts between schools that existed throughout 2011–2016, the opening of new schools (school entry), the closing of schools, and a final component caused by a cross-product of changes in enrollment by changes in value-added. See text for further details. ELA, English language arts.
In mathematics, the average achievement gain was largely unchanged in Newark, at –0.036 SD. Improvements resulting from the reallocation of students from low to high value-added schools (0.043) essentially offset a within-school decline of a larger magnitude (–0.08). In other words, Newark’s math value-added would have declined if not for the shift in enrollment toward higher achievement growth schools. The Abbott districts saw negligible gains from between school movements: 0.007 in math and 0.008 in English (both statistically significant but small).
To illustrate the importance of the reallocation of students in Newark, we plot in Figure 5 the annual estimates of the cumulative change in value-added attributable to the within-school and between-school components. Although improvements due to between-school reallocations have grown steadily (to about 0.043 SD per year in both subjects), a U-shaped pattern of within-school changes emerges, with substantial initial declines followed by a large increase in 2015. In math, the increase was followed by a large decline in 2016, but in ELA, within-school improvements continued into the most recent year.
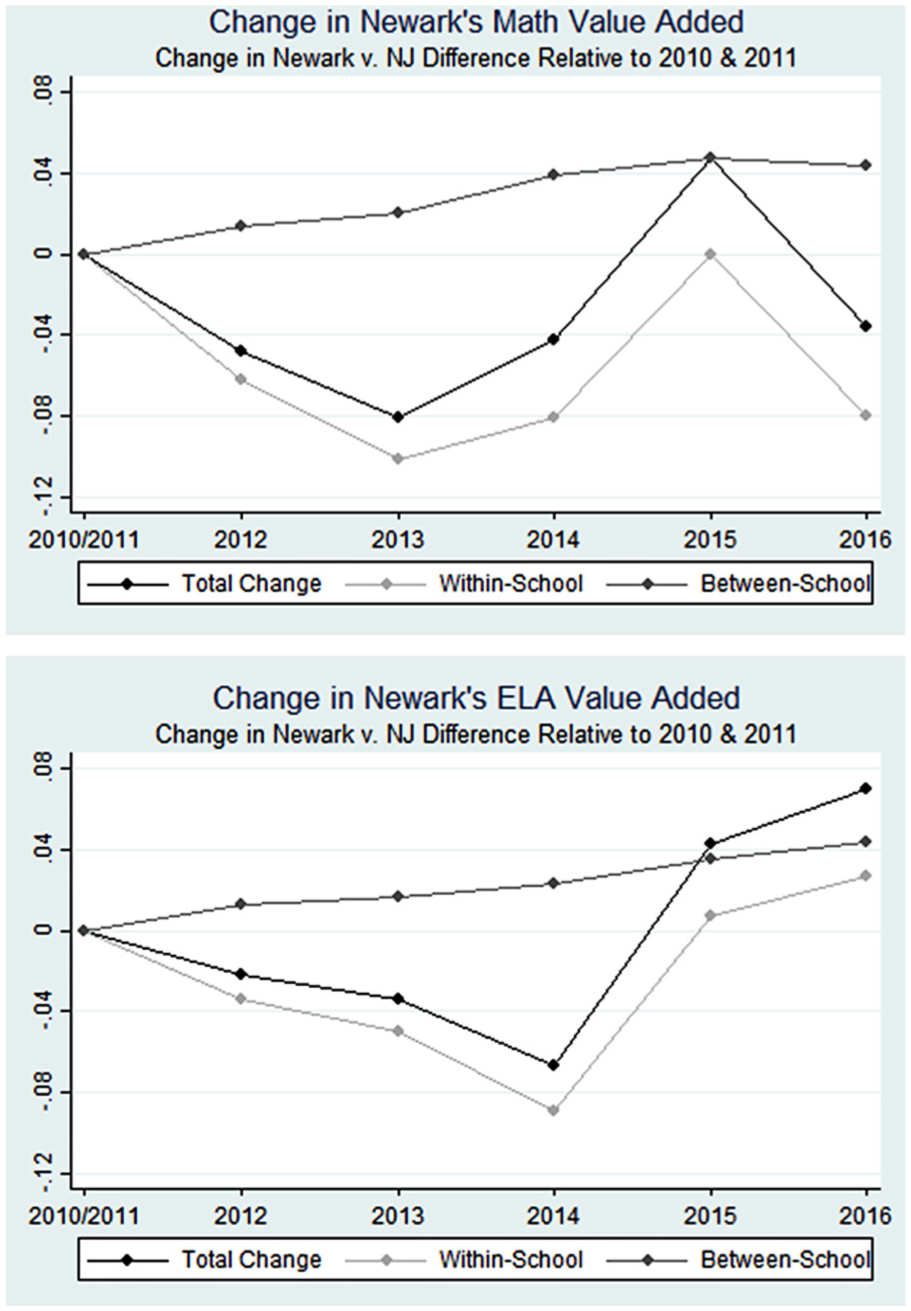
Decomposing Newark’s Change in Value-Added Relative to New Jersey in 2010/2011
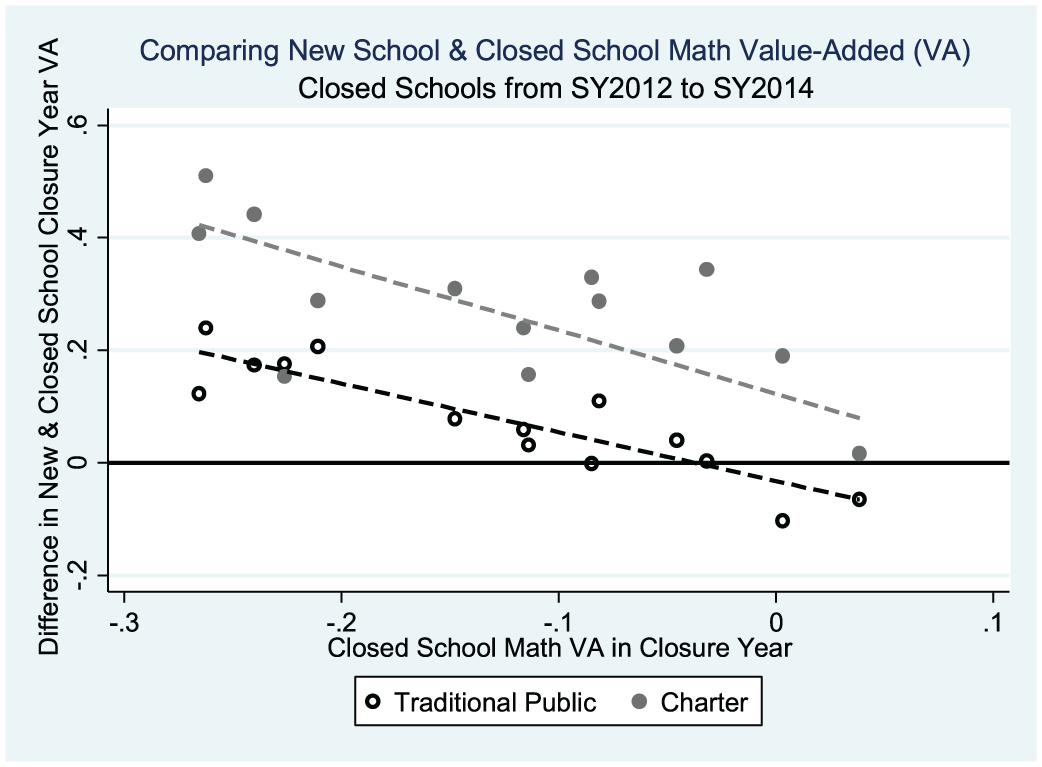
Most of the between-school improvement in value-added was driven by enrollment shifts between existing schools. Our decomposition suggests that school closures were an important part of the between-school improvement in Newark, simply because many closed schools had below-average value-added prior to closure. Figure 6 ranks all Newark schools by their math value-added, and highlights the K–8 schools that closed between 2012 and 2014. Closed schools tended to rank lower in value-added, although some schools that were not closed ranked even lower. Figure 7 plots the difference in school value-added between a closed school (in the year of closure) and the school the student moved to for all students in closed schools between 2012 and 2014. Students in closed schools with the lowest value-added moved to schools with substantially higher value-added, and those in closed schools with relatively high value-added saw little change in their school’s value-added. Additionally, students who moved to charter schools (approximately 20% of the closed school students) saw consistently larger gains in value-added, regardless of their closed school’s value-added.
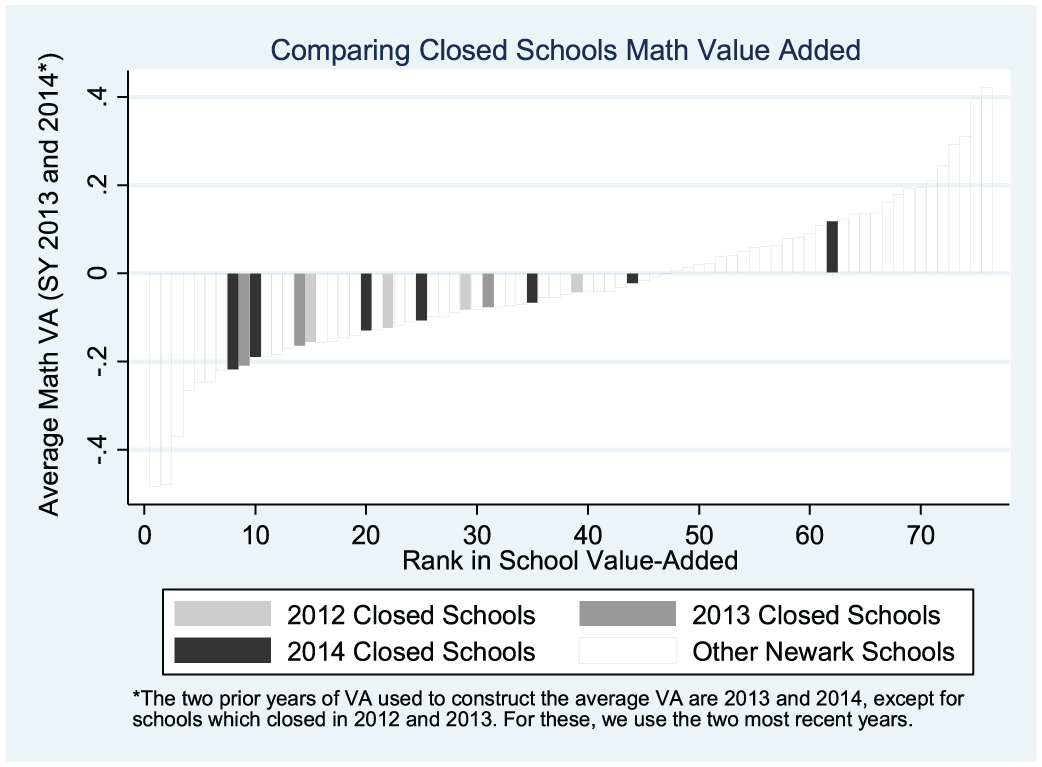
Math Value-Added Rank of Closed Schools Relative to Other Newark Schools
Change in School Math Value-Added for Students Leaving Closed Newark Schools
Theoretically, the students from the closed schools would not necessarily have experienced the same higher achievement growth as their new classmates. We explore this question in the Appendix and find evidence that closed school students do, on average, experience higher achievement growth after changing schools.
Conclusion
Although much has been written about the political controversies surrounding the Newark reforms, this article is the first systematic accounting of their impact on student achievement growth. By 2016, relative to the rest of the state, average student growth in Newark improved significantly in English and was not significantly changed in math. Our findings also highlight the difficulty of turning around existing schools, as reflected in substantial declines in achievement growth within both charter and district schools in the early years of reform. Although some examples of district turnaround yielding immediate academic improvements do exist (such as New Orleans, Louisiana [Harris and Larsen 2016] and Lawrence, Massachusetts [Schueler et al. 2016]), it is not uncommon for districts undergoing reform to see initial declines in student achievement growth (e.g., the Tennessee Achievement School District [Zimmer et al. 2017]). For Newark, the within-school rebound in achievement growth between 2014 and 2016 suggests that the tide may have turned (particularly in English).
As noted in Figure 1, Newark was not the only low-income district in New Jersey that witnessed an increase in achievement growth in 2015 and 2016. To the extent that the gains reflect policy shifts that Newark and other districts adopted, the improvement is encouraging. Because the rise coincided with the introduction of a new assessment, however, the change could be an artifact of measurement—a change in test scaling or testing procedures that disproportionately benefited students attending high poverty schools. We have tested a number of possibilities: the effect of accommodation policies on students with disabilities; floor or ceiling effects on the PARCC; a boost in scores for English language learners created by better text-to-speech options on the computer-based exams; and changes in the treatment of incomplete items in the scoring of NJASK and PARCC. None of these factors can account for the rise in achievement by many low-income districts in New Jersey. Nonetheless, even if a skeptic were to attribute the 0.07 gain in ELA achievement in the Abbott districts between 2014 and 2016 to some unspecified measurement artifact that also benefited Newark, the change in achievement growth in Newark was still twice as large as the other Abbott districts.
Still, the most distinctive element of the Newark reforms started in their first year (before the change in assessments) and continued through 2016: the steady shift in student enrollment toward higher value-added schools (both charter and district schools). That shift was helped along by the closure of some of the district’s lowest value-added schools—which essentially forced parents to choose from a set of schools with, on average, higher value-added scores (there may be room for further improvement using this strategy given that some of the lowest value-added schools remained open). Steady expansion of the charter sector also occurred over this time period, with an emphasis on expanding enrollment at the high value-added charters. As a result, even in ELA, where we observe a sharp increase in achievement growth within existing schools, more than 60% of the improvement was attributable to between-school reallocation of students. And, in math, only after factoring in the between-school movement, which offset a within-school loss in achievement growth, did overall achievement growth remain on par with the district’s relative performance in 2010/2011.
The experience in Newark has shown that reallocation of market share can be an important contributor to productivity growth in K–12 education, as it has been in many other industries. Nevertheless, other cities considering Newark-style reforms should remember two facts that make Newark unusual. First, reallocation was not always “market-based,” as school closures required some students to move involuntarily. Closing schools is politically difficult and may come with other downsides. Other districts, not under state control, may be less successful in making such hard choices. Second, Newark started the reform process with access to unusually effective charter schools nearby, which are not present in most other cities. It would be an oversimplification to suggest that most of Newark’s progress was due solely to greater parental choice. In Newark, the positive effects of parental choice were enhanced by a series of difficult, but generally well-targeted school closures and ready access to an unusually effective charter sector.
Footnotes
Appendix
Notes
Acknowledgements
We thank Bari Erlichson, Kendra Carter, Kate Fletcher, Jesse Margolis, Sarah McLean, James Riddlesperger, and Peter Shulman for their help explaining the context in Newark and accessing the New Jersey data. Kirsten Slungaard Mumma helped analyze the data, and Jon Fullerton managed the project.
This project was funded by a grant from the Startup:Education Foundation (now the Chan-Zuckerberg Initiative).
Although unrelated to the current project, we disclose the following interests: Kane served as an expert witness for Gibson, Dunn, and Crutcher LLP to testify in Vergara v. California. Staiger is cofounder, has an equity interest in, and consults for ArborMetrix, a company that sells performance measurement systems and consulting services to health care providers.
For information regarding the data and/or computer programs utilized for this study, please address correspondence to the authors at