
Abstract
This study tests whether the employer mandate under the Affordable Care Act (ACA) increased involuntary part-time (IPT) employment. Using data from the Current Population Survey between 1994 and 2015, the authors find that IPT employment in 2015 exceeded predictions based on economic conditions and the structure of the labor market. Of greater importance, using difference-in-difference methods, they find that the increase in the probability of IPT employment since passage of the ACA was greater in occupations with a larger share of workers affected by the mandate. The authors’ estimates suggest that approximately 700,000 additional workers without a college degree are in IPT employment as a result of the ACA employer mandate.
Keywords
At its passage, the 2010 Affordable Care Act (ACA) required that firms with 50 or more employees provide health insurance for their full-time workers or be subject to penalties beginning in 2014. Many analysts argued that the law created incentives for large firms to shift from full-time to part-time workers to escape the penalties and the cost of providing health insurance.
Despite numerous media reports of firms shifting to part-time work because of the ACA, only a small number of studies have used nationally representative data to determine whether the effects are quantitatively or statistically significant. Although several researchers claim that the share of workers engaged in part-time work rose sharply during the Great Recession and remains above pre-recession levels, they disagree about why the number remains so high—particularly for the share who are employed part-time involuntarily (i.e., those with part-time jobs who want full-time work). Some scholars believe that the threat of the ACA reduced employers’ willingness to hire full-time workers during the recovery. Others believe that the high level of part-time work is an aftermath of the recession and structural changes in the labor market unrelated to the ACA.
In this article, we attempt to sort out the ACA effects on involuntary part-time (IPT) employment from cyclical or other structural changes in the labor market. To isolate the effect of the ACA, we use Current Population Survey (CPS) data between 1994 and 2015 to determine what may have contributed to the growth in IPT in recent years. Our empirical analysis shows that IPT employment is significantly higher in 2015 than one would forecast given economic conditions and the occupational, industrial, and demographic structure of the labor market. Of greater importance, we show that the growth in IPT employment since ACA passage was higher in occupations for which the mandate affected a larger share of workers. We also find a more pronounced effect in low-wage occupations for which employers would have the greatest difficulty shifting the cost of the mandated health insurance coverage to their workers. Our analysis provides several tests for the robustness of the results, and we consider alternative explanations for the patterns observed in the data. Overall, we believe compelling evidence shows that the ACA employer mandate contributed to an increase in IPT work.
Although other research has examined the impact of the ACA or other state-specific employer mandates on part-time work, our study goes beyond the earlier work. Previous studies use difference-in-difference methods that compare the rate of growth in part-time work across states based on whether they had passed a state-specific employer mandate (e.g., Dillender, Heinrich, and Houseman 2016a, 2016b). Ours is the first study to use a difference-in-difference method comparing the rate of growth in part-time work across occupations based on the extent to which the mandate is likely to be binding. With this approach, we avoid relying on the identifying assumption that part-time employment trends would be similar across states had the ACA not been passed. Of course, we are forced to rely upon a different identifying assumption—namely, controlling for economic conditions and the demographic structure of the labor force, trends in part-time employment would be identical across occupations without passage of the ACA.
Background
Because of non-discrimination laws in the provision of fringe benefits that have existed since 1978, if an employer has a self-insured medical plan, the plan must be offered to all full-time employees who are classified as non-highly compensated. Because of this rule, some employers have used part-time workers or independent contractors to avoid the costs of providing health insurance for low-wage workers (Houseman 2001). Note, however, that these rules applied only to employers with self-insured medical plans and, as of 2015, only 39% of private-sector establishments had a self-insured health plan (Fronstin 2016), though the percentage is greater at larger firms. Consequently, many employers could exclude full-time employees from their health insurance plans. Moreover, no penalty existed for offering no health insurance whatsoever.
The passage of the ACA changed the rules by imposing penalties on employers who do not offer health insurance to all full-time workers. To convey how the rules changed, we provide a brief review of the penalties and mandate (terms in quotation marks are from the ACA). With initial passage of the ACA in 2010, “applicable large employers” (ALEs) would be assessed an “employer shared responsibility” (ESR) penalty if they did not provide “minimal essential coverage” for their full-time employees and dependents at an “affordable price.” A firm is considered an ALE if, based on employment in the prior year, it employed an average of at least 50 full-time equivalent employees (FTEs). Any worker averaging at least 30 hours per week (or 130 hours per month) counts as one FTE. For part-time workers averaging less than 30 hours per week, total weekly hours of all part-time workers are divided by 30 to calculate FTEs (or monthly hours are divided by 130). For example, if an employer has 40 employees who each work more than 30 hours per week and 60 part-time employees who each average 10 hours per week, total FTEs would be 40 + (600/30) = 60 FTEs. 1 Any employer with fewer than 50 FTEs is not an ALE and is exempt from ESR penalties.
An employer’s insurance plan provides minimal essential coverage if the plan covers at least 60% of expected health care costs. The plan is deemed affordable if the employee’s cost of coverage does not exceed 9.5% of the employee’s household income. Since employers may not know their worker’s household income, they can instead rely on one of three “safe harbors” for determining the maximum cost for affordable coverage. 2
If any of an ALE’s full-time employees purchase health insurance in the private market and receive a federal premium subsidy, the employer may be assessed an ESR penalty. To be eligible for a premium subsidy, a worker’s income must be less than 400% of the federal poverty level, and the worker cannot have access through the workplace to minimal essential health insurance coverage that is affordable. Given the federal poverty lines in 2014, workers from a one-member household would be eligible for a subsidy if household income was less than $46,680 annually; workers from a four-member household would be eligible if household income was less than $95,400 annually.
If a full-time employee of an ALE receives a federal subsidy, the employer could be assessed an ESR penalty. The size of the penalty depends on whether the firm provides affordable and minimal essential coverage to at least 95% of its full-time workers. If the firm meets this requirement, the penalty is $3,000 per full-time worker receiving a subsidy, but no more than $2,000 times the number of full-time employees (minus first 30). If an ALE provides coverage to fewer than 95% of its full-time workers, its penalty will be $2,000 per full-time employee (minus first 30).
When the initial ESR penalties were scheduled to begin in the 2014 calendar year, the number of employees and their full-time status were determined by the number of employees and their work hours in 2013. As a result, if a firm wished to reduce exposure to ESR penalties that started in 2014, it needed to make adjustments during 2013.
After the ACA’s initial passage, some of the implementation dates for the employer penalties and the workers with mandatory coverage were adjusted. Table 1 summarizes the key dates. In July 2013, the Obama administration pushed back the implementation date for employer penalties to 2015. In February 2014, the implementation date for mid-sized employers (50–99 employees) was pushed back to 2016 and transition relief was provided for large employers (100+) by reducing the minimum coverage rate to 70% of employees in 2015 and deferring the implementation of the 95% coverage rate until 2016. Although the implementation date was pushed back, some employers reported making adjustments to avoid the penalties detailed in the new law as early as 2012. For example, Investor’s Business Daily collected reports of hours being reduced to avoid the ACA penalties from more than 450 employers, with some reports filed as early as 2011.
Key Dates Associated with the Affordable Care Act
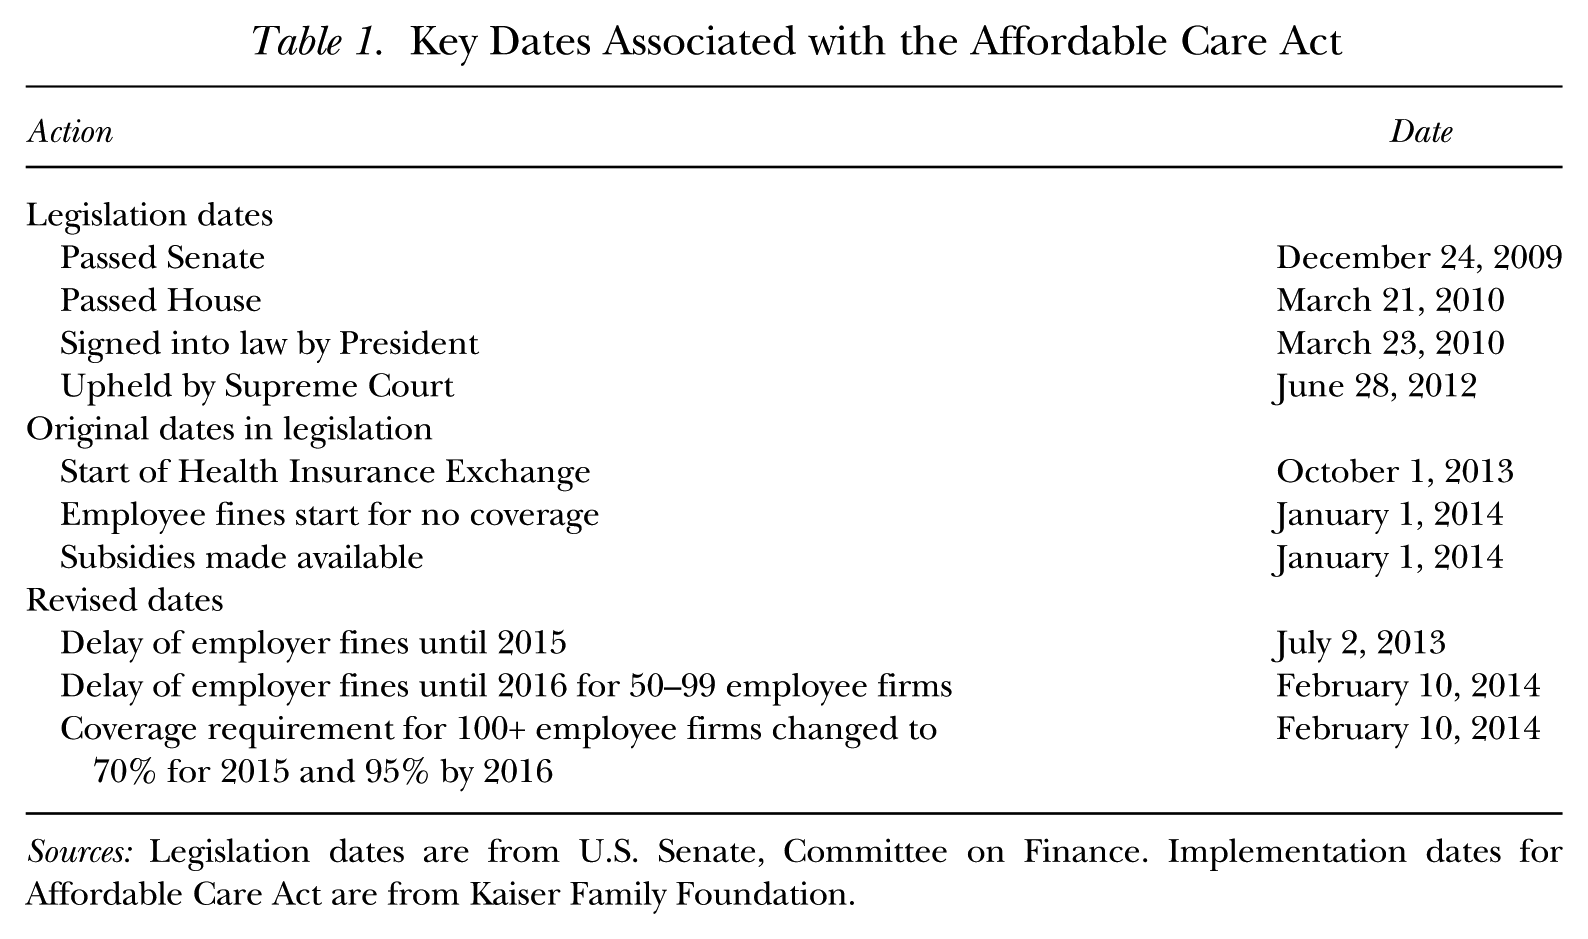
Sources: Legislation dates are from U.S. Senate, Committee on Finance. Implementation dates for Affordable Care Act are from Kaiser Family Foundation.
Transition relief pushed the implementation of the ESR payments back to 2015, but large firms that made the adjustments in the first half of 2013 may have kept them in place knowing that with implementation in 2015, exposure to ESR penalties would be determined by 2014 employment levels. The mid-sized firms (50–99 employees) may have been slower to adjust since they would not be subject to ESR payments until 2016.
An ALE could reduce exposure to ESR penalties in several ways. First, the firm could provide affordable coverage to its full-time workers. According to data provided by the Kaiser Family Foundation, in 2012 the average premium for employer-based health insurance in the United States was $5,384. 3 For a full-time worker (2,000 hours per year), this is equivalent to an hourly wage increase of $2.69. The cost would be higher for older workers and would vary across the states.
Firms increasing coverage for their full-time workers could try to shift the cost to the newly covered workers. If the firm is to avoid ESR penalties, however, it cannot require a worker eligible for a subsidy to contribute more than 9.5% of household income for the insurance. Thus, for example, if a full-time worker (2,000 hours annually) earned $10 per hour ($20,000 per year) and had no other household income, the firm could not require the worker to contribute more than $1,900 for the health insurance. If the worker earned $25 per hour, however, the firm could require the worker to contribute $4,750 per year for the plan and shift most of the cost to the employee. Since employers are less able to shift the cost of coverage to low-wage workers, they will have a greater incentive to find ways to avoid providing them coverage.
If an ALE is unable to shift the cost of the health insurance to the worker by requiring that the employee pay a large share of the premiums, it could instead cut the worker’s hourly wage. For example, if a worker previously earned $10 per hour and received no health insurance, rather than require the worker to pay the equivalent of $2 per hour for the health insurance (which would violate the rule on affordability), the firm could cut the worker’s wage by $2 per hour and require no employee contribution. This strategy is not feasible if the wage cut would put the worker’s hourly wage below the minimum wage. Cutting the hourly rate would also limit a firm’s ability to attract low-wage workers who place minimal value on the health insurance.
In sum, providing health insurance coverage is costly, and firms have incentives to shift the cost of the new coverage to workers by requiring employee contributions or by cutting wages. Since such strategies are least effective for low-wage workers, alternative strategies could be pursued to avoid the coverage requirement for low-wage employees. First, firms could try to keep employment below the threshold of 50 FTEs to escape the mandate entirely by reducing the number of full-time employees and increasing hours worked per employee. Alternatively, the firm could hire independent contractors or temporary workers. Second, a firm could shift from full-time to part-time (< 30 hours/week) workers. Failing to provide part-time workers with coverage does not result in a penalty. Finally, because a firm can compute a worker’s full-time status by averaging hours worked over 12 months, hiring short-term employees would reduce the number of workers who must be provided coverage.
While the threat of ESR penalties created incentives for large firms to switch to part-time employment, in a 2014 report, the Congressional Budget Office (CBO) emphasized the impact of the health insurance subsidies on the supply side of the labor market. Mulligan (2015) analyzed the subsidy formula and concluded that, with the health insurance subsidies, millions of workers could yield more disposable income with a part-time rather than a full-time schedule. In fact, CBO (2014) estimated that the ACA subsidies would reduce the number of full-time-equivalent (FTE) employees by approximately 2.0 million by 2017. The CBO projected that virtually all of the reduction would be attributable to workers wanting to reduce hours or to drop out of the labor market entirely because of the new health insurance subsidies.
With an increase in part-time employment from the supply side, we expect the number of voluntary part-time (VPT) workers to rise. Conversely, if the demand for part-time workers increases (perhaps because of the ACA mandate), some workers with full-time jobs may be forced into a part-time job involuntarily. For example, teenagers have been a major source of part-time workers, and as teenage employment rates have dropped, some employers may cut hours for workers who prefer full-time jobs.
Several studies examine recent trends in part-time employment with a focus on differential trends in VPT and IPT employment. The Bureau of Labor Statistics (BLS) defines IPT workers as those who work part-time, prefer a full-time job, but are unable to find a full-time job because of economic conditions. VPT workers have part-time jobs but do not want a full-time job, or are unable to take a full-time job because of personal reasons (e.g., schooling, family responsibilities, phased retirement).
Valletta and Bengali (2013) showed that VPT work has been trending downward over the past few decades and was largely unchanged during the Great Recession. Several other studies reported evidence that IPT employment rose sharply during the Great Recession and dropped slowly since the recovery. 4 Evidence suggests that IPT has remained at high levels because of employment shifts toward service industries that make greater use of part-time workers (e.g., wholesale trade and leisure and hospitality sectors) and demographic changes in the labor market resulting in fewer workers preferring part-time work. 5 Although a good deal of evidence indicates that IPT employment remains unexpectedly high after the Great Recession, most of the existing research attributes this outcome to a combination of cyclical factors and structural changes in the labor market. Media reports after passage of the ACA provided examples of employers switching to part-time workers to avoid the pending ACA penalties, but few empirical studies specifically address the role of the ACA. 6
Using 2000 to 2016 CPS data, Garrett, Kaestner, and Gangopadhyaya (2017) examined whether the ACA reduced employment or work hours. They found no effect on employment and a slightly elevated portion of workers employed less than 30 hours per week since 2014. In 2016, the VPT employment level was about 0.9 percentage points greater than predicted by their model, and the IPT employment level was 0.3 percentage points less than predicted.
Mathur, Slavov, and Strain (2016) used 2008 to 2014 CPS data to examine the effect of the ACA mandate on part-time work without any separate analysis of the effects on VPT and IPT work. Their analysis examined the effect of the mandate on the ratio of people working 25 to 29 hours per week compared to 31 to 35 hours per week and employed a difference-in-difference methodology that compared the change in the ratio after 2010 for a treatment and a control group. Treatment groups were defined on the basis of occupation, industry, or wage. Mathur and colleagues found no evidence that the ratio of workers in the 25 to 29 versus the 31 to 35 hours group grew faster for the treatment groups. They concluded that the ACA did not cause employers to switch to part-time work. Their study differs from ours in several respects. First, in Mathur et al. (2016) every worker was defined as either treated or untreated based on their occupation, industry, or wage. Second, they defined the post-treatment period as 2010 to 2014. Since the ACA was not passed until 2010 and the mandates did not officially go into effect for several years, their definition of the post-treatment period may contribute to an underestimate of the impact of the ACA on part-time work.
A 2014 survey by the ADP Research Institute found that 38% of employers planned to adjust worker hours in response to the ACA employer mandate. 7 Despite this fact, the study found no change between 2013 and 2014 in the distribution of hours worked. The authors did not, however, control for changes in economic conditions that may have offset the effect of the ACA on the average level of part-time work. They were also unable to focus on the workers who were most likely to be affected by the mandate—low-skill full-time employees of large firms who lack health insurance coverage.
Dillender et al. (2016a) used a difference-in-difference approach to estimate the effect of the ACA on part-time work. Their analysis treated Hawaii as a control group since the state had previously passed legislation that would make passage of the ACA employer mandate unimportant. Consistent with their expectations, they found that IPT employment grew at a slower rate in Hawaii than in the other states, particularly in retail, accommodations, and food services—industries with a significant share of workers who are low skill and in which part-time work has historically been common. They estimated that the ACA led to an increase in IPT employment of between 600,000 to 800,000 workers in retail, accommodations, and food services. To our knowledge, Dillender et al. (2016a) is the first study that used a nationally representative data set and found an effect of the ACA mandate on part-time work.
Dillender et al. (2016b) examined the effect of the 2007 employer mandate in Massachusetts on part-time employment using a difference-in-difference approach to compare changes in part-time employment in Massachusetts to other states. They found that the Massachusetts employer mandate increased part-time employment among workers without a college degree. They found similar results for a variety of control groups.
Overall, the extant literature finds that part-time work (particularly involuntary) remains higher than predicted by most scholars after the Great Recession. One study (Dillender et al. 2016a) reported evidence that the ACA mandate increased IPT work using nationally representative data, but it relied critically on the assumption that Hawaii is an appropriate control group.
Our research differs from the earlier work by testing whether the growth in IPT across occupations varies systematically with the share of workers affected by the mandate. Also, we show that the effects have been largest where theory predicts—among low-wage workers. Although the earlier studies have merit, we believe that our alternative approach provides more identifying variation, thereby allowing a more precise estimate of the impact of the ACA.
Data and Empirical Methods
To investigate the effects of the ACA on IPT employment, we use data from the CPS. The monthly CPS has the requisite information on hours worked, earnings, and worker characteristics, but it does not routinely collect information on firm size or health insurance coverage. We use the March Annual Demographic Supplements to the CPS to obtain this information.
Unfortunately, prior to 2011, the firm size categories in the CPS do not allow us to precisely distinguish firms above and below 50 employees. As a result, we are forced to rely on a cutoff of 100 employees for a time-consistent definition of the firms that are most likely to be affected by the ACA. Even this definition is not perfect because the March data on firm size are based on the number of employees rather than the number of FTEs as defined by the ACA. The primary hypothesis we wish to test is that the threat of the ESR penalties established by the ACA caused large employers to shift from full-time to part-time workers and increased the share of workers with IPT jobs. The challenge is distinguishing between the effect of the business cycle and the effect of structural changes in the labor market brought about by the ACA.
To examine the trend in part-time work, we use the monthly CPS data to compute the annual average of the percentage of workers aged 19 to 64 who are in VPT and IPT employment. We exclude workers aged 65 and over because they are eligible for Medicare and not eligible for a health insurance subsidy. We exclude 16- to 18-year-olds since many of them are in school and would not work enough weeks in the year to be classified as a full-time worker by the ACA. We also restrict our sample to wage and salary workers since self-employed workers are not directly affected by the mandate. Finally, we exclude workers residing in Massachusetts and Hawaii because these states had employer mandates prior to passage of the ACA. We also exclude workers from the District of Columbia because we lack data on economic conditions.
Consistent with the BLS, we define IPT workers as those who are working less than 30 hours per week but who want a full-time job. They are working part-time because of slack work or unfavorable business conditions, an inability to find full-time work, or seasonal declines in demand. 8
Figure 1 presents annual estimates of the share of workers engaged in VPT and IPT employment between 1994 and 2015. Separate estimates are provided for workers with less than 16 years of education and those with at least 16 years of education. We draw a few conclusions from the figures. First, the share of workers engaged in VPT work has been relatively stable over the past 20 years and increased only slightly during recessions. The share in IPT employment is more volatile and rose during recessions, especially during the Great Recession and particularly for the less-educated workforce. Finally, although IPT employment has fallen below the record levels seen in 2011, for both education groups, it remains above any level experienced between 1994 and the start of the Great Recession.
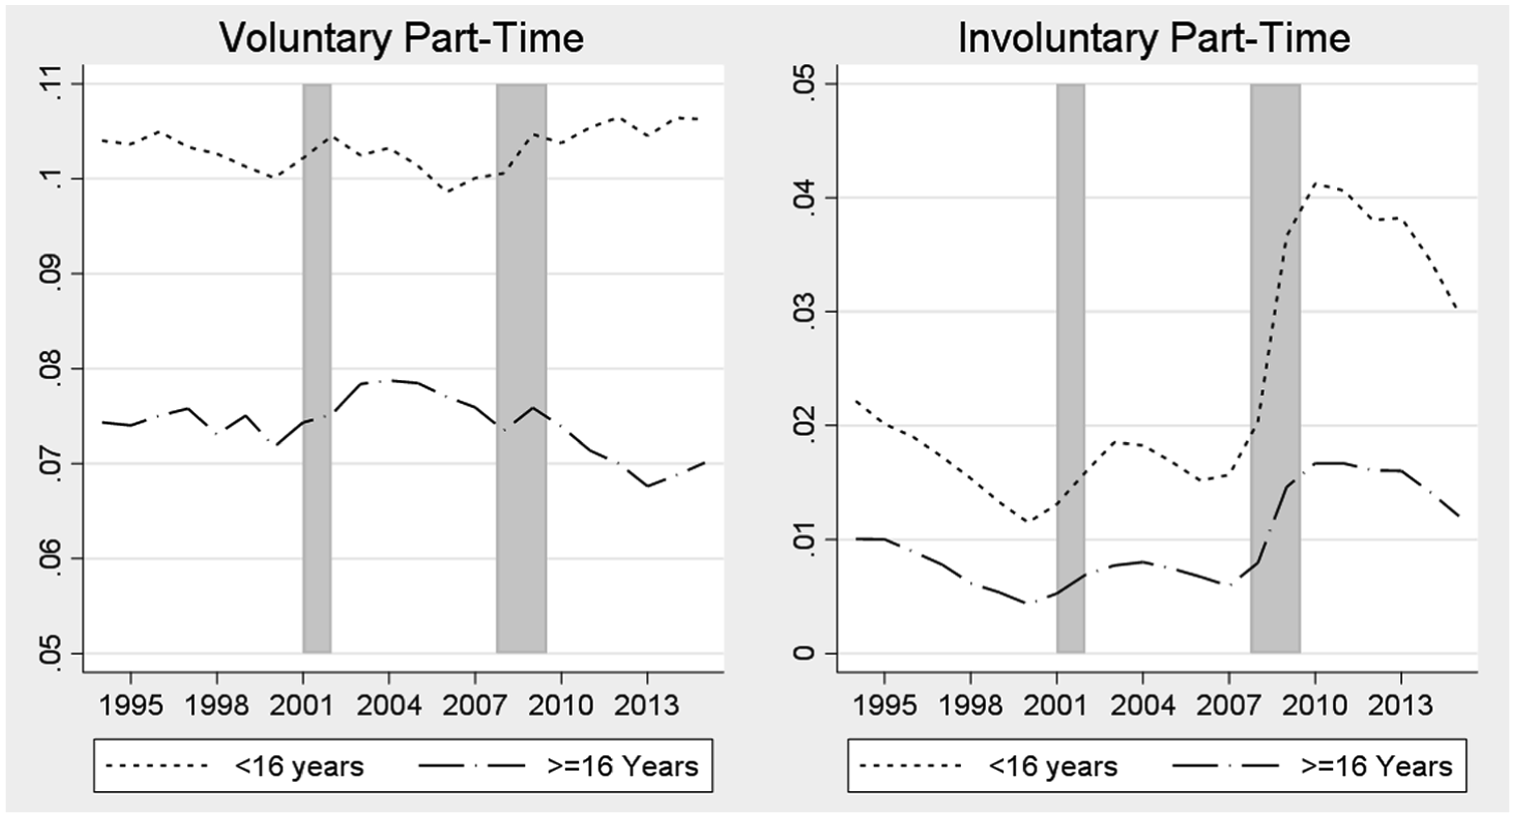
Fraction Employed Part-Time, by Education Level
For the remainder of this article, we restrict our attention to the ACA impact on IPT employment. Although the effect of the ACA on VPT employment is of interest, Figure 1 reveals that the level of VPT employment since passage of the ACA has not changed much relative to historical levels. Moreover, in separate analysis not reported here, we found no evidence of the ACA affecting VPT employment.
To determine whether the ACA led to an increase in IPT employment, we estimate a model allowing the growth in the probability of IPT employment to vary depending on the extent to which a particular job is likely to be affected by the ACA employer mandate. 9 In particular, we test whether the increase in IPT employment since the onset of the ACA is greatest in the occupations for which the share of workers affected by the mandate is greatest. To determine which occupations would be affected most, we use 2003 to 2007 March CPS data to estimate the share of workers in each occupation likely to be affected by the ACA penalties. 10 The sample period is chosen to exclude the effects of the Great Recession on IPT work and to obtain an estimate of the share affected under more usual economic conditions. 11 For each 3-digit occupation, we calculate the proportion of workers who are employed at firms with 100 or more workers, work 30 or more hours per week, and have no health insurance from their own employer. 12 The affected share is computed separately by education group.
Figure 2 presents histograms of the proportion of workers affected across 3-digit occupations by education group. In the low-education group, 16.3% of the workers are likely to be affected by the ACA employer mandate (i.e., employed at a large firm, working 30 or more hours per week, and without health insurance from their employer). In the high-education group, 11.4% are identified as potentially affected. Although the percentage affected is higher for those without a college degree, a large share of those with a college degree are in the potentially affected group. The histogram illustrates the substantial variation in the percentage affected across the 3-digit occupations that we use to identify the effect of the ACA mandate.
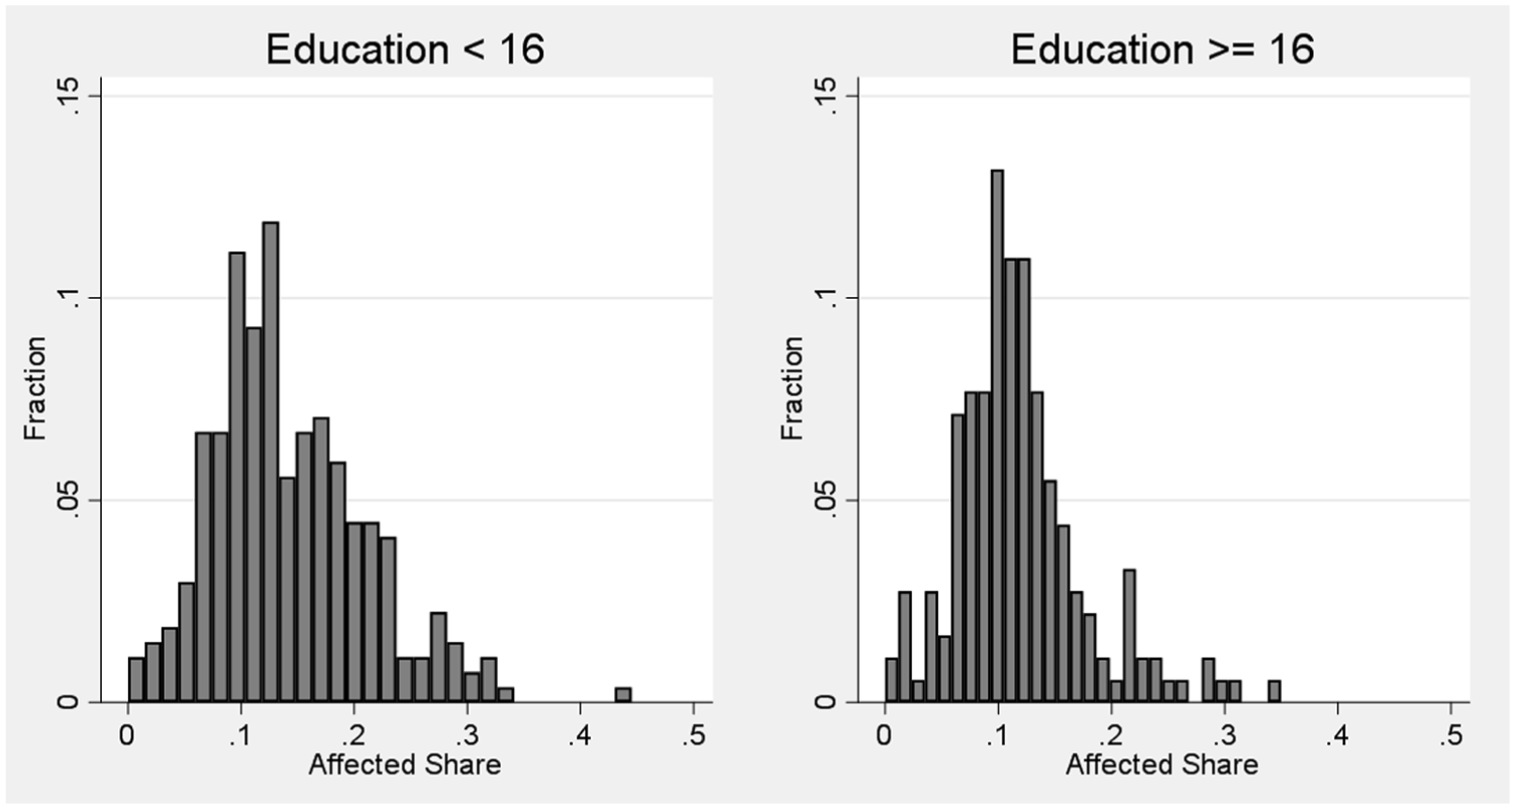
Share of Workers Affected by ACA across Occupations
Among the less-educated workers, a sampling of occupations with the affected share in the top 5% include cashiers, kitchen workers, and stock and inventory clerks. At the other extreme, occupations in the bottom 5% of those affected include dental assistants, dental hygienists, musicians and composers, and clergy.
To determine whether the probability of IPT has grown the most in the occupations with the largest share of workers affected by the ACA mandate, we use a two-step process similar to that described by Hansen (2007) to deal with inference issues that arise in regressions when data are aggregated at different levels. In particular, IPT employment is measured at the worker level, whereas the percentage affected is measured at the occupation level. A failure to account for the differing levels of aggregation can result in an underestimate of standard errors. 13
In the first step of the estimation procedure, we estimate the following linear probability model of part-time employment for each occupation:

where
An important feature of this model is that it allows the effects of personal characteristics and economic conditions on IPT (
In the second step of the analysis, we estimate a model that allows the occupation-specific year effects (

where affectj is the occupation-specific measure of the fraction affected by the ACA mandate measured as a deviation from its sample mean;
The specification in Equation (2) allows a test of the hypothesis that IPT employment rose at a more rapid rate in occupations with a larger share of workers affected by the ACA. In particular, if passage of the ACA causes IPT employment to rise more rapidly in highly affected occupations,
Since the second-step regression uses data aggregated to one observation per occupation/year cell, the sample size is reduced from more than 9 million (one observation per worker per year) in the first step to 5,918 (one observation per occupation per year) in the second step for the low-education group. For the high-education group, the sample is reduced from nearly 3 million to 3,982. 18 The second-step regression model is estimated with weighted least squares with the weights being the sample size used to calculate the proportion affected from the March 2003 to 2007 CPS. The standard errors in the second-step regression are bootstrapped (2,000 replications) to account for the estimation of the affected share and clustering of residuals by occupation. 19
Figure 3 illustrates how much of the change in IPT over time is explained by economic conditions. The adjusted year effects are variations in the probability of IPT that are not explained by our controls for economic conditions and personal characteristics. These are the estimates of

Variation in Probability of Involuntary Part-Time (IPT) Work: 1994–2015
The figure supports several conclusions. First, despite wide swings in the probability of IPT over the 1994 to 2015 sample period, the controls included in our model explain the majority of the changes. Second, examination of the adjusted year effects for highly educated workers provides no evidence of a statistically significant increase in IPT since passage of the ACA. Conversely, for workers with less than 16 years of education, in two years only (2014 and 2015) is the adjusted probability of IPT employment significantly above that for the sample period. Moreover, no evidence suggests that the rise in the probability of IPT employment after 2011 is the continuation of a long-term trend, or a trend that started with the Great Recession.
Although the probability of IPT rose in 2014 and 2015 to unprecedented levels, this is only suggestive evidence that the ACA was the root cause. Our test for a linkage to the ACA is based on testing whether the growth in the probability of IPT was greatest in the occupations with the largest share of workers affected by the ACA (i.e., whether
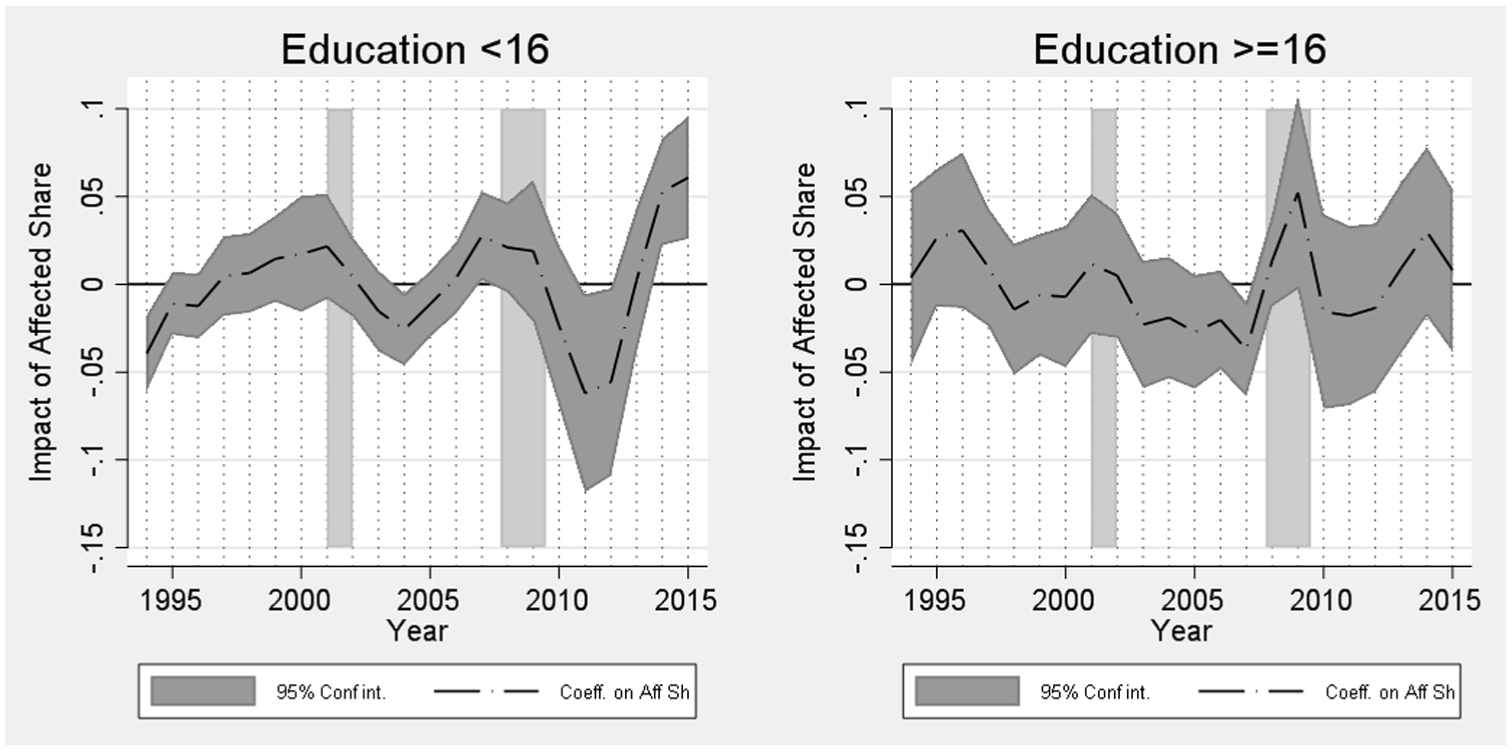
Impact of Share Affected by ACA on Involuntary Part-Time (IPT) Work
The evidence in Figure 4 shows
Overall, the evidence in Figures 3 and 4 shows that the low-education group experienced a statistically significant increase in the probability of IPT employment in 2014 and 2015 that was greatest in the occupations in which the ACA mandate affected the most workers. The positive relationship between IPT employment and the fraction affected by the mandate was never larger than in 2014 and 2015. In analyses of VPT work not reported here, we found no evidence that
To quantify the significance of the effects of the ACA on IPT, the 90–10 difference in the affected share for workers without a college degree is 0.17. Given that the coefficient on affected share is 0.061 in 2015, this implies that, relative to the base period of 1994 to 2015, the probability of IPT grew by 0.010 more among workers in a highly affected occupation (90th percentile) compared to a worker in an occupation that is only slightly affected (10th percentile). Though a 1.0 percentage point difference in the growth of the probability of IPT seems small, the average probability of IPT employment in 2015 for a worker without a college degree is only 3.0 percentage points.
One limitation of our analysis thus far is the assumption that, for a given education group, the effect of the mandate on IPT varies only with the share of workers affected. In fact, we expect that the effect would be greater in low-wage jobs. Since the ACA limits the employee contribution for health insurance to 9.5% of household income, firms are more able to pass on the cost of health insurance to high-wage workers, making such workers less likely to be subject to a switch to part-time work.
To test this prediction, we pursue the following approach. First, we estimate the 10th percentile of the real hourly wage in 2014 dollars (wage10) by 3-digit occupation for the low-education group using the 2010 to 2015 Outgoing Rotation Groups of the CPS. Second, we re-estimate the second-step regressions of the occupation-specific change in the probability of IPT employment on the affected share by adding wage10, and an interaction between wage10, the affected share, and all of the year dummies. The sum of the coefficients on these interaction terms is restricted to zero, thereby making 1994 to 2015 the reference period. Our expectation is that the mandate would have a larger positive effect on IPT employment in occupations with lower hourly wages. Thus, we expect a negative coefficient on the interaction term between wage10 and the affected share after the ACA mandate takes effect.
Table 2 provides a comparison of alternative specifications. The first specification matches that used for constructing Figures 3 and 4 as a benchmark for comparison. The second specification adds interactions between the year dummies, affected share, and wage10. To facilitate the interpretation of coefficients, the affected share and wage10 are measured as deviations from means. Since the control variables are measured as deviations from means, the estimates of the year effects reveal the change in the probability of IPT for the occupation with the average wage10 and affected share relative to the average over the sample period. That the year effects are positive and statistically significant for 2013 to 2015 implies that the probability of IPT has been rising gradually relative to the 1994 to 2015 average. The positive coefficient on the affected share variable interacted with the 2013 to 2015 year dummies implies that the probability of IPT rose most for workers in occupations for which a large share would be affected by the mandate. The negative coefficient on the interaction between affected share and wage10 in 2014 is consistent with our expectations. This result implies that the growth in IPT employment for affected occupations was greatest in low-wage occupations. Although the coefficients for the other years are not presented for these interaction terms, note that, other than in 2014 and 2015, the coefficient is significantly different from zero at the .10 level in only one year (1994). Hence, the more rapid growth in IPT in highly affected occupations with low wages did not start until 2014.
Impact of ACA on Involuntary Part-Time (IPT) Employment for Workers with less than 16 Years of Education

Notes: Coefficients are from the second step in the two-step process described in the text and represent the relationship between the control variables and the occupation-specific probability of IPT employment. Standard errors are based on bootstrapped standard errors (2,000 replications) correcting for the estimation of percentage affected and clustering by occupation. Additional details are included in the text.
As an illustration of the size of these effects, compare a high- and low-wage occupation for which wage10 is either $5 above or $5 below the average value. The marginal effect of the affected share by the ACA is close to zero for workers in the high-wage occupation. For workers in occupations for which wage10 is $5 below the average, however, the effect is about twice that for a worker in an occupation for which wage10 matches that for the average occupation. 21
Although strong evidence suggests that the growth in the probability of IPT has been greater in the occupations with a larger share of workers affected by the ACA, it is possible that our results are simply spurious correlation between structural changes in the labor market and the affected share. For example, Autor and Dorn (2013) discussed the growth of low-skill service jobs that was partly driven by technological change displacing workers in occupations that performed routine tasks. Canon et al. (2014) provided evidence that IPT employment has become more common since 2010, and that IPT is most common in non-routine manual occupations (typically low-skill service). They suggested technological change could be partly responsible for the rise in IPT.
If our occupation-specific estimate of the affected share by the ACA varies systematically with the impact of technological change, our estimate could be biased and capturing what is actually the effect of technological change. To test for this possibility, we merge Autor and Dorn’s (2013) occupation-specific measure of “routine task intensity” (RTI) to our data and repeat the second-step regressions. We include RTI as well as interactions between RTI and year dummies. The interactions allow for the possibility that the impact of technological change on IPT is changing over time. The results, provided in Table 2, specification (3), reveal that controlling for RTI has virtually no impact on our primary conclusions. Namely, even after allowing the growth in the probability of IPT to differ depending on an occupation’s exposure to the effects of technological change (RTI), the growth in the probability of IPT employment since passage of the ACA was greatest in occupations that had low wages and a larger share of affected workers.
To provide a sense of the quantitative importance of our results, we use the models in Table 2 to compute the implied change in IPT employment attributable to the ACA for workers without a college degree. In particular, we compute the predicted change in the probability of IPT employment that would occur if the occupation-specific changes observed in 2014 and 2015 had not occurred. This is estimated as the predicted change in the probability of IPT associated with switching the coefficients on the year*affect and year*affect*wage10 coefficients to zero (presented in Table 2, specification (2)) in 2014 and 2015. We then multiply this occupation-specific increase in the probability of IPT employment by the level of employment in that occupation in the relevant year. 22 We compute standard errors for our estimates by using the 2,000 bootstrapped coefficients for each regression to generate 2,000 estimates of the aggregate change in IPT employment in each year.
Our approach uses the 1994 to 2015 average as the counterfactual for what would have happened had the ACA not been passed. This approach is relatively conservative since the estimated effects would be larger if we had used one or more of the years shortly before the mandate began to bind (e.g., 2010–2012).
Table 3 presents our estimated changes in IPT employment attributable to the ACA. The estimated increase in IPT relative to the base-period of 1994 to 2015 is fairly robust to the model chosen. In all three models, the impact of the ACA starts below 120,000 workers in 2013 and is statistically insignificant. The effect rises to approximately 700,000 workers in 2014 and 2015 and is statistically different from zero at the .01 level. That the IPT effects on IPT employment are relatively flat between 2014 and 2015 might be surprising given that the employer mandate did not assess fines for a lack of coverage until 2015. Several plausible explanations for the moderation in the effect exist. First, although the penalties did not take effect until 2015, the definition of who must be covered in 2015 was based on 2014 employment data. As a consequence, employers needed to adjust employee hours in 2014 if they were to avoid the cost of providing coverage in 2015. Second, if employees are forced into IPT employment because of the ACA, they will seek out a full-time job elsewhere. Employers who wish to continue with part-time workers will eventually move toward those who voluntarily choose part-time employment. For similar reasons, the effect of the ACA on IPT may diminish over time as workers who are involuntarily employed part-time switch to other jobs and employers use workers who prefer part-time work or other ways to avoid providing coverage for low-wage workers. For example, large employers may outsource low-skill jobs or replace wage and salary workers with self-employed workers. We leave it for future researchers to test whether large firms are pursuing such strategies in response to the ACA.
Estimated Increase in Involuntary Part-Time (IPT) Employment due to ACA for Workers with less than 16 Years of Education
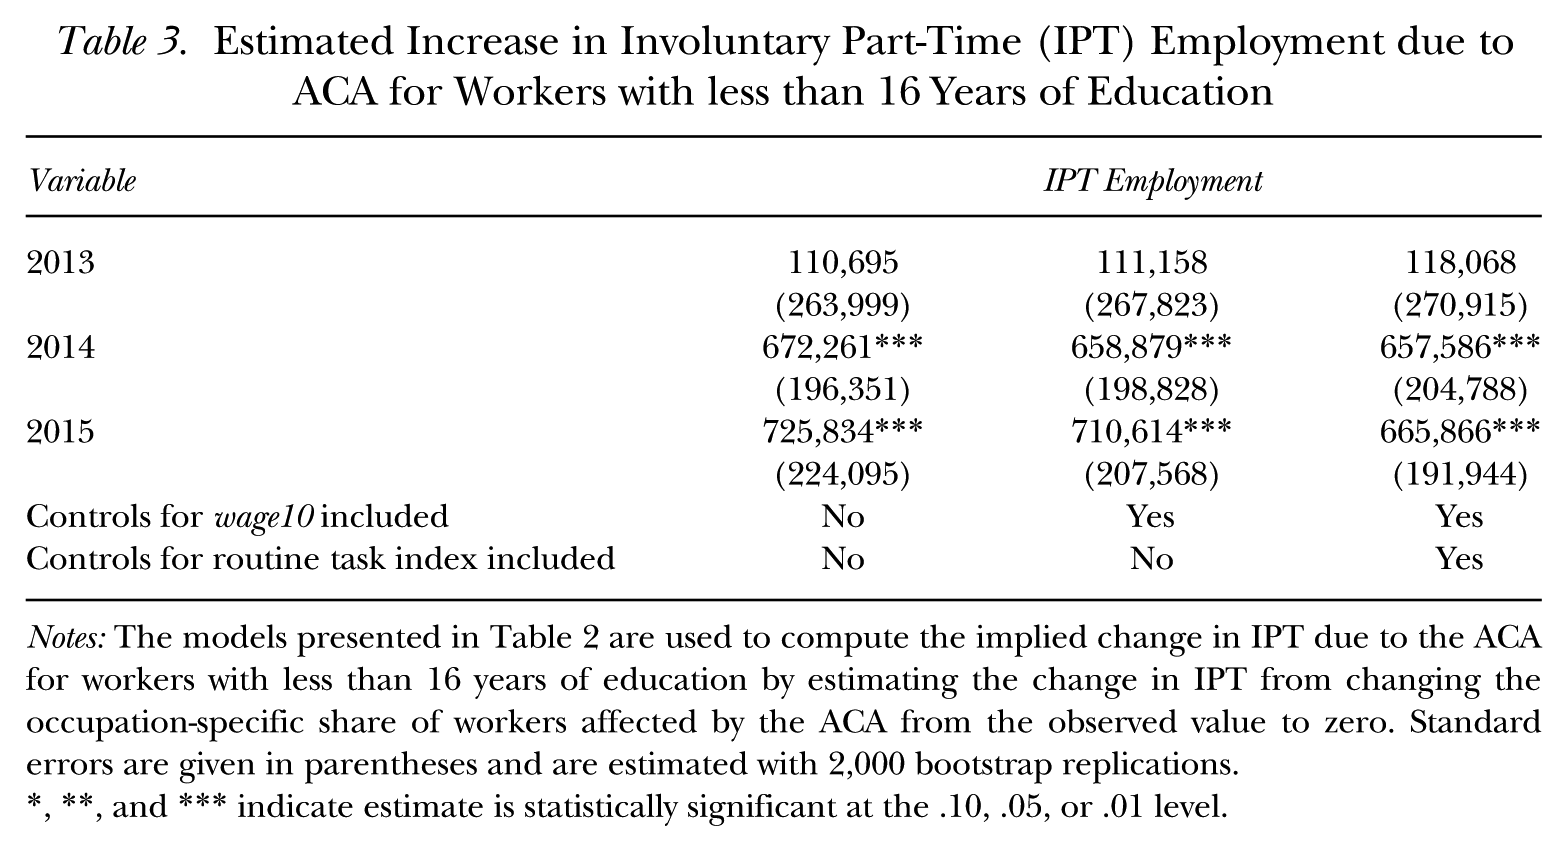
Notes: The models presented in Table 2 are used to compute the implied change in IPT due to the ACA for workers with less than 16 years of education by estimating the change in IPT from changing the occupation-specific share of workers affected by the ACA from the observed value to zero. Standard errors are given in parentheses and are estimated with 2,000 bootstrap replications.
, **, and *** indicate estimate is statistically significant at the .10, .05, or .01 level.
To put the size of our estimated effects of the ACA in perspective, in 2015, 2.3 million (3.0%) of the 77.6 million workers without a college degree were in IPT employment. Our estimates suggest that without the ACA mandate, IPT would be 0.9 percentage points lower among workers without a college degree. This change may appear small, but it implies that the ACA mandate was responsible for nearly one-third of IPT employment in 2015.
The only other study that provides an estimate of the effect of the ACA on IPT (Dillender et al. 2016b) found that the ACA employer mandate increased IPT by 600,500 to 800,500 workers among those in retail, accommodations, and food services industries. Our estimate of 700,000 workers falls in the middle of their range, but is not directly comparable. Their estimate is for the increase in IPT for workers of all education levels in retail, accommodation, and food services only. Our estimates are for all occupations, but only for workers without a college degree. To provide a more comparable statistic, we estimated a change in the probability of IPT for all workers without a college degree by occupation, and summed it across all workers in the retail, accommodation, and food services industries. For these industries alone, we estimate that the mandate caused IPT to increase by 250,000 workers. This figure is substantially below Dillender et al.’s (2016b) estimated effect of the ACA on IPT, though our study differs from theirs in terms of the identification strategy and the base period used to estimate IPT under the counterfactual without the ACA mandate.
Robustness of Results
In this section we consider the robustness of our results to alternative measures of the share affected. Our original measure defined affected workers as those working 30 or more hours at a firm with 100 or more employees without health insurance coverage from their own employer. The first variation we consider revises this definition to include only workers who have no health insurance coverage from their own employer, nor from a spouse’s or parent’s employer. If workers at large firms receive employer coverage from someone other than their own employer and their own employer does not offer them coverage, the employer could still be subject to a penalty. At the same time, if workers are offered coverage by their own employer and refuse it because they choose to receive it from a spouse or as a dependent, this will not result in a penalty. Consequently, the best measure of affected workers would be based on whether a worker is offered coverage by their own employer—but that information is not available in the March CPS.
The second version we consider alters the definition of “large” employer to those with 50 or more workers. As noted above, the ACA will apply to employers with 50 or more employees, though the implementation date for firms with 50 to 99 employees was postponed by one year. Prior to 2011, the March CPS identifies workers at firms with 100 or more workers but does not specify a lower bound of exactly 50. From 2011 forward, we can identify workers at employers with 50 to 99 workers. Using information from the 2011 to 2015 March CPS, we estimate the share of workers at firms with less than 100 employees that have between 50 and 99 employees. We then use this value to create a probability that each worker employed at a firm with less than 100 workers in the 2003 to 2007 March CPS would be at a firm with 50 to 99 workers. This information is then used to estimate the share of workers in a given occupation that are at a firm of 50 or more employees without health insurance coverage.
A third version of the share affected variable is designed to deal with the problem of “heaping” in survey responses to questions regarding hours worked. That is, many workers will round their answers to 20, 30, or 40 hours. Since a 30-hour cutoff is used to define who is affected by the ACA, we would likely misclassify those people without health insurance coverage who work slightly less than 30 hours but round their answer up to 30. To determine whether this rounding error creates a problem, we repeated all of our analyses by excluding workers who reported exactly 30 hours of work in determining the affected share and in the regressions used to estimate the determinants of IPT.
The results using these alternative versions of the fraction affected are presented in Table 4. Our key results are robust to all the variations considered. Specifically, the probability of IPT employment is elevated in 2013 to 2015 for all occupations. More important, the increase was greatest in low-wage occupations with a large share of workers affected by the mandate.
Relationship between Occupation-Specific Measure of Share Affected by ACA and Growth in Involuntary Part-Time (IPT) Employment Among Workers without a College Degree

Notes: Models replicate the regressions in Table 2, specifications (1) and (2) but with different measures of the share of an occupation affected by the ACA. Specifications (1) and (4) define affected workers as those employed full time at large firms (100+ workers) who do not receive employer-sponsored health insurance from their own or spouse’s employer or as a dependent. Specifications (2) and (4) define workers as affected if they are employed full-time at a firm with 50 or more workers and do not receive health insurance from their own employer. Specification (3) and (6) use the same definition as used in Table 2 except that all workers reporting exactly 30 hours of work are excluded from the calculations. Bootstrapped standard errors are reported in parentheses.
, **, and *** indicate estimate is statistically significant at the .10, .05, or .01 level.
Who Are the Affected Workers?
Table 5 presents a list of occupations with the largest and smallest increases in the probability of IPT attributable to the ACA. The list is restricted to occupations with at least 300,000 workers without a college degree in 2015. The table also lists the average 10th percentile wage and affected share by the ACA for each of the occupations.
Occupations Ranked by Change in Probability of Involuntary Part-Time (IPT) Work due to ACA
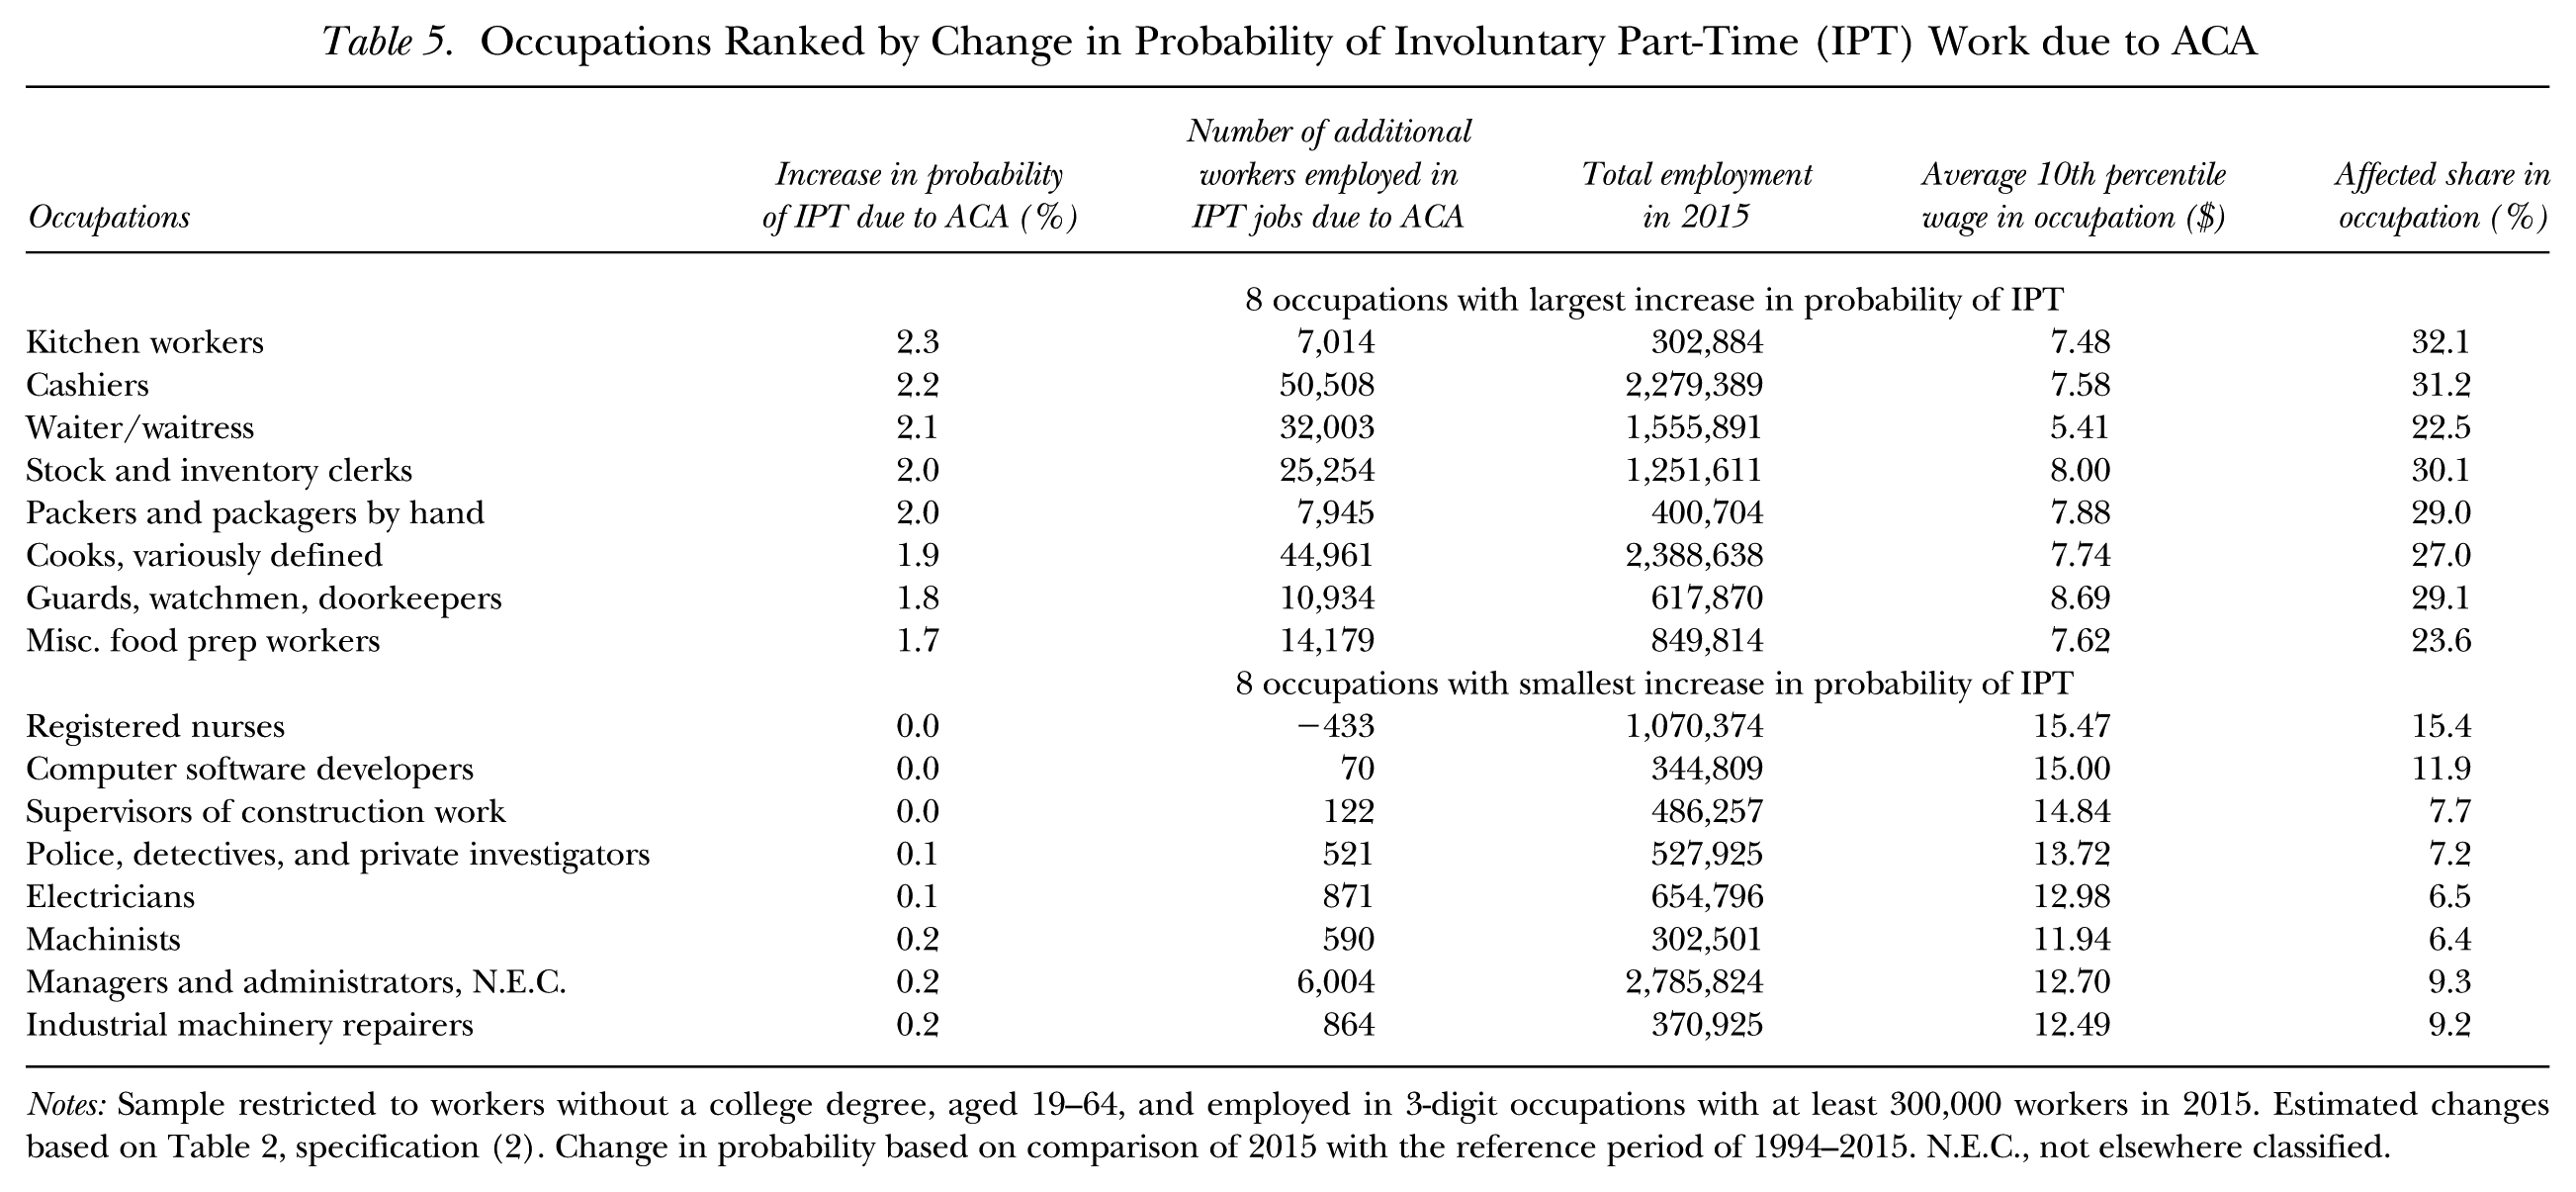
Notes: Sample restricted to workers without a college degree, aged 19–64, and employed in 3-digit occupations with at least 300,000 workers in 2015. Estimated changes based on Table 2, specification (2). Change in probability based on comparison of 2015 with the reference period of 1994–2015. N.E.C., not elsewhere classified.
The eight occupations with the largest increase in the probability of IPT are low-wage occupations with a relatively large share of workers affected by the mandate. The list includes cashiers, cooks, waiters and waitresses, and kitchen workers. All of these occupations have 10th percentile wages averaging less than $9 per hour.
On the other extreme, the eight occupations for which the ACA caused the smallest increase in the probability of IPT include relatively high-wage occupations (all have a 10th percentile of wages above $11 per hour) and for which the affected share is quite low. Occupations with small increases in IPT due to the ACA include registered nurses, police officers, electricians, and machinists. In separate analyses, we examined the change in the probability of IPT due to the ACA for each worker and found that women, racial minorities, and younger workers were more likely to be employed in occupations experiencing a shift to IPT work as a result of the ACA.
Summary and Conclusions
Starting in 2015, the Affordable Care Act imposed penalties on large-scale employers that do not provide affordable health insurance to their full-time employees. This study investigates whether employers shifted from full-time to part-time workers to avoid these penalties. Our estimation of models of part-time employment that control for changing economic conditions, worker characteristics, and occupational and industrial composition suggest that IPT employment between 2013 and 2015 was higher than predicted based on a reference period of 1994 to 2015. More important, we find that the increase in IPT employment over the past few years was greatest in the occupations that employed the largest percentage of workers affected by the mandate—those employed at large firms and who did not have health insurance coverage from their employer. This result persists after we control for the state of the economy, the demographics of workers, and control for other factors (such as technological change) that might contribute to elevated levels of IPT work. We believe our study provides strong evidence that the ACA penalties have caused a shift to IPT employment.
The empirical analysis indicates that the ACA employer mandate had a quantitatively important impact on IPT employment. Our estimates suggest that approximately 700,000 workers without a college degree are engaged in IPT employment because of the ACA and that nearly one-third of IPT employment in 2015 was attributable to the ACA mandate. These estimated effects are relatively large as a share of IPT employment, but they are modest in comparison to the findings of Dillender et al. (2016b).
Although we find that the ACA elevated IPT employment in the first two years of the mandate, it is conceivable these effects will gradually diminish as employers find other ways to adjust (e.g., outsource low-skill work to small firms) and IPT workers gradually relocate to firms in which they can obtain full-time jobs.
Overall, we believe our study presents strong evidence that the ACA employer mandate is at least partially responsible for the elevated levels of IPT work since 2013. Though it is conceivable that other structural changes can explain differential growth in IPT employment across occupations, we are unaware of any such structural change that would have grown in importance in the occupations in which the ACA is most likely to be binding.
Footnotes
Acknowledgements
We thank William Boal, Barry Hirsch, Julie Hotchkiss, Robert Kaestner, Victor Matheson, Melinda Pitts, Austin Smith, Aaron Yelowitz, and seminar participants at the Federal Reserve Bank of Atlanta, University of Kentucky, and the University of Wisconsin at Milwaukee for helpful suggestions.
For information regarding the data and/or computer programs utilized for this study, please address correspondence to David Macpherson at
1
A seasonal worker exception exempts employers that average more than 50 full-time workers for 120 days or less during a year.
2
The safe harbors define affordability based on the worker’s wages reported on form W-2, the worker’s rate of pay at the beginning of the period, or the federal poverty line for a single individual in the relevant calendar year.
4
5
6
See, for example, Myers and Mears (2013); McVeigh (2013); and the Economist (![]() ).
).
8
BLS tabulations of part-time work are based on a workweek of less than 35 hours whereas we use a cutoff of 30 hours since that is the relevant cutoff for the ACA employer mandate. In 2014, reducing the cutoff for IPT employment from 35 to 30 hours per week reduces the number of IPT workers by approximately one-third.
9
10
To match the share affected from the 2003 to 2007 March CPS to the 1994 to 2015 monthly CPS data, all 3-digit occupation codes were cross-walked into 1990 3-digit occupation codes using crosswalks available from Flood, King, Ruggles, and Warren (2015). Census occupations (from 1990) with fewer than 500 observations in the 1994 to 2015 sample for each of the two education groups were collapsed into the largest 3-digit occupation within its detailed occupation. This adjustment affected less than 0.5% of workers in the sample.
11
Since the March CPS survey asks about coverage in the prior year, the 2003 to 2007 March CPS reports health insurance coverage for the 2002 to 2006 period.
12
We exclude observations with imputed industry, firm size, occupation, weekly hours, employer health insurance coverage, class of worker, weeks worked, or age. The weights are adjusted to account for deletions using the approach outlined in ![]() . A worker who has health insurance coverage that is not provided by his or her employer is not counted as covered by our definition.
. A worker who has health insurance coverage that is not provided by his or her employer is not counted as covered by our definition.
13
The aggregation issue is also discussed by Moulton (1990) and Bertrand, Duflo, and Mullainathan (2004).
14
The models include controls for 22 industries. The personal characteristics include state of residence; five age dummies; three race dummies; sex; marital status; and sex interacted with marital status and number of children.
15
The state-specific estimate of the minimum wage to the 25th percentile wage ratio (estimated by education group) and the teen share of the labor force are measured annually. All of the other controls for economic conditions are measured monthly and are matched to individual observations based on the CPS survey month and year. The coincident economic indicators are from the Federal Reserve Bank of Philadelphia.
16
F-tests for equality of regression coefficients across occupations reject the null at the .01 significance level.
17
Although our model could, in theory, be estimated in a single reduced-form regression model by substituting Equation (2) for ![]() and including interactions between the occupation dummies and the controls for economic conditions and personal characteristics, the required number of interaction terms makes this approach impractical given computing constraints. For example, since 269 occupations make up the low-education group, allowing the effect of our controls for economic conditions and personal characteristics to vary by occupation alone would require more than 10,000 interaction terms in a sample with 10 million worker-level observations.
and including interactions between the occupation dummies and the controls for economic conditions and personal characteristics, the required number of interaction terms makes this approach impractical given computing constraints. For example, since 269 occupations make up the low-education group, allowing the effect of our controls for economic conditions and personal characteristics to vary by occupation alone would require more than 10,000 interaction terms in a sample with 10 million worker-level observations.
18
The sample size of 5,918 for the low-education group is the product of 22 years × 269 occupations, and the sample size of 3,982 for the high-education group is the product of 22 years × 181 occupations.
19
In bootstrapping the second-step estimates, we randomly draw (with replacement) from within each occupation in the March CPS to estimate the share affected and randomly draw (with replacement) entire clusters of occupations from the monthly CPS data to provide bootstrap estimates of the second-step regression. This process generates variation in the share affected by occupation and corrects for potential clustering of residuals by occupation (see ![]() ).
).
20
The sums of
21
This comparison is based on the derivative of the probability of IPT employment with respect to percentage affected implied by ![]() , specification (1). In 2015, this derivative is 0.046–1.016*wage10/100. Recall that the occupation-specific wage measure is measured as a deviation from means in the regression so that wage10/100 is +.05 (–.05) in the high- and low-wage occupations, respectively. Similar results are obtained when the 25th percentile wage is used in place of the 10th percentile, but wage10 has a slightly higher level of significance.
, specification (1). In 2015, this derivative is 0.046–1.016*wage10/100. Recall that the occupation-specific wage measure is measured as a deviation from means in the regression so that wage10/100 is +.05 (–.05) in the high- and low-wage occupations, respectively. Similar results are obtained when the 25th percentile wage is used in place of the 10th percentile, but wage10 has a slightly higher level of significance.
22
An alternative approach is to use the 2015 level of employment rather than the actual level of employment in a given year. This method removes any effects of shifts in the occupation distribution of employment on IPT. This approach changes the results very little.