




Abstract
Using data from the Survey of Income and Program Participation, the author examines the effect of noncompete enforceability on employee training and wages. An increase from no enforcement of noncompetes to mean enforceability is associated with a 14% increase in training, which tends to be firm-sponsored and designed to upgrade or teach new skills. In contrast to theoretical expectations, the results show no evidence of a relationship between noncompete enforceability and self-sponsored training. Despite the increases in training, an increase from non-enforcement of noncompetes to mean enforceability is associated with a 4% decrease in hourly wages. Consistent with reduced bargaining power, noncompete enforceability is associated with a reduction in the return to tenure, and less-educated workers experience additional wage losses in the face of increased enforceability relative to more-educated workers. Suggestive evidence indicates that policies that tie the enforceability of noncompetes to the worker receiving additional consideration in exchange for signing a noncompete are associated with higher wages.
Recent White House and US Treasury reports link the decline in economic dynamism (Decker, Haltiwanger, Jarmin, and Miranda 2014), post-recession wage stagnation (Furman 2016; Krueger 2017), and underinvestment in training to a previously little known feature of employment contracts: covenants not to compete (noncompetes), which prohibit employees from joining or starting a competing firm upon departure (US Treasury 2016; US White House 2016). Recent estimates suggest that nearly 40% of US labor force participants have signed a noncompete at some point in their careers (Starr, Prescott, and Bishara 2019). By increasing moving costs to competitors, enforceable noncompetes shield the firm from competitor-based wage competition and subsequently provide incentives for the firm to invest in employee human capital. While extant research has found a negative relationship between noncompete enforceability and mobility, 1 and many have theorized about the relationship between noncompetes and human capital investment, 2 little work has empirically examined the extent to which noncompete enforceability encourages human capital investment, whether the returns to such investments accrue to the employee, and which components of noncompete enforceability drive these relationships. Notable exceptions include Garmaise (2009), which examined mobility and earnings of executives but did not examine the human capital investment mechanism directly. In this study I examine these gaps in our understanding directly.
Theoretical models typically posit an ambiguous relationship between enforceable noncompetes and net human capital investment since noncompetes reduce the return to self-sponsored investment but increase the returns to firm-sponsored investment (Garmaise 2009; Ghosh and Shankar 2016). Such models also typically predict that noncompetes will raise worker welfare (e.g., wages), because the choice to enter into a noncompete is voluntary and subject to negotiation (Rubin and Shedd 1981; Callahan 1985). Historical accounts, however, suggest that noncompetes were not even mandatory subjects of bargaining for unions (NLRB 1992), and recent evidence shows that employees rarely negotiate over noncompetes, are frequently asked to sign after they have accepted the job, and do not typically have another employment opportunity when they are asked to sign (see Starr et al. 2019 regarding implementation and negotiation over noncompetes). Recognizing the potential for workers to find themselves unwittingly bound by a noncompete, 3 some states have passed “consideration” laws, which tie the enforceability of the noncompete to the employer providing higher wages, a bona fide promotion, early notification of the contract, or some other form of consideration (e.g., a bonus or training). Such consideration policies reduce the circumstances under which a noncompete is enforceable by conditioning enforceability on the provision of some sort of compensation in exchange for signing.
In this article, I empirically examine the relationship between noncompete enforceability, training, and wages, focusing both on who pays for training and whether consideration policies exhibit any differential effects. To develop these measures of noncompete enforceability, I use factor analysis to weigh two “consideration” dimensions and five “non-consideration” dimensions of noncompete enforceability quantified by Bishara (2011). With these new indices, I employ a pseudo-difference-in-differences identification strategy that exploits cross-sectional variation in the enforceability of covenants not to compete and occupational differences in the propensity to sign a noncompete. 4
Results suggest that the incidence of training is 14% higher in an average enforceability state relative to a non-enforcing state. The positive relationship between enforceability and training is strongest when the training content is meant to upgrade skills and when it is firm-sponsored. In contrast to the theoretical expectations from the existing literature (Garmaise 2009; Lobel and Amir 2013), I find no evidence of a relationship between self-sponsored training and enforceability. Despite the increase in training, average hourly wages are lower in higher enforceability states: An increase from non-enforcement to mean enforceability is associated with a 4% decrease in wages. This wage effect is driven primarily by the finding that in high enforceability states individuals are less likely to appear in the right half of the wage distribution. Furthermore, consistent with the notion that noncompete enforceability reduces employee bargaining power, I find that noncompete enforceability reduces the return to tenure within high-use occupations, and that those without advanced degrees are relatively worse off in higher enforceability states.
Disaggregating enforceability into separate consideration-specific and non-consideration indices reveals that estimates from the aggregate index mask substantial differential effects. In particular, the negative wage estimates are driven by state policies that do not require any additional consideration in exchange for offering a noncompete, while the positive training effects are driven by the non-consideration dimensions of enforceability. Since consideration policies are typically a transfer to the worker, these findings are consistent with a model in which consideration laws transfer part of the surplus to the worker but do not affect the marginal benefit or cost of training.
These results are robust to a variety of measures of noncompete enforceability, various measures of noncompete exposure, and to the inclusion of a variety of potentially confounding variables. Diagnostic tests suggest that selection on unobservables must be quite strong to overturn the results.
This body of results contributes to a number of related literatures. In the literature on noncompetes, a growing ambivalence toward the enforcement of these contracts is a result of recent evidence showing it dampens mobility, entrepreneurship, and innovation. 5 Few studies, however, have empirically examined to what extent firms and workers actually benefit from the protection offered by enforceability, and no studies, to my knowledge, have examined the differential effect of individual noncompete policies. 6 Indeed, proponents of noncompetes argue that their voluntary nature implies that workers would exhibit reduced mobility and entrepreneurship, but that they would nevertheless be better off as a result, either through training, increased wages, or some other benefit. I find that firms in higher enforceability states do provide more training to their workers but that the workers do not experience the returns to such training; rather, they experience wage losses.
While the wage findings echo the results in Garmaise (2009), I find no evidence for his proposed mechanism—reduced self-sponsored investment. The results here align with a more monopsonistic view of the labor market (Manning 2003), whereby the enforceability of noncompetes reduces the elasticity of labor supply and puts downward pressure on wages. Nevertheless, for policymakers concerned about the distribution of the surplus, this article offers suggestive evidence that the adoption of consideration policies improves wages for the average worker without dampening the incentives to invest in training.
These results also contribute to our understanding of the role of labor market frictions generally, 7 and within-industry mobility frictions specifically, 8 in determining training and wage patterns. These results suggest that within-industry frictions can indeed incentivize investment, but that such frictions may also prevent workers from receiving the returns to such investments. The results also point to a relationship between the legal environment and heterogeneity in management practices, with subsequent implications for productivity and performance differentials (Shaw 2004; Bloom and Reenen 2011; Younge, Tong, and Fleming 2014; Younge and Marx 2016).
Theory and Assumptions
The contribution of the present study is primarily empirical, but a significant body of theoretical work describes the relationship between the enforceability of noncompetes, training, and mobility. Building from Becker (1962), the initial work by Rubin and Shedd (1981) argued that, in perfectly competitive labor markets, an employee moves to her most productive job, pays for all general training, shares in the quasi-rents of specific training, and never leaves; as a result, there is no need for a noncompete. However, if employees are liquidity-constrained such that they will be unable to pay for the value of any training or sensitive information that is shared with them, then enforceable noncompetes solve a hold-up problem by preventing the employee from appropriating the value of investments for which she did not pay, thus providing the proper incentives for firms to invest in training or the creation of information in the first place (Posner et al. 2004).
Subsequent theoretical work has examined the relationship between noncompetes and various types of training. Meccheri (2009) extended the negotiation framework of MacLeod and Malcomson (1993) to examine the firm’s incentive to invest in general versus firm-specific training. He argued that noncompetes increase the return to general investments relative to firm-specific investments because the noncompete improves the firm’s bargaining power over surplus sharing for general investments, but not firm-specific investments. Meccheri (2009) linked these findings to Acemoglu and Pischke (1999) by suggesting that noncompetes create a wedge between the internal and external wage structure, resulting in wage compression that incentivizes the firm to provide general training.
Other recent work highlights the contrasting incentives of firms and individuals to invest in human capital as a result of noncompetes (Lobel and Amir 2013; Ghosh and Shankar 2016). Such studies note that while noncompetes increase the incentives of the firm to invest in employee human capital, individuals have less incentive to invest in themselves since they cannot capture the returns in the external market. For example, though he does not explicitly analyze any training data, Garmaise (2009) argued that executives earn less in higher enforceability states because they invest less in themselves.
In general, these theories have two significant shortcomings. First, until recently, none of the assumptions underlying these models have been tested. That is, most models assume fully informed, rational agents who will enter into a noncompete agreement only if they will be better off in expectation. Recent evidence suggests that this may not always be the case because of incomplete information, lack of alternative options, and a lack of negotiation. Starr et al. (2019) found that approximately one-third of workers do not even know if they are bound by a noncompete, that less than 10% of noncompete signers actually negotiate over their noncompete, 9 that approximately one-third of the time the noncompete is requested after the employee has already agreed to the terms of the job, and that only 30% of employees have another offer at the time they are asked to sign. In perhaps the most surprising case, noncompetes have only recently become mandatory subjects of union bargaining: A 1992 National Labor Relations Board (NLRB) memo argued that a covenant not to compete was a nonmandatory subject of negotiation because it did “not have material or significant effect on terms and conditions of employment because it became operable only after employee voluntarily or involuntarily left employment with employer” (NLRB 1992;Gurrieri 2016). Last, Marx (2011) found that more than 90% of electronics engineers agreed to sign noncompetes when asked. Taken together, these statistics cast doubt on the fully informed bargaining models in the literature. They suggest that the reality of the labor market contains many more frictions and perhaps behavioral biases than were previously envisioned, perhaps lining up more accurately with models of monopsony power (Manning 2011) than of contracting. Regardless, the available evidence suggests that for many workers a noncompete is a take-it-or-leave-it proposition, for which they may or may not be compensated.
Some states have been concerned that workers may not be compensated for giving up their right to work, opting to enforce noncompetes only when some degree of consideration has been provided (Malsberger et al. 2012). Indeed, even the recent US Treasury report on noncompetes suggested that states “require that firms provide ‘consideration’ to workers bound by non-compete contracts in exchange for both signing and abiding by non-competes” (2016: 5). To the best of my knowledge, however, no theoretical or empirical work examines the potential differential effects of such consideration policies.
The second shortcoming is that none of the theoretical predictions regarding the relationship between noncompete enforceability and training have been tested empirically, as far as I am aware. In the following sections, I seek to examine empirically the relationship between noncompete enforceability, training, and wages. In particular, I focus on whether enforceability is associated with firm- or self-sponsored training, and, given the limited observed negotiation in other studies, I also focus on the potential for state laws tying the enforceability of the noncompete to the receipt of additional consideration to have a differential effect on training and wages.
Empirical Approach
Quantifying Noncompete Enforceability
While noncompetes are virtually unenforceable in California and North Dakota, most states will enforce them by implementing their own versions of the “reasonableness doctrine,” which balances the protection necessary for the firm with the injury to the worker and society (see Blake 1960 for an in-depth review of the history of noncompete enforceability). Among enforcing states, agreement is unanimous that a necessary condition for the enforceability of a noncompete is that the worker possesses some kind of valuable information in which the firm has made a significant investment and which it seeks to protect, such as trade secrets, client lists, or other confidential information. 10
Even after courts identify whether the worker possesses a legitimate business interest, significant variation remains in how states perceive reasonableness or respond to the unreasonableness of various other dimensions of a case. For example, some states will enforce a worker’s noncompete only if the worker voluntarily quits, whereas others will enforce it even if the worker is fired. State courts also vary in the manner in which they handle unreasonably overbroad covenants. Most states will rewrite overbroad noncompetes to be more reasonable and subsequently enforce them. Wisconsin, which uses the so-called red-pencil doctrine, will throw out the entire contract if it is deemed overbroad along any dimension. States also have a variety of enforceability protocols for whether continued employment is sufficient consideration for the enforcement of the noncompete: In Oregon, for example, firms have to notify prospective employees that they will be asked to sign a noncompete two weeks before employment commences. If the firms do not notify the worker in advance, the firm must provide the worker with a bona fide advancement within the firm in order for the noncompete to be enforceable. Malsberger et al. (2012) tracked these and other dimensions of enforceability in his volumes Covenants Not to Compete: A State-by-State Survey.
Three attempts have been made to quantify the enforceability of noncompetes (Stuart and Sorenson 2003; Garmaise 2009; Bishara 2011), but they have done so in a rather ad hoc way without explicitly stating the object being measured. One natural metric would capture the probability that a randomly chosen employee’s noncompete would be enforced in court if the employee left for a competitor and his parent firm sued. To capture this probability, one would have to know 1) under what situations a state would enforce a noncompete, and 2) how frequently those circumstances occur in the noncompete-signing population. All existing indices capture the former in various ways, but ignore the latter. Stuart and Sorenson (2003) took the simplest approach by creating a simple enforceability dummy. The Garmaise (2009) index measured 12 dimensions of enforceability with a binary score and added the scores for each state, assuming that each dimension has equal weight. Bishara (2011) assigned each state a score between 0 and 10 on seven dimensions of noncompete enforceability for 2009 and 1991 and aggregated the individual dimensions using subjectively chosen weights (see a complete explanation of the Bishara scoring method in Online Appendix B). I improve upon Bishara’s weighting scheme by using confirmatory factor analysis on his seven scores to generate weights for each dimension, which may better approximate the underlying importance of the various dimensions of enforceability. 11 Because of the highly correlated nature of the individual dimensions of enforceability, however, all weighting schemes that give non-negative weights to each dimension result in highly correlated aggregate indices. Factor analysis as a reweighting tool is therefore a modest improvement.
Factor analysis postulates that each dimension of noncompete enforceability depends linearly upon latent enforceability. Defining xis as observed enforceability dimension i for state s and Enforceabilitys as latent enforceability, the model is defined by the set of equations

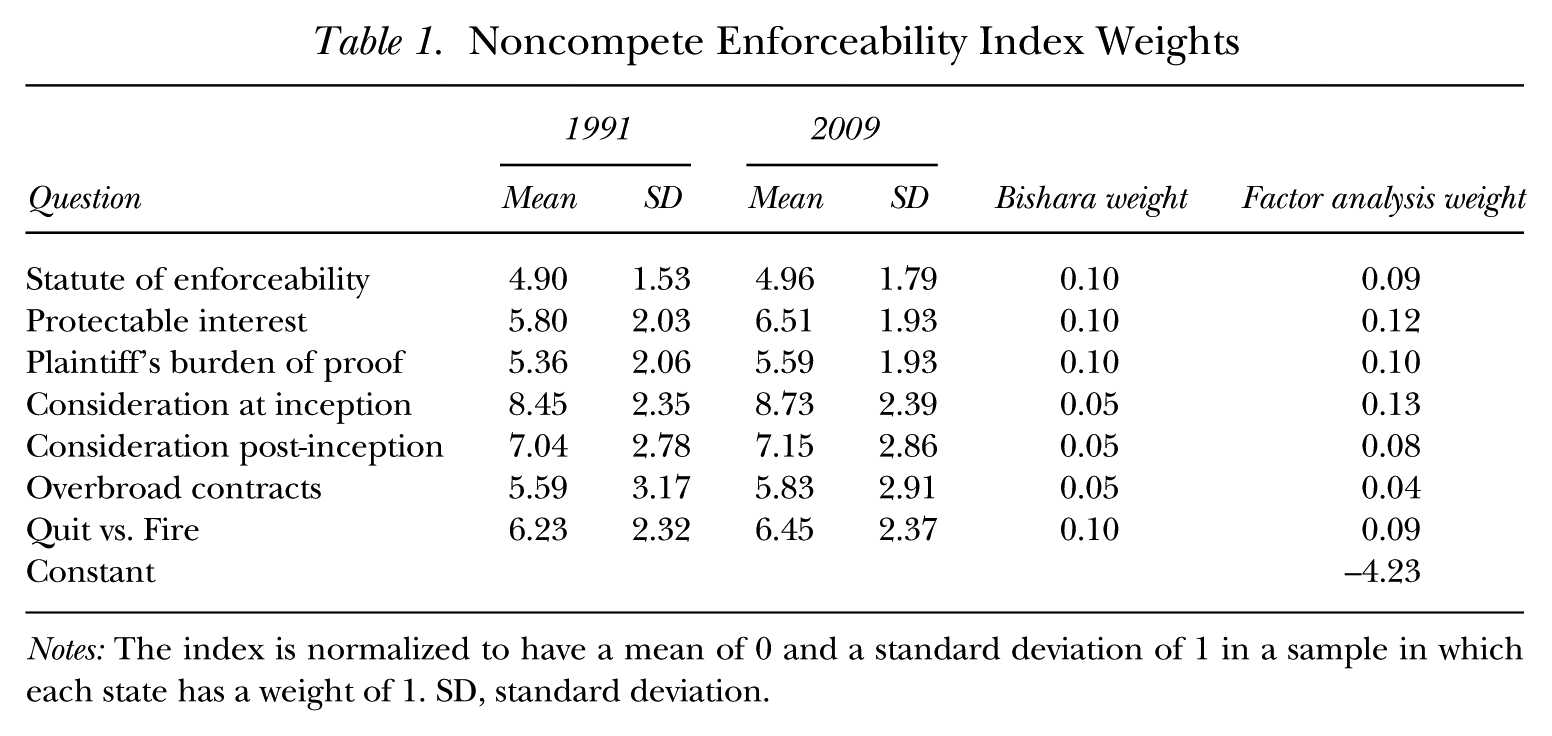
where ε is is random noise. 12 Under the normalization that λ 1 = 1, the correlation matrix of the observed enforceability dimensions identifies the other λ i terms because corr(xis, xjs) = λ i λj. Given estimates of the λ i terms, one can back out an estimate of the enforceability index. Regressing this estimate of the enforceability index on the dimensions of enforceability gives the weights. The enforceability index is normalized to have a mean of 0 and a standard deviation of 1 in a sample in which each state is given equal weight. Table 1 reports the mean, standard deviation, and weight of each dimension of enforceability for 1991 and 2009 from Bishara (2011) and the resulting weights from the factor analysis.
Noncompete Enforceability Index Weights
Notes: The index is normalized to have a mean of 0 and a standard deviation of 1 in a sample in which each state has a weight of 1. SD, standard deviation.
The factor analysis–generated weights correspond surprisingly well with Bishara’s subjectively chosen weights, putting slightly more weight on the extent of protectable interests within the state, and on consideration at the inception and after the inception of employment. Table B.1 in Online Appendix B shows the exact scores for each state. California and North Dakota have the lowest scores and Florida and Connecticut have the highest. Overall, the variation across states is large, whereas the index shows very little variation over time: The correlation between the enforceability scores in 1991 and 2009 is 0.94, which reflects the fact that, despite the recent legislative interest in noncompetes (US Treasury 2016), few states changed their policies between 1991 and 2009. Enforceability is not correlated with a state’s political leanings (Lavetti, Simon, and White, forthcoming) and does not appear to be clustered geographically (see the Figure B.1 map in Online Appendix B).
Data
The data for this study come from the topical module from Wave 2 of the Survey of Income and Program Participation (SIPP) panels from 1996, 2001, 2004, and 2008. 13 The SIPP is a longitudinal survey run by the Census Bureau that interviews respondents once every four months for three or four years. As the training questions are asked once per individual, in Wave 2, I pool all of the cross sections together to gain power. The SIPP tracks up to two occupations for each individual; to assure that I analyze the occupation in which the training actually occurred, I restrict the sample to workers who hold only one job. I also drop workers younger than 22 and older than 55, as well as workers with jobs in the nonprofit sector, government, community service, education, military, and protective services. There remain 70,374 individuals in the sample. 14
The SIPP contains training data reflecting answers to the following question: “During the past year, has [the respondent] received any kind of training intended to improve skill in one’s current or most recent job?” For the 21% of individuals who respond “yes” to this question, the SIPP asks follow-up questions on the number of such training events in the past year, as well as questions about the most recent training event including where it occurred, what the training covered, and who paid for it. 15 Table 3 (see below) shows descriptive statistics for these training variables among the population of individuals who report receiving training. The data do not directly contain information on whether training is general or firm-specific. Given that most training is meant to upgrade existing skills, teach basic skills, or teach new skills, this suggests that the training is general in nature.
Identification Strategy
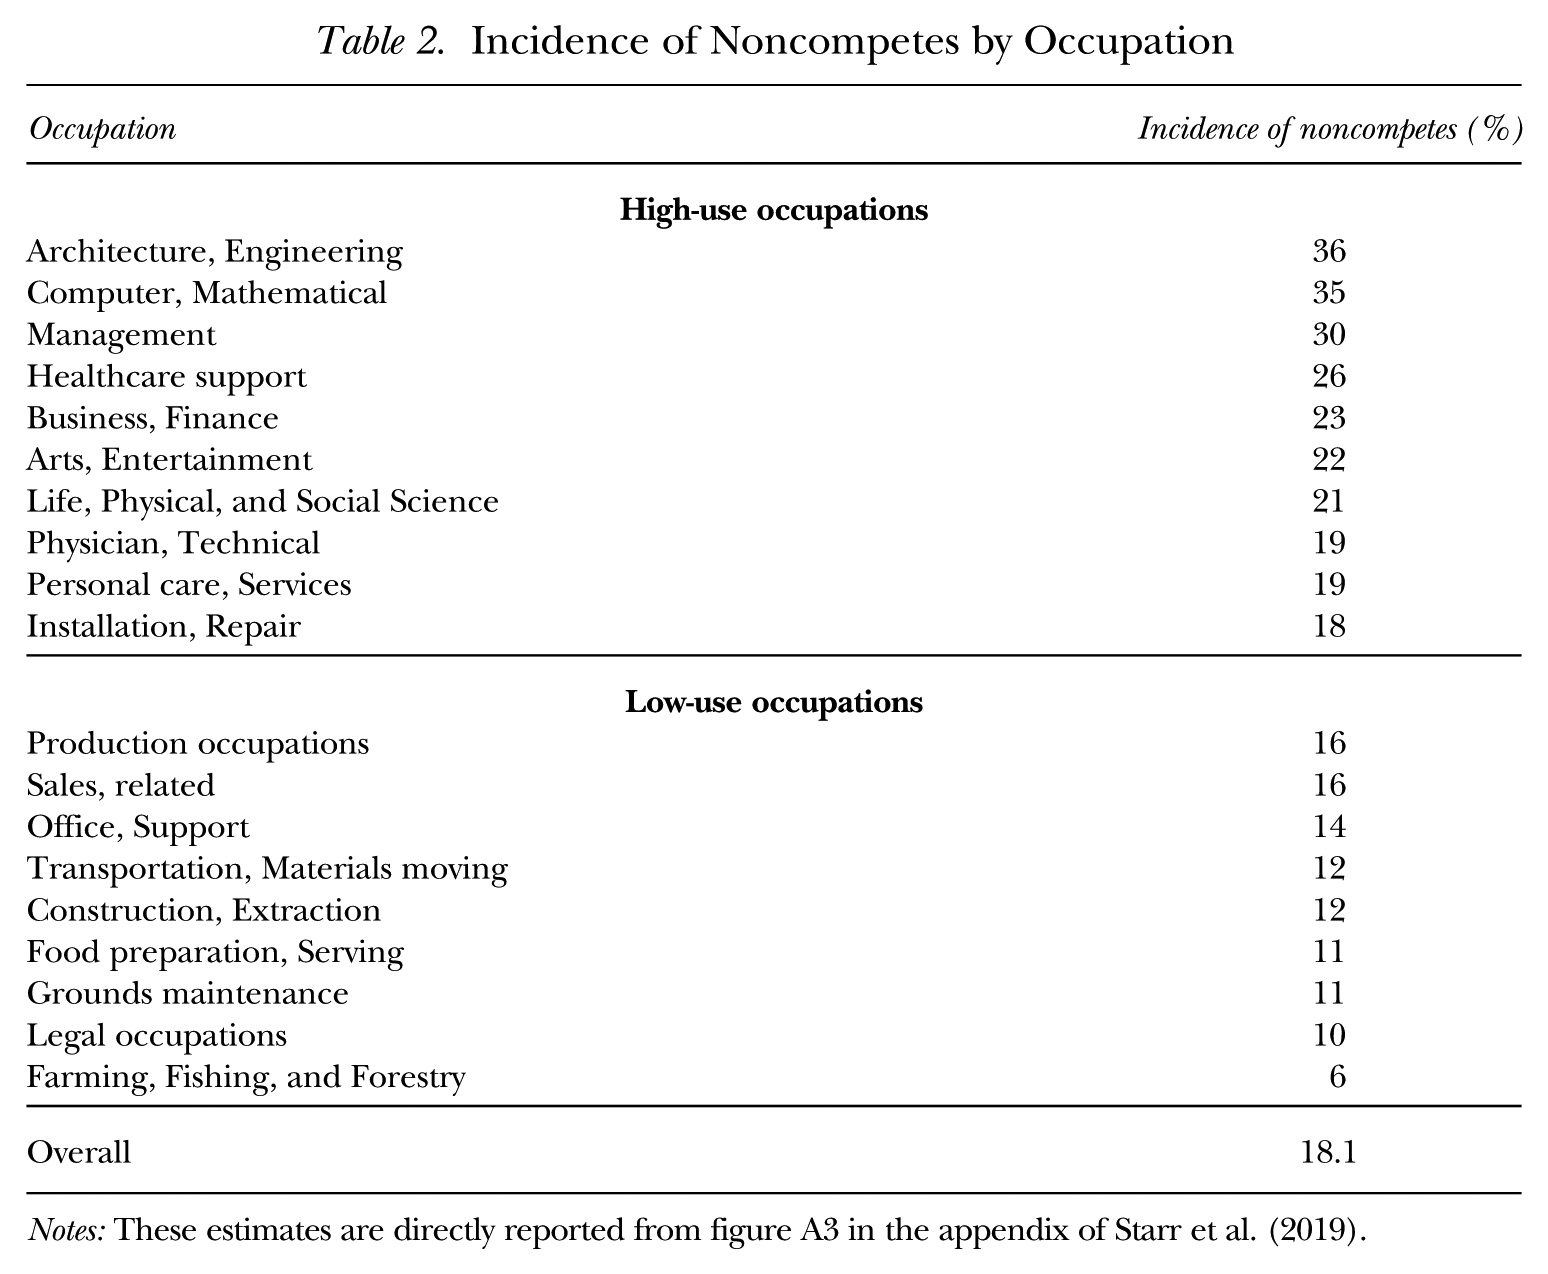
To isolate the cross-sectional heterogeneity in noncompete enforceability from other state-level factors, I compare how the within-state-year differences between occupations where noncompetes are used frequently and where noncompetes are used infrequently change as noncompete enforceability increases. The low-use occupations thus act as a pseudo-control group, unaffected, or at least less affected, by noncompete enforceability because they sign noncompetes less frequently. Using the reported incidence of noncompetes from Starr et al. (2019) across occupations, as reported in Table 2, I divide occupations into high-use and low-use based on whether the occupation has an incidence of noncompetes greater than the national average of 18.1%. The data underlying these estimates are from a nationally representative survey of more than 11,500 US labor force participants. (Details are described in Prescott, Bishara, and Starr 2016.)
Incidence of Noncompetes by Occupation
Notes: These estimates are directly reported from figure A3 in the appendix of Starr et al. (2019).
Table 3 presents summary statistics for key variables by noncompete-use status. Workers in high-noncompete-use occupations are very different from those in low-use occupations. High-use occupations experience 14 percentage points more training than do low-use occupations. They are also more likely to have bachelor’s and graduate degrees, more likely to be white, less likely to be unionized, have longer tenures, and earn $11 more per hour.
Summary Statistics

Notes: Overall noncompete enforceability and the “Consideration” and “Non-consideration” variables use the weights developed in Table 1 and the scores from Bishara (2011) (two consideration dimensions for “Consideration” and five remaining dimensions for “Non-consideration.” The consideration measure is reverse coded such that higher scores reflect the adoption of additional consideration (which would be associated with reduced enforceability). Each measure is normalized to be mean 0, standard deviation (SD) of 1 in a sample in which each state is given equal weight.
With this pseudo-difference-in-differences strategy, the simplest empirical specification would include noncompete enforceability, a high-noncompete-use occupation dummy, and their interaction. To increase the precision of the model, the main specification subsumes the high-use dummy with occupation-by-industry-by-year dummies, and state-by-year fixed effects subsume the main effect of enforceability. The state-by-year fixed effects account for all time-varying state-level variables, and the occupation-by-industry-by-year dummies ensure that the effect of noncompete enforceability is identified by comparing individuals in the same jobs in the same year. The full specification is:

In Equation (2), Yiojst refers to wage, training, and mobility measures for worker i in occupation o, industry j, state s, in year t. State-by-year fixed effects are represented by θ s,t and occupation-by-industry-by-year fixed effects are given by Ω o,j,t . Individual controls are given by Xit, which include hours worked, a quadratic in age, and indicators for working in a metro area, bachelor’s degree, graduate degree, male, white, and whether the worker is unionized. High-use occupations are denoted High-Useo, and Enforceabilitys is noncompete enforceability level of state s in 1991. 16 The standard errors are clustered at the state level to account for state-level correlations in the disturbances (Moulton 1990; Bertrand, Duflo, and Mullainathan 2004). In Equation (2), the coefficient of interest is ß1, which captures how the within-state-year difference between high- and low-use occupations changes as noncompete enforceability increases. 17
As is common in this literature, whether a worker has signed a noncompete is not contained in the data (Stuart and Sorenson 2003; Garmaise 2009; Marx et al. 2009; Samila and Sorenson 2011). Thus, I cannot disentangle whether the observed effects are driven by those who are bound by noncompetes, by changes in the use of noncompetes, or by indirect effects on the market as a whole. While disentangling these effects is an important avenue for future research, this aggregate effect is the relevant parameter for state judiciaries and legislatures to consider since they choose the intensity of enforceability but cannot force firms to use noncompetes.
Results
Training Results
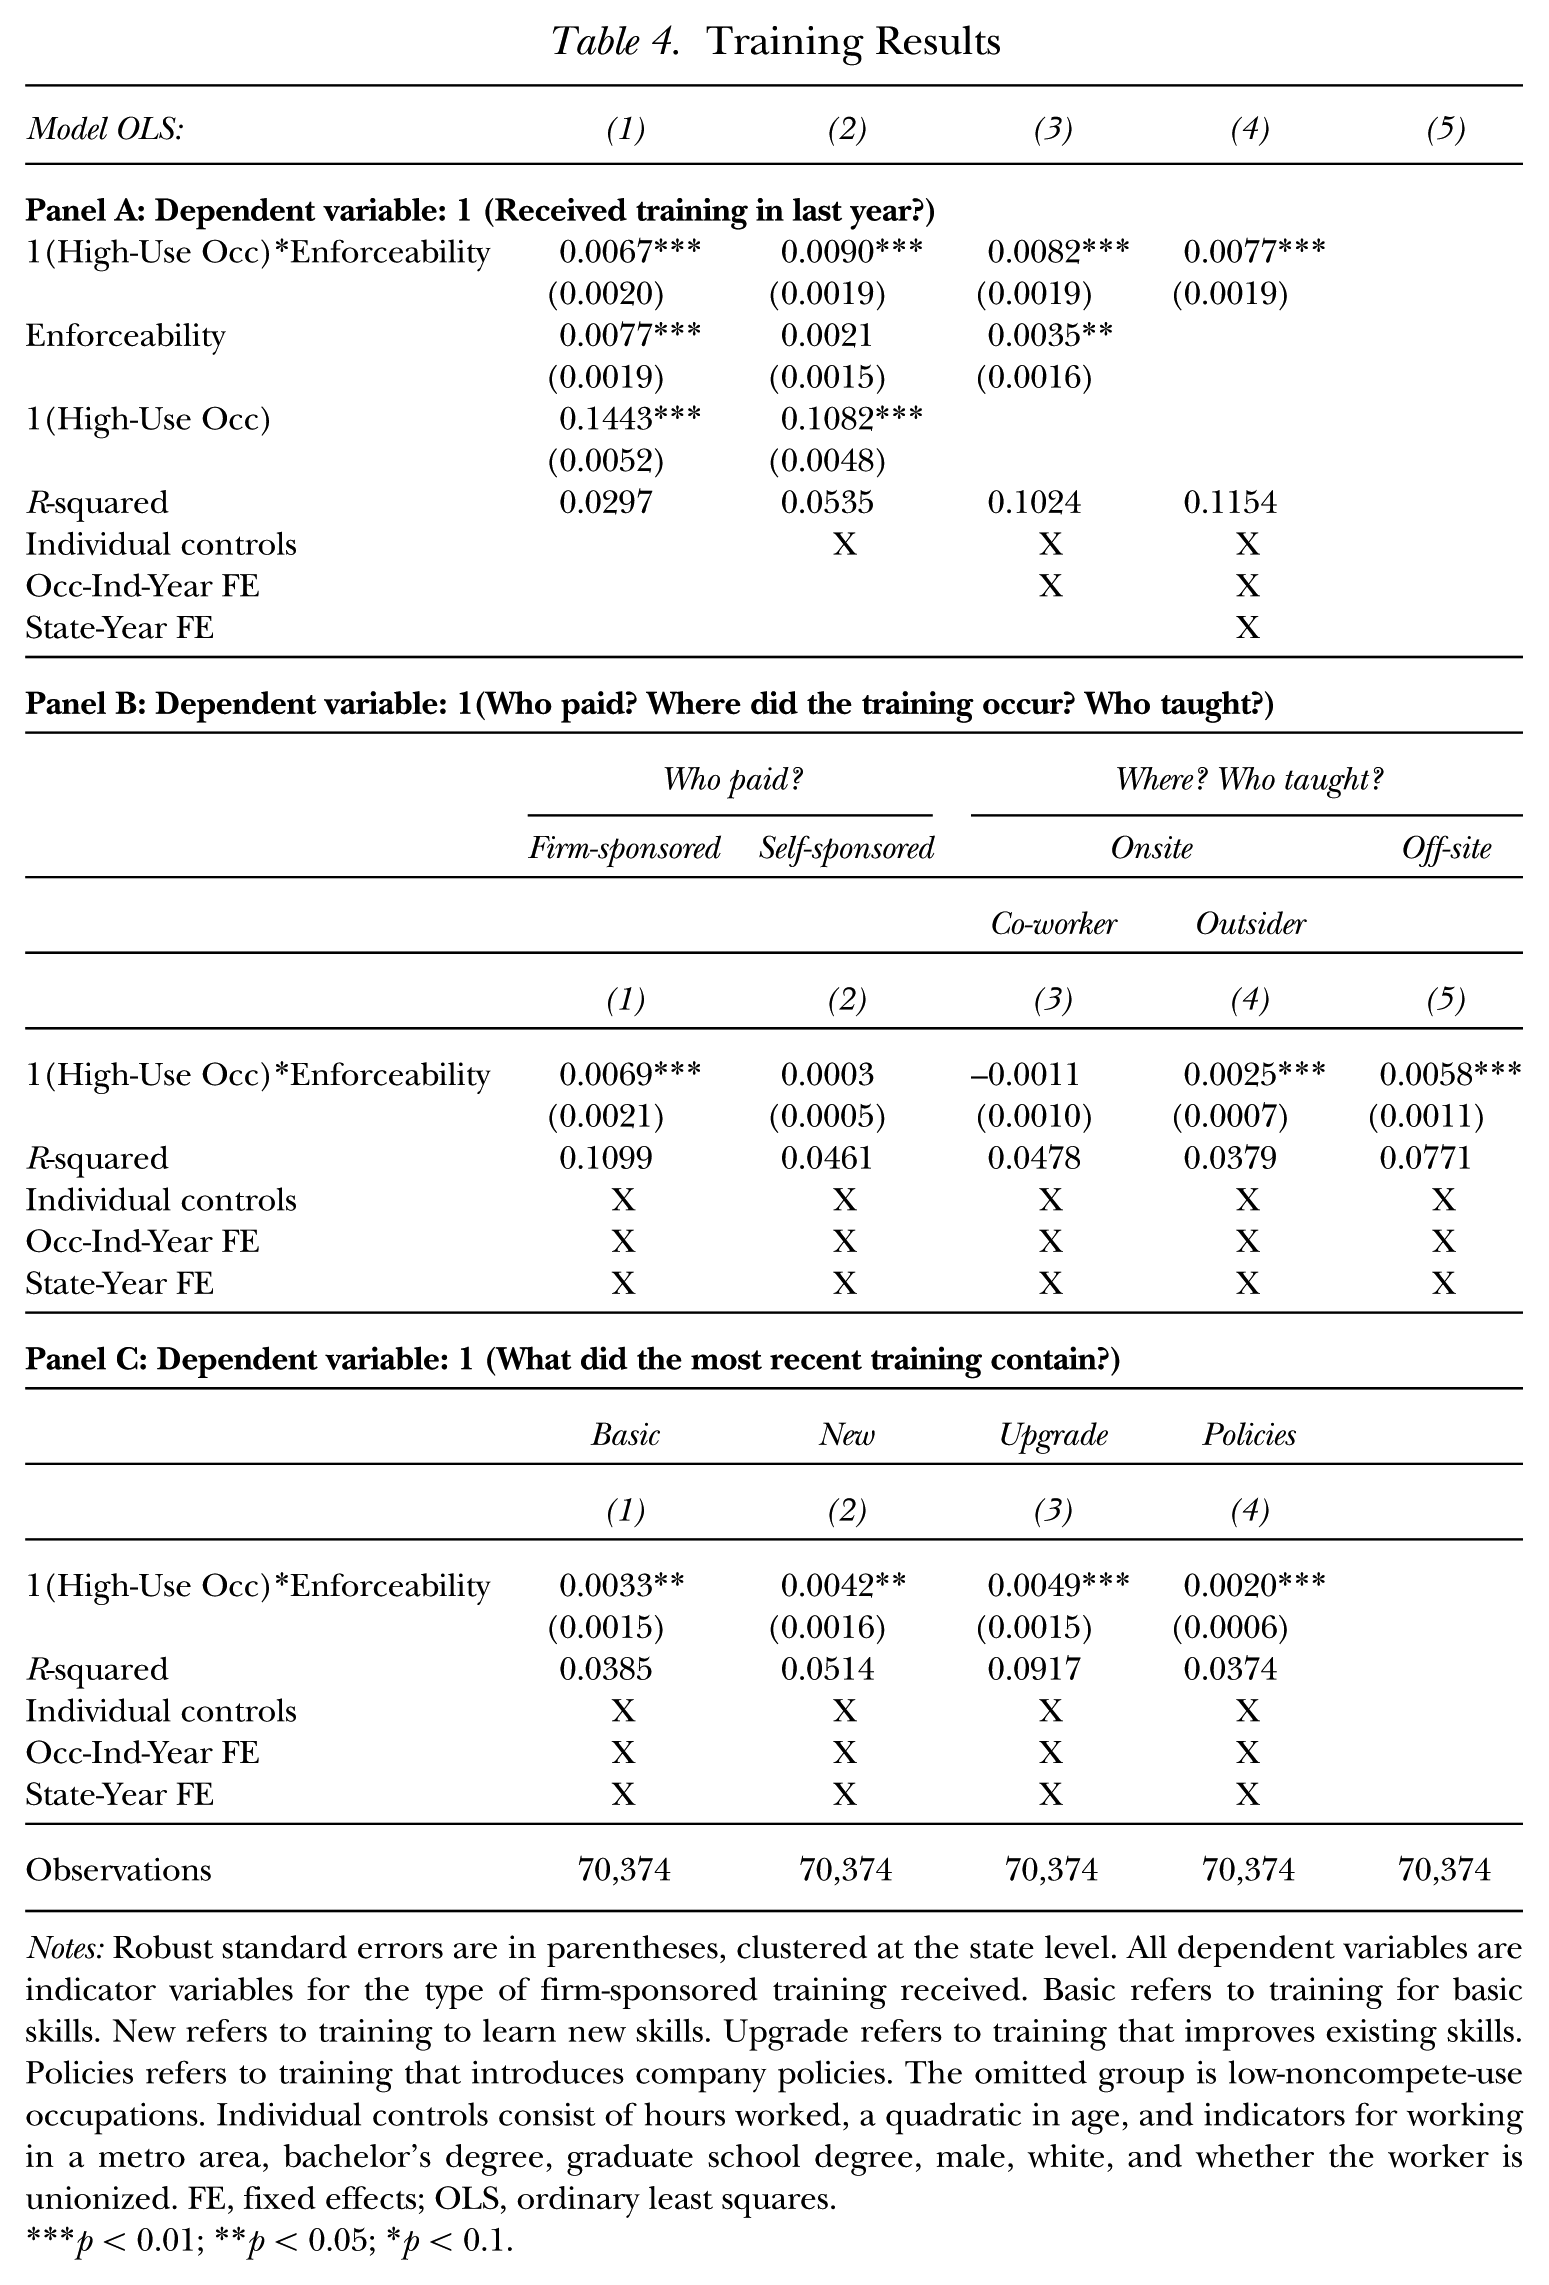
Table 4 reports the results from estimating Equation (2) with various training dependent variables. In panel A, the dependent variable is simply a dummy for reporting the receipt of training in the last year. Columns (1) to (4) show the breakdown of the effect of noncompete enforceability when adding individual controls, occupation-by-industry-by-year fixed effects, and state-by-year fixed effects. Column (1) of panel A shows that a 1 standard deviation increase in noncompete enforceability is associated with a 0.77 percentage point increase in the probability of receiving training for low-use occupations, and an additional 0.67 percentage point increase in the probability of receiving training for high-noncompete-use occupations. Including individual controls, occupation-by-industry-by-year fixed effects, and state-by-year fixed effects, the point estimate on the interaction of enforceability and high-use is 0.77 percentage points. To grasp the size of this coefficient, suppose that a non-enforcing state (score of roughly –4) adopted the enforceability policies of an average enforcing state (enforceability score of 0). These results suggest that such a change in policy would increase training by 3.08 percentage points (4 × 0.77), which is a 14.7% increase in training (3.08/21) relative to the mean likelihood of receiving training.
Training Results
Notes: Robust standard errors are in parentheses, clustered at the state level. All dependent variables are indicator variables for the type of firm-sponsored training received. Basic refers to training for basic skills. New refers to training to learn new skills. Upgrade refers to training that improves existing skills. Policies refers to training that introduces company policies. The omitted group is low-noncompete-use occupations. Individual controls consist of hours worked, a quadratic in age, and indicators for working in a metro area, bachelor’s degree, graduate school degree, male, white, and whether the worker is unionized. FE, fixed effects; OLS, ordinary least squares.
p < 0.01; **p < 0.05; *p < 0.1.
Figure 1 examines the likelihood of participating in multiple training events as a result of greater noncompete enforceability. In particular, the figure plots the coefficient on the interaction between noncompete enforceability and the high-use occupation indicator in a series of fully specified models (column (4) of Table 4) in which the dependent variable is an indicator for receiving at least one, two, three, . . . , ten training events in the past year. The figure shows that the association between noncompete enforceability and the likelihood of receiving at least a given number of training events is strongest for the first few training events and positive and statistically significant up until the sixth training event, after which the effects are still positive but statistically indistinguishable from 0.

Marginal Effect of Noncompete Enforceability on Participating in at Least 1, 2, . . . 10 Training Activities
Panel B of Table 4 examines who paid for the most recent training, where it occurred, and who performed it. In columns (1) and (2), the dependent variable is equal to 1 if the most recent training event was firm-sponsored (1) or self-sponsored (2), and 0 otherwise. The results show that the positive correlation between noncompete enforceability and training observed in panel A is driven almost entirely by firm-sponsored training. The relationship between noncompete enforceability and self-sponsored training is practically 0. In the second half of panel B, I perform a similar exercise in which the dependent variable is equal to 1 if the training is onsite and taught by a coworker (3), onsite but taught by an outsider (4), or off-site (5). Results show that the observed relationship between noncompete enforceability and training is primarily from training that is off-site (0.58 percentage points) or onsite but taught by an outsider (0.25 percentage points). Relative to simple on-the-job training taught by a coworker, these investments are likely to be more costly.
Table 4, panel C, considers the content of the most recent training. Training content is categorized into the following non-mutually exclusive categories: basic skills, new skills, upgrade existing skills, and company policies and routines. Table 3, panel E, presents summary statistics of these outcomes by high- and low-noncompete-use status: more than two-thirds of the training is upgrading skills, about half is teaching new skills, and one-third is teaching basic skills and introducing company policies, though there is substantial overlap in what the most recent training covers. Back to Table 4, panel C reports results from the main specification using indicators for content received as the dependent variable. Results show that noncompete enforceability is positively and statistically significantly associated with all types of training, though the largest effects are observed for upgrading skills (0.49 percentage points) and new skills (0.42 percentage points). Comparing across models, the upgrading skills and new skills results are statistically significantly greater than the company policies results, with p values of 0.03 and 0.09, respectively.
Taken together, the results provided here suggest a strong positive relationship between noncompete enforceability and the firm’s willingness to invest in multiple training events that tend to be off-site or outsider taught and that are primarily meant to upgrade skills and teach new skills. There is no evidence of a negative relationship between noncompete enforceability and self-sponsored training.
Mobility and Wages
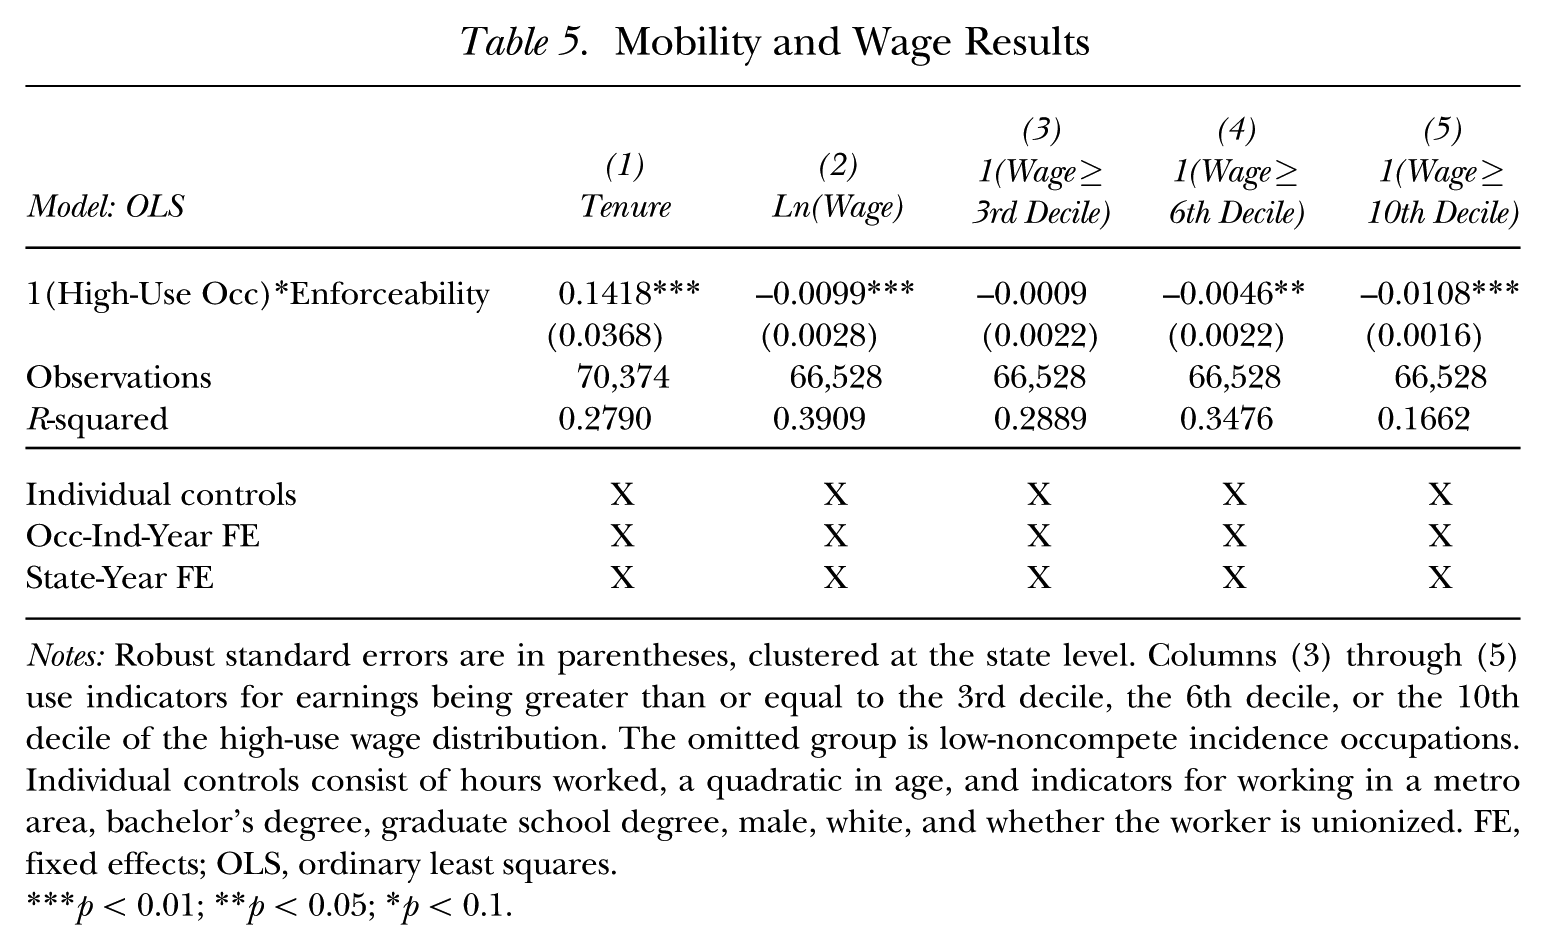
Next, I corroborate the findings of the prior literature that noncompete enforceability is associated with reduced employee mobility. Column (1) of Table 5 uses tenure (lack of prior mobility) of the respondent as the dependent variable in the fully specified model and shows that a 1 standard deviation increase in noncompete enforceability is associated with an increase in tenure of 0.14 years. If a non-enforcing state adopted mean enforceability policies, this estimate suggests that mean tenure would increase by 0.56 years.
Mobility and Wage Results
Notes: Robust standard errors are in parentheses, clustered at the state level. Columns (3) through (5) use indicators for earnings being greater than or equal to the 3rd decile, the 6th decile, or the 10th decile of the high-use wage distribution. The omitted group is low-noncompete incidence occupations. Individual controls consist of hours worked, a quadratic in age, and indicators for working in a metro area, bachelor’s degree, graduate school degree, male, white, and whether the worker is unionized. FE, fixed effects; OLS, ordinary least squares.
p < 0.01; **p < 0.05; *p < 0.1.
Because noncompete enforceability acts as a shield from competitors and because employees rarely negotiate over noncompetes, the observed positive relationship between noncompete enforceability and training may not lead to increased wages for the employee. 18 In Table 5, I re-estimate Equation (2) using as a dependent variable log hourly wages and a dummy variable for having earnings in at least the 3rd, 6th, and 10th deciles among the high-use wage distribution (the deciles are calculated within each survey year). Column (2) shows that, on average, a 1 standard deviation increase in noncompete enforceability is associated with a roughly 1% decrease in hourly wages. If a non-enforcing state adopted the mean level of enforceability, a causal interpretation of this estimate suggests that wages would fall by 4%.
Looking at the effect of noncompete enforceability on the distribution of wages indicates that the decrease in hourly wages is coming from employees at the upper end of the wage distribution. Figure 2 plots the coefficient on the interaction between noncompete enforceability and high-use occupations in a series of regressions in which the dependent variable is an indicator for having earnings in at least the 1st, 2nd, . . . , 10th decile among the high-use occupations. The figure shows that noncompete enforceability is not associated with any differential effect on the probability of having earnings greater than the 3rd, 4th, and 5th deciles, but that it is negatively associated with the likelihood of having earnings in at least the 6th, 7th, 8th, 9th, or 10th decile. Column (5) of Table 5 shows that a 1 standard deviation increase in enforceability reduces the probability of having earnings within the 10th decile by 1.08 percentage points.
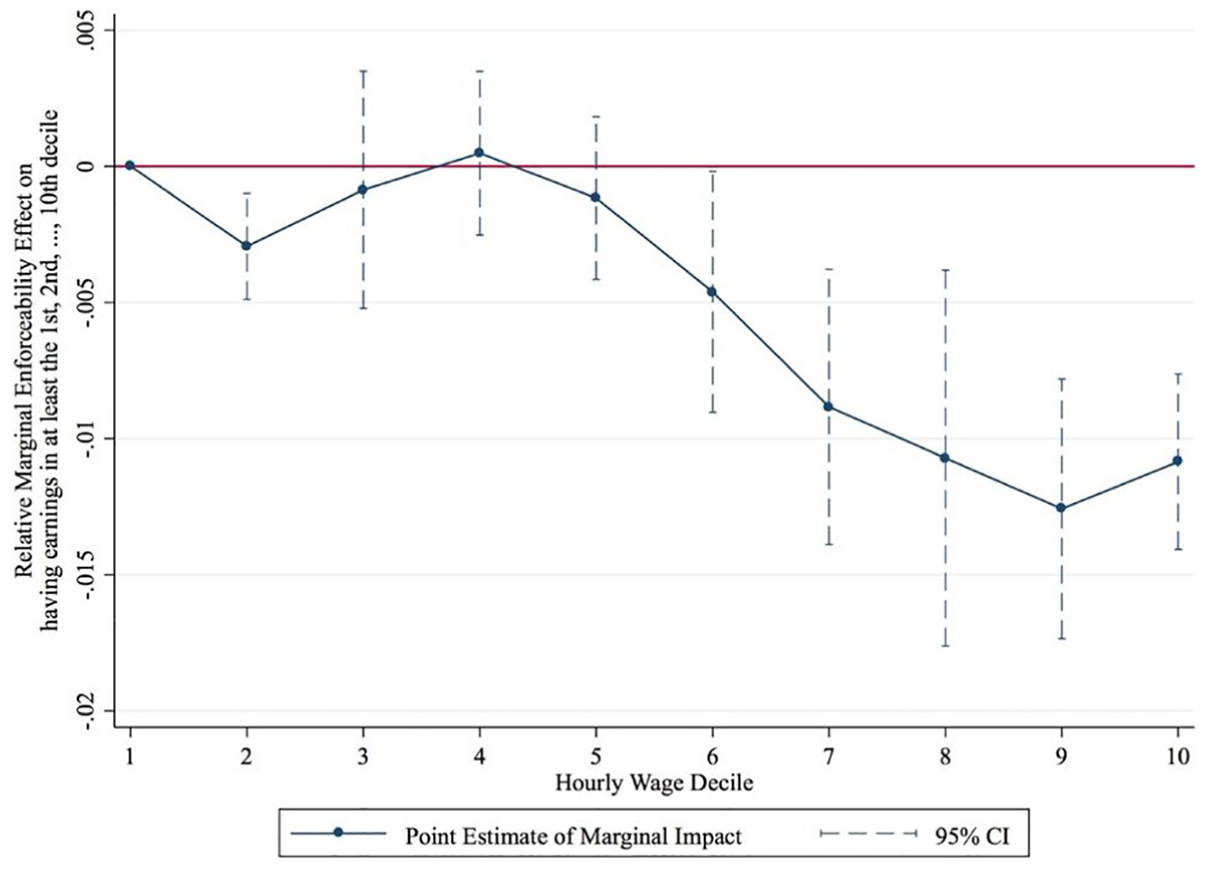
Marginal Effect of Noncompete Enforceability on Having Earnings in at Least the 1st, 2nd, . . ., 10th Decile of the High-Use-Year Wage Distribution
In comparison to other estimates of mobility and wages, the 8% reduction in tenure observed here is directly in line with Marx et al. (2009: 876), who found that, “The job mobility of inventors in Michigan fell 8.1% following the policy reversal compared to inventors in other states that continued to proscribe non-competes.” Regarding wages, the only other evidence comes from Garmaise (2009), who found that increased enforceability is associated with an 8.2% reduced growth rate in the earnings of CEOs. The point estimates here—that wages are 4% lower in an average enforcing state relative to a non-enforcing state—are significantly smaller. These differences could be attributable to the average worker in a high-use occupation being very different from the average CEO.
One interpretation of these estimates is as intent-to-treat effects, in which the observed effects are entirely driven by those who are bound by noncompetes. If so, then converting the wage estimates into treatment on the treated estimates (by dividing the point estimate by the proportion of those high-use occupations bound by a noncompete, 25%) gives a much larger estimate of a 16% wage reduction. As suggested earlier, however, it is unclear if we should interpret these effects in this way for two reasons: First, the incidence of noncompetes for high enforceability states may be higher, so that this simple calculation may not be right. (Unfortunately the SIPP does not have the data to address this issue directly.) Second, enforceable noncompetes may have spillovers to others in the labor market through their effects on entrepreneurship and competition. For example, noncompetes may induce additional search frictions (even for those not bound by them) if noncompetes reduce quits and vacancies or otherwise cause congestion in the hiring process. Moreover, recent evidence suggests that noncompete enforceability deters within-industry entry, reduces initial firm size (Starr et al. 2018), and increases concentration in the product market (Lavetti and Hausman 2017). Thus, noncompete enforceability is also associated with both reduced product and labor market competition generally, which may depress wages (Manning 2011). Future research using data on who is (and who is not) bound by noncompetes could help disentangle these competing explanations.
High-Use Occupations and Heterogeneity by Education and Tenure
Only High-Use Occupations
One potential concern with these results is that they are driven by odd behavior from the low-use occupations (the control group) rather than being driven by the high-use group. Table 6 and Figure 3 examine results looking only at the conditional relationship between noncompete enforceability (including the consideration and non-consideration dimensions), wages, and training in high-use occupations. The top left panel of Figure 3 shows a binned scatter plot of the relationship between noncompete enforceability and the likelihood of receiving training in the past year, after netting out individual controls and occupation-by-industry-by-year fixed effects. We observe a positive relationship with a slope of 1.1 percentage points per unit increase in noncompete enforceability (column (1) of Table 6). Column (2) and (3) of Table 6 further show that, as before, this relationship is driven entirely by firm-sponsored training, as opposed to self-sponsored training. The lower left panel of Figure 3 presents a similar binned scatter plot examining the conditional relationship between wages and enforceability, showing a negative relationship with a slope of −0.0193 log points per unit increase in enforceability (column (4) of Table 6). As Figure 3 shows, the non-enforcing states of California and North Dakota are outliers on the enforceability spectrum. In the Robustness Checks section below, I consider alternative specifications to understand the role of these states.
High-Use Occupation Subsample
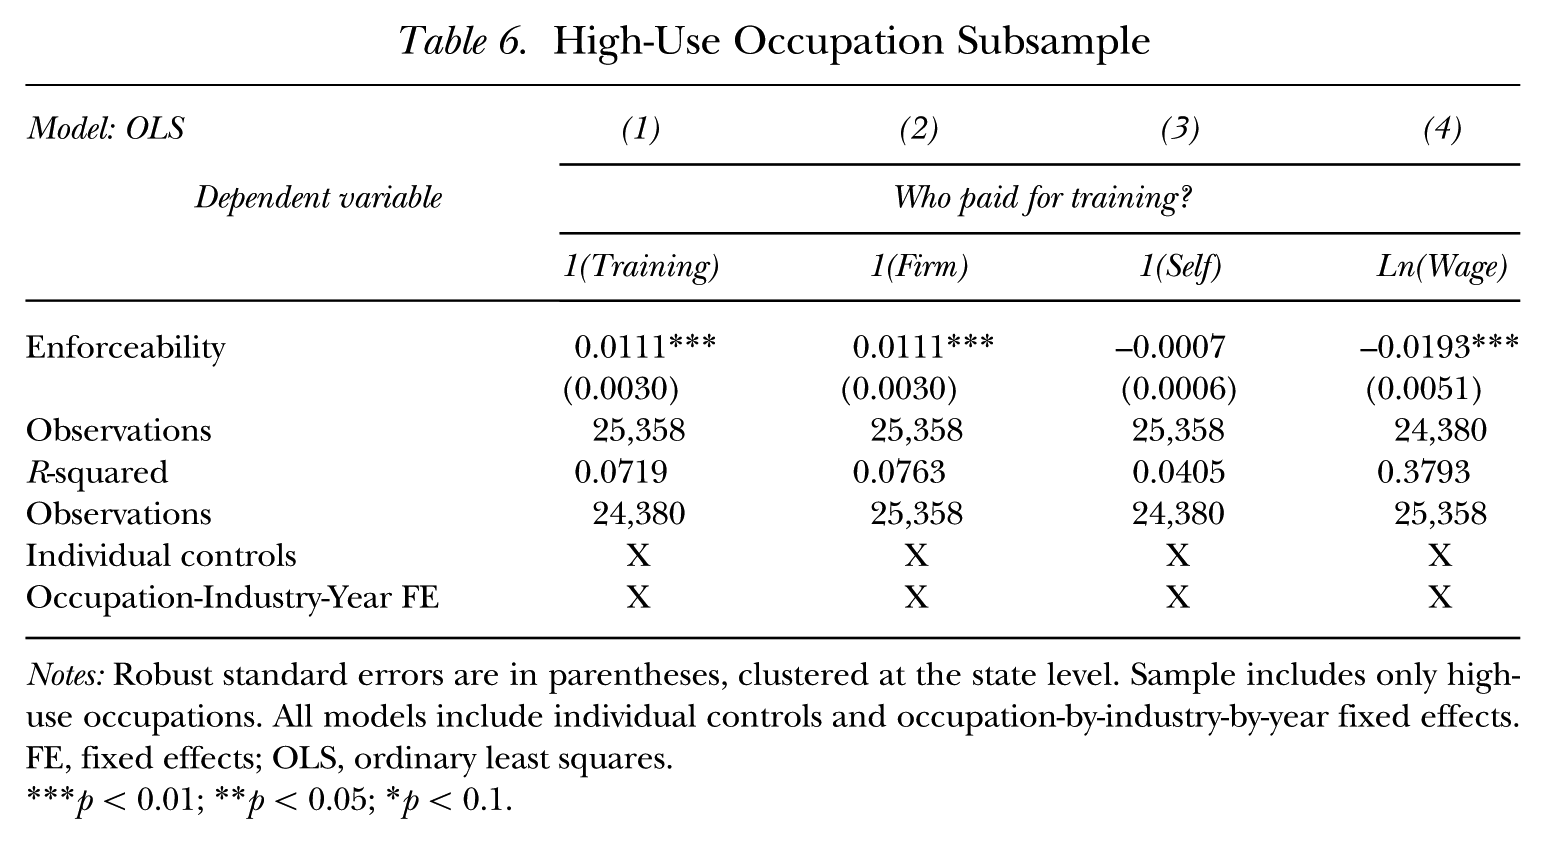
Notes: Robust standard errors are in parentheses, clustered at the state level. Sample includes only high-use occupations. All models include individual controls and occupation-by-industry-by-year fixed effects. FE, fixed effects; OLS, ordinary least squares.
p < 0.01; **p < 0.05; *p < 0.1.
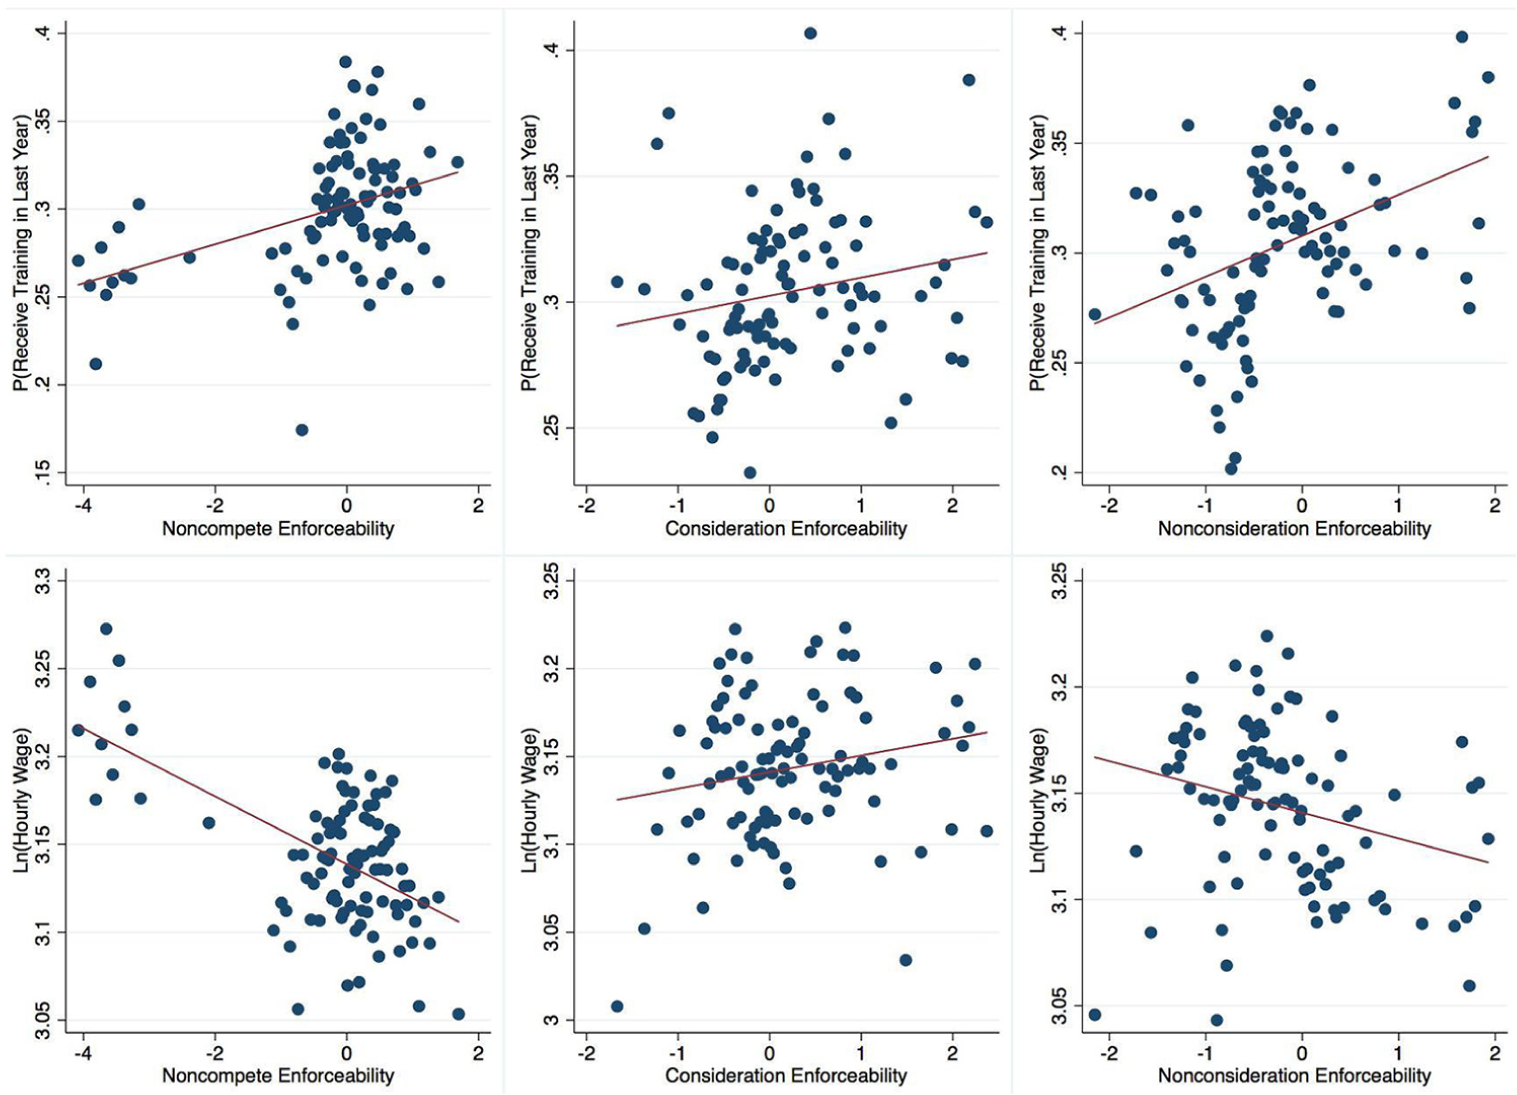
Binned Scatter Plot of Relationship between Types of Noncompete Enforceability, P(Training in Last Year), and Ln(Hourly Wages) among High-Use Occupations
Heterogeneity by Education and Tenure within the High-Use Subsample
One of the central claims from the theoretical literature is that workers negotiate over their noncompetes, although this is at odds with the empirical data. If the data are correct, then noncompete enforceability enhances employer bargaining power and workers with less bargaining power or who receive offers later in tenure may be especially negatively affected. Panels A and B of Table 7 examine how noncompete enforceability is differentially related to training and wages by tenure and for those with graduate school degrees within the high-use sample. The motivation for these tests is to understand 1) if noncompete enforceability reduces initial wages or shields the worker from wage growth once hired, and 2) if workers with less bargaining power (i.e., those without a graduate degree) experience differential outcomes consistent with less bargaining power. Panel A examines these relationships without state-by-occupation-by-industry-by-year fixed effects whereas panel B includes them, at the cost of not identifying the main effect of noncompete enforceability.
Heterogeneity by Tenure and Education in the High-Use Subsample

Notes: Robust standard errors are in parentheses, clustered at the state level. Table examines heterogeneity by tenure (in years) and whether the worker possesses a graduate degree within a sample of the high-use occupations only. All models include individual controls and occupation-by-industry-by-year fixed effects. Panel B includes state-by-occupation-by-industry-by-year fixed effects, which subsume the main effect of noncompete enforceability. FE, fixed effects; OLS, ordinary least squares.
p < 0.01; **p < 0.05; *p < 0.1.
Table 7, column (1) of panel A indicates that high-use workers hired in higher enforceability states tend to have lower wages at the point of hire, and that while every additional year of tenure is associated with higher wages, this growth is mitigated in higher enforceability states. This wage result may reflect two distinct channels. First, wages are lower initially because workers take jobs that are worse (initial) matches, which may occur if noncompete enforceability has prevented them from taking a job in their chosen industry in the first place (Marx 2011). Second, while the fact that noncompete enforceability negatively moderates the wage effects could be indicative of a poor initial match, it is also indicative of noncompete enforceability limiting wage growth over time.
Table 7, column (2) of panel A indicates that high-use workers hired in higher enforceability states tend to have more training early in their tenure and that the likelihood of receiving training subsequently diminishes relative to individuals in lower enforcing states. 19 These results align nicely with Loewenstein and Spletzer (1997), who documented that firms regularly delay training to distinguish between the stayers and the leavers. By extending tenures and preventing departures to competitors, noncompete enforceability allows firms to temporally shift their training regimes to earlier in worker tenures.
Columns (3) and (4) of panel A in Table 7 examine heterogeneous effects among high-use occupations for those without graduate school degrees. Column (3) shows that the negative wage effects are concentrated among those without a graduate degree, while those with graduate degrees experience a negative but statistically insignificant effect. Similarly, in column (4), those with graduate degrees experience more training in higher enforceability states, but those without graduate degrees experience relatively less training. These results are consistent with the notion that workers with more education have greater bargaining power within the firm, thereby offsetting the negative wage effects of noncompete enforceability while enhancing the training effects.
One may be concerned that these results are driven by other state-level policies or characteristics. Panel B includes state-by-occupation-by-industry-by-year fixed effects, thereby accounting for such omitted variables, although the main effect of noncompete enforceability is no longer identified. Nevertheless, the interaction effects still hold. 20
The Differential Effect of “Consideration” Laws
Given concerns over workers not being compensated for giving up their mobility, many states have adopted special consideration policies to ensure that workers receive some sort of compensation. In this section, I divide the enforceability index into separate consideration and non-consideration components to examine how they are differentially related to training and wages.
To provide a better understanding of consideration laws, I provide below the exact description of the consideration questions from Malsberger et al. (2012), which were scored from 0 (low enforceability) to 10 (high enforceability) by Bishara (2011): Consideration at inception: Does the signing of a covenant not to compete at the inception of the employment relationship provide sufficient consideration to support the covenant? Consideration post-inception: Will continued employment provide sufficient consideration to support a covenant not to compete entered into after the employment relationship has begun? Will a change in the terms and conditions of employment provide sufficient consideration to support a covenant not to compete entered into after the employment relationship has begun?
High scores from Bishara (2011) on these two questions reflect that noncompetes are enforceable when no additional consideration beyond continued employment is provided. Low scores reflect that in order for a noncompete to be enforceable, the employee must receive some additional consideration, which typically takes the form of a promotion, a wage increase, or additional training. For example, Gomulkiewicz (2015) described that in Labriola v. Pollard Group, Inc., “the employer paid no additional compensation for the [5 year] non-compete” and that the “[Washington state] Court held that on-going employment is not sufficient consideration for a noncompete signed after the hiring date nor is on-the-job training when the employee comes to the employer with experience and training.” 21
To disaggregate the aggregate measure of enforceability into consideration (i.e., the two questions above) and non-consideration (i.e., the other five questions in Bishara 2011) components, I utilize the weights in Table 1 to aggregate the two consideration dimensions into one “consideration” index and the five non-consideration dimensions into a separate “non-consideration” index. Both indices are then normalized to have a mean of 0 and a standard deviation of 1 in a sample in which each state has a weight of 1. I reverse-code the raw consideration index by multiplying it by negative 1, such that higher scores reflect that the state requires some sort of additional consideration.
Using these consideration and non-consideration measures of enforceability, Table 8 reports the results from the main specification for training and wages. Column (1) shows that the relationship between noncompete enforceability and training is driven by the non-consideration dimensions of enforceability: Notably, the coefficient on non-consideration dimensions is roughly 50% larger than for the overall index. This occurs because the adoption of consideration policies reduces overall enforceability but is itself associated with additional (but statistically insignificant) training. The second and third panels of Figure 3 show these results for the high-use sample only, confirming that the effects are coming from this group.
Consideration and Non-consideration Components of Enforceability

Notes: Robust standard errors are in parentheses, clustered at the state level. The dependent variable is indicated in the column heading. Individual controls consist of hours worked, a quadratic in age, and indicators for working in a metro area, bachelor’s degree, graduate school degree, male, white, and whether the worker is unionized. FE, fixed effects; OLS, ordinary least squares.
p < 0.01; **p < 0.05; *p < 0.1.
To examine the effects of these consideration and non-consideration indices of noncompete enforceability on the distribution of training, Figure 4 plots the coefficients on both consideration and non-consideration measures in a series of regressions in which the dependent variable is the receipt of 1, 2, . . . 10 training events. As in column (1) of Table 8, Figure 4 shows that the increase in the likelihood of receiving training for the 1st, 2nd, 3rd, . . . , event is due to the non-consideration component of enforceability. The consideration component is positively related to receiving the first few training events but is nearly 0 for all subsequent training events.
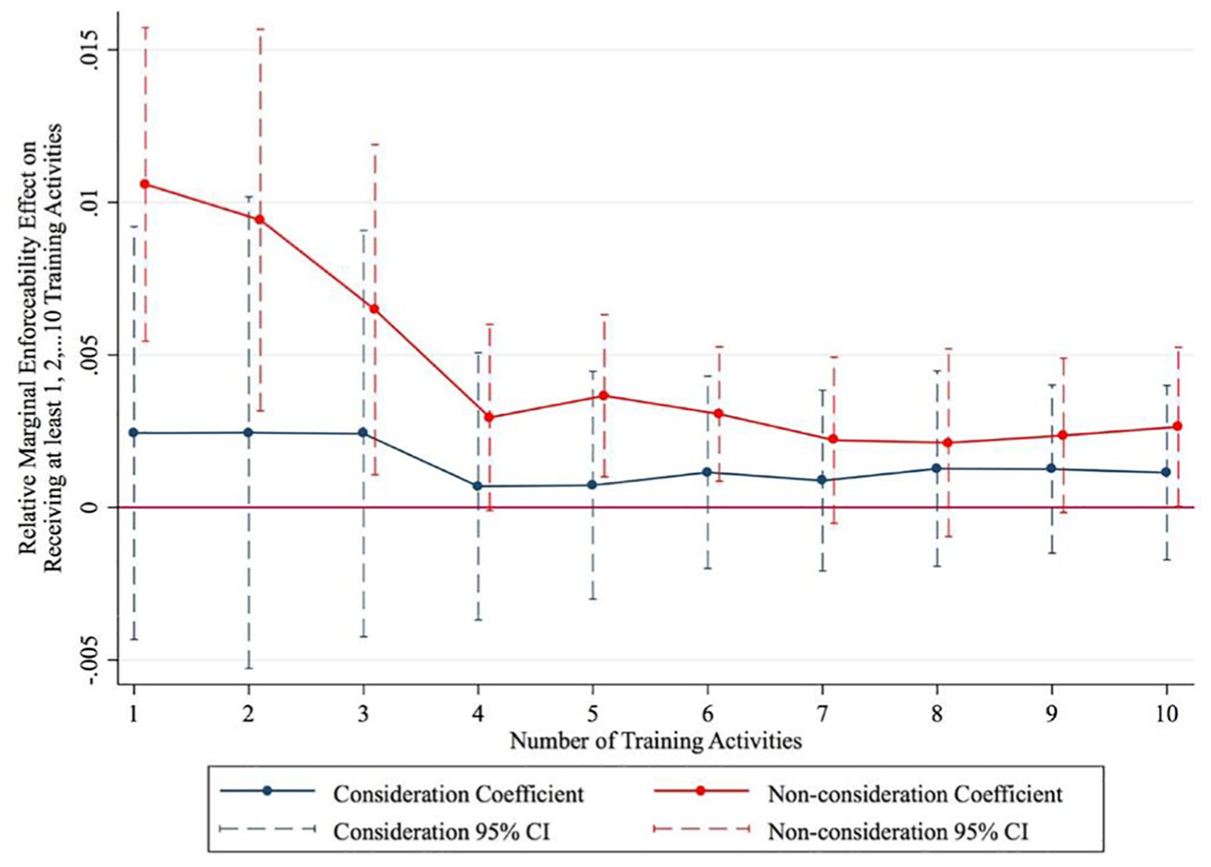
Marginal Effect of Consideration and Non-consideration Enforceability on Participating in at Least 1, 2, . . . 10 Training Activities
Regarding wages, column (2) of Table 8 shows that a 1 standard deviation increase in consideration is associated with an increase in the average hourly wage of 1.1% and a 1 standard deviation increase in non-consideration dimensions of enforceability is associated with a 0.03% decrease in wages. In other words, the negative wage effect identified in column (2) of Table 5 is driven primarily by states that do not require any additional consideration in exchange for agreeing to a noncompete. Columns (4) and (5) of Table 8 show that the positive consideration effect is positive throughout the wage distribution, although it reaches canonical levels of statistical significance only at the top of the wage distribution. Figure 5 presents the coefficients on the consideration and non-consideration measures in a series of regressions in which the dependent variable is an indicator equal to 1 if the individual has earnings in at least the 1st, 2nd, . . . , 10th decile of the high-use wage distribution. The point estimates show that increased consideration is associated with higher wages throughout the wage distribution, though in most cases the effects are not statistically distinguishable from 0. By contrast, increases in non-consideration dimensions of enforceability are associated with lower earnings for those in the very right tail of the earnings distribution.
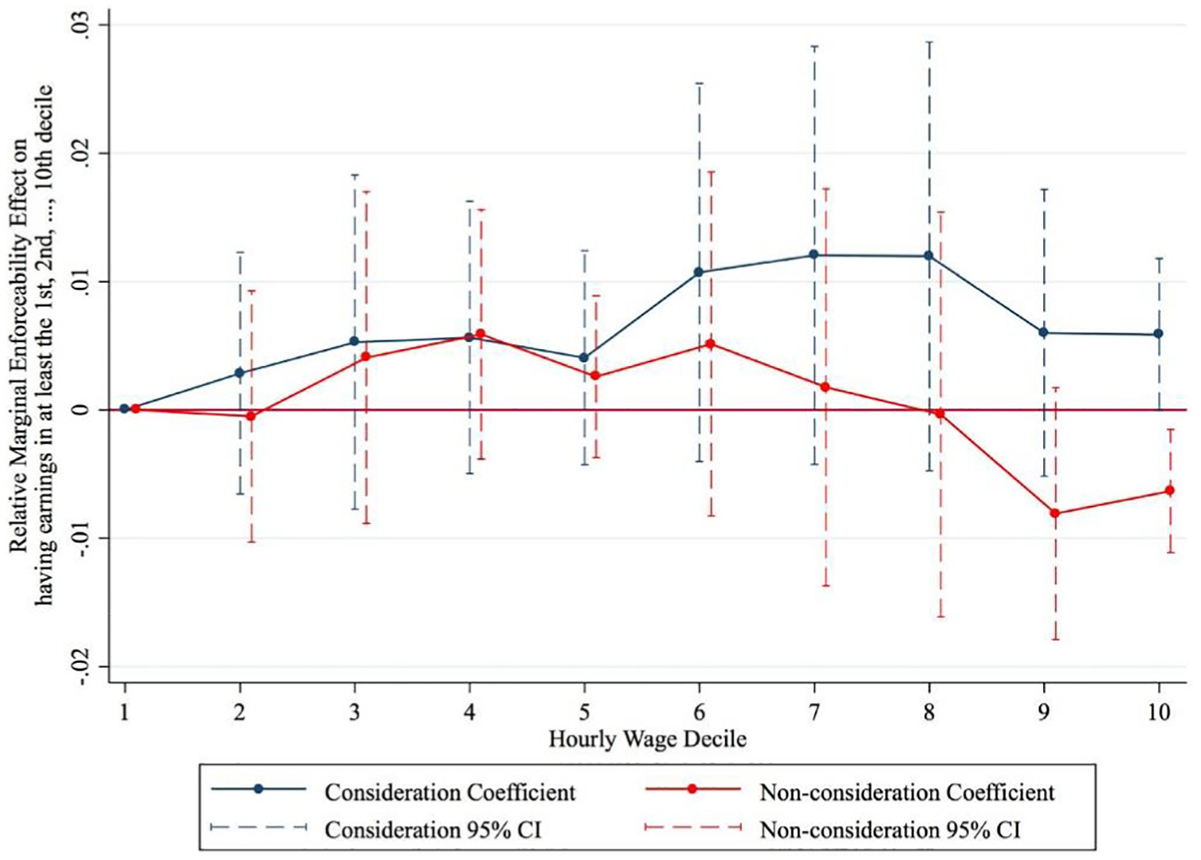
Marginal Effect of Consideration and Non-consideration Enforceability on Having Earnings in at Least the 1st, 2nd, . . ., 10th Decile of the High-Use-Year Wage Distribution
Robustness Checks
A causal interpretation of these results requires that
In particular, one might be concerned that high-enforceability states are systematically different in unobserved ways that might affect wages and training. For example, California, one of the non-enforcing states, was the first to adopt exceptions to at-will employment, whereas Florida, the highest enforceability state, has yet to adopt any (Autor, Donohue, and Schwab 2006). Recall that all specifications include state-by-year fixed effects, such that the enforceability effects are identified based on comparisons between high- and low-use occupations within a state-year. As a result, such fixed effects will pick up all state-year variables as long as they have a common effect on low- and high-use occupations. What this approach does not address is the possibility that high-enforceability states might adopt other policies that affect training and wages for only high- or only low-noncompete-use occupations.
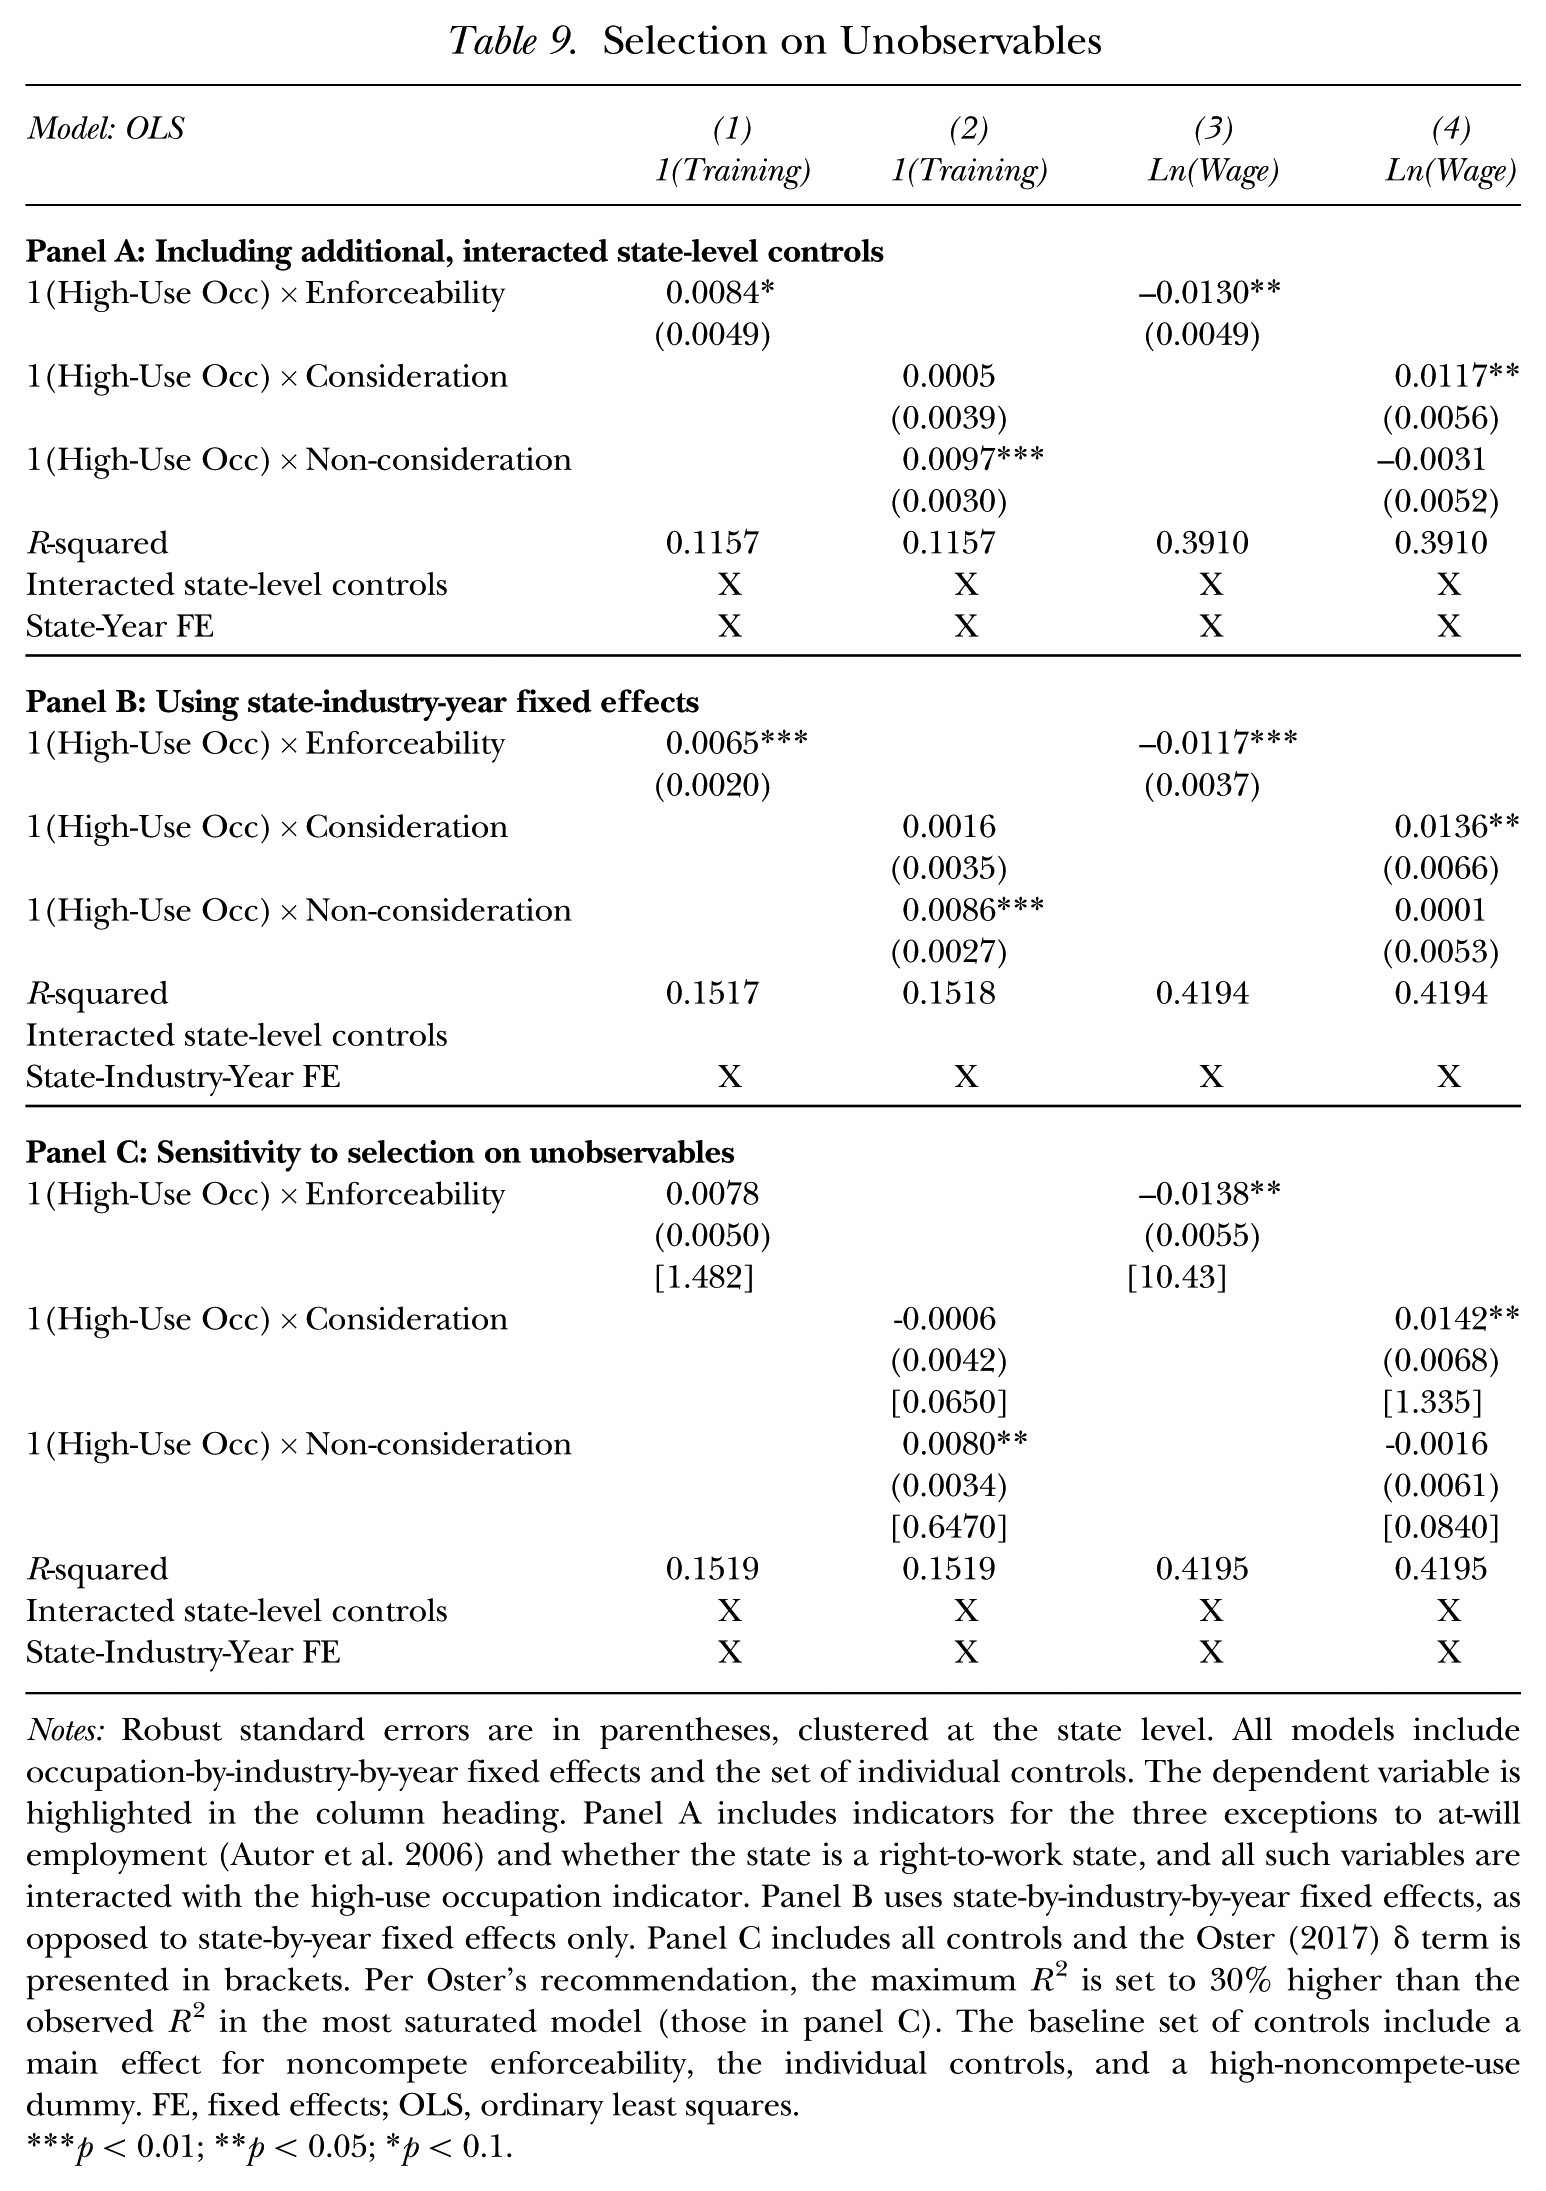
To address the possibility of such omitted variables, I examine the sensitivity of the results to the inclusion of numerous state-year variables, including dummies for the three exceptions to at-will employment (Autor et al. 2006), and dummies for being a right-to-work state—all interacted with the high-noncompete-use indicator. The results, presented in panel B of Table 9, show that the primary results are unchanged.
Selection on Unobservables
Notes: Robust standard errors are in parentheses, clustered at the state level. All models include occupation-by-industry-by-year fixed effects and the set of individual controls. The dependent variable is highlighted in the column heading. Panel A includes indicators for the three exceptions to at-will employment (Autor et al. 2006) and whether the state is a right-to-work state, and all such variables are interacted with the high-use occupation indicator. Panel B uses state-by-industry-by-year fixed effects, as opposed to state-by-year fixed effects only. Panel C includes all controls and the Oster (2017)δ term is presented in brackets. Per Oster’s recommendation, the maximum R2 is set to 30% higher than the observed R2 in the most saturated model (those in panel C). The baseline set of controls include a main effect for noncompete enforceability, the individual controls, and a high-noncompete-use dummy. FE, fixed effects; OLS, ordinary least squares.
p < 0.01; **p < 0.05; *p < 0.1.
A second concern is that high-enforceability states may be more likely to adopt policies that affect industries wherein high-noncompete-use occupations cluster; for example, California might treat its technology industry differently from how Florida does. To address the possibility that high-enforceability states might treat certain high-skilled industries differentially, I saturate the model even further with state-by-industry-by-year fixed effects (as opposed to state-by-year fixed effects). Panel A of Table 9 shows that the main results are robust to such saturation: Noncompete enforceability is associated with more training, driven by the non-consideration dimensions of enforceability, and lower wages, driven by the lack of adoption of consideration laws.
A number of other selection concerns remain. Perhaps firms that employ high-noncompete-use occupations differ fundamentally from those in high enforceability states, with regards to the propensity for training and payment practices. This could be the case if, for example, firms sort to such locations over time. To address this, I examined sorting on observable characteristics and found no statistically significant differences in the types of workers who locate in high versus low enforceability states (results available upon request). Nevertheless, to address any other potentially omitted variable, I employ the diagnostic test developed in Oster (2017), which extends the methods in Altonji, Elder, and Taber (2005) to test how strong selection on unobservables must be in order to drive the estimated treatment effects to 0. 22 Oster’s method produces a parameter, δ, which captures how strong selection on unobservables would have to be, relative to selection on observables, to drive the estimated treatment effects to 0. A value of δ > 1 implies that selection on unobservables would have to be stronger than selection on observables.
Oster suggests that if one can control for the first-order variables of interest, then δ > 1 is a natural cutoff to ascertain the robustness of the results. Following Oster’s guidelines, I set the maximum R-squared to 30% higher than the R-squared from the most saturated model. As a baseline set of controls, I include an indicator for a high-noncompete-use occupation, the baseline set of individual controls, a main effect for noncompete enforceability, and its interaction with the high-use indicator. The advanced set of controls includes state-by-year-by-industry fixed effects and the interacted state-level controls described earlier.
Results of these most saturated regressions and the Oster diagnostic statistics are shown in brackets in panel C of Table 9. The results are largely similar in this most saturated model as before. The term for the main training interaction in column (1) is 1.48, suggesting that selection on unobservables would have to be nearly 50% stronger than the selection on observables in order to reduce the estimated effect to 0. As before, the positive training effect is driven by non-consideration dimensions, which pick up a δ term of 0.65, suggesting that if selection on unobservables is 65% as strong as selection on observables it could drive the estimated treatment effect to 0. The wage results in columns (3) and (4) show a pattern that is consistent with the previous results. The δ term on the enforceability interaction in column (3) is 10.4, while the δ term on the consideration interaction is 1.3. These results cannot confirm that the magnitudes of these estimates are correct, but these high values suggest that selection on unobservables would have to be quite strong to overturn the directionality of these results.
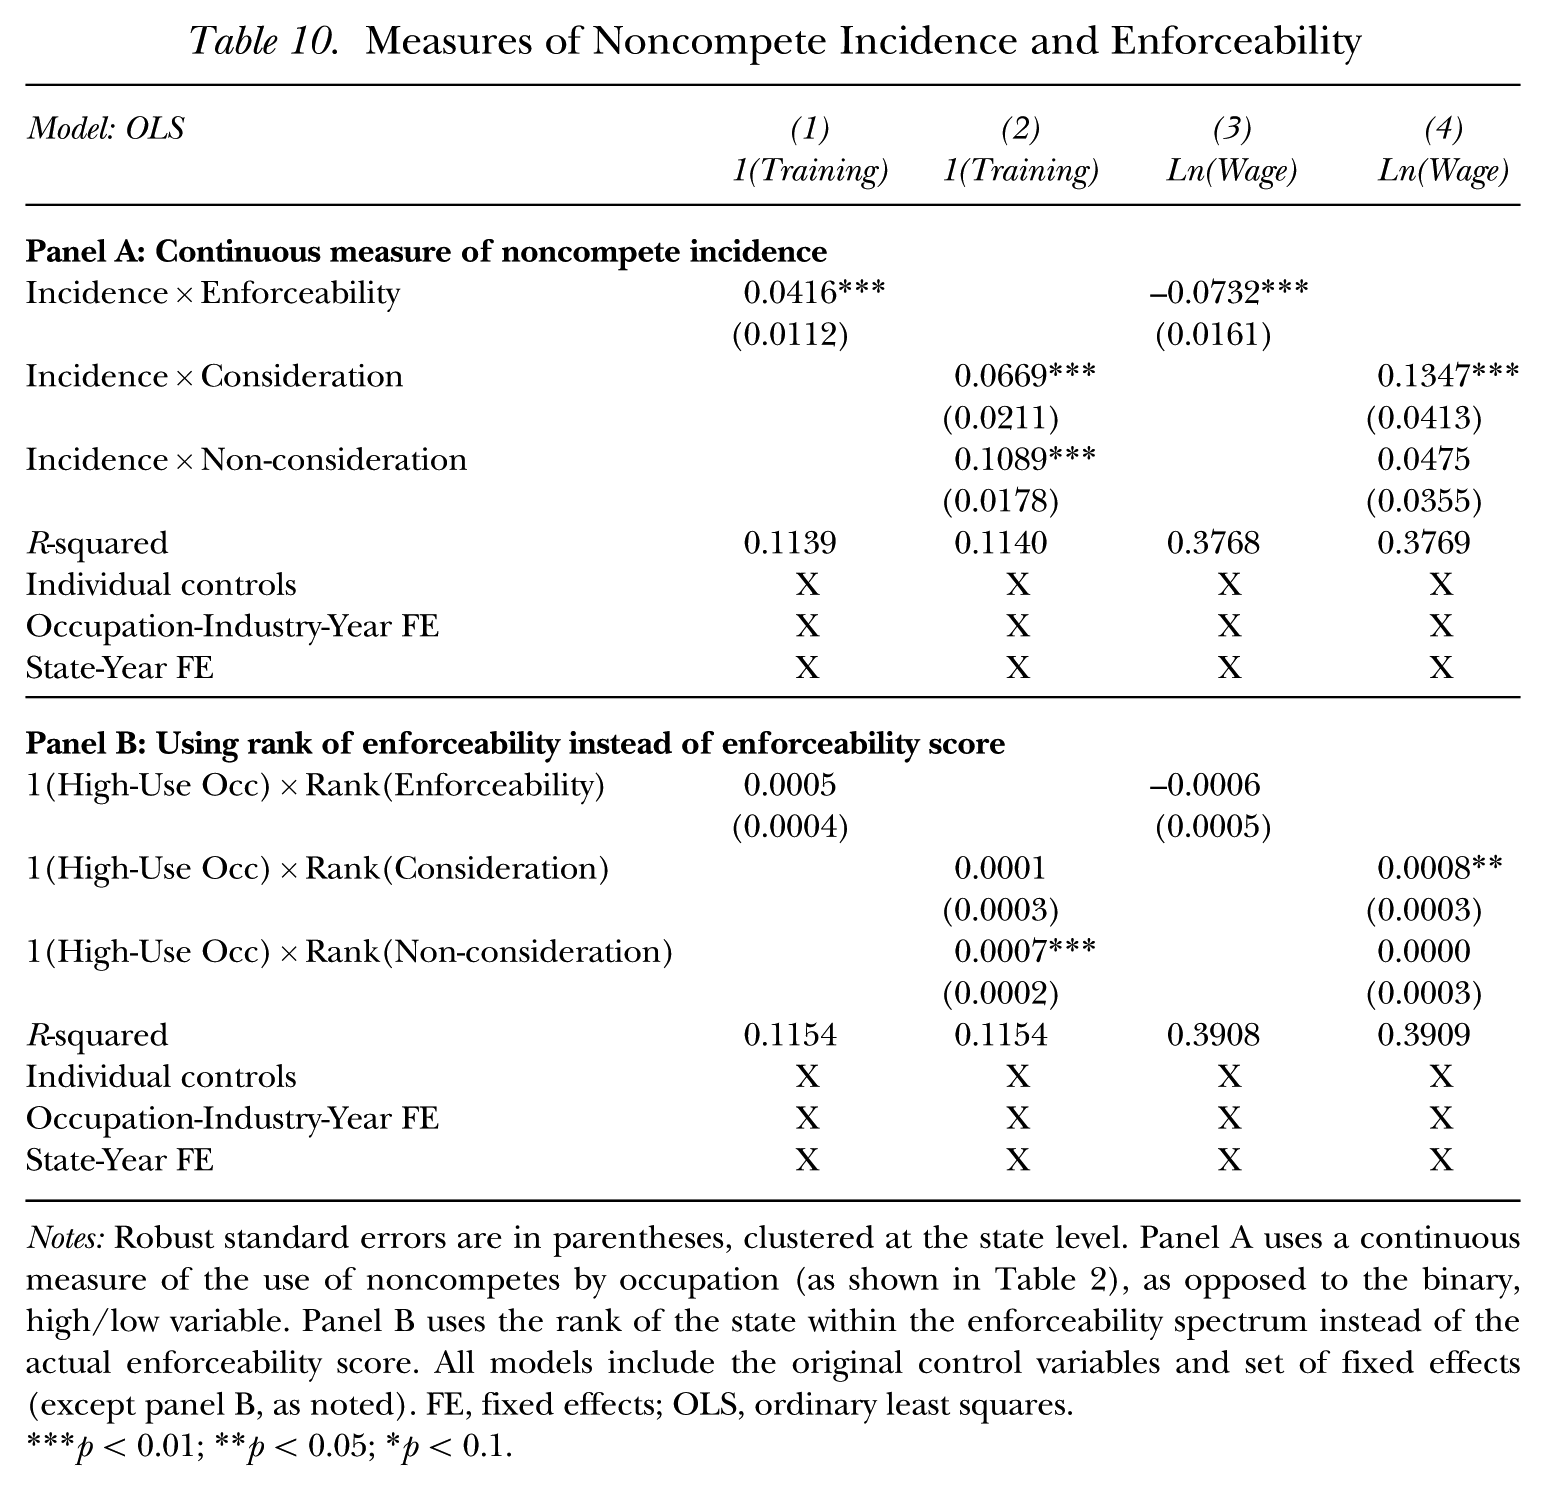
A last set of concerns relates to the robustness of the measure of noncompete enforceability and the measure of noncompete incidence. In panel A of Table 10, I replace the dichotomous noncompete variable with the continuous incidence measure. Results are markedly similar to before: In higher enforceability states, a greater incidence of noncompetes in the occupation is associated with more training and lower wages. As before, the training differential is driven by the non-consideration dimensions of enforceability, though the coefficient on the consideration dimension is positive and statistically significant as well. The negative wage effect is similarly driven by the consideration dimensions.
Measures of Noncompete Incidence and Enforceability
Notes: Robust standard errors are in parentheses, clustered at the state level. Panel A uses a continuous measure of the use of noncompetes by occupation (as shown in Table 2), as opposed to the binary, high/low variable. Panel B uses the rank of the state within the enforceability spectrum instead of the actual enforceability score. All models include the original control variables and set of fixed effects (except panel B, as noted). FE, fixed effects; OLS, ordinary least squares.
p < 0.01; **p < 0.05; *p < 0.1.
I also replicate the results with a different set of enforceability measures. 23 One may be concerned that the measure of enforceability has significant outliers because California and North Dakota are the only non-enforcing states. To address this concern, I rid the index of any cardinal differences in the enforceability scores and instead use an ordinal ranking of the states according to their enforceability. Panel A of Table 10 reports the results of the main specifications using rankings from 1 to 50, in which higher ranks refer to greater enforceability. The main effects of noncompete enforceability point in the same direction, but they are weaker and lose statistical significance at canonical levels (column (1) and (3)). Nevertheless, the consideration and non-consideration effects show the same pattern as before. 24
I also replicate the results using the noncompete enforceability measure in Garmaise (2009). The interaction of high-use indicator with the Garmaise measure of enforceability has a coefficient in the training regression of 0.0063 (compared to 0.0077 in column (4) of Table 4) with a p value of 0.095, and the point estimate in the wage regression is –0.0115 (compared to –0.0099 in column (2) of Table 5) with a p value of 0.005 (full results available upon request).
Discussion and Limitations
The evidence presented above suggests the following five relationships: Increased levels of aggregate noncompete enforceability are related to 1) an increased likelihood of receiving firm-sponsored, off-site and outsider-taught, skill-upgrading training, but do not change the likelihood that the last training event was self-sponsored, and 2) a decrease in average hourly wages. Among the high-use occupations, these negative wage effects are strongest for 3) those without an advanced degree and for those with longer tenures. Disaggregating noncompete enforceability into separate consideration and non-consideration measures shows that the training results are driven by the 4) greater non-consideration components of enforceability, whereas the negative wage effects are driven by 5) states that enforce noncompetes when no additional consideration beyond continued employment is provided.
These findings provide empirical support for the prediction of the theoretical literature that noncompete enforceability encourages firms to invest in training (Rubin and Shedd 1981; Posner et al. 2004; Meccheri 2009), but they also contrast with the hypothesized relationship between noncompete enforceability and self-sponsored training (Lobel and Amir 2013). For example, Garmaise (2009) also found that executives earn less in high-enforceability states and argued that the reason is reduced executive self-investment. The results in the present study suggest that self-investment plays a very minor, if any, role. One caveat to these results, however, is that the SIPP captures one particular measure of individual effort. If individuals shirk in other ways, which may not be reflected in a self-sponsored training measure, it may otherwise show up in their wages. If reductions in self-sponsored training are not driving the negative wage effects, then the negative wage results call into question exactly why workers would agree to such provisions in the first place.
Moreover, the results also contrast with the theoretical predictions from the literature that noncompete enforceability will raise wages. The recent facts described in Starr et al. (2019) suggest that the contracting process may not be as competitive as theoretical models suppose, and that employers can wield substantial power by, for example, delaying the implementation of the noncompete until after the worker has turned down other job offers. Thus, some workers may end up being bound by a noncompete without receiving any of the benefits that the contracting literature would suggest they receive (Callahan 1985; Sterk 1993). Indeed, the results within the high-use sample suggest that noncompete enforceability reduces the returns to tenure and that the less educated are the hardest hurt. One policy overlooked by previous studies that examined only one dimension of enforceability (Stuart and Sorenson 2003; Garmaise 2009; Samila and Sorenson 2011), which to a limited extent appears to counteract the negative wage effects without dampening the investment incentives, is the requirement that firms provide some sort of consideration in exchange for an enforceable noncompete—whether it is a bonus, additional training, a promotion, or even early notification of the noncompete.
These findings contribute to several literatures. They contribute to training literature and the literature on labor market frictions (Loewenstein and Spletzer 1997; Barron et al. 1999; Manning 2003; Acemoglu and Pischke 2003; Naidu 2010; Naidu and Yuchtman 2013) by showing that a labor market friction between competitors induces firms to provide additional training and that state policies may be able to contribute to the distribution of that surplus. These findings also contribute to the literature on productivity and management (Shaw 2004; Bloom and Reenen 2011) by showing that firms can utilize such mobility-reducing policies to improve the skills (and productivity) of their workforce.
Last, this work contributes to ongoing debates in the noncompete literature (US Treasury 2016; US White House 2016) in two ways. Regarding the discussion around firm-sponsored versus self-sponsored training, this article provides the first evidence that self-sponsored training is unrelated to enforceability, but firm-sponsored training is related. Outside of not capturing other dimensions of individual effort, one potential reason for this finding relates to information: Individuals may be unaware of their state policies, but firms are much more likely to be informed. Second, regarding the tension between noncompete enforceability, employee mobility, and training, the existing logic is such that increasing enforceability comes as a double-edged sword in that it reduces and redirects employee mobility (Marx et al. 2009; Marx 2011; Marx et al. 2015) but is necessary to ensure firm-sponsored investments (Rubin and Shedd 1981; Posner et al. 2004). By breaking noncompete enforceability into separate subcomponents, this study provides suggestive evidence that the adoption of policies that tie the enforceability of the noncompete to the receipt of additional consideration may serve to reduce noncompete enforceability in a manner that compensates the individual and avoids dampening the incentives to invest in human capital.
This study nevertheless faces numerous limitations. Most notably, the SIPP does not possess information on who signs noncompetes. Thus, it is impossible to identify the effect of enforceability on those who do and do not sign. The effects identified in this article are aggregate-level effects, including the effects of the treatment on the treated, the treatment on the untreated (those not bound by a noncompete), and potentially the effects of increasing the use of noncompetes as well. Disentangling these channels is a clear avenue for future work. Second, as noncompete policies have been largely stable between 1996 and 2008, 25 this study uses cross-sectional variation in the enforceability of noncompetes to identify its effects. Relatedly, it is unclear if firms sort into high- and low-enforceability states based on whether they are high-paying or high-training firms. Although such sorting may underlie the effects observed here, longitudinal data following a major change in enforceability would be required to assess the extent to which these policies determine the location of firms. If the growing policy debate results in a cascade of policy changes, then exploiting such changes, utilizing data on who signs noncompetes, and tracking the movement of workers and firms over time would provide a promising avenue for future research.
Conclusion
The development of skills (Heckman, LaLonde, and Smith 1999), wage growth (Furman 2016), and the movement of workers (Topel and Ward 1992; Decker et al. 2014) are crucial for economic well-being. The enforceability of covenants not to compete is a legal labor market friction that reduces wage competition in the labor market and restricts the flow of workers across competitors, but increases firms’ incentives to invest in their workers. Because of claims that California’s ban on noncompetes caused the tremendous growth of Silicon Valley, and recent research finding negative impacts of noncompete enforceability on employee mobility and new venture creation, such restrictions have been the recent focus of significant legislative scrutiny (US Treasury 2016; US White House 2016).
Utilizing cross-sectional variation in state noncompete laws, this study finds that if a non-enforcing state adopted mean enforceability policies, then the incidence of training would rise by 14%, but wages would fall by 4%. Enforceability also dampens the return to tenure and has the most negative effects on workers without advanced degrees. Not all noncompete policies are the same, however: The adoption of consideration policies are associated with higher earnings, whereas other policies that increase the enforceability of noncompetes are associated with more training.
Footnotes
Acknowledgements
I thank seminar participants from the labor and IO seminars at the University of Michigan, the University of Maryland, the Society of Labor Economists, the Federal Trade Commission, the Department of Justice, the University of Illinois, the University at Buffalo, California State University Fullerton, Oberlin College, the Trans-Atlantic Doctoral Conference at the London Business School, the Midwestern Economics Association 2013 Conference, and EconCon 2013 at Columbia University. In particular, I thank Charlie Brown, Norman Bishara, Jeffrey Smith, JJ Prescott, Rajshree Agarwal, John DiNardo, Dan Black, Alan Benson, Matt Marx, Kurt Lavetti, David Knapp, Pawel Krolikowski, Ryan Monarch, Ben Niu, Martin Ganco, Benjamin Campbell, and Kelsey Starr for their help and advice.
For information regarding the data and/or computer programs used for this study, please address correspondence to
1
2
See, for example, Rubin and Shedd (1981); Posner, Triantis, and Triantis (2004); Meccheri (2009); Garmaise (2009);  .
.
3
See, for example, the Reddit thread on how a new CEO forced existing employees to sign a 3-year, nationwide noncompete with no additional consideration: https://www.reddit.com/r/personalfinance/comments/65p21w/hrrecruiters_of_reddit_im_a_27_year_old_being/?limit=500. Or, see how noncompetes signed by workers when they were young or who needed the job have come back to hurt them ().
4
A prior version of this article, initially titled “Training the Enemy? Firm-Sponsored Training and the Enforceability of Covenants Not to Compete,” pursued a similar approach by dividing workers into high and low litigation occupations based on the extent to which a given occupation is found in noncompete-based court proceedings, using two surveys of noncompete cases (Whitmore 1990; ). The unreported results are similar along all dimensions to those presented herein.
5
For the mobility results, see Fallick, Fleischman, and Rebitzer (2006); Marx et al. (2009); ; Marx et al. (2015). For the entrepreneurship results, see Stuart and Sorenson (2003); Samila and Sorenson (2011); Starr et al. (2018). For the innovation results, see Samila and Sorenson (2011); Garmaise (2009).
6
Among those who examine the benefits of noncompetes, Lavetti et al. (forthcoming) found that physicians who sign noncompetes tend to earn 11% more than physicians who do not sign noncompetes because they are allocated more clients. Similarly, Conti (2014) found that noncompete enforceability is associated with riskier firm R&D investments, whereas Younge and Marx (2016) found that Tobin’s q increased by 9.75% after noncompetes became enforceable in Michigan. found a negative relationship between capital investment and enforceability.
7
For example, recent work in the training literature has been concerned with identifying labor market imperfections that create a wedge between the internal and external value of the worker (Acemoglu and Pischke 1999), including technological complementarities (Acemoglu 1998), minimum wages (Acemoglu and Pischke 2003), the “thinness” of labor markets (Wolter, Muehlemann, and Ryan 2013), asymmetric information (Stevens 1994; Autor 2001), search frictions (Moen and Rosén 2004), moving costs (Katz and Ziderman 1990; Benson 2013), and commitment to training (Dustmann and Schönberg 2012). A related literature looks at similar frictions that prevent the free flow of labor (Naidu 2010; ).
8
See, for example, the recent work on occupational licensing (Kleiner and Krueger 2013), trade secret law (Png 2017), and the doctrine of inevitable disclosure (Contigiani, Hsu, and Barankay 2018).
9
Legal scholars have long been concerned about the potential lack of negotiation over these contracts (Arnow-Richman 2001, ).
10
Some states, such as Florida and Kentucky, include extraordinary general skills training in this list of protectable interests, but traditionally it has been omitted (Blake 1960). Regardless of whether general training is itself a protectable interest, however, the training a firm chooses for its employees is closely related to the traditional protectable interests: Once an employee is exposed to the firm’s secret formula, client lists, advertising strategies, or other confidential information, the employee is bonded to the firm by the noncompete, and the firm has the same increased incentives to invest in the worker as if training were itself a protectable interest. Those further investments in training may include learning more trade secrets and confidential information, but it is the first exposure to confidential information that counts. Nonetheless, whether general training should be a protectable interest has brought on debate in the legal literature. The arguments hinge on whether the worker is able to stay at the firm long enough to pay back the training costs borne by the firm. On the one hand, if the worker leaves too soon, the firm cannot capture enough of the return to training to cover the cost (Lester 2001). On the other hand, if the worker leaves long after he has repaid his training cost, it seems unfair to restrict his post-employment options by enforcing his noncompete (Long 2005). As a result of this debate, many legal scholars advocate the use of training recoupment contracts such that if the worker leaves too soon he must pay back damages to the firm ().
11
A better index would incorporate the distribution of characteristics relevant for enforceability into the index itself. Such data, to my knowledge, is not available. An alternative is to use the method by , which shows that including the individual measures in the baseline regression specification and then using the coefficients on the individual dimensions as weights in the aggregation into a single index is the best way to reduce measurement error. Their method generates different weights with different dependent variables, which is unappealing in this context.
12
It is assumed that E[ε
is
] = 0, E[ε2
is
] = σ
i
, E[ε
is
ε
js
] = 0 for all i≠j, E[ε
is
ε
ik
] = 0 for all s≠k. See Kolenikov (2009) for details. See for an example of using factor analysis to generate an index of college quality.
13
The primary benefit of the SIPP relative to other training data sets, such as the Employment Opportunities Pilot Project, the Small Business Administration data (Barron, Berger, and Black 1999), the NLSY (), and the PSID, is that the number of respondents in each panel is about 40,000. This size difference is crucially important to the project because power issues demand a large number of workers who sign noncompetes across the enforceability spectrum.
14
Occupation codes are updated to 2007 two-digit Standard Occupational Classification (SOC) codes and industry codes are updated to 2007 two-digit NAICS codes.
15
The SIPP panels date back to 1983 and were substantially redesigned in 1996, especially the training questions. Before the 1996 redesign, the main training question was, “Has [the respondent] ever received training designed to help find a job, improve job skills or learn a new job?” Despite the fact that everyone has received training to improve job skills at some point in their life, the proportion responding yes was just 27%. Given confusion over what responses to this question meant, the SIPP redesign in 1996 changed the questions to reflect training in the past year that was designed to improve skills. Given the poor survey questions and ambiguity around the answers in the older SIPP panels, I focus only on the SIPP panels with the redesigned training questions.
16
I use the 1991 enforceability scores because they occur before the collection of the SIPP data, but since the correlation between the 1991 and 2009 scores is so high, the results are robust to either measure.
17
This estimate is likely to be an underestimate of the true causal effect of noncompete enforceability because low-use occupations also sign noncompetes (), and thus the difference between high- and low-use occupations will attenuate the true effect. To address this, I use the continuous measure as a robustness check and find consistent results.
18
That is, greater enforceability may not lead to wage increases even though training rises, despite the fact that, in unreported results, the receipt of training is associated with greater wages.
19
Note this cautionary point: Out of necessity these regressions hold tenure constant, which is endogenous to noncompete enforceability and is thus a “bad control.”
20
In column (4) the main effect of 1(not graduate degree) is not identified because of the high saturation of the model via the fixed effects structure.
21
See Labriola v. Pollard Group, Inc., 100 P.3d 791, 792 (Wash. 2004).
22
The intuition behind the method is that as confounding controls are added to the model, if the coefficient of interest stays roughly the same size and the R-squared rises significantly, then there is significantly less unobserved variation that could overturn the results, and thus we should be relatively confident in the directionality of the point estimates. If, by contrast, the coefficient falls dramatically as controls are added, or the R-squared does not change much, then we would be less confident in the directionality of the estimate.
23
24
The marginal effects of the enforceability measures in ranks across the distribution of wages, for both overall enforceability and separate consideration and non-consideration measures, are provided in Figures A.1 to A.4 of the Online Appendix. The binned scatter plots with ranked measures for the high-use subsample are provided in Figure A.5. In unreported results, I dropped the non-enforcing states from the sample and found similar training effects, though the wage effects became statistically insignificant, indicating that what likely matters for wages is whether they are enforceable to any degree or not at all.