
Abstract
In this article we report an inventory of cycles, upward sweeps and collapses of polity sizes in five separate interpolity systems: Mesopotamia, Egypt, South Asia, East Asia and the expanding Central System that eventually became the contemporary global system. Upward sweeps are defined as instances in which the largest sovereign polity in a network of fighting and allying polities significantly increases in size. Collapses are instances in which the size of the largest polity greatly decreases and stays down for a significant period of time (centuries). We use regional interpolity systems rather than single polities as the unit of analysis, following the comparative world-systems framework. We are limited to those regions and time periods for which quantitative estimates of largest polity sizes are available. We compare the frequencies of cycles and sweeps across five interpolity networks, and find more similarities than differences across the five systems. This is somewhat surprising because most studies that compare East Asia with the West stress important differences. We find a total of 22 upsweeps and 19 downsweeps across the five systems, but only three instances of prolonged system-wide collapse. We also find that the frequency of cycles increased over the long run, while the frequencies of upsweeps and downsweeps did not display long-term trends. The lack of a downward trend in downsweeps challenges the supposition that resilience grows with sociocultural complexity and size.
This article reports some of the results from a research project on the growth of settlements and polities in regional world-systems since the Stone Age. 1 The larger project uses both quantitative estimates of the population sizes of the largest settlements in world regions as well as estimates of the territorial sizes of largest polities to study the location and timing of changes in the scale of human institutions.
Cycles, upsweeps, collapses and ceilings
We compare relatively small regional world-systems with larger continental and global systems. 2 Thus we must abstract from scale in order to examine changes in the structural patterns of small, medium and large human interaction networks. In this article we focus on medium-term change in the scale of polities. 3 In the long run polities have tended to get larger, but our research focuses on medium-term sequences of growth and decline in order to identify those upward sweeps in which their scale significantly increased. Accurate identification of these events will facilitate our understanding of sociocultural evolution because these are the events that account for the long-term trend toward larger and more complex human social institutions. 4
World-systems are interacting sets of polities and settlements. When we study whole systems of this kind we see that they all oscillate in what we call a normal cycle of growth and decline. The largest polity in each region reaches a peak and then declines and then this or another polity returns to the peak size again. These cycles are usually not observed by looking at a single polity in isolation, but rather by looking at the largest polities within a region of interaction. The normal cycle roughly approximates a sine wave, although few cycles that involve the behavior of humans actually display the perfect regularity of amplitude and period found in the pure sine wave.
In Figure 1 the normal cycle of growth and decline is half way down the figure and is labeled ‘normal growth and decline’. At the top of Figure 1 is a depiction of an upward sweep (upsweep) in which the size of the largest polity increases significantly. Such an upsweep may be relatively rapid or may be slow, and Rein Taagepera (1978a) observes that the speed of the growth phase of empires is often related to the sustainability of the upsweep. Taagepera notices that empires that rise relatively slowly (such as the Roman Empire) tend to last longer than those that rise abruptly (such as the Mongol Empire). When an upward movement is sustained and a higher level of scale becomes the new normal we call this an ‘upward sweep’ or an ‘upsweep’. We define an upsweep as a peak that is more than a third higher than the average of the three immediately earlier peaks. 5 We distinguish between an ‘upswing’, which is any upturn in a growth/decline sequence, and an ‘upsweep’, which goes to a level that is more than a third higher than the average of three prior peaks. When an upsweep is temporary and returns to the old lower norm we call it an ‘upsurge’ (see the second line from the top in Figure 1). We also distinguish between four hypothetical types of decline: a ‘normal’ downswing that is part of the normal growth and decline sequence, a downsweep in which the decline goes significantly below what had been established as the normal trough, a sustained collapse in which the new lower scale becomes the norm for at least two further cycles, and a downsurge in which a large decline is the result of the collapse of an upsurge.

Types of medium-term scale change in the largest polity in an interacting set of polities.
Jared Diamond’s (2005) fascinating study of collapses specifies the factors that are thought to cause collapses (see also Tainter, 1988). But Diamond does not employ quantitative measures of collapse and he often focuses on a single polity that collapsed while ignoring neighboring polities that did not collapse. If interpolity interaction networks (world-systems) had been his unit of analysis instead of single polities some of the cases he studied may have been found to have been instances of what we are calling normal rise and fall cycles rather than instances of system-wide collapse. We contend that a genuine systemic (sustained) collapse should be defined as an instance in which all the large polities in a region go down to at least a third lower than the average of the three previous troughs and stay down for at least two cyclical periods. The research reported here counts the instances in which regional systems can be understood to have collapsed for those systems in which we have quantitative estimates of the sizes of the largest polities.
This is an inventory of all the instances of the types of scale change of the territorial sizes of polities for all the regional interpolity networks for which we currently have enough quantitative estimates to make these determinations. We identify instances of each type of change, and eventually will use these as cases for testing hypotheses about the causes of upsweeps and collapses, though we do not do that in this article. Here we use our counts of upswings, upsweeps, downswings, downsweeps and collapses to compare world regions to see if there are similarities or differences across regions in terms of the numbers of cycles, upsweeps and collapses over time.
Figure 2 is a stylized depiction of the rise and fall of large polities and occasional upsweeps that portrays, not the history of a single world region, but rather the general evolution of what has happened over the past 12,000 years as many small polities (bands, tribes and chiefdoms) have been consolidated into a much smaller number of larger polities (states, empires and a possible future world state). This is an illustration of the idea that it is the upsweeps that lead to the long-term trend.

Rise, decline and upsweeps of largest polity sizes.
George Modelski’s (2003) study of the growth of cities over the past 5000 years points to a phenomenon also noticed and theorized by Roland Fletcher (1995) – cities grow and decline in size, but occasionally a single new city will attain a size that is much larger than any earlier city, and then other cities catch up with that new scale, but do not much exceed it. It is as if cities reach a size ceiling that it is not possible to exceed until new conditions are met that allow for that ceiling to be breached. This notion of size ceiling is also useful for studying changes in the sizes of polities.
We should also note that earlier research (Chase-Dunn et al., 2005) has shown that there is a positive cross-temporal correlation within regions of the sizes of the largest and second largest polities. This is of interest because polity size within regions is usually understood to be a zero-sum game. When one empire gets larger, other conquered polities necessarily get smaller or disappear as they are conquered by the expanding empire. But our research has shown that the largest and second largest polities in a region get larger and smaller during the same periods, which indicates that regions go through synchronous cycles of growth and decline in which the two largest entities are increasing and decreasing in the same periods. Less surprisingly, the same thing was found for large cities.
Explanations of rise-decline cycles, upsweeps and collapses
There are many theories about why systems of interacting polities experience cycles of rise and fall and upsweeps. 6 The most general theories are functionalist evolutionary approaches that explain the long-term emergence of complexity and hierarchy by means of learning processes that produce institutions as responses to selection pressures of various kinds (e.g. Lenski, 2005; Turner and Maryanski, 2008). Chase-Dunn and Inoue (2011) present an overview of theories of rise and fall, including the rise and fall of modern hegemons, and a synthetic model of the dynamics of polity growth that includes population pressures, circumscription, warfare, class struggles, and semiperipheral development. 7 We hypothesize that upsweeps of polity size have been mainly caused by the phenomenon of semiperipheral marcher states in which a recently founded polity out on the edge of a region of older core states conquers the other states and forms a core-wide empire. In order to test this hypothesis it is necessary to identify instances of empire upsweeps so that these can be compared with the many more frequent cases of upswings. The empirical identification of scale changes of polities in regional systems will also allow us to recognize cases of collapse for the purpose of testing Jared Diamond’s (2005) hypothesized causes of collapse. This article does not test hypothesized causes, but rather specifies and carefully applies the operations necessary to quantitatively identify the relevant historical instances of upsweeps and collapses and to compare these across five world regions.
Measurement issues: Territorial sizes of largest polities
Our research uses an important feature of human social organization that can be quantitatively estimated across cultures to identify upsweeps and collapses. 8 Determining scale shifts requires real metric (interval-level) estimates, not just periodizations of growth and decline. The quantitative feature that we use in this article is the territorial sizes of polities. 9 The territorial sizes of polities cannot be accurately estimated from archaeological evidence alone. What we want to know is the size of the area over which a central power exercises a degree of control that allows for the appropriation of important resources (taxes and tribute). The ability to extract resources falls off with distance from the center in all polities, and controlling larger and larger territories requires the invention of new transportation, communications and organizational technologies (what Michael Mann [1986] has called ‘techniques of power’). Military technologies and bureaucracies are important institutional inventions that make possible the extraction of resources over great distances, but so are new ideologies and new technologies of communication (Innis, 1972 [1950]).
Of course, territorial size is only a rough indicator of the power of a polity because areas are not equally significant with regard to their ability to supply resources. A desert empire may be large but weak. But this rough indicator is quantitatively measurable in different world regions over long periods of time, so it is valuable for comparative historical research.
Estimating the territorial sizes of states and empires is based on the use of published historical atlases. For the ancient and classical worlds these are based primarily on knowledge about who conquered which city, and whether or not and for how long tribute was paid to the conquering polity. Sometimes it is difficult to tell whether or not tribute is asymmetrical or symmetrical exchange. Only asymmetrical (unequal) exchange signifies a tributary imperial relationship. Otherwise it is just trade and does not signify an extractive relationship
Most of the large ancient and classical empires involved the conquest of territory that was contiguous with the home territory. But once naval power was taken up by tributary states an empire could conquer and dominate a client state that was far from its home territory, such as Rome’s control of areas on the south shore of the Mediterranean Sea. If these distant non-contiguous tribute-payers were small in number and size, not including them in the estimates of the territorial sizes of empires would not constitute a large error. But, as capitalism moved from the semiperiphery to the core, capitalist nation-states increasingly adopted the thalassocratic form of empire that had been pioneered by semiperipheral capitalist city-states 10 – control over distant overseas colonies. The modern colonial empires (British, French, etc.) require estimating the territorial sizes of colonies that are spread across the seas. The increasing institutionalization of the territorial boundaries of states makes this much easier than it was in the ancient and classical worlds in which polity boundaries were often quite fuzzy.
Not all maps in political atlases show the boundaries of territorial control. They may represent linguistic or religious groups or other distinctions that have little or nothing to do with state power. And maps may not have good time resolution. Our data on the territorial sizes of polities are mostly taken from the published articles of Rein Taagepera (1978a, 1978b, 1979, 1997), except that some estimates for South Asia have been added based on Schwartzberg (1992). 11
Ideally we would like to have a minimum temporal resolution of about every 25 years because we are studying the middle-run growth/decline phases of polities. When temporal resolution is poorer than every 100 years we could be missing some of the cycles of growth and decline. 12
Units of analysis: World regional PMNs and the Central Political-Military Network
We use the criterion of political–military interaction – the so-called Political/Military Network (PMN) – to bound regional world-systems. 13 This is an interaction network of polities that are making war and allying with one another. This is what international relations scholars call an ‘international system’. Four world-regional PMNs (Mesopotamia, Egypt, South Asia and East Asia) and the expanding Central PMN are studied in this article. 14 If there were comparable quantitative estimates of the largest polities with sufficient time resolution, other regions such as the Americas could be added, but so far these have not been located. The spatial boundaries of each of the world regional PMNs have been ascertained based on the rule of two indirect interactions from the center of the region’s heartland of settlements and polities. The Central PMN is bounded conceptually and spatially following David Wilkinson (1987). The Central System eventually came to include Europe, Central Asia, sub-Saharan Africa, Oceania, as well as the Americas and the four world regional PMNs we are also studying.
The Central PMN was born when the Mesopotamian and Egyptian state systems merged around 1500 BCE. 15 That interaction network continued to expand until it encompassed the whole globe in the 19th century CE. Each region was originally a separate PMN, and all these local systems were eventually incorporated into the Central PMN. The question we ask is: how big is the largest state in each interpolity interaction network? So we are not really studying individual states, but are rather studying the largest of these in each PMN, which is understood to be a temporally variable characteristic of the whole network of militarily interacting polities.
We focus on the largest polities in each regional PMN in order to produce the inventory of upsweeps. Each of the world regional PMNs is understood in world-systemic terms as including all populations that were militarily interacting with the heartland of large settlements and states. So, for example, Mesopotamia includes the Susiana Plain in Iran and the nomadic peoples in surrounding mountains and deserts who were interacting with the Mesopotamian cities and states. East Asia includes what became China, Japan, Korea and all the sedentary and nomadic populations that interacted with these urbanized areas. Those Central Asian empires that repeatedly conquered the East Asian heartland of cities were important parts of the East Asian PMN.
Counting cycles and upsweeps
What follows is a set of five graphs that show our plots of largest polity upswings and downswings in four regional PMNs and in the expanding Central PMN. We not only want to identify instances in which upsweeps and collapses occurred, but we want to count how many occur over time so that we can compare frequencies across regions. 16
Our counts employ the following rules:
A cycle is a sequential upswing and downswing in the size of the largest polity. A sequence of two data points at the same level (a ‘flat’) is treated as a continuation of the upward or downward trend that preceded it. The determination of whether or not an upswing or downswing should be counted as an upsweep or downsweep can be done in different ways depending on how the comparison with earlier peaks and troughs is done. For our counts we use the average of the previous three peaks when that many data points are available. But we have also done the counts using the highest of the previous three peaks, and those results are included in the Appendix 17 to this article. It should also be noted that, because we are looking at the largest polity in each PMN, an upsweep may be carried out by a combination of states and empires. If a certain state starts to increase its size (e.g. the Shang dynasty in Bronze Age China) but then is passed by another state (e.g. the Western Zhou dynasty) both of these may be thought of as having contributed to a ‘composite upsweep’.
We also want to evaluate the hypothesis that the rate of cycles may have increased over time, but in order to do that we need keep in mind that the accuracy of our data also gets better as we approach the present. An apparent increase in the frequency of cycles or upsweeps might be due to decreasing error over time rather than real change in the rates. We present a subsample analysis in the Appendix to estimate how much error there may be in our Bronze Age data sets. Even when reducing each region’s sample to the same number of estimates and temporal resolution, the frequencies of cycles and upsweeps are fairly close to the main results.
We begin our consideration of polity sizes in the Mesopotamian regional PMN in 2800 BCE. The largest polities at this time were quite small in comparison to the huge empires that emerged in later millennia. The first available size estimates for this region come from Henry Wright’s (2006) inventory of early states, but Wright is estimating the area of cultivation, not the area from which these polities were extracting resources by means of power. Based entirely on archaeological evidence, Wright reports a first-generation primary state called Susa (Shush), c. 3500 BCE, that is estimated to have been more than two and a half times the size of an earlier paramount chiefdom on the nearby Deh Luran Plain called Urua, c. 4500 BCE in terms of the area under cultivation. We suspect that this constituted an upsweep but we do not count it because we are studying the area under political control, which is generally larger than the area under agricultural cultivation.
The city-state of Uruk (Warka) extracted agricultural products and tribute from a large area as it grew in size during the Uruk period (c. 4000–3000 BCE) and Early Dynastic period (c. 2900–2350) (Algaze, 1993). Unfortunately, the lack of documentary evidence makes estimates of its area of control difficult, resulting in a large range of values that vary by method of estimation. The Uruk empire was complex because Uruk established settler colonies of traders in distant towns and cities that were not under its political control. Given the lack of a firm estimate of the size of territorial control by the Uruk empire, we have not included Uruk in our polity data set for this project. 18
Ur, a second-generation early state, appears in the southern Mesopotamian region around 2900 BCE (Wright, 2006), followed by the city-state of Kish in 2800 (Taagepera, 1978b). The next upsweep in the region occurred beginning around 2500 BCE when an older core city-state achieved control over adjacent core city-states to form a relatively unified polity commonly known as Lagash. Soon thereafter the much larger Akkadian Empire was formed when Sargon of Agade, having first taken control of Kish, conquered Lagash and a huge adjacent territory (Yoffee, 2006).
Counting upswings and cycles is important, because we want to know how regional networks may be similar or different with regard to the number of upswings and cycles per year, and the number of upswings per upsweep. We include upsweeps in the counts of upswings. In other words, upsweeps are a subset of upswings.
In Figure 3 there are three upsweeps (indicated by the ovals around data points) between the earliest point at which we have estimates of the territorial sizes of polities in 2800 BCE and 1450 BCE. The Mesopotamian and Egyptian PMNs began merging in 1505 BCE (see note 15) but the composite upsweep carried out jointly by Babylon and Mitanni did not reach its apogee until 1450 BCE. We include it in the upsweeps count for Mesopotamia. The units on the vertical axis are square megameters (MM2) of territorial size, one of which is a million square meters. The three upsweeps are: Lagash (.05 in -2400) the much larger Akkadian Empire (0.80 in 2250 BCE) and Babylon/Mitanni, which peaked at 0.3 MM2 around 1450 BCE. Recall our definition of upsweeps: a point that is more than a third larger than the average of three previous peaks. We do not have estimates of three earlier peaks for the Lagash case but are relatively confident that there were no earlier polities of a similar size in the region.
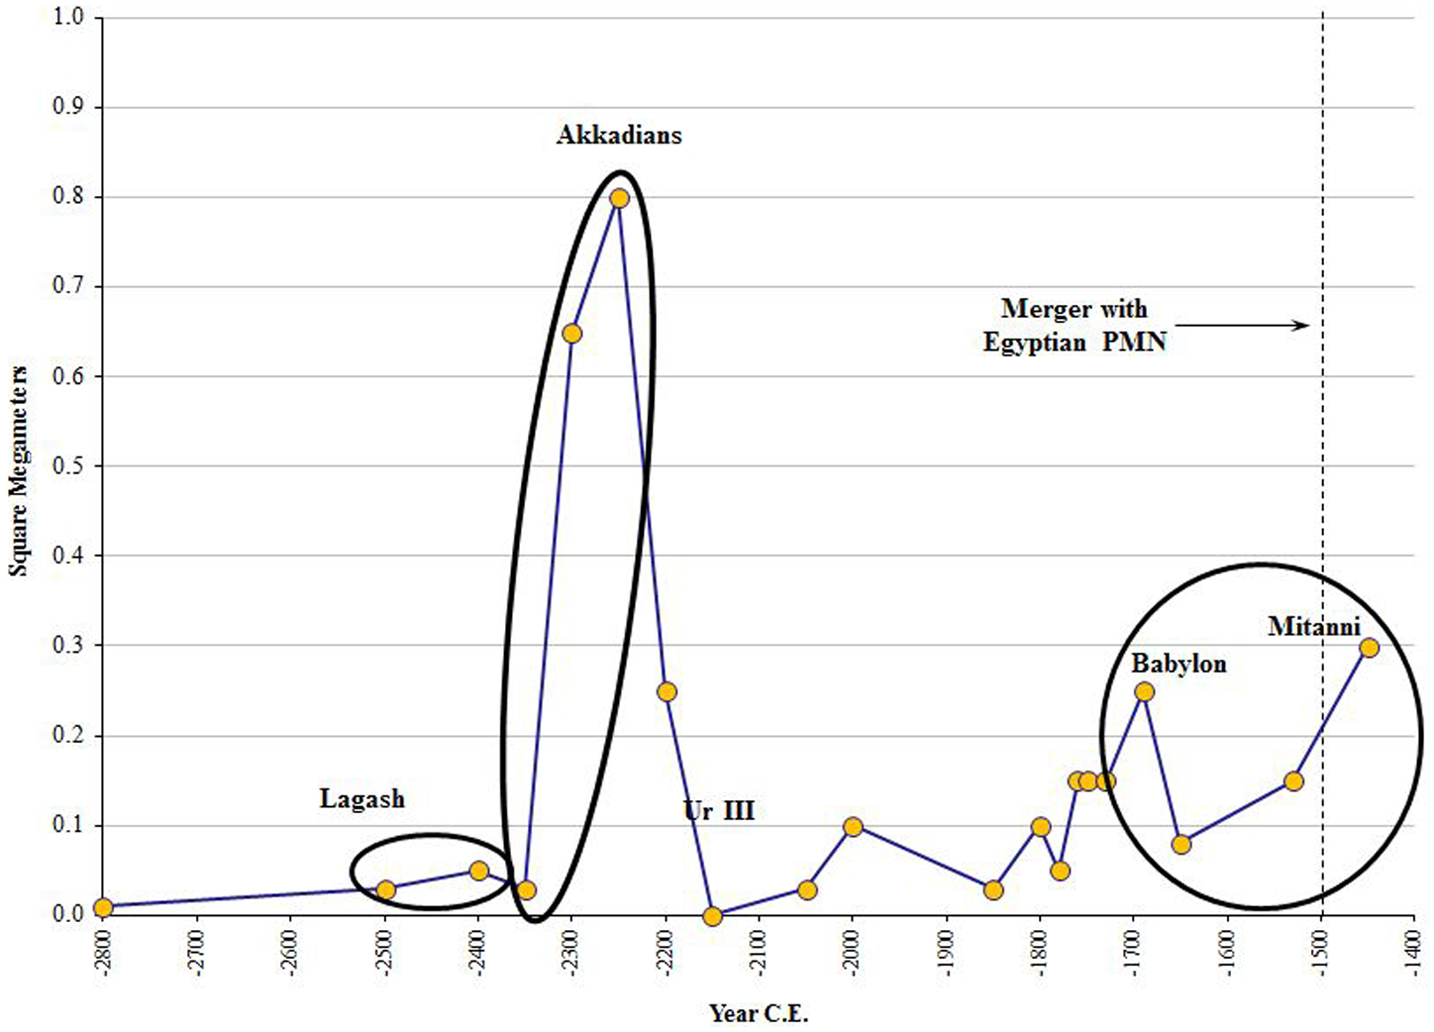
Largest polities in the Mesopotamian PMN, 2800 BCE–1500 BCE.
The Akkadian Empire was huge, but brief. We use the term ‘upsurge’ to indicate such an event, because it was a long while before later empires of comparable size were to emerge. 19 Yet the equilibrium size of polities revealed by subsequent peaks after the Akkadian Empire was larger than it had been before. The Akkadian upsweep was an upsurge. Following the demise of the Akkadian Empire, there was a steady increase in the size of empires, from the Third Dynasty of Ur peaking in 2000 BCE at 0.10 MM2, through the Babylonian Empire, which peaked at 0.25 in 1690 BCE, to Mitanni at 0.30 in 1450 BCE. However, none of these empires approached the size of the Akkadian Empire. What happened after the Akkadian Empire should not be considered a long-term systemic collapse because the upsweep of the Akkadian Empire had not established a new high equilibrium. A systemic collapse is more than a downsurge that follows a dramatic upsurge. A systemic collapse is a downward sweep in a system that has established a high equilibrium and that stays down for an extended period. The Mesopotamian system did not stay down after the Akkadian Empire. It began recovering very quickly. In Figure 3 we count three upsweeps and six upswings, one for each of the peaks, in the Mesopotamian region. And we count five downswings, one of which is a downsweep, but not a systemic collapse.
Figure 4 shows the largest states and empires in the Egyptian PMN from 2850 BCE to 1400 BCE. We do not use Taagepera’s (1978b) earliest estimates from 3200 BCE to 2900 BCE because there is no documentary evidence from ancient Egypt regarding the territorial size of the First Dynasty. We also stop counting at 1500 BCE when the Mesopotamian and Egyptian PMNs began merging to become the Central PMN (see note 15). Figure 4 also shows the years between 1500 BCE and 1400 BCE so that we can see what happened with the upsweep that had begun just before 1500 BCE. The 18th Dynasty upsweep that peaked in 1400 BCE is included in the Central System count in the next section. Thus there were three polity upsweeps (enclosed in ovals) and four upswings (cycles) between 2850 BCE and 1500 BCE. 20 And there were four downswings, one of which was a downsweep, but not a systemic collapse.
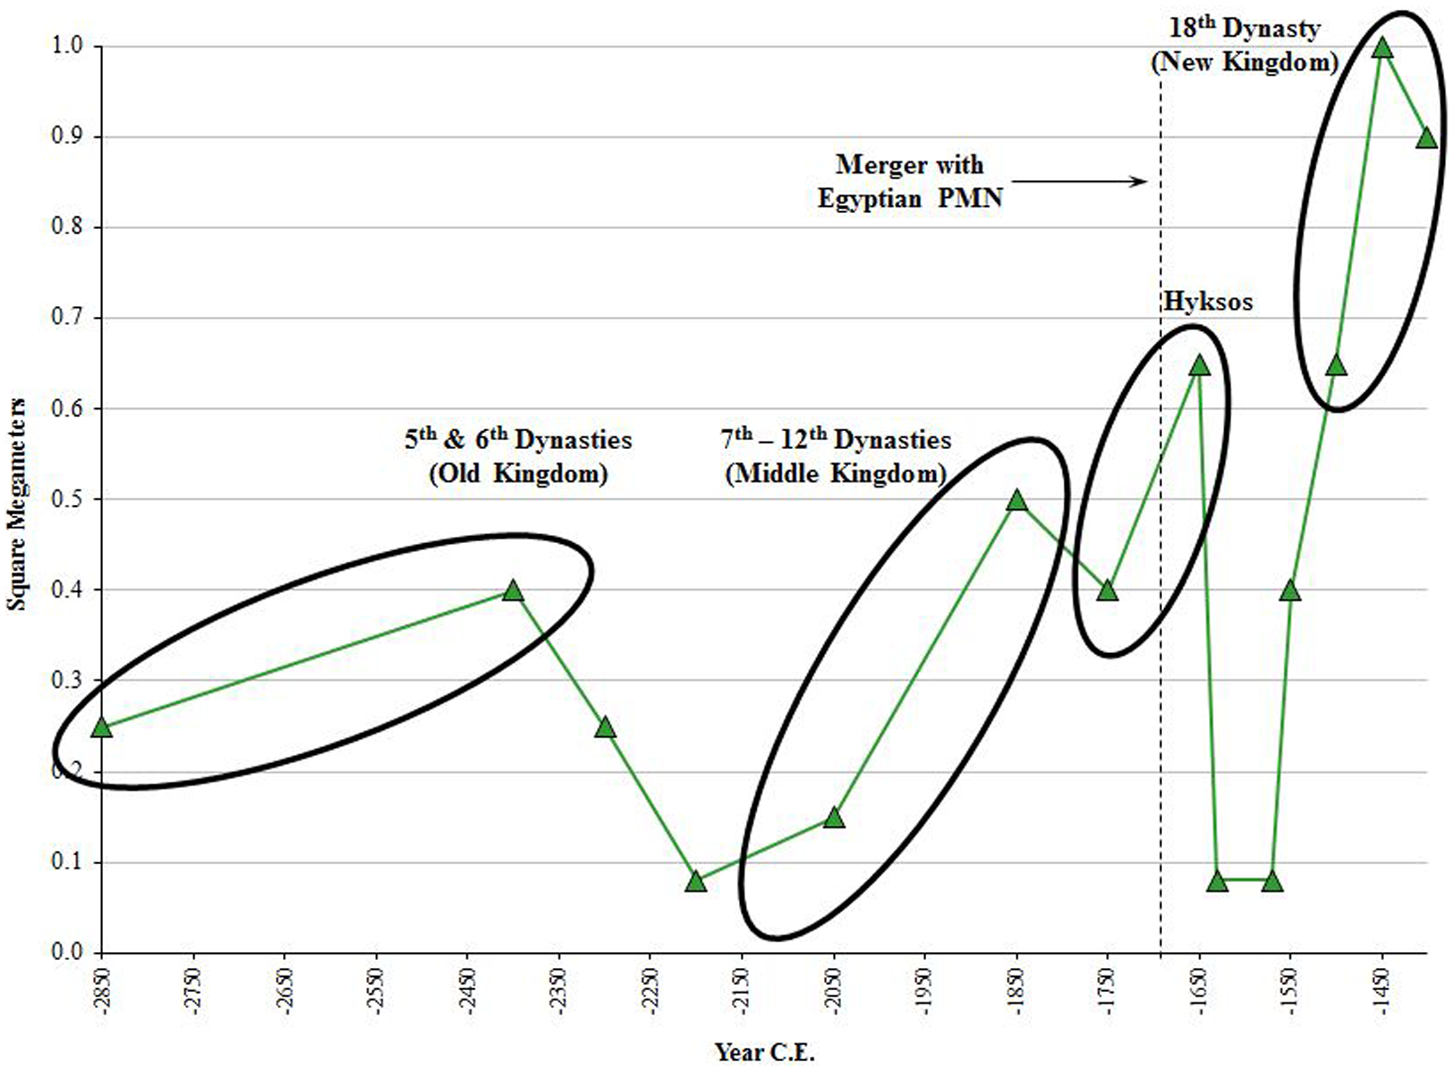
Largest states and empires in the Egyptian PMN, 3200 BCE–1500 BCE.
Figure 5 shows the 27 polity size upswings (cycles) and seven upsweeps from 1500 BCE to 2000 CE that occurred in the Central System. Again, the units on the vertical axis are square megameters of territorial size. The Roman case might be called a recovery rather than a polity upsweep because the earlier Persian Empire had been as large. But we will still designate Rome as an upsweep because, though it was part of the same political/military network that Persia had been in, it was in a substantially different location than the earlier Persian and Alexandrian empires had been. The rise of Rome constituted a shift of the core of the old West Asian/Eastern Mediterranean system toward the West, with a new ‘great power’ emerging on the Italian peninsula. Rome meets our criterion of being at least a third larger than the average of the three prior peaks. It would appear that all of the upsweeps except the 18th Dynasty in Egypt were the result of semiperipheral marcher conquests. The Neo-Assyrians, now dominated by an Amorite ruling class, radically changed the commercial strategy of the Old Assyrian city-state into a very successful campaign of conquest. The Achaemenid Persians are said to have been originally pastoralist nomads from Central Asia who conquered the entire core region of Western Asia and some of the Eastern Mediterranean (from Bactria [Afghanistan] to Egypt). Alexander was from semiperipheral Macedonia, and the Romans were Latin farmers living in the shadow of Etruscan cities on the Italian peninsula. 21
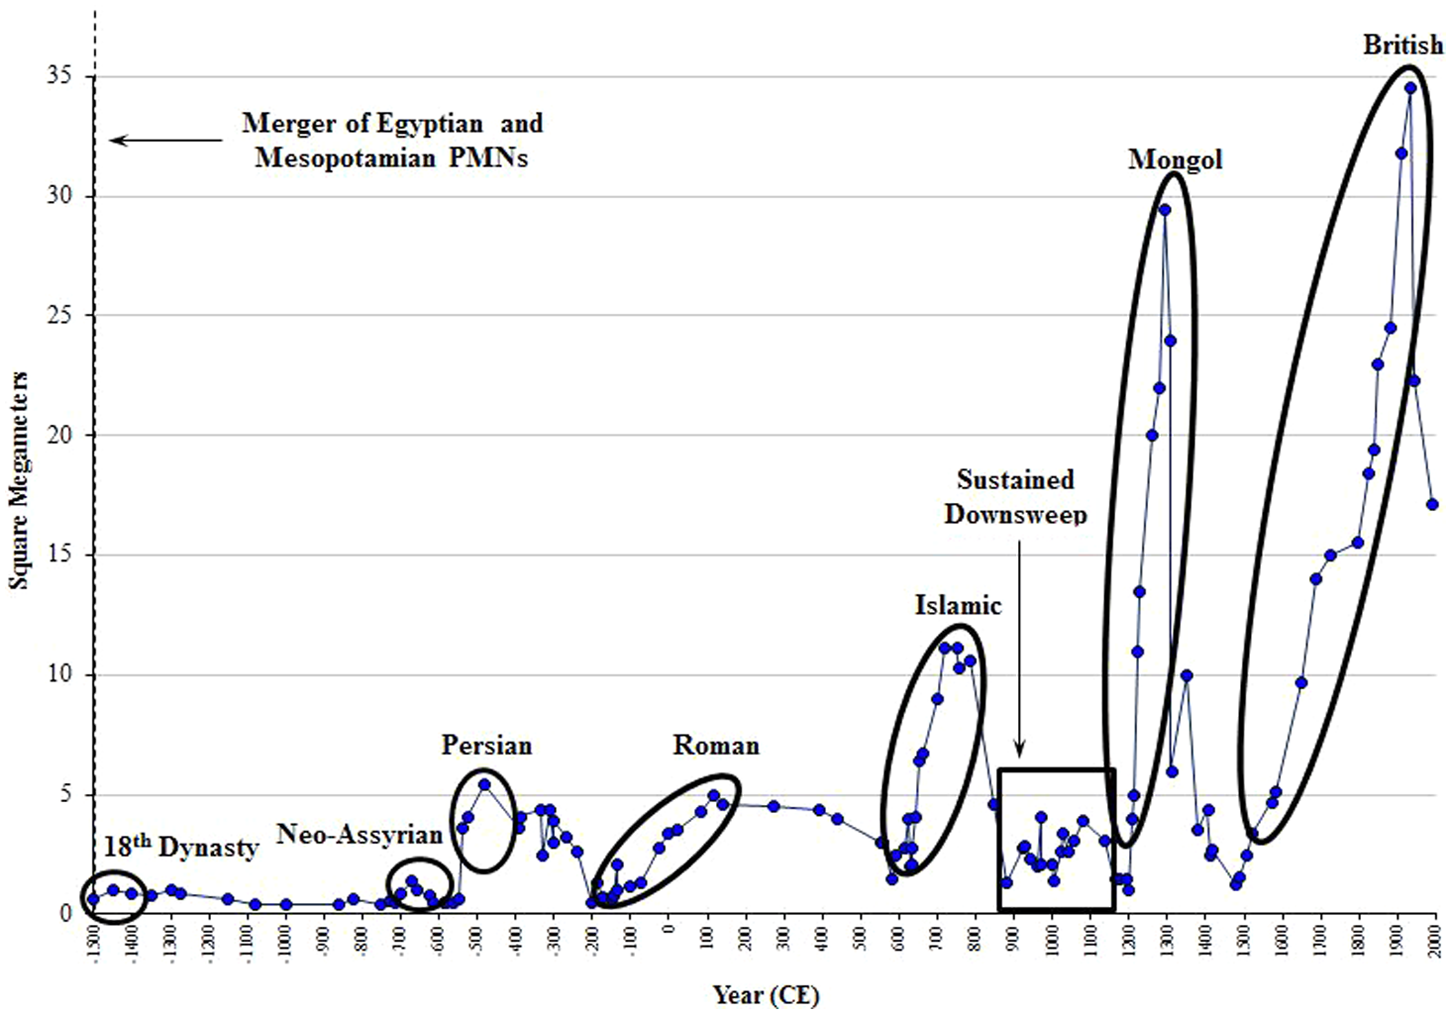
Largest empires in the Central System, 1500 BCE–2000 CE.
We have included the Mongol Empire in Figure 5 even though it emerged in Central Asia, more on the edge of the East Asian PMN than on the edge of the Central PMN. However, a polity that conquers some of the heartland of a PMN should be included in that PMN. Central Asia played an important role in the developing connections between East and West both because of the Silk Roads trade routes and because Central Asian steppe nomads repeatedly formed huge military confederacies that attacked and sometimes conquered the agrarian civilizations of both the East and the West. Arguably, the Mongol steppe confederacy was a peripheral marcher state, not a semiperipheral marcher state. 22 The British Empire, a modern semiperipheral capitalist nation-state that rose to hegemony, was the largest sovereign polity that has yet emerged. 23
There were 27 downswings in the Central PMN from 1500 BCE to 2000 CE, seven of which were downsweeps. The downsweep that followed the rise of the Islamic caliphates should be considered a systemic collapse because it did not soon recover. The largest polity size oscillated around a rather low level for 300 years between 900 to 1200 CE.
Figure 6 shows the territorial sizes of the largest polities (states and empires) in the East Asian PMN from 1300 BCE to 1950 CE. 24 There were 19 upswings (cycles) and eight upsweeps in the East Asian PMN during the period from 1300 BCE to 1830 CE. The first upsweep in East Asia may have been that of the somewhat mythical Xia Dynasty (for which Taagepera [1978a] provides a size estimate). But we do not use Taagepera’s estimate because there is no documentary evidence that allows for the reliable estimation of the territorial size of the Xia dynasty. Archaeological excavations show that there were sizable chiefdoms or early states in the region where the Xia dynasty is said to have been located but archaeological evidence alone does not tell us how much territory these polities controlled. The Xia dynasty was followed by a composite upsweep carried out by both the Shang and the Western Zhou Dynasties (Huang et al., 2003) for which we have evidence based on the earliest known Chinese writing on oracle bones.

Largest polities in the East Asian PMN, 1300 BCE–1830 CE.
The Shang portion of the upsweep peaked during the early Upper Erligang archaeological phase (estimated as 1510–1450 BCE), with Zhengzhou as its largest central place (Liu and Chen, 2003). The Western Zhou enlarged its size to its peak around 1050 BCE right after conquering the Shang dynasty. Shang oracle-bone inscriptions provide evidence that the Zhou originally came from the Fen River valley in Shanxi Province (Shaughnessy, 1999). This supports the idea that the Western Zhou was an instance of a semiperipheral marcher state (see also Huang et al., 2003). The Western Zhou dynasty then sustained itself for a relatively long period (275 years), establishing the roots of bureaucratic governance that became a hallmark of later Chinese states (Shaughnessy, 1999).
The second upsweep shown in Figure 6 is that of the Xiongnu. The Xiongnu were Central Asian conquerors that scholars long believed to be the same people who were known as the Huns in the West. But the Huns that sacked Rome were steppe pastoralist nomads who spoke a Gothic language and were active between 300 CE to 600 CE in Ukraine and East Europe. The Huns were not the same people as the Xiongnu in spite of being called by a cognate name. The Xiongnu spoke a unique language and lived in what is now northwest China. Their empire eventually had a capital city with settled agricultural people living near it.
The Western Han Empire (also known as the Former Han) was established by conquest of the Qin Dynasty’s land. The Han capital was located at Xi’an in the west. They carried out a huge expansion from 140 to 120 BCE, conquering most of what is now Xinjiang and Gansu Provinces. By 25 CE the Han had resurged and restored their dynasty following an unstable period that began with a coup in 9 CE, and they moved their capital east to Luoyang thus forming the Eastern Han Dynasty (also known as the Later Han).
The first 70 years of the Later Han was a time of recovery and reassertion of imperial power, and they restored control over some of the lands that had been lost. But during the second century CE Han court politics was in disarray and the central state became weak (Ebrey, 1996 [2010]).
As Figure 6 indicates, the Mongol Empire was a huge upsurge with its extraordinarily rapid growth and decline. The Qing Dynasty upsweep was more than a third larger than the average of the three previous peaks.
Most of these East Asian upsweeps were due to the actions of either semiperipheral or peripheral marcher states. The Xiongnu were probably originally Central Asian horse pastoralist nomads, very similar in many ways to the later Mongols. The Turks (GÖk Turks) were also from Central Asia but they were originally herding hill people from the Altai Mountains who specialized in mining and metallurgy. They became an important skilled ethnic minority in the Central Asian Rouran Empire, took over that state, and then led several expansive conquests toward both the east and the west (Chase-Dunn et al., 2006). And of course the Manchus who built the Qing Dynasty were originally northern forest people.
There were 18 downswings, six of which were downsweeps. Only one of these should be considered a systemic collapse. That is the period after the demise of the Eastern Han dynasty. There was a 400-year period of relatively small states before a recovery began.
Figure 7 shows the largest states and empires in the South Asian PMN from 420 BCE to 1050 CE. The Indus River valley (now Pakistan) had contained a large and complex Bronze Age civilization with large cities (Harappa and Mohenjo-Daro). Obviously this was an earlier South Asian upward sweep, but we do not have quantifiable estimates of the sizes of Harappan polities in the Indus Valley. As we have said above, archaeological evidence alone is not a sufficient basis for estimating the territorial sizes of polities, and the Harappan writing has not yet been deciphered.
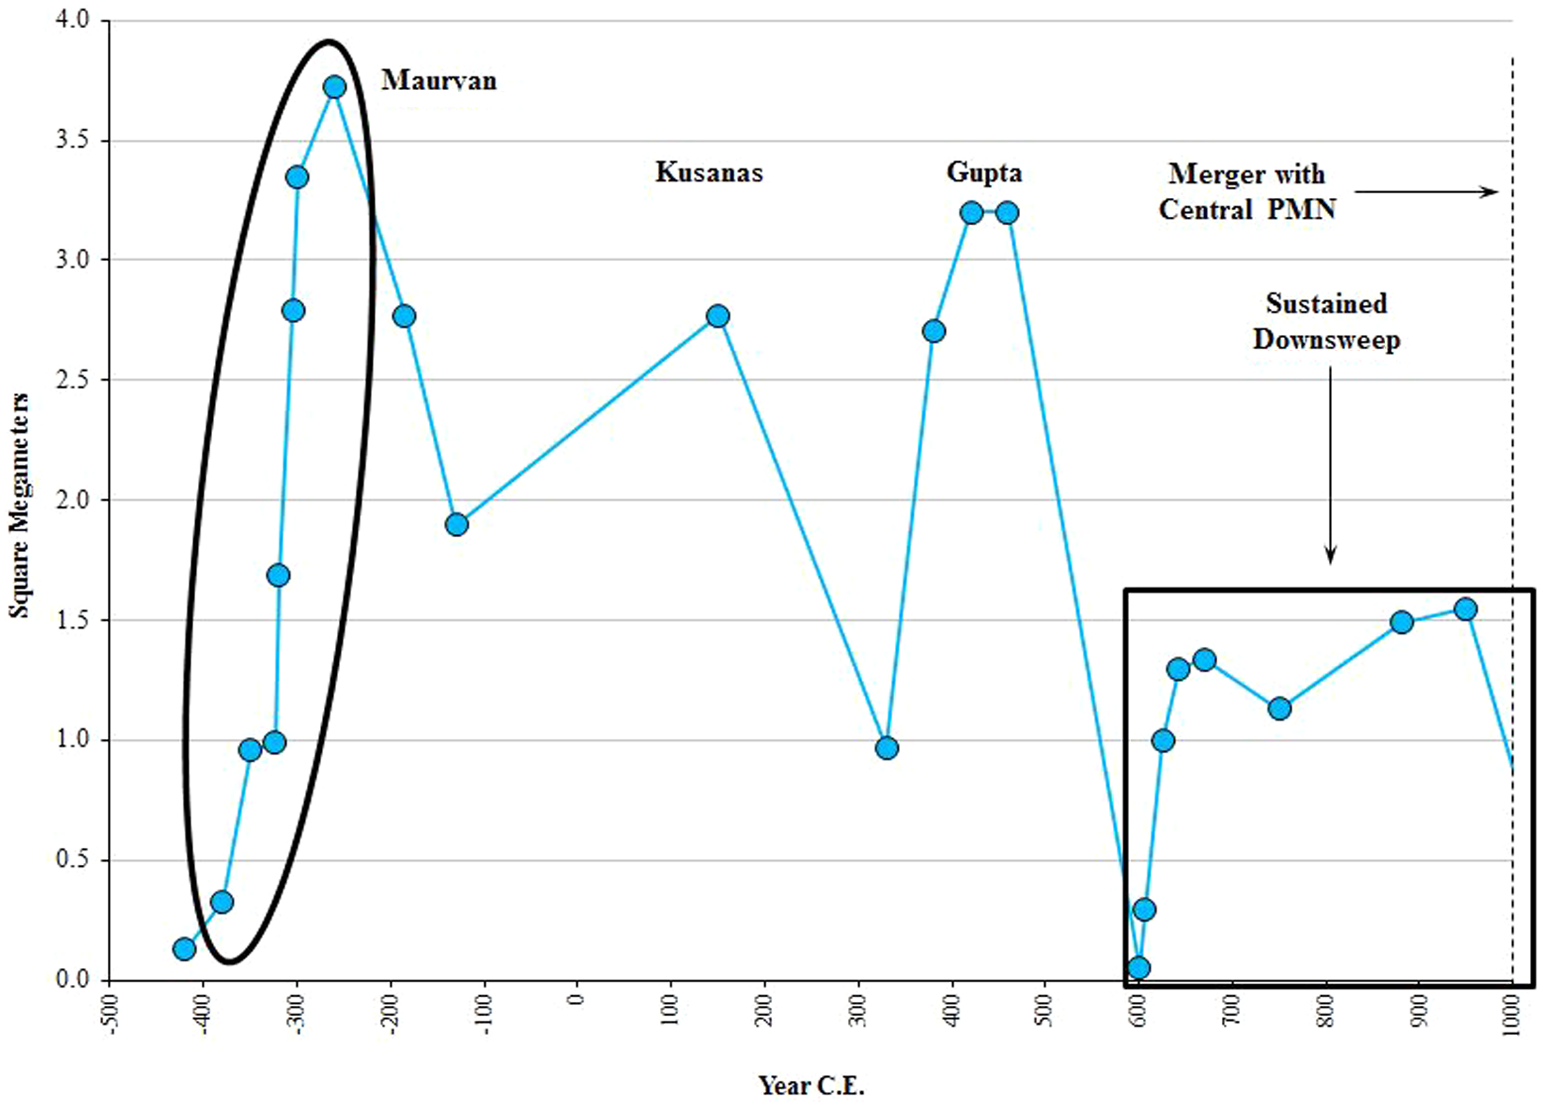
Largest states and empires in the South Asian PMN 420 BCE–1008 CE.
The final linking of the South Asian PMN with the Central PMN was begun by the incursion of Mahmud of Ghazni in 1008 CE. Alexander of Macedon’s earlier incursion in the fourth century BCE had been a temporary connection between the Central and the South Asian PMNs that ceased after the Greek conquest states in South Asia had been expelled. The connection was made permanent by the conquests of Mahmud of Ghazni.
We extended Taagepera’s estimates back from 620 CE to 420 BCE by estimating the territorial sizes of states using maps in Schwartzberg (1992). 25 Figure 7 shows only one upsweep. The Mauryan Empire at its peak in 260 BCE was nearly as large as the Mughal Empire at its peak in 1690 CE, 950 years later. There are five upswings and one upsweep in the South Asian system, and five downswings, four of which were downsweeps. The large downsweep following the demise of the Gupta Empire in 460 CE must be considered a systemic collapse because the recoveries were small and weak, and the largest polity size in the South Asian system did not really recover until the rise of the Delhi Empire in 1312 CE, 852 years later. This is the longest of the three systemic collapses we have found.
The South Asian sequence is rather unlike other regions because of the long period of political decentralization following the fall of the Gupta Empire. This long trough in the sequence of rise and fall is the main reason why South Asia is out of synchrony with the periodicity of both Eastern and Western empire cycles (Chase-Dunn et al., 2000). The South Asian system also displays a very high ratio of downsweeps to downswings.
The Mauryan Empire was not a semiperipheral marcher state, but it was stimulated by the invasion of South Asia by Alexander’s armies. The Mauryans basically re-conquered South Asia and then held it when the Greek Seleucids tried to get it back. This was a nativist re-conquest in response to a semiperipheral marcher invasion from a neighboring PMN. The later Mogul Empire of South Asia was a creation of Central Asian Moslems who were descended from Genghis Khan and Tamerlane and who brought Persian culture to South Asia when they conquered it. This was another semiperipheral marcher conquest.
Table 1 shows the counts and frequencies for the polity upsweeps and the number of upswings for each PMN. We counted a total of 22 polity upsweeps and 59 upswings (cycles). The average years per upsweep across all the five regions is 640. The number of years per upsweep varied from 391 for East Asia to a high of 1428 for South Asia. The average number of years per cycle across these five regions was 231, with a low of 130 for the Central PMN and a high of 337 for Egypt.
Counts of polity size upswings (cycles) and upsweeps in five PMNs

The South Asian PMN is the outlier in Table 1. This will be discussed below after we look at the analogous numbers for downswings and downsweeps, as will the issue of comparisons between the Central and East Asian PMNs.
Table 2 shows that we found 58 downswings, nineteen of which were downsweeps, and three of those were systemic collapses. 26 South Asia had the highest frequency of downsweeps and the highest ratio of downsweeps to downswings. Table 1 and Figure 7 above show that South Asia had only one upsweep during the whole 1428-year period studied.
Counts of polity size downswings (cycles) and downsweeps in five PMNs

Comparing Tables 1 and 2 reveals some interesting differences across regions. Overall, there were almost as many downsweeps (19) as upsweeps (22). Mesopotamia, Egypt and East Asia had more upsweeps than downsweeps (3/1; 3/1; and 8/6). The Central System had the same number of upsweeps and downsweeps (7/7); and South Asia had more downsweeps than upsweeps (1/4). And these correspond with similar differences across regions in the average number of years per upsweep versus the average number of years per downsweep. 27
Regarding collapses, when sets of interacting polities (international systems) are studied instead of individual polities we find that there were only three sustained collapses: the post-Islamic Caliphate collapse in the Central System, the post-Eastern Han collapse in East Asia, and the post-Guptan collapse in the South Asian system (see Figures 5–7). A number of scholars have criticized Jared Diamond’s characterization of collapses in the places he studied (e.g. McAnany and Yoffee, 2010). It is true that the long-term trend of human social evolution has been one of expansion, but our quantitative study shows that there have been a few rather lengthy system-wide interregnums in which large polities did not recover for centuries. 28 The longest measurable collapse was the post-Guptan in South Asia (852 years). The difficult geography of the southern part of South Asia is often mentioned to explain the inability of Ganges Valley states to conquer and govern there. But these difficulties were overcome by both the Mauryan and the Moghul Empires, so they cannot be the only explanation for the long interregnum in South Asia.
East/West comparisons
The most famous comparison in the literature about sociocultural evolution is between East Asia and the West, which usually means Europe. Because we focus on the largest polities our Central PMN starts in the old West Asian/Eastern Mediterranean core and then moves west, eventually landing in Europe (see also Morris, 2010). Of course most of the literature on East/West comparisons compares China with Europe rather than the East Asian PMN with the Central PMN because it was Europe that eventually rose to hegemony over the rest of the world. But Europe did not become the core of the Central System until the last several centuries. With the exception of Rome, the large states and cities of the Central PMN were located in the old West Asian/Eastern Mediterranean core (Morris, 2010). So our comparison between the East Asian and Central PMNs is only partly germane to the large comparative literature on East/West (European/Chinese) similarities and differences.
We now compare the Central and East Asian PMNs with regard to the frequency of polity cycles, upsweeps and downsweeps shown in Tables 1 and 2. The number of upswings (cycles) per year in the two regions were rather similar (Central System: 130; East Asia: 184). We interpret greater frequencies of cycles of rise and fall as implying less stability. The lower frequency of cycles in the Central System is not congruent with the general impression held by many analysts that the Western interstate system was relatively more volatile than the Eastern interstate system (e.g. Hui, 2005; Scheidel, 2009). The polity upsweep rates (average number of years per upsweep) are also rather similar (Central System: 500; East Asia: 391). The greater frequency of upsweeps in East Asia also contradicts the general view that the East Asian system was relatively more stable. And regarding the ratios of upsweeps per upswing, the Central System has 0.26 and East Asia has 0.47, so there were more upsweeps per upswing in the East than in the West. Again this contradicts the idea of a relatively more stable system in the East than in the West. Regarding the number and frequencies of downswings and downsweeps (Table 2) the Eastern and Central PMNs were quite similar.
These findings mainly support the idea that the Central and East Asian interstate systems had rather similar dynamics despite the vast literature about the many important differences between these systems. The cycles of rise and fall and the numbers of upsweeps and downsweeps were rather similar in the two regional PMNs. 29 To the extent that the differences we have found are significant, they suggest that the Eastern PMN had somewhat more frequent and larger changes than did the Central PMN, which is contrary to many characterizations of the Eastern PMN as having been more stable. It is likely that the Eastern size distribution of polities may have been steeper on the average than that of the Central PMN because, when China was unified, it was much larger than the other states in the East Asian PMN (Korea, Japan, etc.). This likely difference in the size distribution, however, did not result in a more stable interstate system.
Changing rates of change?
It is obvious that social change has speeded up over time if we look at the rate of technological development since the Stone Age. But have the frequencies of cycles and sweeps in the size of polities speeded up? In order to examine this question we divided the time periods for which we have data on the largest polities into five equal intervals for each of the regional PMNs we are studying, and we counted the number of cycles and the number of upsweeps and downsweeps for each of the intervals. The results are shown in Table A2 in the Appendix.
There is some support for the hypothesis that the frequency of cycles increased over time. The frequency of Mesopotamian cycles increased from 0.5 in the first interval to 1.5 in the last interval, and Egyptian cycle frequencies also showed an upward trend, (0.5 to 2). The Central System experienced a cyclical upward trend in the cycle frequencies (2.5, 8.5, 2, 10, 4) and the East Asian PMN also displayed a mixed upward trend (1, 1.5, 3.5, 8, 3). The cycle frequency of the South Asian PMN did not increase (1, 0.5, 1, 1.5, 1). These results are not as clear as they might be, but they do favor an interpretation of cycle frequency speed-up.
Regarding the issue of changes in the frequency of upsweeps, we find the following: Mesopotamia (0, 1, 1, 0, 1); Egypt (0, 1, 0, 1, 1); Central (1, 2, 1, 1, 2); East Asian (1, 2, 1, 2, 2), and South Asian (1, 0, 0, 0, 0). Mesopotamia shows a slight increase, but the others are mixed. So there is no support for the proposition that the frequency of upsweeps increased over time. Since these upsweeps are arguably very important events that constitute the evolution of larger and more complex governance institutions, the absence of a long-term speed-up is somewhat surprising.
Regarding the issue of changes in the frequency of downsweeps, our results are also mixed but somewhat favor the notion of an increasing rate over time. The Mesopotamian pattern is (0, 0, 1, 0, 0). The Egyptian pattern is (0, 0, 0, 0, 1). The Central System shows (0, 2, 0, 4, 1). The East Asian system shows (0, 1, 3, 2, 0). And the South Asian PMN shows (0, 1, 1, 1, 1).
Our results suggest that the cycle frequency has increased over time, but not the upsweep rate. The results for the downsweep rate favor a small speed-up, but only weakly. There is no support for the idea that resilience, as indicated by the reduced frequency of downsweeps, has increased with sociocultural complexity and size.
An earlier investigation examined the relationships between urban and empire cycles (Chase-Dunn et al., 2005) but that study did not consider the issue of scale upsweeps. Do city size upsweeps tend to follow rather than precede empire upsweeps, as we would expect based on the notion that it was large empires that constructed large capital cities? Our study of urban upsweeps (Inoue et al., submitted) shows that eight out of 18 urban upsweeps directly followed, and were caused by, upsweeps in the territorial size of an empire.
The identification of upsweeps and collapses with quantitative data provides a specification of those historical events that must be explained by theories of sociocultural evolution. In this article we find some preliminary support for the hypothesis of semiperipheral development, but a more focused and in-depth study of the upsweeps cases is required before this can be confirmed. 30 The results so far support the hypothesis of semiperipheral development as instanced by a large number of polity upsweeps that were carried out by semiperipheral marcher states. This implies that interacting systems of polities rather than single polities (or societies) are the necessary unit of analysis for explaining sociocultural evolution because interpolity relations have been a main cause of the development of complexity and hierarchy. The research design we develop in this study provides a comparative framework in which propositions about the main causes of increases in size and complexity can be evaluated by means of formal comparisons across a set of separate world-systems–cross-world-systems analysis.
Footnotes
Acknowledgements
This research was supported by National Science Foundation Grant #: NSF-HSD SES-0527720. Thanks to David Wilkinson, Peter Turchin, Richard Niemeyer and Oswin Chan for help with this research.