
Abstract
Putnam argued that the different levels of social capital between the North and the South of Italy originated in the Middle Ages. In the North of Italy, the existence of a dense network of medieval towns gave rise to horizontal ties and collective action. Conversely, in the South of Italy, the authoritarian Norman rule generated hierarchical relationships and the absence of collective action. This article proposes an alternative explanation for the lack of social capital in the South of Italy using a comparative perspective. The analysis is undertaken in two steps: 1) testing the socio-economic determinants of social capital in 85 European regions; 2) performing a comparative historical analysis between deviant – that is, South of Italy and Wallonia – and regular – that is, North East of Italy and Flanders – cases. These cases are selected by looking at the residual of the regression model. The results suggest that medieval history does not explain the lack of social capital in the South of Italy. On the contrary, the historical legacy mitigates the negative effect of inequitable income distribution, low labour market participation and weak national cohesion on social capital.
Introduction
Putnam explained the lack of social capital in the South of Italy 1 in terms of its pluri-centennial historical legacy. According to his hypothesis, on the one hand, in the North of Italy, the existence of a dense network of medieval towns was conducive to the creation of horizontal ties and collective action. On the other, in the South of Italy, the absolute and authoritarian Norman rule contributed to the prevalence of hierarchical relations and the absence of collective action. By integrating socio-economic and historical analyses in a comparative perspective, this article proposes an alternative explanation for the lack of social capital in the South of Italy.
Putnam assumed that the lack of social capital in the South of Italy was the product of an historical anomaly. Therefore, the first step of this analysis is to test the determinants of social capital in a wider European context, notably in 85 Western European regions. In a second analytical step, Putnam’s explanation for the lack of social capital in the South of Italy is challenged on the basis of a comparative historical analysis directly linked to the regression model.
The regression model shows that income inequality, labour market participation and national divergence are important factors in explaining the regional variation in social capital. In addition, it points to a clear pattern across all the European regions: where social capital scores are below average, the residuals 2 tend to be negative, indicating that social capital scores are lower than we would expect from the socio-economic predictors. Conversely, where social capital scores are above average, the residuals tend to be positive, indicating that social capital scores are higher than we would expect from the socio-economic predictors.
In this context, the South of Italy deviates from the general pattern identified by the regression model because a low social capital score (the lowest level across the regions analysed) is accompanied by a positive residual. The concomitance of low social capital and positive residuals indicates that, according to its socio-economic conditions, the South of Italy should have even lower levels of social capital than currently detected. These findings suggest that the relationship between the socio-economic determinants of social capital in the South of Italy and the mediating effect of history needs to be interpreted in a new light.
The question is explored by means of a comparative historical analysis between the South of Italy and Wallonia, which shares similar characteristics, and the North East of Italy and Flanders. 3 These two regions are selected as comparators because they share with the South of Italy and Wallonia common institutional frameworks and positive residuals 4 but display better socio-economic conditions and higher social capital scores. After reviewing the state of the art of social capital literature and providing a definition of social capital, the article discusses the mixed method approach adopted to explore the lack of social capital in the South of Italy and explores the findings from a comparative perspective.
State of the art and definition of social capital
The concept of social capital enabled Putnam (1993) to rediscover traditional elements of sociological theory and revive the very old debate on the questione meridionale (the Southern Question) (Bevilacqua, 1993; Moe, 2006; Salvadori, 1977). Putnam generated tremendous interest among politicians and the general public by transforming social capital from an academic concept (for an early formulation, see Hanifan, 1916) to a ‘practical tool’ to Make Democracy Work.
Social scientists from different disciplines propose a wide range of definitions and methodologies for measuring social capital (for a review, see Adler and Kwon, 2002). So, the definition and measurement of this concept remain contentious issues. For this reason a new definition is not tendered. Instead, for ease of comparison, the analysis is based on Putnam’s original formulation (Putnam, 1995: 67). His definition of social capital as the sum of informal social networks, formal social networks and social trust is rooted in traditional sociological theory.
The informal social networks dimension captures Tönnies’s Gemeinschaft (1955) and Durkheim’s idea of mechanic solidarity (1893), and is measured by evaluating the strength of family and friendship ties. The formal social networks dimension on the other hand, encompasses Tönnies’s Gessellschaft as well as Durkheim’s idea of organic solidarity, and is measured by evaluating the density of membership and level of participation in formal associations. The social trust dimension captures the idea that social relations are fostered and encouraged by an environment in which citizens trust one another, trust their institutions and participate actively in the political debate.
The founding fathers of sociology made a distinction between formal and informal social networks by emphasizing that the modernization of society was generating a fast shift from the community-based forms of solidarity to less bonding ties in a process of societal breakdown. Putnam (1993) called this distinction to mind in his discussion of bonding (which is similar to Tönnies’s Gemeinschaft) and bridging (which is similar to Tönnies’s Gessellschaft) social capital. Subsequently, Portes (1998) drew attention to the fact that bonding social capital can also have negative effects on societal outcomes, that is, the bonding links created within a criminal organization increase the level of social capital but have a negative effect on the social life of a nation/community (on the distinction between bridging and bonding social capital, see also Magnani and Struffi, 2009; Woolcock and Narayan, 2000). These two dimensions form a sort of micro-social sphere in which individuals interact amongst themselves. Gorz (1992) complemented this discussion, defining social trust as a macro-social sphere intimately related to the individual’s interaction and the general structure of society. High scores in this dimension suggest the existence of an environment conducive to the participation of each individual.
On the basis of this sociological definition, the article revisits Putnam’s explanation for the lack of social capital in the South of Italy by taking into account the criticisms and the methodological advances proposed in the literature. Putnam was criticized for his excessive focus on economic development (as the main socio-economic predictor) and the consequent lack of consideration for other structural socio-economic factors, that is, income inequality, labour market conditions and national fragmentation (Costa and Kahn, 2003; Ferragina, 2010; Knack and Keefer, 1997; O’Connel, 2003; Skocpol, 1996; Thomson, 2005). In addition, his historical determinism (Cohn, 1994; Lupo, 1993; Tarrow, 1996) has also undergone severe scrutiny.
After Making Democracy Work there was a huge advance in the measurement of social capital, notably the use of survey data (Paxton, 1999; Van Oorschot and Arts, 2005) and the adoption of a comparative perspective (Beugelsdijk and Van Schaik, 2005; Knack and Keefer, 1997). Paxton argued that the output indicators used by Putnam to put the social capital concept into operation – that is, newspaper readership and the electoral turnout – are a measure of the consequences of social capital rather than a direct measurement of its level. She suggested the use of survey data to measure social capital as a combination of social networks and trust. In addition, Knack and Keefer (1997) measured social capital at the comparative level in 29 nations and Beugelsdijk and Van Schaik (2005) performed the first comparative measurement of social capital in 54 European regions. These works demonstrate the possibility of measuring social capital at the aggregate level and across different cultural contexts. Our measurement takes into account both insights.
Building on previous criticisms and the methodological advances proposed in the literature, this article tests the effect of four socio-economic predictors on the variation of social capital across 85 European regions, and integrates the socio-economic and the historical analyses on the basis of the residuals of a regression model. The combination of these two methods supports the formulation of an alternative explanation for the lack of social capital in the South of Italy.
A mixed method approach
The model
Our explanatory model of the variation of social capital considers: 1) structural socio-economic factors, including a series of independent variables omitted by Putnam; and 2) the connection between present socio-economic conditions and the historical legacy of geographical areas that deviate from the general pattern emerging from the regression model.
Through ordinary least square regression (OLS), the empirical model tests the effect of income inequality, economic development, labour market participation and national divergence in the variation of social capital (and its dimensions) in 85 European regions. This model tends to overestimate social capital in regions ranked above average and to underestimate the scores in regions ranked below. The South of Italy (together with Wallonia) constitutes an exception because social capital is low but the residuals are positive. This means that social capital scores in these two regions are lower than we would expect from the regression model. The peculiarity of the South of Italy and Wallonia is explored through a comparative historical analysis using two regular cases, notably the North East of Italy and the Flanders. These four cases share a chaotic institutional development and high positive residuals, but have different socio-economic conditions.
The dependent variable
The social capital concept is theoretically formulated at three different analytical levels: 1) the individual perspective that emphasizes the ‘private ownership’ of social capital (Coleman, 1988) and its role in determining the socio-economic status (Bourdieu, 1980); 2) the communitarian perspective that highlights the role of traditional communities in enhancing and safeguarding mechanic solidarity in modern societies through ‘bonding ties’ (Etzioni, 1993; Fukuyama, 1995); and 3) the institutional perspective that considers the role of states and organizations (Rothstein, 2001; Skocpol, 1996) in shaping a favourable/negative context for the ‘contagion’ of weak ties and collective action (Centola and Macy, 2007). As a consequence, the concept is used and measured at the individual, meso- (communities/organizations) or macro- (states/regions) levels (Brehm and Rahn, 1997; Costa and Kahn, 2003; O’Connel, 2003; Paxton, 1999; Van Oorschot and Arts, 2005). The measurement at each level requires the strong assumption that social capital is ‘owned’ and ‘enacted’ separately by individuals, networks/groups or macro-contexts.
This article follows the institutional perspective in order to connect the aggregate measurement of the socio-economic determinants to the comparative historical analysis. However, by doing so the regression model is exposed to a potential ‘ecological fallacy’ 5 (Piantandosi et al., 1988). The potential ecological fallacy arises from measuring regional scores as the average of individual scores. This constitutes a limitation of the empirical model justified by the necessity to use survey rather than output data (Paxton, 1999).
The regional social capital scores are calculated by using the European Values Study (1999/2000) and the Special Eurobarometer Surveys (2005, 2007). The European Values Study provides insights into the ideas, beliefs, preferences, attitudes, values and opinions of citizens throughout Europe (EVS, 1999/2000). Standardized questionnaires are proposed every nine years in European countries. Eurobarometer questionnaires were created by the European Commission in 1973 and monitor the evolution of public opinion in member states (European Commission, 2005, 2007). The combination of these two datasets to measure social capital increases the reliability of the overall measurement because each regional score is calculated twice. The rankings obtained using the two datasets are similar, indicating consistency of the scores despite the non-representativeness of the sample at the regional level.
Social capital is a multidimensional concept and must be measured taking into account all its different components. Following Putnam’s definition, Van Oorschot and Arts (2005) measured social capital using EVS dataset (1999/2000). We refine their measurement by further differentiating between formal and informal social networks. As already highlighted, formal and informal social networks are distinguished in traditional sociological literature (organic and mechanic solidarity) but also in the multidimensional definition of social capital (bridging and bonding social capital). The formal social network dimension is gauged by membership and participation in associations, a measure of engagement in social activities (Paxton, 1999; Van Oorschot and Arts, 2005). The informal social networks dimension is the involvement in social life and the importance people attribute to these networks (friends and family) (Van Oorschot and Arts, 2005). The social trust dimension is the capacity of individuals to discuss current affairs and trust other people and institutions. This dimension captures the attitude of people in the public sphere: their willingness to discuss political issues of general interest, the propensity to trust other people without knowing them and their trust toward different types of institutions (Knack and Keefer, 1997).
In order to measure these three dimensions of social capital, 6 the nine basic components of each dimension (membership, 7 participation, 8 meeting colleagues, meeting friends, importance of family, importance of friends, discussing politics, generalized trust and institutional trust) are standardized and summed up to create the compound indicator in five steps:
The average value of every dimension is calculated by separately taking into account the percentages obtained from the EVS and the Eurobarometer datasets for every region.
The distance from the average in each region is calculated according to the formula (Xn-Xm)/Xm, where Xn represents the regional value and Xm represents the average value.
The values obtained from the previous operation are divided by the standard deviation of the distribution in order to produce standardized scales according to the formula: standardized value = value/standard deviation.
Informal/formal social networks and social trust scores are calculated using a weighted average of the single dimensions considered (for each dataset).
The final social capital scores are calculated through the weighted average of the three dimensions.
The units of analysis
The regional units of analysis are based on the Nomenclature of Territorial Units (NUTs) and the configuration of the datasets employed for the empirical analysis (European Commission, 2005, 2007; EVS, 1999/2000; LIS, 2000; Eurostat, 2005). By taking both into account, the regional units of analysis are defined as the larger units considered in the NUT classification. Therefore, NUT 1 is applied to Austria, Belgium, Germany, Italy, Spain, France, Greece, Luxembourg, the Netherlands, Sweden and United Kingdom; and NUT 2 to Finland, Denmark, Portugal, and Ireland (Appendix Table 1 lists all regions).
The independent variables
Following Putnam’s (1993) work, in which social capital is considered simultaneously a dependent and an independent variable, there was a great interest in the literature on: 1) the determinants of social capital (e.g. Costa and Kahn, 2003), 2) its causal effects (for a review, see Mouw, 2006) and 3) the mutual interdependence between social capital and other social phenomena, that is, the quality of democracy (e.g. Paxton, 2002). In particular, economic sociologists emphasized the impact of social capital (and more generally social networks) on labour market achievement and other socio-economic outcomes (e.g. Granovetter, 1973; Ruiter and De Graaf, 2009), showing that weak social ties (bridging social capital) may foster labour market participation, whilst strong ties (bonding social capital) may hinder it.
Putnam undermined the socio-economic explanations of social disaggregation in favour of cultural and historical arguments. In this sense, he followed the shift from socio-economic to cultural history suggested by Fukuyama (1992; see Viazzo, 2007). By simultaneously testing socio-economic and historical explanations of social capital variation, we put under scrutiny the presumed pre-eminence of cultural and historical arguments over structural socio-economic ones. In addition, previous empirical research (Costa and Kahn, 2003; Ferragina, 2010; Gorz, 1992; Knack and Keefer, 1997; O’Connel, 2003) suggests that income inequality, labour market participation, national divergence and economic development should explain a large amount of social capital variation across Europe. Unfortunately, the regression model is based on cross-sectional data, therefore causality cannot be assessed empirically but only argued theoretically.
This subsection illustrates the four socio-economic predictors included in the empirical model and the rationale for relying on such a small number of independent variables. The low level of income inequality was considered by Tocqueville as the main explanation for the strong differential of social participation between French and American people (Tocqueville, 1961: 8; see Ferragina, 2010). Income inequality is measured using a Gini coefficient based on disposable personal income. This income includes (Atkinson et al., 1995: 23):
Private sources of income. That is, wages and salaries; gross self-employment income; realized property income, including interests, rents and property income received on a regular basis.
Occupational pensions, regular inter-household cash transfers.
Court-ordered payments. That is, alimony and child support.
Income from public benefits programmes. That is, sick pay, disability pay, retirement benefits, child or family allowances, unemployment compensations, maternity pay, war benefits and means-tested public assistance.
As described above, many scholars test the effect that social capital exerts on access to the labour market (e.g. Fernandez et al., 2000; Munshi, 2003) rather than exploring the potential impact of labour market activity on social capital. In my model it is assumed that labour market participation captures the existence of a relationship between work involvement and willingness to participate in voluntary associations, network with family and friends, and trust in others and in institutions (as theorized by Gorz, 1992). The level of participation in the labour market is gathered from Eurostat (2005) Regional Statistics.
National fragmentation, defined as social capital variation among regions of the same country, is another predictor included in the empirical model. In this vein, the national divergence index verifies whether regions display higher social capital scores in more homogeneous countries. By introducing this variable I hypothesize that the existence of large social capital disparities among regions within the same country might affect the social capital scores of each region. 9 The national fragmentation index is measured starting from the social capital scores for each region. The sum of the absolute differences between the regional and national values is divided by the number of regions in every state. The value obtained is divided again by the national average. This index measures which countries have larger differences among regions (the data used are the EVS, 1999/2000, and the European Commission, 2005, 2007).
Finally, economic development is frequently considered the most important socio-economic factor for explaining the variation of social capital (Beugelsdijk and Van Schaik, 2005; Helliwell and Putnam, 1995; Knack, 2002; Putnam, 1993: 83–85). Economic development is measured using GDP per capita (gathered from Eurostat, 2005).
The choice of such a restricted number of predictors reflects: 1) the use of a specific theoretical framework based on Tocqueville’s, Gorz’s and Putnam’s arguments; 2) the presence of a limited number of cases (85 regions); 3) the consideration that the regional scale does not allow the test of the effect of many predictors usually considered in the cross-national analyses; 10 and 4) the fact that the inclusion of many predictors does not always reduce the risk of omitting relevant variables (Clarke, 2005) and might instead contribute towards diluting the effect of the variables selected at the theoretical level (Breiman, 1992).
Case selection and comparative historical analysis
Skocpol highlighted (1979) case selection as one of the most problematic aspects of comparative historical analysis. For this reason, the integration between the synchronic and diachronic perspectives is undertaken on the basis of a regression model rather than simply evaluating commonalities and differences among European regions at the theoretical level. The regression model highlights that the South of Italy and Wallonia diverge from the general pattern followed by the other European regions, and therefore constitute interesting cases for an in-depth historical analysis.
The dismissal of the idea of history as a perpetual problem solving exercise of humankind (Fukuyama, 1992; Putnam, 1993) contributed to the formulation of deterministic visions. This determinism reduces the heuristic potential of history to a pre-established path to modernity, as exemplified by Putnam’s theory: only the regions with the presence of an active ‘municipal life’ during the 12th and 13th centuries have high social capital scores today. For this reason, in order to avoid this determinism, we undertake a comparative historical analysis between regular and deviant cases.
Flanders and the North East of Italy are chosen as comparators because they share with the South of Italy and Wallonia the presence of positive residuals in the regression model – this means that social capital scores are higher than we would expect from the socio-economic model – and they are part of the same country, and therefore share similar political institutions. However, in contrast to the South of Italy and Wallonia, they are socio-economically more developed.
Flanders has the highest positive residual among European regions (Table 1). The high social capital score (24th position) in the presence of medium-level income inequality 11 suggests that historical evolution played a largely positive role in the creation of social capital. The situation is quite similar in the North East of Italy, with a lower social capital score and residual (Table 1). In the South of Italy and Wallonia the residual is also positive (Table 1), but in contrast to Flanders and the North East of Italy, the socio-economic conditions are so non-conducive to the creation of social capital that these two regions rank low (79th position for the South of Italy and 64th position for Wallonia). By interpreting this empirical evidence with reference to history, this article proposes an alternative explanation for the lack of social capital in the South of Italy.
Dependent, independent variables and values of the residuals (Belgian and Italian regions).
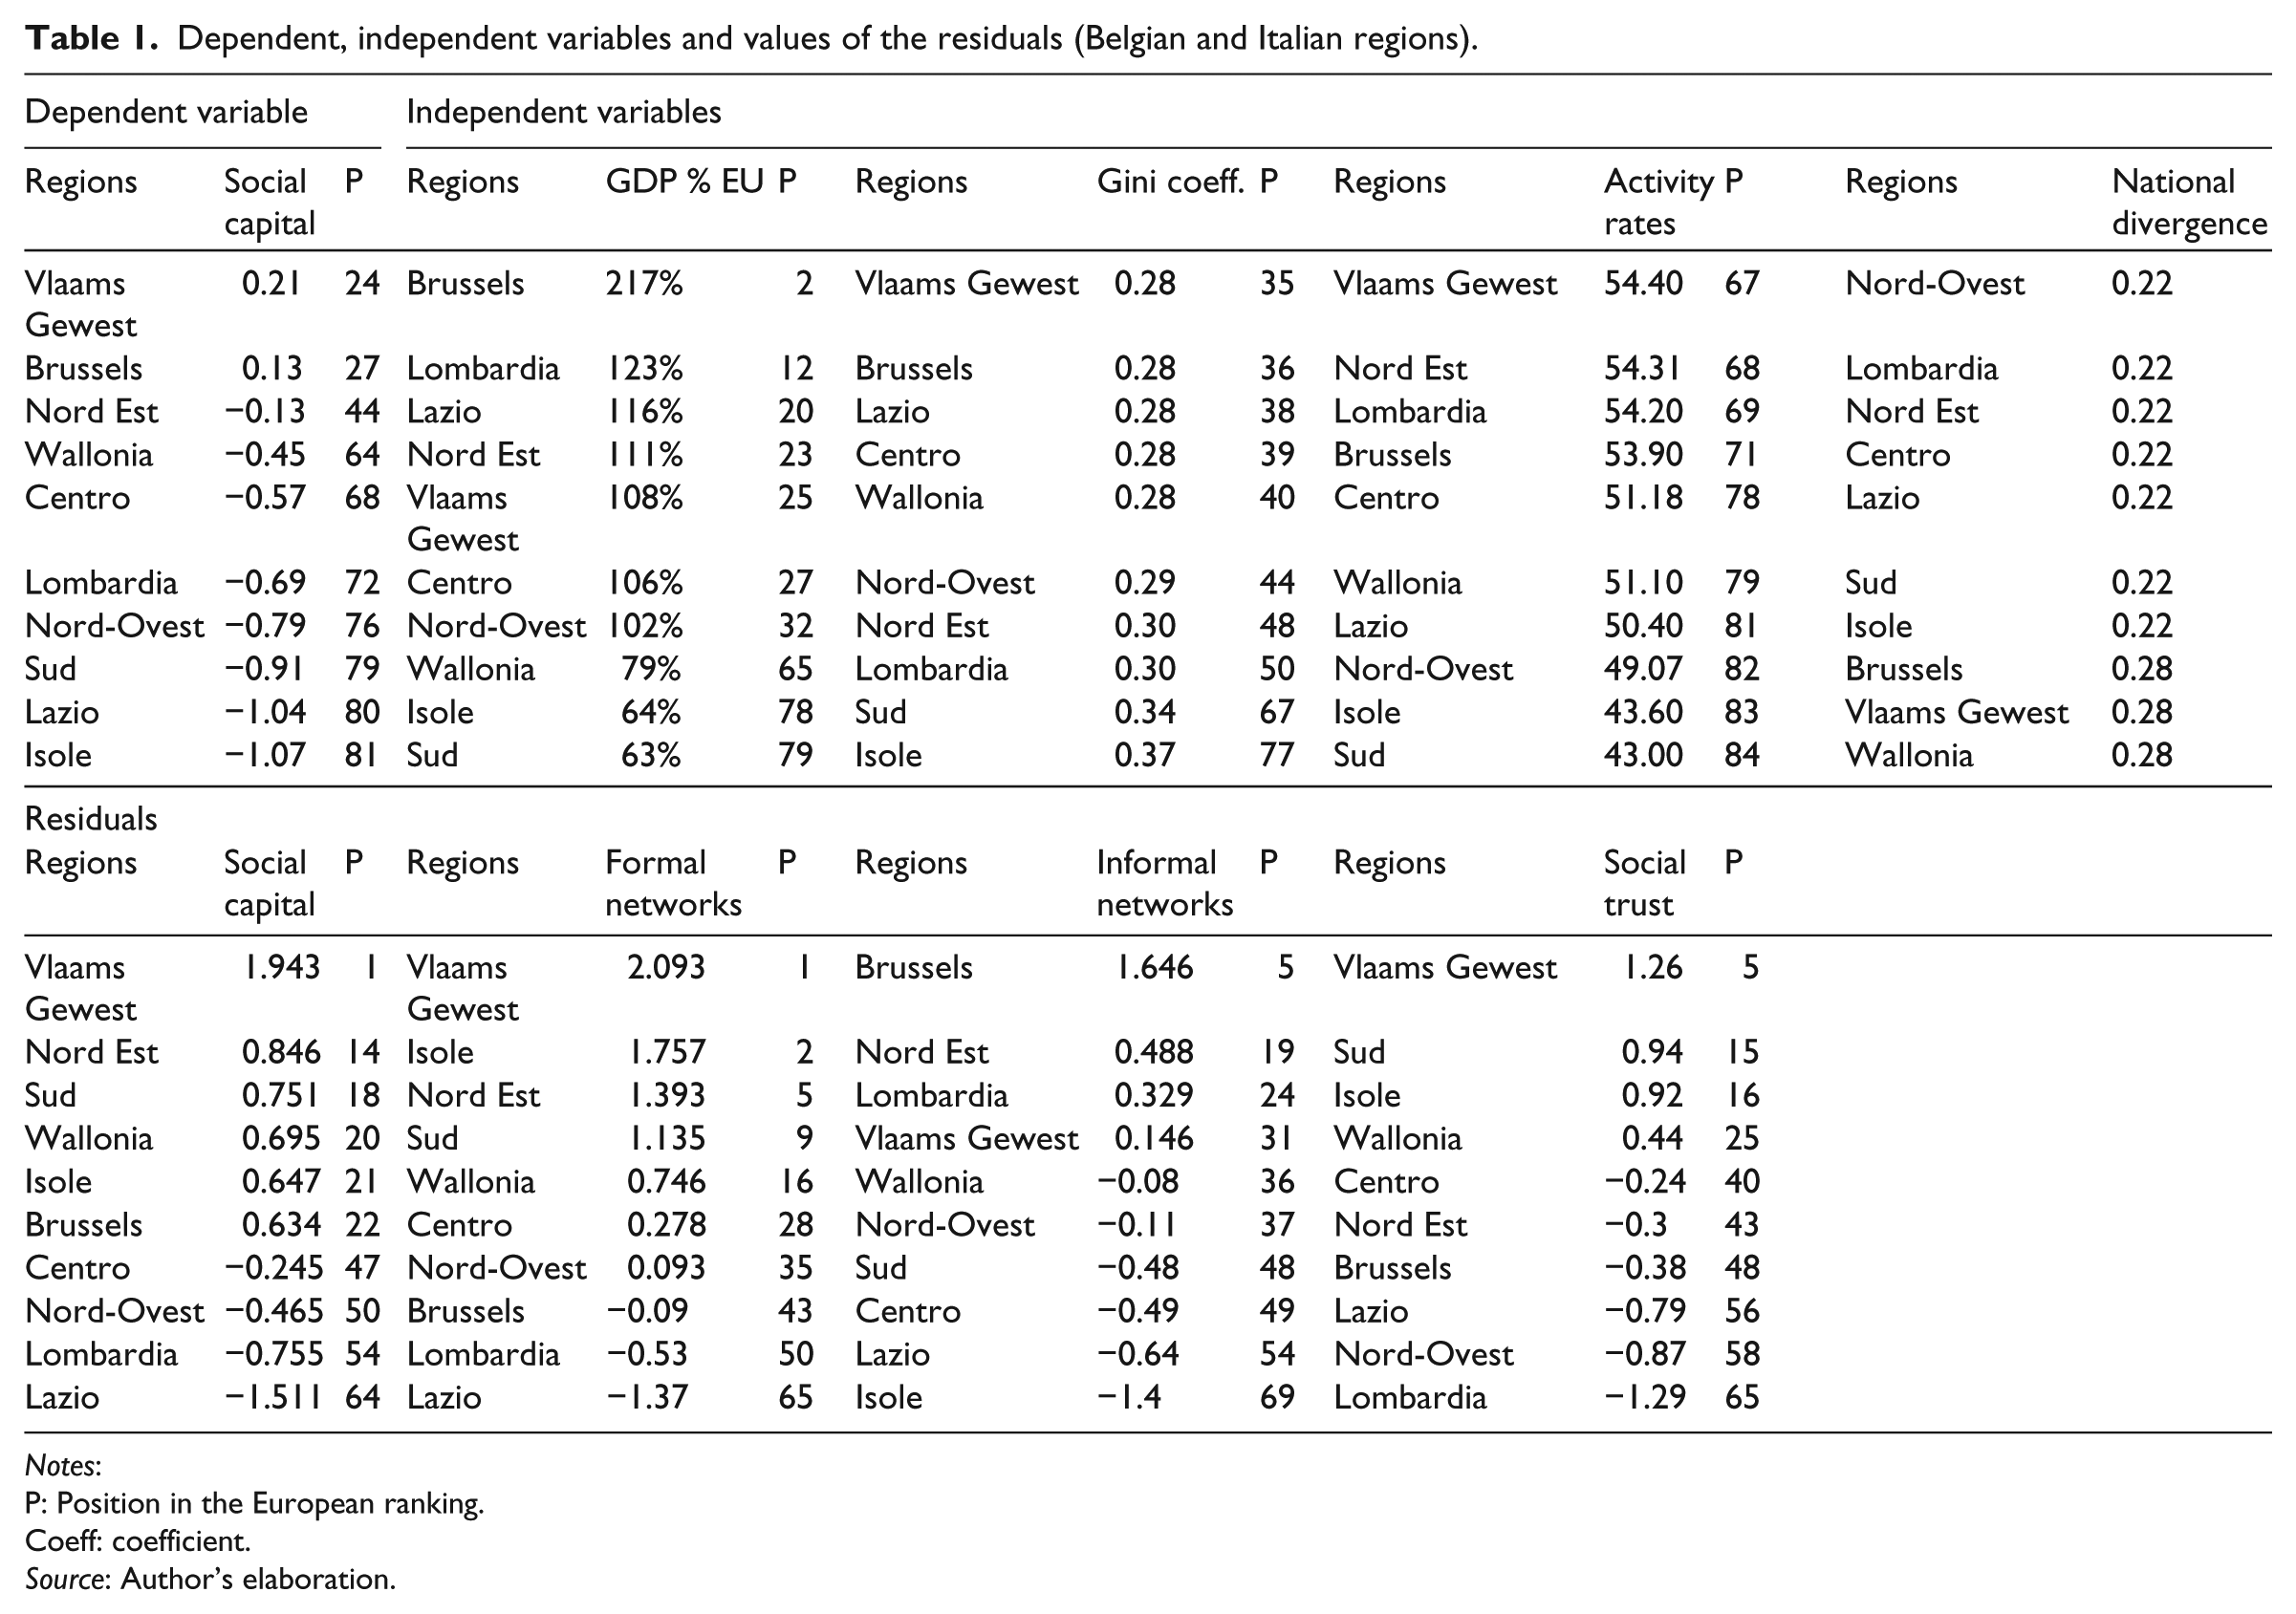
Notes:
P: Position in the European ranking.
Coeff: coefficient.
Source: Author’s elaboration.
Results and discussion
The socio-economic model
The first step in exploring the lack of social capital in the South of Italy is the analysis of the effect of income inequality, labour market participation, national fragmentation and economic development in all European regions. By doing so, the peculiarity of the Southern Italian context is individuated through the comparison with the other European regions rather than inferred as a presumed historical anomaly (Putnam, 1993).
The regression model explains 64 percent of the variance of social capital across European regions and shows that a reduction of income inequality and national divergence, and an increase in labour market participation should positively impact on the variation of social capital. Income inequality (22.6% of the variance explained), labour market participation (19.6%) and national divergence (22.6%) have a similar impact on social capital (Table 2, column 1).
Linear regression model explaining social capital and its components from activity rates, density, GDP per capita, Gini coefficient, national divergence.
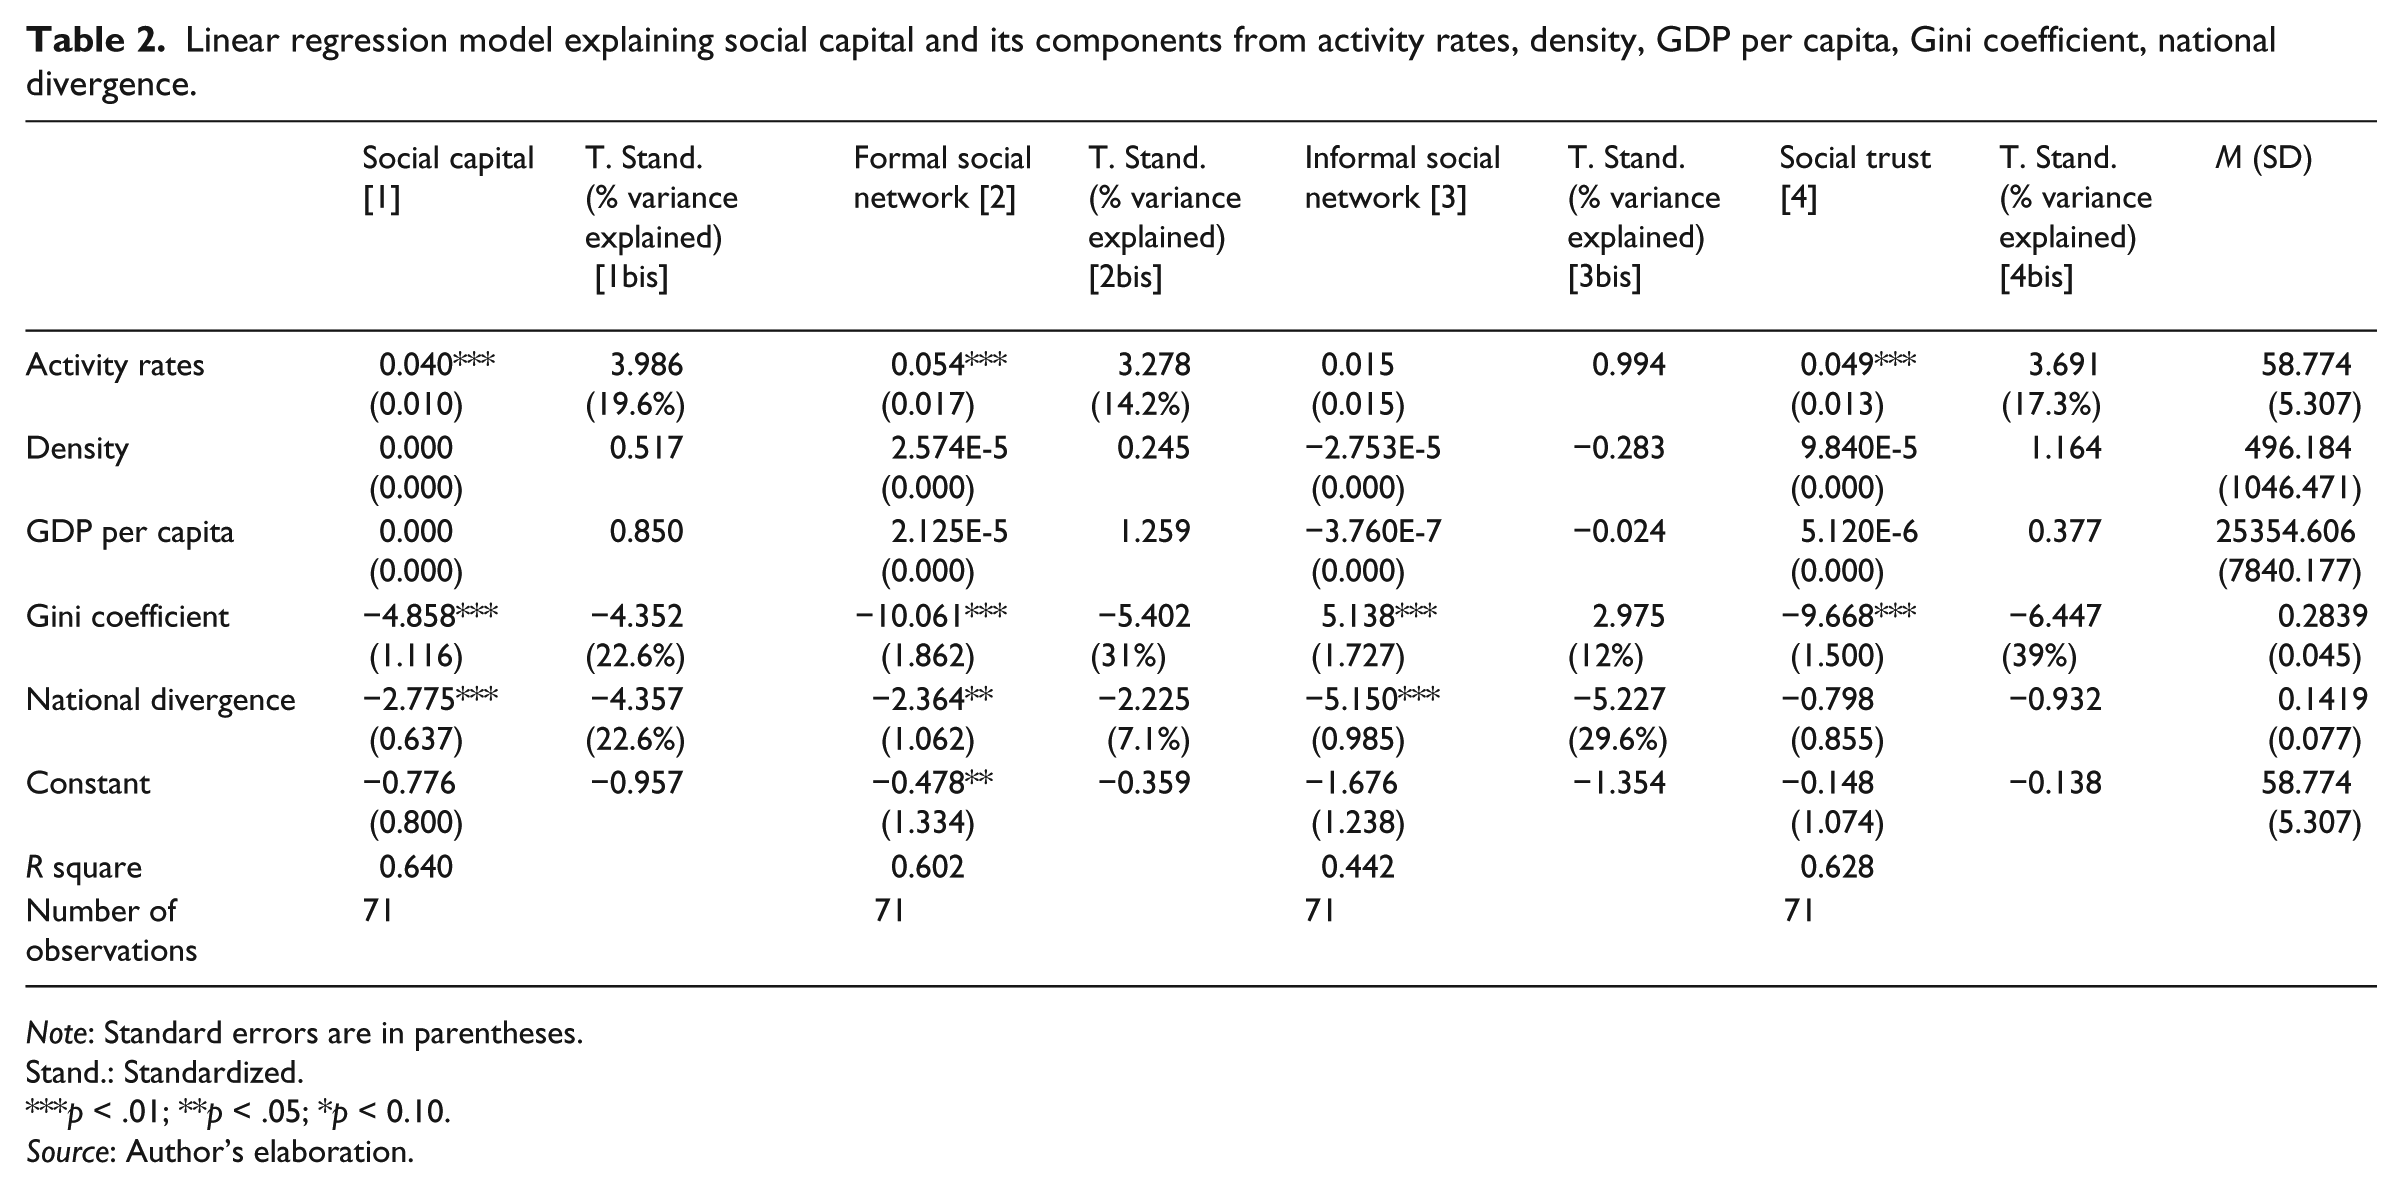
Note: Standard errors are in parentheses.
Stand.: Standardized.
p < .01; **p < .05; *p < 0.10.
Source: Author’s elaboration.
In order to more accurately disentangle the effect of each predictor, the same analysis is extended to the three dimensions of social capital. Income inequality, labour market participation and national divergence explain 60 percent of formal social networks’ variation across European regions (Table 2, column 2). The direction of the effect is the same as described for social capital; lower income inequality, lower national divergence and higher labour market participation predict a higher density of formal social participation. However, the magnitude of the effects is quite different. The Gini coefficient is by far the most important explanatory variable of the variation of formal social networks (31% of the variance explained), followed by activity rates (14.2%) and national divergence (7.1%).
The model explains 44 percent of the variance of informal social networks across European regions. Only income inequality and national divergence appear to have a significant effect (Table 2, column 3). The direction of their effect partially changes when compared to the predictive model which explains the variance of formal social networks. An increase in income inequality has a positive impact on informal social networks, while national divergence is negatively correlated. National divergence is the main predictor (explaining 29.6% of the variance) followed by the Gini coefficient (12%). These findings suggest that when income inequality rises within a region, people tend to have a reaction against the higher uncertainty by strengthening their safety nets, that is, the bonding ties. This might be a confirmation of the idea put forward by communitarians that redistributive policy tends to destroy reciprocity and strong ties (Etzioni, 1995; Fukuyama, 1995). Therefore, the reduction of income inequality results in a trade-off between the positive effects generated by the variation of formal social networks and the negative effects generated by the variation of informal social networks. However, an increase of informal social networks is not always positive for society overall. As suggested by Portes (1998) the accumulation of bonding links in primary groups can also favour the creation of criminal groups (see also Gambetta, 1988). This consideration does not apply to membership and participation in social groups because they generally foster social inclusion without reducing collective well-being (Putnam, 1993; Rothstein, 2001).
The model explains 62.8 percent of the variance of social trust (Table 2, column 4). The Gini coefficient is the most important predictor (39% of the variance explained) followed by labour market participation (17.3%). The relative variance explained by the predictors on the social trust dimension is similar to that observed for formal social networks, the only difference being that the national divergence index here is not significant. This means that in regions with a higher level of participation in the labour market and low-income inequalities, the institutional/generalized trust and the willingness to discuss political issues are more pronounced.
Contrary to what is argued in most of the previous literature (i.e. Helliwell and Putnam, 1995), the level of economic development does not seem to significantly affect the variation of social capital and its dimensions. For this reason a more accurate investigation is proposed by dropping in rotation all significant predictors: labour market participation, economic inequality, national divergence and finally, labour market participation and economic inequality simultaneously (Table 3, columns 1–8).
Linear regression model explaining social capital from activity rates, density, GDP per capita, gini coefficient, national divergence (stepwise model).

Note: Standard errors are in parentheses.
Standard. : standardized.
p < .01; **p < .05; *p < 0.10.
Source: Author’s elaboration.
By simultaneously (or individually) dropping activity rates and the Gini coefficient from the model, it appears that the level of economic development significantly affects social capital. However, in this configuration, the variance explained drops from 64 percent to 33 percent (Table 3, column 7). The regression model shows that the level of economic development only has a significant effect on the variation of social capital if income inequality and labour market participation are not considered. This suggests that the literature suffers from an excessive emphasis on the positive role of economic development when explaining social capital variation. The results confirm the broader argument formulated by Wilkinson and Picket (2009): compared to economic development, income inequality is a better predictor of a large range of socio-economic and health outcomes, for example, greater social cohesion, lower crime rates, higher life expectancy.
Summing up, the empirical evidence suggests that income equality, labour market participation and national divergence explain most of the variance of social capital across European regions. In particular, income inequality is the most important predictor for formal social networks and social trust while national divergence has a major role in predicting the variance of informal social networks. The effects run in the same direction; an increase in income inequality and national divergence are negatively correlated to social capital and its dimensions, while an increase in labour market participation has a positive effect. The only noteworthy exception is the positive correlation between an increase of income inequality and informal social networks. In addition to this, the level of economic development only seems to have a positive impact on social capital when labour market participation and/or income inequality are dropped from the model.
Furthermore, by looking at the position of each case against the regression line, a clear pattern appears: the model tends to underestimate social capital in the regions where the social capital score is above average and conversely tends to overestimate social capital where the score is below average (Table 4; Figure 1). This finding can be explained by: 1) the positive and reinforcing effect of efficient institutions and the consolidation over time of social networks and trust where the degree of social participation is already high (Rothstein, 2001); and 2) the negative and reinforcing effect of the inefficiency of institutions and the absence over time of generalized trust where social capital scores are currently below average (Woolcock, 1998).
Residuals.
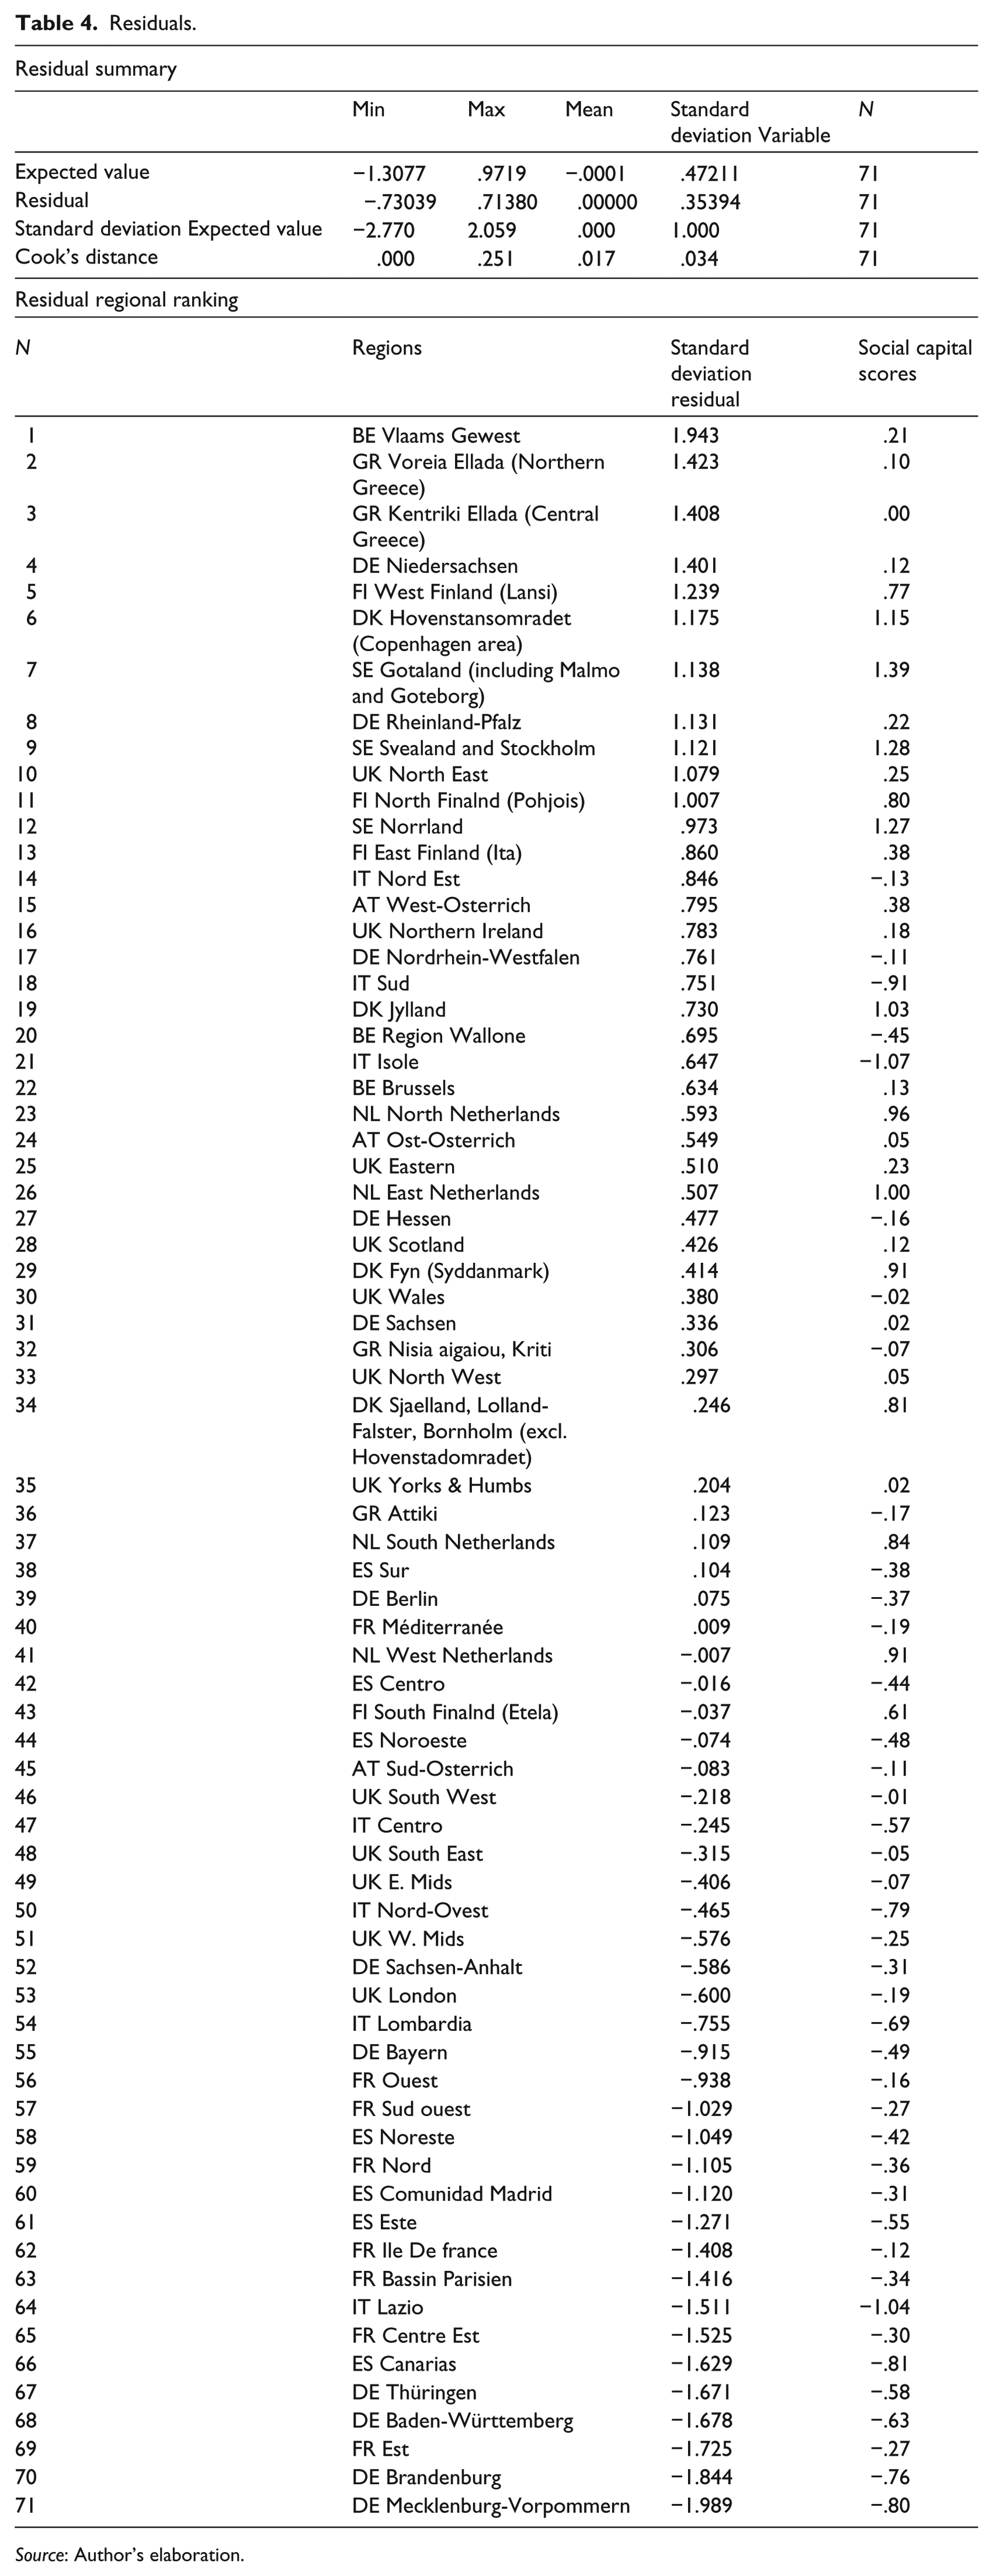
Source: Author’s elaboration.
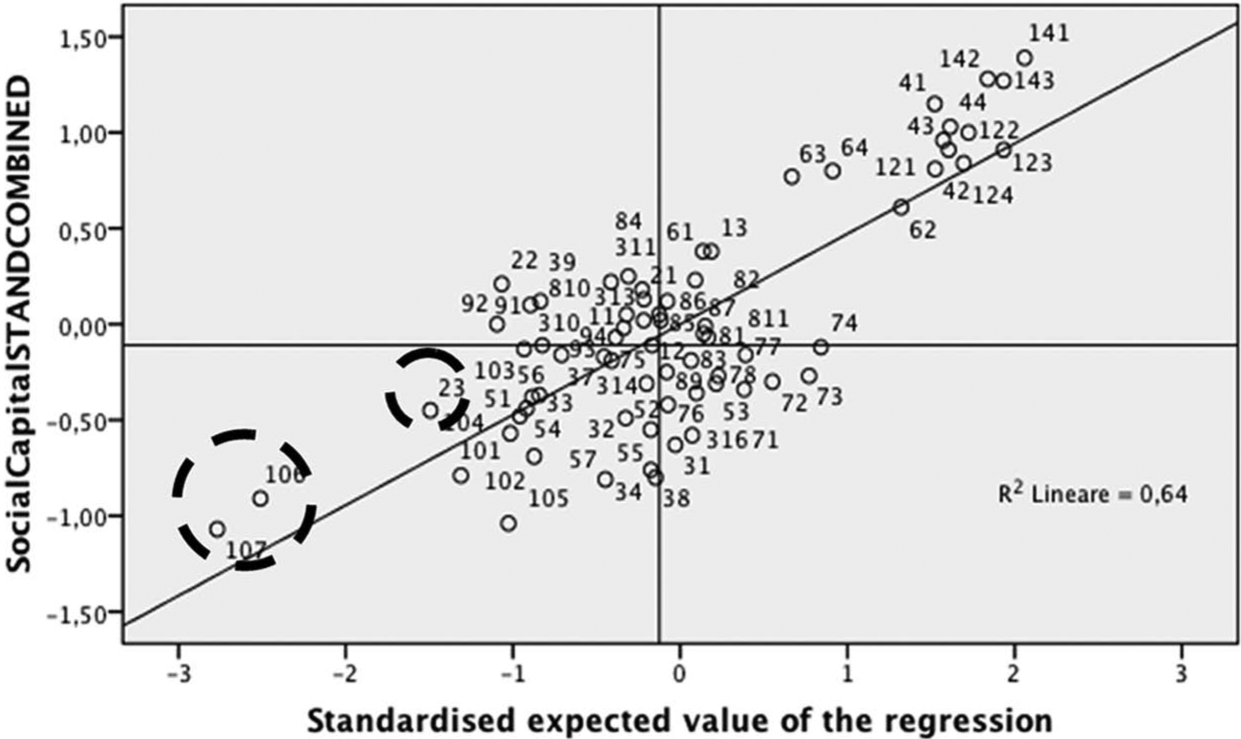
Regression explaining social capital from all dependent variables.
The South of Italy and Wallonia deviate from this pattern because they display social capital scores largely below the average in concomitance with high positive residuals. This means that social capital is higher than we would expect from the socio-economic model. Our findings call into question Putnam’s hypothesis, given that in these two regions the unequal distribution of income, the lack of participation in the labour market and the low level of national cohesion seem to affect negatively social capital, whilst history, perhaps, has a positive effect (as suggested by the positive residuals of the regression model). In the second step of the analysis, this puzzle is further explored by comparing the South of Italy and Wallonia with two cases that follow the general pattern emerging from the regression model, notably the North East of Italy and Flanders.
The comparative historical analysis
The comparative historical analysis: 1) describes the shortcomings of Putnam’s explanation by matching the findings of the socio-economic model with a re-visitation of medieval history; 2) supports an alternative explanation for the lack of social capital in the South of Italy; 3) illustrates an example of social engagement and civic participation in the South of Italy (the Fasci Siciliani movement) that further contradicts Putnam’s hypothesis.
Revisiting medieval history
The absence of the municipal experience in the 12th and 13th centuries does not seem to explain the present lack of social capital in the South of Italy. The historian Henry Pirenne gave a detailed account of municipal democracies. These cities, created by the burgers, were only functional to their interests (Pirenne, 1963: 156), being divided microcosms ‘with the absence of the feeling of democracy’ (Pirenne, 1963: 158–159). The medieval towns were not a construction site of future democratic life, but places in which ‘the commonwealth interposed the group of comrades’ and the interests of different crafts were the only reason to act (Pirenne, 1963: 112–113). Pirenne’s general description of municipal towns is confirmed by Brezzi in Italy. Medieval cities were divided and administered by a narrow aristocratic minority (Brezzi, 1959: 32). Furthermore, medieval towns were not homogeneously spread out in the northern part of the country. In his analysis, Putnam refers to Lombard towns although there were no large important cities in the North East of Italy at the time.
In the South of Italy municipal life was not absent. In many areas the creation of new towns, for example, Lecce, Foggia, Catanzaro and Amalfi, between the ninth and the 12th centuries was more of a relevant phenomenon than in the north (Various Authors, 1981: 11). Furthermore, the Kingdom of Sicily was not only a destructor of horizontal ties during this period. Innovative policies were developed to foster international commercial networks, such as the 10-year tax exemption for all merchants who decided to live in the South of Italy and the guarantee of a strong tax reduction to those who decided to actively trade within the Kingdom (Yver, 1968: 4–5). The development of trading life which boosted domestic exchange in many ways, and a protected agricultural economy, made the Kingdom of Sicily the most prosperous state in Europe (Yver, 1968: 6).
Thus, the findings gathered from the regression model, which suggest that the historical context is not the reason for the large difference in social capital scores between the North and the South of Italy (and by comparison between Flanders and Wallonia), are largely confirmed by the analysis of Italian municipal life. First, the presence of developed medieval towns was not a generalized experience in the North of Italy but limited to Lombard towns. Second, medieval towns were not purely conducive to the creation of horizontal ties. Third, the rule of Frederic the Second in the South of Italy did not simply destroy horizontal ties but also fostered their creation through favourable trading rules.
Developing an alternative explanation
The gap in the social capital scores between the South and the North East of Italy (and between Wallonia and Flanders) seems to be accurately explained by the different socio-economic conditions in these areas, notably the level of income inequality and labour market participation. Furthermore, the presence of positive residuals in the regression model, together with the re-discussion of the Italian medieval experience, contradicts Putnam’s hypothesis because history seems to affect social capital positively in all four cases analysed. Starting from these elements this section illustrates, on the basis of a comparative analysis between regular and deviant cases, the interplay between socio-economic and historical factors in determining the social capital gap between the South and the North East of Italy (and between Wallonia and Flanders).
Many scholars (Bevilacqua, 1993; Cassano, 1996; Lupo, 1993; Reid and Musyck, 2000; Zamagni, 1993) point out that the growing economic gap experienced during the unification process across both Italian and Belgian regions continues to affect the present socio-economic development. Bevilacqua (1993) argued that the socio-economic underdevelopment of certain areas, notably the South of Italy (and to a lesser extent Wallonia), has favoured the advent of deterministic theories (Banfield, 1958; Putnam, 1993), which explain the present lack of social capital on the basis of a negative historical trajectory. In this context, the historical legacy of the South of Italy is associated with the lack of social capital, almost as if the historical legacy of this area were a straight negative path.
The examples of Flanders and the North East of Italy (both regions were underdeveloped as much as the South of Italy and Wallonia until the first part of the 20th century) further demonstrate how present socio-economic conditions directly affect the way in which historical legacy and culture are analysed by social scientists. When socio-economic development kicks in, the previous negative image of the historical legacy gets progressively replaced by a positive appraisal. In this sense, one can argue that Putnam’s explanation is only a biased account largely determined by the present socio-economic underdevelopment of the South of Italy.
For different reasons, Italy and Belgium were two cultural bridges sitting on two important fractures of the European continent. Belgium was at the crossroads between the Latin and Germanic world, and Italy between Northern Europe and the Mediterranean area. Both Belgians and Italians reacted to the lack of national integration in opposite ways: the Flemish and the North Eastern Italians embellished their past with pride, Walloons and Southern Italians progressively downgraded their self-image and regional history.
Today, Walloons and Southern Italians each perceive their own history with an inferiority complex fuelled by the superior socio-economic development of Flanders and North Eastern Italy. According to Van Dam and Nizet (2002: 65), the Walloons naturally select the Flemish as a comparative group, however the Flemish rarely use the comparison with the Walloons to define their own characteristics (Van Dam and Nizet, 2002: 65). This means that Walloons suffer a sentiment of submission linked to a feeling of inferiority (Van Dam and Nizet, 2002: 58).
The Southern Italians consider their past in an even more derogatory way than the Walloons. The current representation of the Mezzogiorno is often reduced to a kind of non-history: a long account of what could have happened but did not happen, the history of perpetual inferiority compared to the rest of the country (Bevilacqua, 1993: VII). In the media and in popular culture, the South of Italy represents the negative incarnation of a question, an obscure problem, almost a social disease for which it is necessary to express a feeling of moral reprobation (Bevilacqua, 1993: IX). Putnam’s theory is nourished by this collective image.
In reality, there is a profound difference between the South as portrayed by the media and the one described by the academic studies (Bevilacqua, 1993: XII). The poor Southern Italian socio-economic performance is interpreted by Putnam as a direct consequence of disastrous historical paths. The past became an original sin against which nothing can be done.
However, the lack of pride and self-esteem and the positive/negative image of past events do not constitute a perpetual reality. The Flemish case shows that the 19th-century image was successfully removed, taking its secular inferiority complex with it (Quariaux, 2006). This area was characterized, during the 19th century and the first half of the 20th century, predominantly by agricultural activity and a virtually non-existent industrial sector with massive migration towards the more industrialized parts of the country. The situation changed progressively, thereby generating fast socio-economic development. This development was based on the creation of small and medium-sized companies able to exploit the traditional knowhow of the area (Keating et al., 2003: 78).
The economic miracle of the North East of Italy was faster and more celebrated than the parallel Flemish Renaissance. During the 1960s and the 1970s this area became famous for its industrial districts. This successful economic model was based on traditional craftsmanship, family company structure, efficient local administrations and the progressive accumulation of capital from migrants. The connection between these elements boosted a period of innovation and growth described by Bagnasco in the Le Tre Italie (1977).
Within the same period the Flemish overtook the Walloon economy. The socio-economic success and the echoes of a glorious past, rediscovered by the Flemish movement during the 19th century, contributed to change Flanders’ image. Flanders was no longer identified with the mass of poor peasants forced to work in the Walloon factories (during the 19th century) but with the 14th-century County of Flanders, despite the fact that the County of Flanders was only a collection of independent and wealthy cities and not a nation. However, in the atmosphere of successful socio-economic growth in the region, the image was reconstructed to portray a developed nation characterized by a well-established manufacturing sector and substantial trade with the rest of Europe. This idealized image of Flanders in the 14th century characterized modern Flanders during a period of decline of the traditional Walloon superiority. The humiliation of the past centuries and the backward rural image that had characterized the area for three centuries were rapidly forgotten (Keating et al., 2003: 82). A re-elaborated cultural legacy mixed with its socio-economic success translated into the reinforcement of Flemish self-confidence and pride, perhaps contributing to even higher social capital scores today (Flanders has the highest positive residual among the 85 European regions analysed; Table 1).
In Wallonia, the socio-economic growth of the 19th and the first half of the 20th century did not generate the same positive effect on social capital as described in Flanders and the North East of Italy. The heavy industrialization was different from the endogenous development driven by small and medium-sized companies (Reid and Musyck, 2000: 183). The coal-mining and steel industries required a considerable level of capital resources that were not controlled at local level. ‘As a result, the Walloon economy was, from an early stage, controlled by investors concerned by their interests on a national and international level rather than directly with the future of the region’ (Reid and Musyck, 2000: 184). With the end of heavy industrialization and the economic downturn, the capital invested in Wallonia moved away. The absence of endogenous development generated a negative impact on the level of labour market participation, reducing social capital and entrepreneurship.
The case of Southern Italy presents some important similarities with Wallonia, although it emerges from a different set of historical circumstances. The absence of infrastructures, the reversing of a local industrialization process from the Bourbons to the unified Kingdom of Italy (Bevilacqua, 1993: 31), and the top-down approach, destroyed the small germs of entrepreneurship in the area. We argue this process had a stronger impact on social capital – via the increase of inequalities and the disruption of labour market participation – than the presumed absence of civic tradition in the 12th and 13th centuries.
During the 20th century a process of de-industrialization took place in parts of the South of Italy (Calabria, Sardegna and Basilicata). In this way, agricultural activity became the only economic activity in the Mezzogiorno, consolidating the structural difference with the northern part of the country (Bevilacqua, 1993: 66). The destruction of local industry transformed the South into an area in which people were almost anthropologically devoted to agriculture. Why would a wealthy landowner or a trader have invested their capital into modern and unexplored industrial activities in preference to siphoning off agrarian profits into banks that offered high interest rates? In this context productive investment was profoundly curtailed (Bevilacqua, 1993: 72).
In conclusion, it is possible to hypothesize that if endogenous development does not generate an improvement of socio-economic conditions and a top-down policy-making approach is imposed without taking into account the socio-economic specificities of a region, social capital is dramatically affected. On the one hand, during the 19th and 20th centuries endogenous development and a political strategy that took into account the socio-economic specificities of Flanders and the North East of Italy strengthened social capital in these two areas. Whilst, on the other hand, the absence of these conditions dramatically affected social capital in the South of Italy and Wallonia by way of increased levels of income inequality and reduced levels of labour market participation. In line with this interpretation, we argue that Putnam analysed Southern Italian history as a path toward backwardness because he disregarded the socio-economic conditions that severely affect social capital. The empirical model and the historical analysis seem to demonstrate that the legacy of Italian medieval history does not explain the lack of social capital in the South of Italy. On the contrary, the positive residuals of the regression model seem to indicate that its historical legacy is not curtailing social capital but rather off-setting some of the negative effects generated by poor socio-economic conditions.
An example of collective engagement in the South of Italy: The Fasci Siciliani
Putnam did not connect his regression model and the historical analysis, but instead used history instrumentally to justify the present lack of social capital in the South of Italy. The chain of causation suggested by Putnam, that should explain the present lack of social capital in the South of Italy with the absence of medieval cities, is not clear at the empirical and historical level. Tarrow (1996: 393) argued incisively that Putnam could have plausibly chosen different historical events to explain the gap between the North and the South of Italy, for example, the systematic control of foreign powers of the South of Italy since the end of the Norman rule, or the top-down approach of the Italian unification in the 19th century (almost a colonization imposed by Piedmont without any consideration for the socio-economic specificities of the Mezzogiorno).
Accordingly, it is suggested (Cohn, 1994; Tarrow, 1996) that the difference in the civic tradition in the two areas was rooted in the development of mass parties in the north (socialist and Catholics), whilst the south continued to live in a semicolonial state even after the unification process. This semicolonial state has maintained a strong influence on the present socio-economic conditions of the Mezzogiorno, heavily contributing to the lack of endogenous development (Bevilacqua, 1993).
This explanation for the lack of social capital in the South of Italy is further confirmed by the social activism existent in the Mezzogiorno during the 19th and 20th centuries. Nitti noticed (1900: 11) that in 1799, 1820, 1848, 1859 and then 1893, with the Fasci Siciliani, the South of Italy was always the first part of the country to react against bad governmental policy. However, this social movement did not help to improve the socio-economic conditions of the Southern Italian population because the national government repressed the Fasci Siciliani without considering peasants’ requests ((Bevilaqua, 1993). The Fasci Siciliani acquired a territorial penetration that was never reached by other revolts in the country. With more than 300,000 members engaged for one year (Cartosio, 1992) in an island of approximately 2.5 million people, the Fasci Siciliani constituted the first collective movement of protest in Italy before the advent of the Communist Party and the trade unions in the 20th century.
Through the collective occupation of land and the consolidation of a capillary rooted organization, the Fasci Siciliani were a good example of a pacific model of social engagement. After a spontaneous bottom-up approach, springing from its roots, the movement’s aim was that agrarian reform could be achieved through the election of representatives in the city councils and the parliament. Thanks to the formulation of a political strategy, the movement provided the first political socialization of peasants who were able to understand the most important principle of democracy: that citizens and workers have duties as well as rights that nobody can take away.
The invasion of the land represented a collective act that involved thousands of peasants and hundreds of communities (Rossi Doria, 1999: 94). The Fasci Siciliani had an ad hoc federal organization that allowed for the widespread penetration of Sicilian rural areas. There was a subscription quota (a monthly membership fee) and a structured internal organization that developed relevant forms of solidarity and self-help, such as the distribution of part of the subscriptions to the widows of peasants killed by landlords or the army. The rising of collective solidarity and the creation of horizontal ties constituted an important and innovative process of social capital creation (Rossi Doria, 1999).
The government positioned itself firmly against the Fasci in support of the unproductive absentee landowner, reinforcing in this way the lack of trust peasants had of institutions (trust in institutions is one of the items included in the social trust dimension). The army repressed their actions with bloodshed. Colajanni calculated that during the strikes 92 peasants were killed compared to only one soldier, confirming the pacific character of the revolt. Such government action was the catalyst of violent reaction. On 20 January 1894 in the small village of Caltavuturo, 500 peasants peacefully and symbolically occupied land that belonged to the government. The army killed 13 unarmed people (Colajanni, 1894: 171).
The state did not realize that for the first time peasants were consciously entering the history of their own country. A movement of free expression was stifled with violence, which destroyed the potential rising of social and civic engagement of Sicilian peasants (Colajanni, 1894: 5). The repression destroyed the potential creation of a dialectic relationship between public power and the population; the peasants did not have the chance to fully experience a form of political and social organization in a way that would have probably increased social capital (Bevilacqua, 1993: 84). Many peasants reluctantly realized that social struggle was a useless and dangerous business and decided instead to only take care of their family and clientele.
This event, almost forgotten by the Italian national historical narrative, was an extraordinary example of social engagement and social capital creation. Peasants challenged the government, proposing an idea that was subversive in the Southern Italian context: to substitute the vertical model of clientelism with a horizontal one of a continuous discussion by collective organizations in the political arena (Rossi Doria, 1999: 106). Southern Italians were not just passive agents of history. The reputation of their passive behaviour emerges from a stagnant and unequal society (where income inequality and low labour market participation determine the low level of social capital), rather than being a characteristic embedded into the medieval history of the area.
Conclusion
The article proposes an alternative explanation for the lack of social capital in the South of Italy by using a comparative perspective that simultaneously considers a direct causation between socio-economic conditions and the variation of social capital, but also the mediating effect of history. The regression model suggests that fairer distribution of income, higher participation in the labour market and stronger national cohesion foster higher levels of social capital in all European regions. In addition, the residuals of the regression model indicate that where social capital is above average, institutions and social contexts seem to exert a positive additional effect on the stock of social capital; and conversely, where social capital is below average, institutions and social contexts seem to play a negative reinforcing effect. The South of Italy and Wallonia constitute an exception to this panorama, because despite the extremely low social capital scores determined by the high level of inequalities, the low level of labour market participation and the embeddedness in a fragmented national context, they display positive residuals. This means that their social capital scores are higher than we would expect by considering the socio-economic conditions.
These empirical findings challenge Putnam’s historical hypothesis of the lack of social capital in the South of Italy and are used to provide an alternative explanation based on a comparative historical analysis between two deviant (South of Italy and Wallonia) and two regular cases (the North East of Italy and Flanders). This historical analysis: 1) emphasizes the shortcomings of Putnam’s historical explanation based on the different diffusion of medieval towns between the North and the South of Italy; 2) suggests an alternative explanation for the lack of social capital in the South of Italy; and 3) describes a social movement (the Fasci Siciliani) which further confirms the hypothesis formulated. We suggest that Southern Italian medieval history does not seem to explain the current lack of social capital. On the contrary, the centennial historical legacy of this area constitutes a positive factor that mitigates the negative effect of the inequitable income distribution, the low labour market participation and the weak national cohesion on social capital.
More broadly, via the analysis of a specific case, we argue that social scientists should reconsider the role of history in conjunction with quantitative analysis. However, history should not be treated as a linear variable of an empirical model or used instrumentally to justify deterministic claims derived from quantitative evidence. Social scientists should use history, instead, to illuminate social evolutions of specific areas, exerting a ‘disciplined imagination’ (Collingwood et al., 1999) in combination with quantitative analysis, respecting historical complexity, non-linearity and its contradictory patterns. We refuted a dialectic that prescribes the turning out of a set of historical steps to achieve a certain aim such as the increase of social capital. ‘The end of history’ cannot be found; the reality of the European continent is too pervaded by contradictory turning points to give confirmation of the fact that social scientists are absolutely right. In spite of the works of Putnam and Fukuyama, history is endless and a rich source of surprises (Tollebeek, 1998: 353).
Footnotes
Appendix
Descriptive statistics.
| Gini coefficient | GDP per capita Euro | Density | Activity rates (%) | National divergence (%) | Observations EVS | Observations Eurobarometer | ||
|---|---|---|---|---|---|---|---|---|
| 1 | AT Ost-Osterrich | 0.27 | 22,599.77 | 80.12 | 58.4 | 0.21 | 380 | 251 |
| 2 | AT Sud-Osterrich | 0.25 | 24,788.72 | 67.88 | 57.3 | 0.21 | 329 | 203 |
| 3 | AT West-Osterrich | 0.26 | 29,136.30 | 86.01 | 61.8 | 0.21 | 504 | 328 |
| 4 | AT Wien | M | 39,773.80 | 3949.16 | 58.1 | 0.21 | 309 | 248 |
| 5 | BE Brussels | 0.28 | 53,875.90 | 6251.85 | 53.9 | 0.28 | 497 | 95 |
| 6 | BE VlaamsGewest | 0.28 | 26,903.19 | 448.27 | 54.4 | 0.28 | 821 | 571 |
| 7 | BE RegionWallone | 0.28 | 19,577.17 | 202.14 | 51.1 | 0.28 | 594 | 345 |
| 8 | DE Baden-Württemberg | 0.25 | 28,841.55 | 300.41 | 61.4 | 0.26 | 160 | 134 |
| 9 | DE Bayern | 0.28 | 30,390.25 | 176.90 | 61.3 | 0.26 | 181 | 178 |
| 10 | DE Berlin | 0.33 | 22,074.90 | 3815.49 | 60.1 | 0.26 | 135 | 81 |
| 11 | DE Brandenburg | 0.24 | 17,800.60 | 86.72 | 61 | 0.26 | 170 | 90 |
| 12 | DE Bremen b | 0.33 | 35,183.90 | 1642.82 | 54.9 | M | 24 | 5 |
| 13 | DE Hamburg b | 0.31 | 45,271.30 | 2331.87 | 59.9 | M | 20 | 22 |
| 14 | DE Hessen | 0.30 | 31,250.83 | 288.33 | 58.9 | 0.26 | 103 | 95 |
| 15 | DE Mecklenburg-Vorpommern | 0.24 | 17,546.90 | 73.39 | 61.4 | 0.26 | 115 | 71 |
| 16 | DE Niedersachsen | 0.28 | 22,701.28 | 167.76 | 56.9 | 0.26 | 126 | 126 |
| 17 | DE Nordrhein-Westfalen | 0.28 | 25,597.57 | 529.44 | 56.1 | 0.26 | 289 | 263 |
| 18 | DE Rheinland-Pfalz | 0.25 | 23,243.28 | 204.36 | 58.1 | 0.26 | 54 | 75 |
| 19 | DE Saarland | 0.25 | 24,698.20 | 407.28 | 53.9 | M | 16 | 18 |
| 20 | DE Sachsen | 0.23 | 18,866.21 | 232.40 | 58.9 | 0.26 | 290 | 147 |
| 21 | DE Sachsen-Anhalt | 0.23 | 18,441.00 | 120.11 | 59.3 | 0.26 | 175 | 94 |
| 22 | DE Schleswig-Holstein | 0.29 | 22,983.20 | 179.61 | 59.2 | M | 23 | 46 |
| 23 | DE Thüringen | 0.22 | 18,010.10 | 139.34 | 61.4 | 0.26 | 155 | 88 |
| 24 | DK Hovenstansomradet (Copenaghen area) | 0.24 | 36,073.10 | 638.50 | 65.6 a | 0.10 | 262 | 354 |
| 25 | DK Sjaelland. Lolland-Falster. Bornhom (excl. Hovenstadomradet) | 0.21 | 21,265.20 | 111.89 | 65.6 a | 0.10 | 174 | 127 |
| 26 | DK Fyn (Syddanmark) | 0.21 | 25,767.50 | 97.43 | 65.6 a | 0.10 | 171 | 222 |
| 27 | DK Jylland | 0.21 | 26,299.22 | 85.44 | 65.6 a | 0.10 | 416 | 308 |
| 28 | ES Noroeste | 0.34 | 19,662.60 | 95.13 | 51.6 | 0.09 | 132 | 116 |
| 29 | ES Noreste | 0.31 | 27,521.85 | 60.18 | 56.8 | 0.09 | 123 | 113 |
| 30 | ES Comunidad Madrid | 0.33 | 29,997.20 | 732.40 | 61.6 | 0.09 | 151 | 129 |
| 31 | ES Centro | 0.34 | 19,340.05 | 25.16 | 52.2 | 0.09 | 161 | 132 |
| 32 | ES Este | 0.34 | 24,946.03 | 205.63 | 59.7 | 0.09 | 330 | 293 |
| 33 | ES Sur | 0.35 | 18,284.96 | 92.86 | 54 | 0.09 | 254 | 211 |
| 34 | ES Canarias | 0.35 | 20,982.20 | 259.30 | 58.5 | 0.09 | 49 | 51 |
| 35 | FI East Finland (Ita) | 0.25 | 19,114.00 | 13.65 | 54.5 | 0.10 | 155 | 151 |
| 36 | FI South Finland (Etela) | 0.23 | 29,823.10 | 82.08 | 63.8 | 0.10 | 406 | 463 |
| 37 | FI West Finland (Lansi) | 0.24 | 22,819.80 | 18.00 | 58.8 | 0.10 | 288 | 288 |
| 38 | FI North Finland (Pohjois) | 0.22 | 22,209.30 | 4.25 | 59.4 | 0.10 | 189 | 126 |
| 39 | FR BassinParisien | 0.26 | 21,911.28 | 72.79 | 56.6 | 0.08 | 324 | 190 |
| 40 | FR Centre Est | 0.26 | 23,710.95 | 104.92 | 58.2 | 0.08 | 209 | 128 |
| 41 | FR Est | 0.23 | 21,563.49 | 110.18 | 57.6 | 0.08 | 100 | 90 |
| 42 | FR Ile De france | 0.29 | 38,666.10 | 952.78 | 61.4 | 0.08 | 299 | 153 |
| 43 | FR Méditerranée | 0.29 | 21,925.11 | 123.77 | 50.8 | 0.08 | 235 | 110 |
| 44 | FR Nord | 0.28 | 19,847.40 | 325.24 | 55.9 | 0.08 | 84 | 74 |
| 45 | FR Ouest | 0.25 | 22,194.51 | 96.29 | 55.4 | 0.08 | 201 | 144 |
| 46 | FR Sud ouest | 0.26 | 22,271.73 | 63.31 | 54.7 | 0.08 | 163 | 115 |
| 47 | UK E. Mids | 0.32 | 24,431.37 | 276.93 | 62.8 | 0.11 | 61 | 59 |
| 48 | UK Eastern | 0.34 | 25,450.94 | 290.84 | 64.1 | 0.11 | 46 | 111 |
| 49 | UK London | 0.39 | 40,615.07 | 4706.32 | 63 | 0.11 | 90 | 116 |
| 50 | UK North East b | 0.32 | 21,597.58 | 296.13 | 57.7 | 0.11 | 56 | 43 |
| 51 | UK North West | 0.33 | 23,335.01 | 482.74 | 60.6 | 0.11 | 138 | 107 |
| 52 | UK Scotland | 0.34 | 24,915.44 | 65.34 | 62.4 | 0.11 | 84 | 107 |
| 53 | UK South East | 0.35 | 29,123.26 | 428.19 | 65 | 0.11 | 187 | 169 |
| 54 | UK South West | 0.32 | 25,012.97 | 212.13 | 62.5 | 0.11 | 79 | 86 |
| 55 | UK W. Mids | 0.33 | 23,742.08 | 411.32 | 61.1 | 0.11 | 99 | 104 |
| 56 | UK Wales | 0.32 | 20,642.53 | 142.28 | 57.7 | 0.11 | 59 | 69 |
| 57 | UK Yorks & Humbs | 0.33 | 23,041.11 | 327.97 | 60.9 | 0.11 | 60 | 88 |
| 58 | UK Northern Ireland | 0.32 | 21,726.30 | 121.84 | 58.8 | 0.11 | 1012 | 307 |
| 59 | GR Voreia Ellada (Northern Greece) | 0.33 | 16,700.80 | 62.72 | 53.2 | 0.11 | M | 343 |
| 60 | GR Kentriki Ellada (Central Greece) | 0.34 | 17,431.56 | 45.64 | 51.9 | 0.11 | M | 232 |
| 61 | GR Attiki | 0.30 | 29,360.70 | 1054.94 | 51.2 | 0.11 | M | 370 |
| 62 | GR Nisia aigaiou, Kriti | 0.30 | 18,492.69 | 63.55 | 55.2 | 0.11 | M | 55 |
| 63 | IT Nord-Ovest | 0.29 | 25,315.84 | 178.41 | 49.07 | 0.22 | 218 | 100 |
| 64 | IT Lombardia | 0.30 | 30,566.90 | 398.57 | 54.20 | 0.22 | 320 | 148 |
| 65 | IT Nord Est | 0.30 | 27,647.79 | 172.22 | 54.31 | 0.22 | 235 | 137 |
| 66 | IT Centro | 0.28 | 26,229.14 | 161.80 | 51.18 | 0.22 | 355 | 147 |
| 67 | IT Lazio | 0.28 | 28,660.30 | 313.77 | 50.40 | 0.22 | 181 | 89 |
| 68 | IT Sud | 0.34 | 15,584.13 | 192.22 | 43.00 | 0.22 | 466 | 261 |
| 69 | IT Isole | 0.37 | 15,807.05 | 134.03 | 43.60 | 0.22 | 225 | 123 |
| 70 | LX Luxembourg | 0.26 | 59,201.00 | 182.75 | M | M | 1211 | 510 |
| 71 | NL North Netherlands | 0.23 a | 27,917.28 | 204.07 | 62.9 | 0.04 | 100 | 130 |
| 72 | NL East Netherlands | 0.23 a | 24,633.91 | 356.43 | 65.3 | 0.04 | 238 | 188 |
| 73 | NL West Netherlands | 0.23 a | 32,292.85 | 881.14 | 65.7 | 0.04 | 475 | 464 |
| 74 | NL South Netherlands | 0.23 a | 28,435.61 | 501.61 | 64 | 0.04 | 185 | 234 |
| 75 | PT North | M | 13,399.40 | 175.75 | 63.1 | 0.17 | 355 | 364 |
| 76 | PT Center | M | 14,287.30 | 84.55 | 66 | 0.17 | 185 | 239 |
| 77 | PT Lisboa and Vale do Tejo | M | 23,816.10 | 949.47 | 60.3 | 0.17 | 365 | 279 |
| 78 | PT Alentejo | M | 16,432.92 | 29.85 | 56.9 | 0.17 | 95 | 118 |
| 79 | SE Gotaland (including Malmo and Goteborg) | 0.24 | 25,430.54 | 50.81 | 72 | 0.06 | 507 | 452 |
| 80 | SE Svealand and Stockholm | 0.26 | 31,932.37 | 75.90 | 70.4 | 0.06 | 385 | 362 |
| 81 | SE Norrland | 0.21 | 24,760.69 | 5.91 | 67 | 0.06 | 123 | 195 |
| 82 | IE Connaught/Ulster | M | M | M | 62.0 a | 0.04 | M | 179 |
| 83 | IE Dublin | 0.31 | M | M | 62.0 a | 0.04 | M | 293 |
| 84 | IE Munster | M | M | M | 62.0 a | 0.04 | M | 281 |
| 85 | IE Rest of Leinster | M | M | M | 62.0 a | 0.04 | M | 247 |
| Average | 0.28 | 24,770.08 | 426.17 | 58.55 | 0.15 | |||
| Standard deviation | 0.05 | 6202.54 | 998.22 | 5.57 | 0.08 |

Notes:
M: Missing.
National value assumed.
Not considered for the small number of observations.
Source: Author’s elaboration from LIS (2000), EVS (1999/2000), Eurobarometer (2005, 2006), Eurostat Regional Statistics (2005).
Funding
This research received no specific grant from any funding agency in the public, commercial, or not-for-profit sectors.