
Abstract
How can declining political trust in Western democracies be explained, especially, when it remains stable and high in authoritarian societies? Underlying this question is a debate about whether political trust represents a diffuse orientation toward the political system as a whole or a specific assessment of incumbent performance. This article argues that the solution requires a move away from existing approaches that focus on question content and instead thinking about the pattern of responses. While previous work assumes that individuals display both specific and diffuse trust, we argue that the individual patterning of responses indicates either diffuse or specific trust but not both. We develop a response pattern model and use it to identify three types of individuals – critical trusters (specific trust), compliants (diffuse trust), and cynics (diffuse distrust). Tests of the model with the World Values Survey (WVS) and the US General Social Survey (GSS) show that democracies have a higher proportion of critical trusters than other systems of government and that the proportion of critical trusters has increased over time in the United States. The response pattern model directly connects cross-national and longitudinal empirical evidence to theory about the relationship between democracy and different types of trust.
Introduction
How much political trust do societies need? Polls indicate that only 40 percent of citizens around the world trust their government. In several Western democracies, trust in government has reached a historic low – down to about 20 percent in the United States and the United Kingdom (Gallup, 2015; Pew Research Center, 2015). These numbers add fuel to a long-standing debate about the importance of trust for governments. On one side of this debate are those who equate low trust with cynicism and take the observed decline in trust in the West as evidence of a democratic ‘crisis’ (e.g. see Hetherington, 2005; Huntington, 1981; Pharr and Putnam, 2000; Putnam, 2001). On the other side are those who equate low trust with critical citizenship; they view the decline as part of a new expression of democratic engagement. There is no need to worry about an observed decline in trust because other forms of political engagement, such as participation in non-institutional protest, have actually increased (Klingemann, 1999; Norris, 1999, 2011; Wang and You, 2016; Weil, 1989; Welzel, 2013).
Yet, despite several decades of scholarship, there is no resolution to the debate about the importance of trust for democracy. The reason why is that, in order to make sense of longitudinal patterns of trust, it is necessary to know whether low trust represents cynicism (and therefore discontent with politics and the political system) or is simply criticism of individual and institutional performance. Similarly, if high trust is to be beneficial for democracy, it is important to know whether it is support or compliance. Indeed, the problem of how to understand longitudinal patterns of trust also has a comparative equivalent. Some of the world’s least democratic countries such as China have very high trust, trust that is as high as that exists in many democratic countries (Bomhoff and Gu, 2012; Newton, 1999; Uslaner, 2002; Wu and Wilkes, 2017). While this might be compliance, currently there is no way to tell.
The problem is that, on the empirical side, the majority of political trust literature makes use of an additive trust index derived from questions about trust or confidence in institutions such as the government, parliament, civil service, political parties, and the justice system/courts (Catterberg and Moreno, 2006; Fisher et al., 2010). It remains unclear whether this index represents a diffuse orientation toward the political system and its institutions as a whole or whether it denotes a more specific criticism targeting particular institutional objects. This diffuse-specific distinction has deep roots in political writings dating back to Easton’s (1965, 1975) discussion of different types of political support. The net result of this debate about the meaning of the trust index is that the index itself denotes diffuse trust in some studies and specific trust in others. There is a disconnection between arguments about the nature of trust in government and the empirical evidence about it.
This article provides the connection. After explaining the limitations of existing approaches to the study of political trust and why none adequately gets at the diffuse-specific distinction, we propose a model that takes into account the structure of respondent response patterns as they are reflected by both the variability (or lack thereof) and the level of trust across questions. We argue that the political trust index does not simply represent diffuse or specific trust across the board – instead the response patterns show that the index captures diffuse trust for some individuals and specific trust for others. We then use this distinction between diffuse and specific trust as denoted in the response patterns to identify cynical, critical, and compliant trusters. The result is an a priori theorization of critical, cynical, and compliant types of trust that also accords with theorizing about trust as both diffuse and specific.
Specifically, we show that the empirical puzzle of how to understand the meaning of political trust remains because previous work focused exclusively on levels of trust and whether they are high or low, and, for this reason, it cannot distinguish between the cynic and the critic. We provide a solution to this empirical puzzle with a new theoretical model that, alongside levels of trust, considers the response pattern. That is, what matters is not only how much people trust but also how people trust. Indeed, the pattern of trust (the how question) defines the meaning of the level of trust (the how much question). When asked about their trust in the government and political institutions, respondents are likely to show different patterns that demonstrate how they trust alongside how much they trust. While critical trusters have variability in their answers, thereby demonstrating a more specific assessment of the object of trust, compliants only trust and cynics only distrust.
We test the response pattern model with survey questions on trust across place and over time using the World Values Survey (WVS, 2005–2014) and the US General Social Survey (GSS, 1972–2014). We examine whether critical trust is more prevalent both across and within democracies over time. The results indicate that democracies do contain the largest proportion of critical trusters – those who trust some institutions more than other institutions. By contrast, in authoritarian regimes and in transitional democracies, a larger percentage of citizens express either compliance or cynicism toward multiple political institutions. In other words, citizens in these regimes are more likely to either equally trust or equally distrust across institutions. We also find that, while there are fewer compliants and more critical trusters in the United States than in the past, the number of cynics has not changed in four decades. The pattern of variable levels of trust across political systems occurs because different systems have different distributions of the different forms of political trust.
Political trust: theoretical debate and an empirical challenge
Early work on political trust was concerned with understanding whether political alienation and cynicism led groups of atomized and distrusting individuals to support totalitarianism during the difficult 1930s (Kornhauser, 1959; Wright, 1976). Writing about the ‘political man’, Lipset (1960), for example, drew a connection between working-class authoritarianism (which included cynicism and distrust) and the rise of fascism in Germany, Austria, and Spain. Almond and Verba (1963) linked social trust to political trust and the successful political co-operation found in Britain and America (as compared to Germany and Italy). Others raised concerns about the manifestation of these relationships in the Soviet Union (Arendt, 1958), in Latin America (Silvert, 1967), as well as in urban areas of the United States (McCone and Christopher, 1965).
Their argument is that democratic governments are best served by a citizenry whose political trust is moral, value-driven, and reflective of a deep-seated orientation toward the regime or toward the political system as a whole (Almond and Verba, 1963; Dahl, 1971). In this line of reasoning, ‘allegiant’ trusting citizens are able to see that poor decisions may be erroneous, but they do not pose a fundamental challenge to the legitimacy of the political system (Aberbach and Walker, 1970; Lane, 1962). High trust generates a reservoir of goodwill that lowers transaction costs, thereby allowing for the smooth, everyday functioning of government (Choi and David, 2012; Fukuyama, 1995; Uslaner, 2002). High trust also leads to a host of other positive outcomes such as economic development, tax compliance, and investor confidence, all of which also contribute to democratic stability (Lipset, 1959; Newton, 2006; Scholz and Lubell, 1998).
Yet evidence from longitudinal surveys called into question claims regarding the importance of high trust for democracy. The first of these, the American National Election Studies (ANES) data showed that in the United States, political trust declined between 1968 and 1974 (Miller, 1974). While Miller took this as evidence of a democratic crisis (see also Köchler, 1987; Schmitt and Kennedy, 1988), this view was not and is not without its critics (e.g. Citrin, 1974). The counter-argument is that those with low trust are not necessarily cynical but rather critical. In this view, low trust can be more positive, reflecting citizens’ role in monitoring the state. This provides the checks and balances needed for healthy democracy (Hardin, 1999; Warren, 1999, 2016; Warren and Gastil, 2015). Trust is a rational evaluation akin to Easton’s (1975) notion of specific support, that is, ‘the satisfactions that members of a system feel they obtain from perceived outputs and performance’ (p. 437). Moreover, while it is true that too little trust may lead to political instability and revolution, too much compliance in the form of high and unvarying trust, such as that is seen in China and Vietnam, reflects political control and authoritarianism (Wong et al., 2011; Sher and Wu, 2018). 1
A resolution of this debate about the normative importance of trust for democracy requires identifying when trust denotes a critical evaluation of institutional performance (which is healthy) and when it denotes cynicism or compliance (which is not). This in turn requires making the distinction between diffuse and specific trust which have their roots in Easton’s (1965, 1975) discussions of different types of political support. Support (and hence trust) is diffuse when it represents an attitude toward the political regime, irrespective of general performance. In contrast, support (and hence trust) is specific when it ‘refers to satisfaction with government outputs and the performance of political authorities’ (Hetherington, 1998: 792). The basic argument is that if trust is diffuse, then low trust represents political cynicism and high trust represents support. In contrast, if trust is specific, then low trust might merely represent criticism (Hetherington, 1998). Thus far, existing approaches have struggled to make these distinctions.
One approach is to reduce the number of items analyzed from an index to a single question. Rather than, for example, using all the ANES items, many use the single question: ‘How much of the time do you trust the government in Washington to do what is right?’, positing that this measures a citizen’s latent general orientation toward government (Hibbing and Smith, 2004; Dennis and Owen, 2001). Others focus on specific institutions (e.g. Kääriäinen, 2007; Yang and Tang, 2010). The problem with this approach of selecting a single question is that, as Linke and Ekman (2003) noted more than a decade ago, the rationale used to justify why any given indicator reflects either diffuse or specific trust is that ‘when I use a word it means exactly what I choose it to mean’ (p. 391; see also Denk and Christensen, 2016; Kumlin, 2011).
A second approach is to group questions according to the institutional object. With this approach, items are selected, often using factor analysis, according to which institutional object of trust they represent. Institutional groupings include, for example, order versus policy institutions; input versus output institutions; administrative, legal, and societal institutions; and political, public service, economic, and social institutions (Rothstein and Stolle, 2008; Tan and Tambyah, 2011). And while it is clear that the sources of these different forms of institutional support may be variable (see, for example, Yang and Tang, 2010 study of institutional trust in China), this approach does not address whether the support for these institutions is diffuse or reflects a specific evaluation.
A third approach is to group respondents according to their answers on the response scale. Mishler and Rose (1997) collapse a 7-point response scale into three categories. Respondents trust an institution if they give it a positive score of 6 or 7 on the scale; they actively distrust an institution if they score it 1 or 2; and they are skeptical if they give an institution a score of 3, 4, or 5. Conversely, Cook and Gronke (2005) suggest that low trust in government and low confidence in institutions reflect skepticism, an unwillingness to give political authorities the benefit of the doubt. Therefore, the study of political trust needs to separate trust, lack of trust, and distrust. While active trust/distrust taps a more deeply seated orientation toward government, lack of trust in the middle associates more with short-term evaluations of political events and leaders (Cook and Gronke, 2005). This approach cannot take into account the fact that both low trust and high trust can be diffuse as well as specific in nature.
A fourth approach is to look at non-trust indicators in combination with trust. The ‘critical citizens’ approach best exemplifies this approach, although trust is not the primary focus of this scholarship. Proponents argue that different types of support, of which trust is only one, manifest themselves via different types of citizens. The theoretical argument is that critical citizens or dissatisfied democrats are those individuals who place great stake in democracy (diffuse support) but who also demand more specific support and, for this reason, are more likely to be critical or dissatisfied with government performance (Dalton and Welzel, 2014; Klingemann, 2013; Norris, 1999, 2005). It is not that these citizens participate less but instead that they participate differently (Dalton, 2015; Welzel, 2013). The presence (or absence) of critical citizens explains why political trust declined in many Western democracies and explains why some authoritarian regimes experience political upheaval and unrest, whereas others, such as China, do not (Qi and Shin, 2011). 2 The problem with this approach vis-à-vis trust is that the researcher still assumes that a given single question or set of question denotes either a specific or diffuse form of trust. Thus, even when the trust questions are used in combination with other questions about democracy, some scholars use the trust questions as indicators of a specific evaluation (Norris, 2011; Peralta, 2013), whereas others use them as indicators of diffuse support (Denk et al., 2015).
The reason that none of these approaches is able to get at the distinction between specific and diffuse trust is because in all cases, the focus is on question content. No matter the actual trust question asked, ‘the lowest category on each set of questions cannot distinguish one person who is deeply cynical and expects a malicious response from another who is simply skeptical and withholds prejudgment’ (Cook and Gronke, 2005: 786). It may be that low trust means criticality for some and cynicism for others. Any assumed meaning of other categories on the response scale is similarly indefensible. Are those in the middle critical or are they indifferent? What if, among trusters, in an individual’s judgment, an institution is actually performing well, and that is why they trust it? Why then, is high trust diffuse? In the latter case, as Easton (1965, 1975) said, ‘… in some systems, members expect to be well-governed’ (p. 441; also p. 399). The researcher still assumes that a given question indicates a given type of trust or support (Doorenspleet, 2012).
As we aim to show below, in order to understand the meaning that respondents give to particular trust questions, there has to be a shift in focus from the questions to the respondents and the response pattern. That is, if we want to understand the meaning of trust, we need to shift from thinking about trust as an object to thinking about individuals and how they might trust in similar or different ways. When variables are the focus (as in factor analysis), 3 we can identify the most commonly grouped variables but not the ‘pattern by which respondents organize, link, contrast, or put in context the various political issues, actors, and events’ (Neuman, 1981: 1248). Our argument is that the patterning of answers is key to identifying the meaning that individuals give to particular questions and that this is in turn is part of the key to identifying specific and diffuse trust.
Recently a number of scholars have studied the patterning of political attitudes and behaviors across individuals by making use of latent class analysis (LCA) and relational class analysis (RCA) (e.g. Baldassarri and Gelman, 2008; Baldassarri and Goldberg, 2014; see also Goldberg, 2011; Keating and Melis, 2017; Miller, 1972). Hooghe et al. (2017), for example, use LCA to analyze democratic ideals, placing respondents into five categories which they label ‘high ideals’, ‘medium ideals’, ‘low ideals’, ‘social rights’, and ‘political rights’ based on their responses to a battery of questions about courts, media, etc. The basic logic of these and other analyses is that any given individual will have answers that show a particular pattern and that we can group individuals based on these patterns. If, for example, there are six items, one group of individuals might rate items 1 and 5 as important – another group might rate all six items as important. 4
As with LCA, the response pattern model presented here focuses on the patterning of answers across respondents. Our argument is that, rather than trust, distrust, or distrust ‘plus’, some other non-trust indicator, individuals have different orientations toward government that are either specific or diffuse but not both – at least insofar as is reflected in their answers to a battery of political trust questions. The patterning of responses to trust questions reflects this orientation. We argue that, a priori, specific trusters trust and distrust depending on the political object. They evaluate evidence and practice reasoned judgment about government and about how different areas of government show differential institutional performance (e.g. see Burbules and Berk, 1999). In contrast, those whose orientation is diffuse either exclusively trust or exclusively distrust.
Since our model is a priori, it assigns all individuals into classes based on all possible patterns in the data even if these do not actually exist for any particular dataset (in contrast latent class models only identify classes after the fact and are therefore dependent on the distribution of patterns in any given group).
Table 1 illustrates the logic of the model. The table is based on the supposition that there are 10 political institutions j = 1 … 10 that constitute a list of political objects. Individuals are asked to indicate whether they trust (T) or distrust (D) each of these institutions. An additive approach that focuses exclusively on levels of trust and denoted as Trus ti = μj(trust) leads to the following conclusion: individual x has high political trust, individual y has low political trust, and individual z could have low or high trust. Although there is a continuum of trust, there is no way to know whether the trust of the person with low trust reflects alienation or criticism nor whether the trust of the person with high trust reflects criticism or compliance.
A response pattern model of political trust.
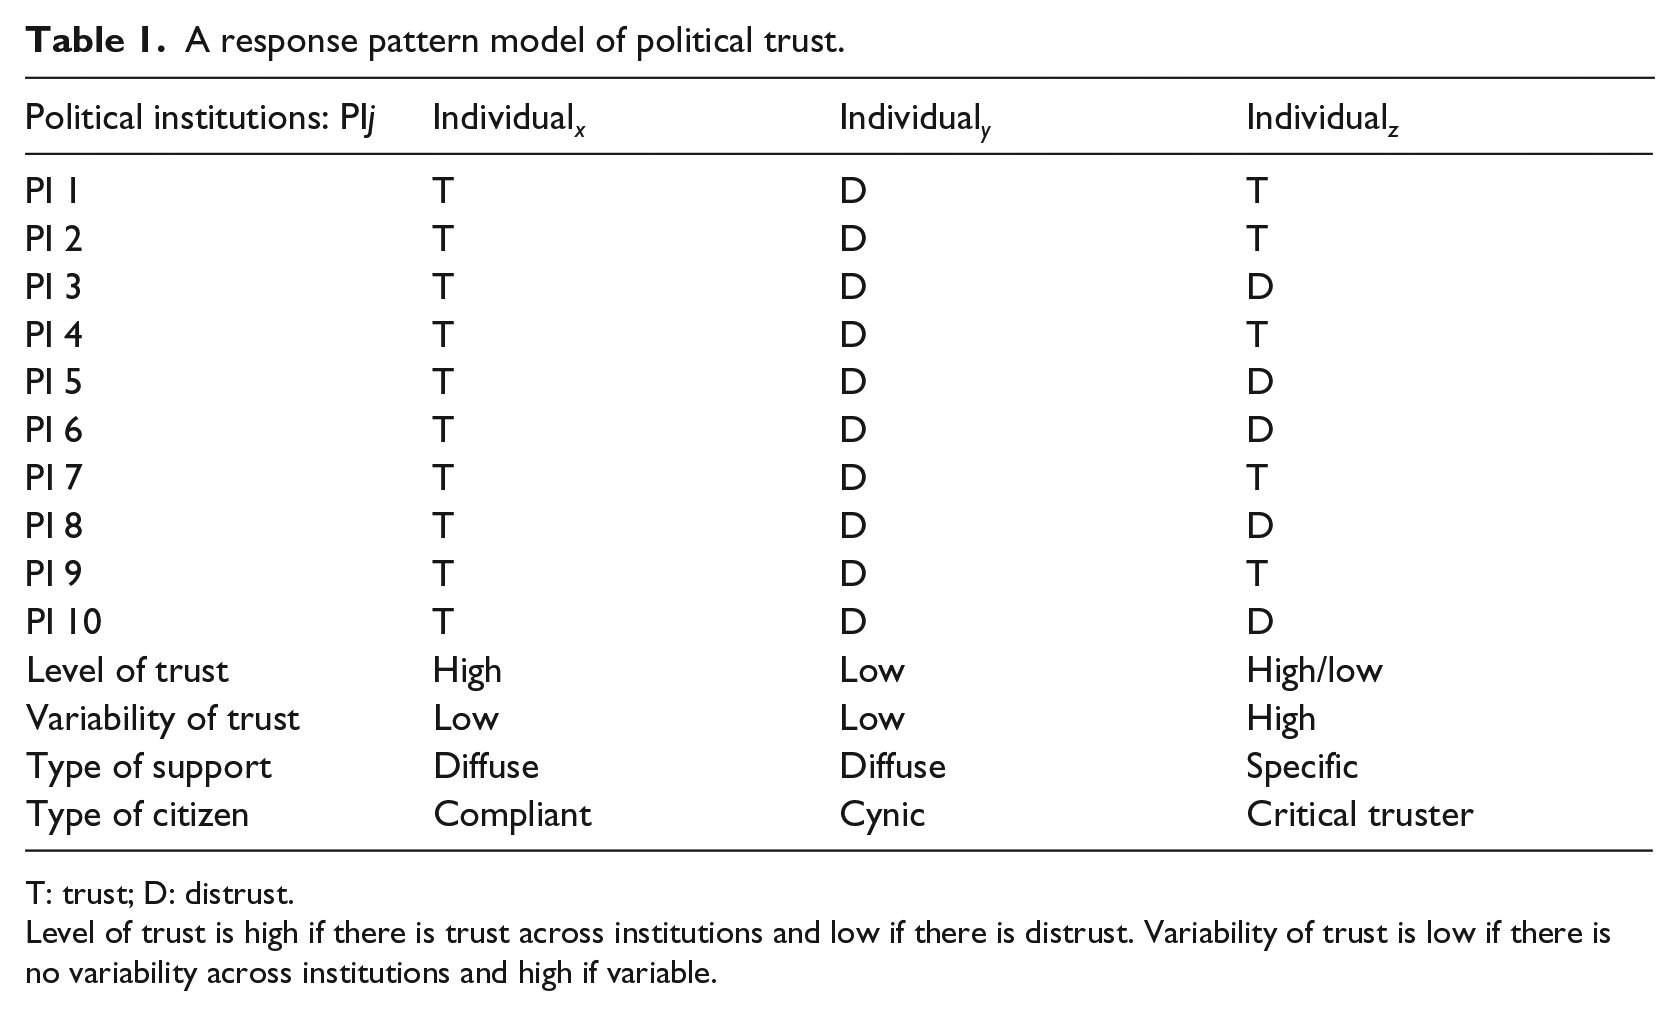
T: trust; D: distrust.
Level of trust is high if there is trust across institutions and low if there is distrust. Variability of trust is low if there is no variability across institutions and high if variable.
These different types of trust are, however, identified by taking into account the variability of each person’s trust in combination with their level of trust. While individual x has a very high level of trust – his scores exhibit very low variability – each object is trusted equally. Since x makes no distinction between institutions and because his level of trust is high, this is diffuse trust or compliance. Like individual x, individual y does not distinguish between institutions. However, because y’s trust is low, this is cynicism – diffuse distrust. Finally, while individual z trusts some institutions, she distrusts others and, as a result, these assessments vary according to the object of trust. The nature of this trust is therefore specific and critical since it depends on the object of trust. This kind of specific trust will range from low to high depending on whether the level of trust is high or low.
The response pattern model provides an a priori rationale of why the trust exhibited by individual x and individual y is only diffuse and the trust of individual z is specific. 5 Those individuals who change their judgment according to the object of trust have a greater variability of political trust, which makes their trust specific. In contrast, those individuals whose response pattern does not change show a more uncritical judgment. Because this trust is unchanging and relatively unresponsive to the object of trust, this is diffuse trust. 6 The response pattern model allows us to categorize respondents into three categories: compliants who have a high level of trust and a low variability of trust; cynics who have a low level of trust and a low variability of trust; and critical trusters who display a greater variability of political trust and whose level of trust varies from low to high. 7
The difference between diffuse trust and specific trust is the distinction between an individual who scores, for example, ‘2,2,2,2,2,2,2,2,2,2’ and one who scores ‘1,2,4,3,1,2,3,1,1,2’. While both have a low level of trust (20), according to the traditional additive approach, they are of a different type. One score is low and diffuse and the other score is low and specific. Those individuals who exhibit cynicism or who are compliant are not providing a critical evaluation of the object of trust. In contrast, those who exhibit specific trust are providing a critical evaluation, one that varies according to the object of trust. What is important is that there is variability, but it does not matter on what particular trust object. The object of criticism can vary across individuals, time, and place. The approach assumes that an individual might distrust three institutions and trust three others and therefore that, irrespective of whether the objects of their criticism vary, two individuals who each have the same pattern of trust and distrust are equally evaluative. 8 The primary difference between the response pattern approach presented below and LCA is that the latter approach is inductive and therefore data-driven. This means that, like factor analysis, latent class analysis provides no theoretical rationale for the classes derived from the data. If we use a particular dataset with particular questions, we might get a particular set of factors or classes. With another dataset that comprises a different population (even if the questions are held constant), we might get a different set of factors or classes. Unlike the response pattern model, there would still be no rationale (except post facto) for why a given set of classes is indicative of diffuse or specific trust.
Based on previous research, we test a threefold set of broad research expectations about the response pattern model. First, different countries should have different distributions of diffuse trusters (or compliants), cynics, and critical trusters. Because it depends on ‘regular elections, a free press, an independent judiciary, and professional bureaucracy’ (Runciman, 2013: xvii), democracy certainly presupposes citizens who engage in and are capable of critical thinking (e.g. see Dahl, 1971), and therefore, democracies should have the highest proportion of critical trusters. Second, the distribution of different types of citizen trust groups should change over time because economic, social, and political conditions vary within societies. Modernization led to a number of changes including gains in education, ‘skill specialization’, and ‘greater intellectual stimuli in people’s daily activities’ (Welzel and Inglehart, 2016: 13), and this should yield a greater prevalence of critical trusters over time within democracies. Third, at the individual level, because they are associated with critical thinking, socio-demographic factors such as education and political knowledge should correlate with critical trust. We test these arguments with the US GSS and the WVS data – mapping longitudinal cross-national and patterns of political trust types, as well as considering their individual level determinants.
Results
Cross-national: WVS
We begin by considering cross-national differences in political trust with the two most recent waves of the WVS (2005–2009 and 2010–2014) data. There were 94 country-years. 9 Because some countries such as Germany are only included in one wave, both waves are included to maximize the number of country cases. The model treats each country-year independently, and we test for error autocorrelation in the multivariate analyses. Our measures of trust are the confidence questions that ask,
(I am going to name a number of organizations. For each one, could you tell me how much confidence you have in them: is it a great deal of confidence, quite a lot of confidence, not very much confidence or none at all?)
The list of political organizations includes, the government (in your nation’s capital), armed forces, police, parliament, civil service, political parties, and the justice system/courts. The responses are coded as 1 = none at all, 2 = not very much confidence, 3 = quite a lot of confidence, and 4 = a great deal of confidence. 10 A confirmatory factor analysis with the pooled sample shows that all seven items do load dominantly on one factor. 11
The response pattern model requires knowledge of both the level and variability of trust. We denote the level of trust by calculating the mean trust for each individual across all seven questions, each of which ranges from 1 to 4. The individual level variability of trust is obtained by calculating the standard deviation of the scores
12
, with respondent i’s trust standard deviation across the seven political objects (
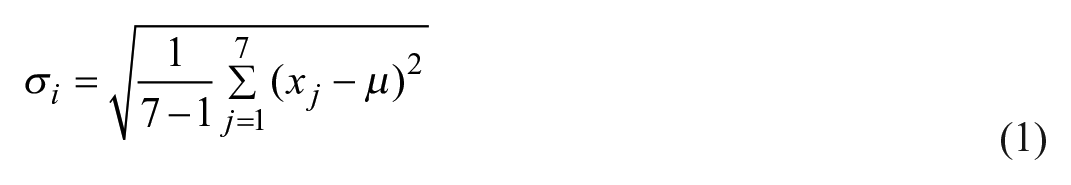
The standard deviation ranges from 0 to 1.6.
Figure 1 provides the cut points for the three types of trusters. We placed respondents into these categories based on whether their level of political trust was high or low and whether the variability of their trust was diffuse (low variability) or specific (high variability). Compliants are those whose level of political trust is high but whose variability of trust is low. Cynics are those whose level of political trust is low and whose variability of trust is low. Critical evaluative trusters are those whose level of trust is low or high but whose variability of trust is high. Because we use the mean trust for each individual across all seven questions, each of which ranges from 1 to 4, this means that we have a scale rather than items. Therefore, rather than picking a particular category, we use the midpoint of the scale (2.5) as the cut point between high and low levels of trust. We use a standard deviation of zero, indicating no variability in answers across the question, as the cut point between diffuse and specific trust. Because it might be argued that the choice of cut point for the variance is very narrow (e.g. no variability), we also re-estimated all models using a relaxed cut point that allowed some variability for diffuse trust (this is discussed in detail in the ‘Discussion’ section of this article).
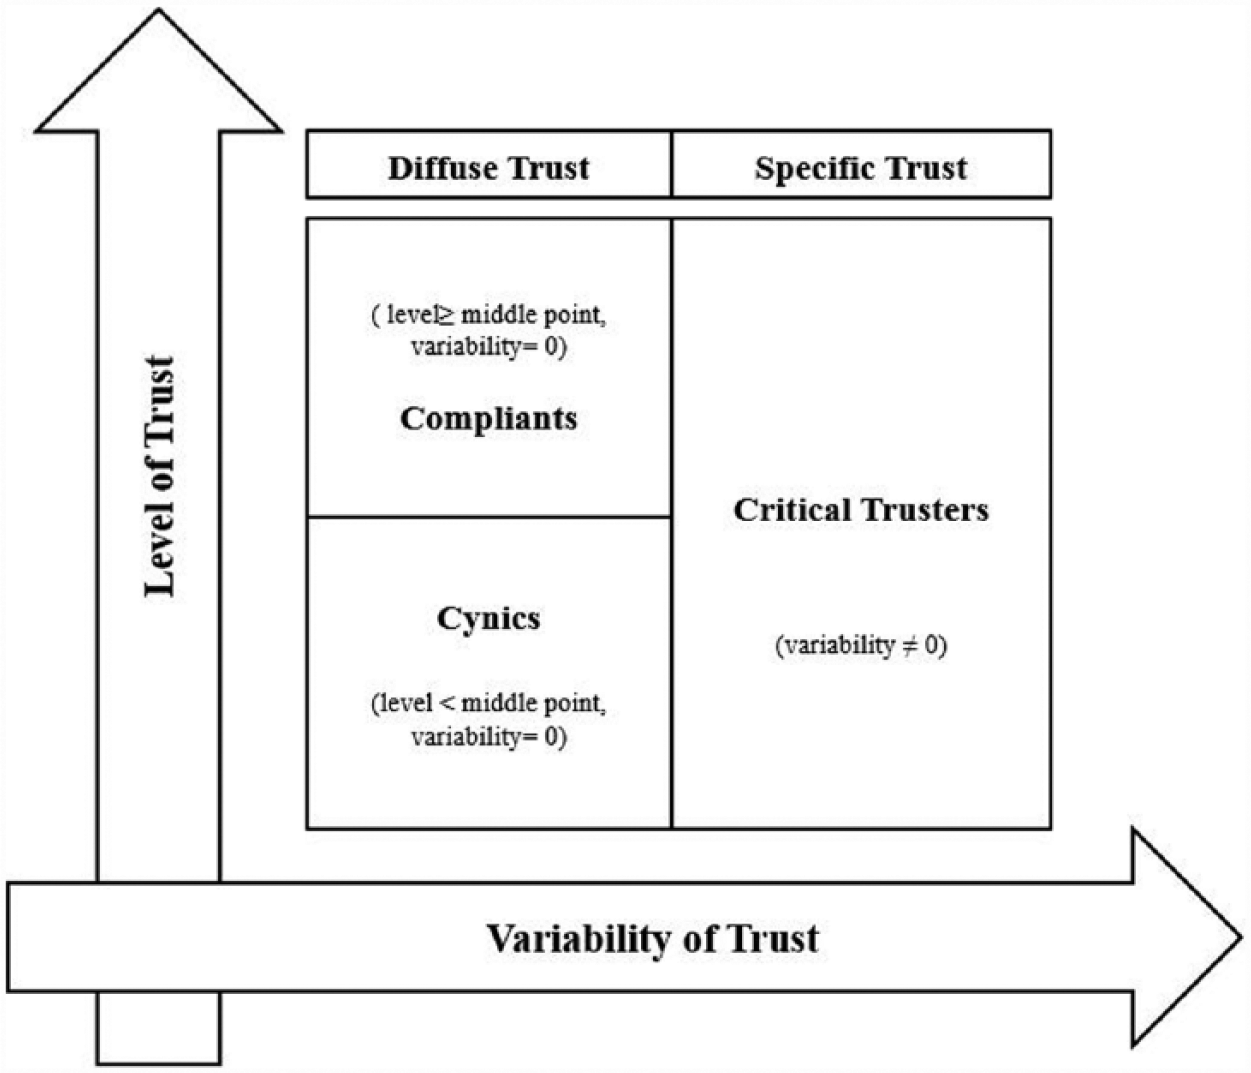
Dimensions of trust and compliants, cynics, and critical trusters.
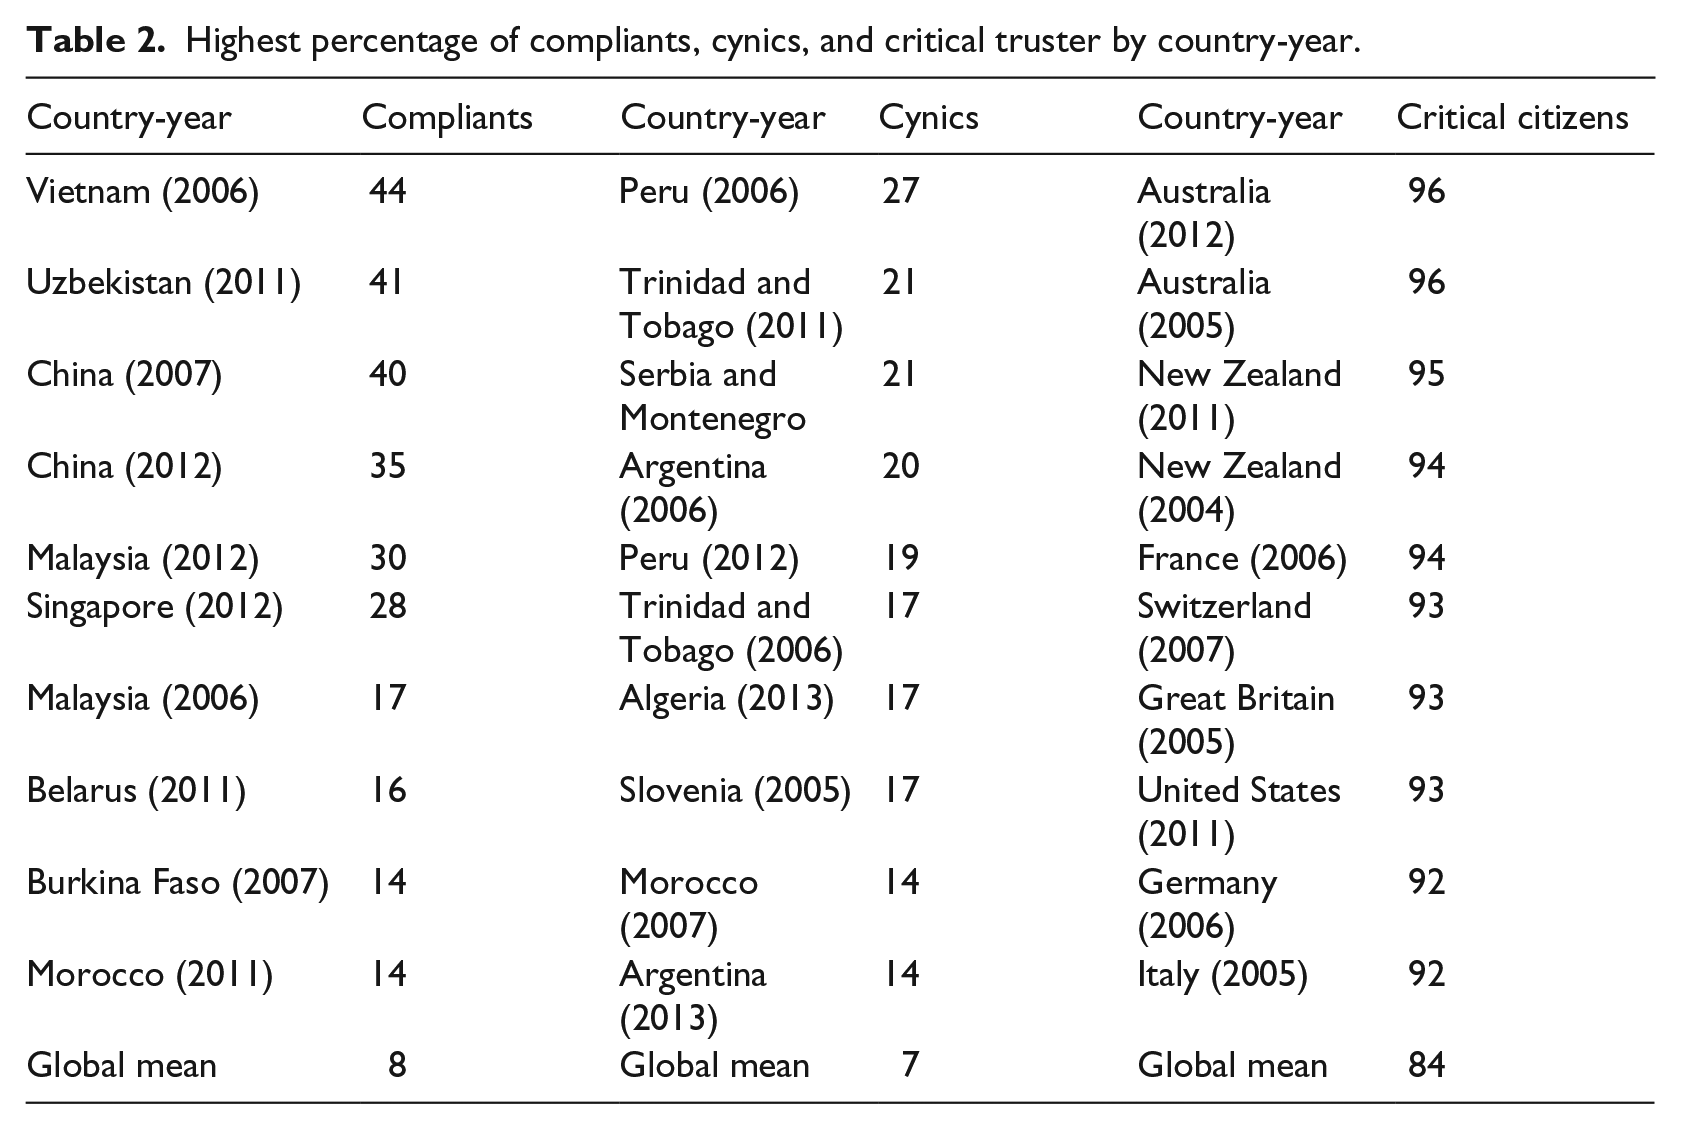
Table 2 shows the top-ranked societies (country-year) in each of the three citizen categories (Appendix 1 provides the full list). Globally, about 8 percent of people are compliants who trust all seven political institutions equally. Another 7 percent are cynics who distrust all seven political institutions equally. The remaining 85 percent are critical citizens who trust some institutions more than other institutions. The relative distribution of these three types of citizens shows considerable cross-national variation. Authoritarian regimes and less developed societies have higher levels of compliants and cynics. In Vietnam, Uzbekistan, China, and Malaysia, more than 30 percent of citizens are compliants. In contrast, in Peru, Trinidad and Tobago, Serbia and Montenegro, and Argentina, more than 20 percent are cynics. In Western democracies such as Australia, New Zealand, France, Great Britain, United States, and Germany, more than 90 percent are critical citizens. Furthermore, if the rank order of evaluative trusters is compared to a rank order based on levels alone (Figure 1 above), it becomes clear that it is possible to have a more intuitive distribution of countries on the basis of trust without discarding countries such as China.
Highest percentage of compliants, cynics, and critical truster by country-year.
Next we estimated a mixed-effects logistic regression model testing whether the likelihood of being a critical truster maps on to the level of democratization (see Appendix 2). The primary independent variable is the Economist Intelligence Unit’s (EIU’s) four-category regime type measure classifying countries as full democracies, hybrid democracies, flawed democracies, or authoritarian regimes. Country placement in each of these categories reflects aggregate scores of 60 indicators denoting five dimensions – electoral process and pluralism, liberties, government functioning, political participation, and political culture (Kekic, 2007). Based on these indicators, an index of 0–10 is created, and four types of regimes are separated according to the index with authoritarian regime ranging from 0 to 4, flawed democracies from 4 to 6, hybrid democracies from 6 to 8, and full democracies from 8 to 10. The EIU defines full democracies ‘as having a valid system of governmental checks and balances, independent judiciary and independent media’; flawed democracies have some of these elements but with ‘media infringement’ and ‘low political participation’; hybrid democracies have election ‘irregularities’ and ‘widespread corruption’; and authoritarian regimes are often dictatorships with ‘state-owned media’. 13 The model also includes controls for gender, education, age, income, and social trust – factors that predict political trust (e.g. Catterberg and Moreno, 2006) as well as country-year random effects and country controls for globalization (http://globalization.kof.ethz.ch/) and gross domestic product (GDP) per capita (https://data.worldbank.org).
While university degree and age increase the likelihood of critical trust, being female and social trust decrease it. Individuals who show more interests in politics are also more likely to be critical trusters. As expected, when asked about their trust in a list of political objects, citizens from full democracies are significantly more likely than citizens of authoritarian regimes to be critical trusters. The odds ratio (2.96) indicates that citizens in democracies are more likely to express specific trust than are citizens of authoritarian regimes.
Figure 2 plots the predicted margins and confidence bands for each regime type from this model. While there is less than an 80 percent probability that a given respondent in an authoritarian country will be critical, this increases to over 90 percent in full democracies. For hybrid and flawed democracies, this probability falls in the middle of the two, at about 85 percent. These results also hold when replacing the four EIU categories with the EIU’s 10-point democracy index or with the Polity IV democratization index. 14 There is a clear linear relationship between level of democratization and critical trust.
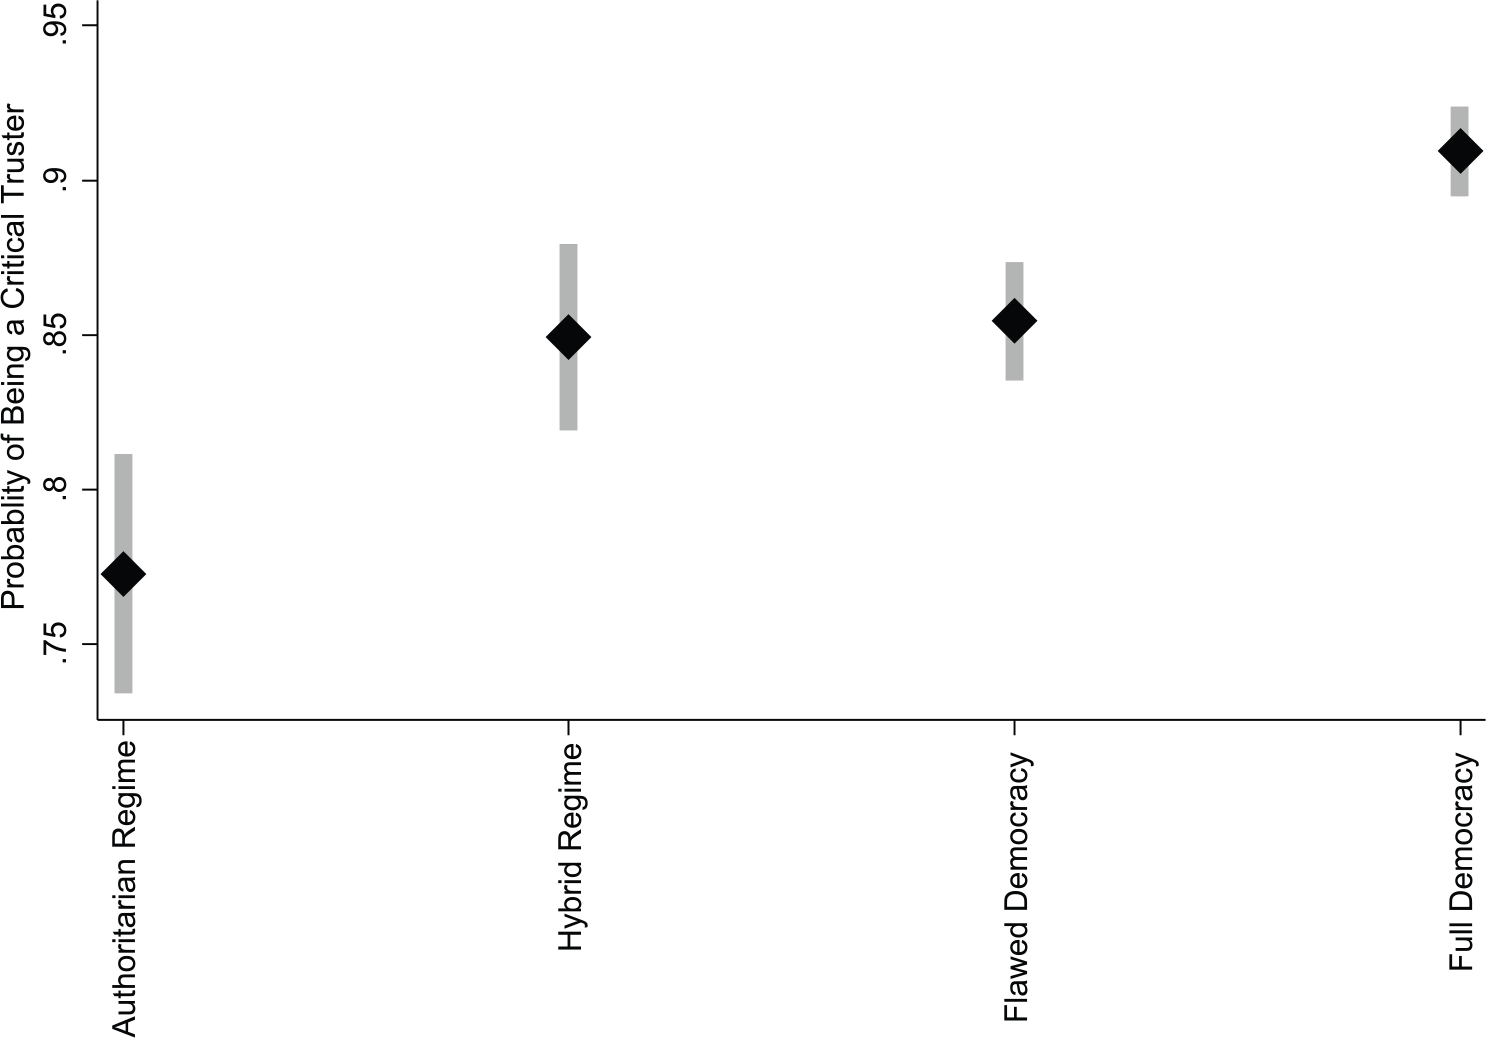
Critical trust by regime type.
Longitudinal: US GSS
The next application uses the US GSS cumulative data (1972-2014) to consider longitudinal patterns of critical trust (Figure 3; Table 3; see also Hooghe and Oser, 2017; McCright et al., 2014; Wilkes, 2015). 15 The GSS questions ask, “I am going to name some institutions in this country. As far as the people running these institutions are concerned, would you say you have a great deal of confidence, only some confidence, or hardly any confidence at all in them?” The list of institutions includes the executive branch of the federal government, the Supreme Court, Congress, and the military. 16 The responses are coded as 0 = hardly any confidence, 1 = only some confidence, and 2 = a great deal of confidence. This produces a range of 0–2 for the individual means and 0–8 for the individual total scores. The individual standard deviation ranges from 0 to 1.15. 17 Table 3 provides the distribution of compliants, cynics, and critical trusters in the United States from 1973 to 2014.
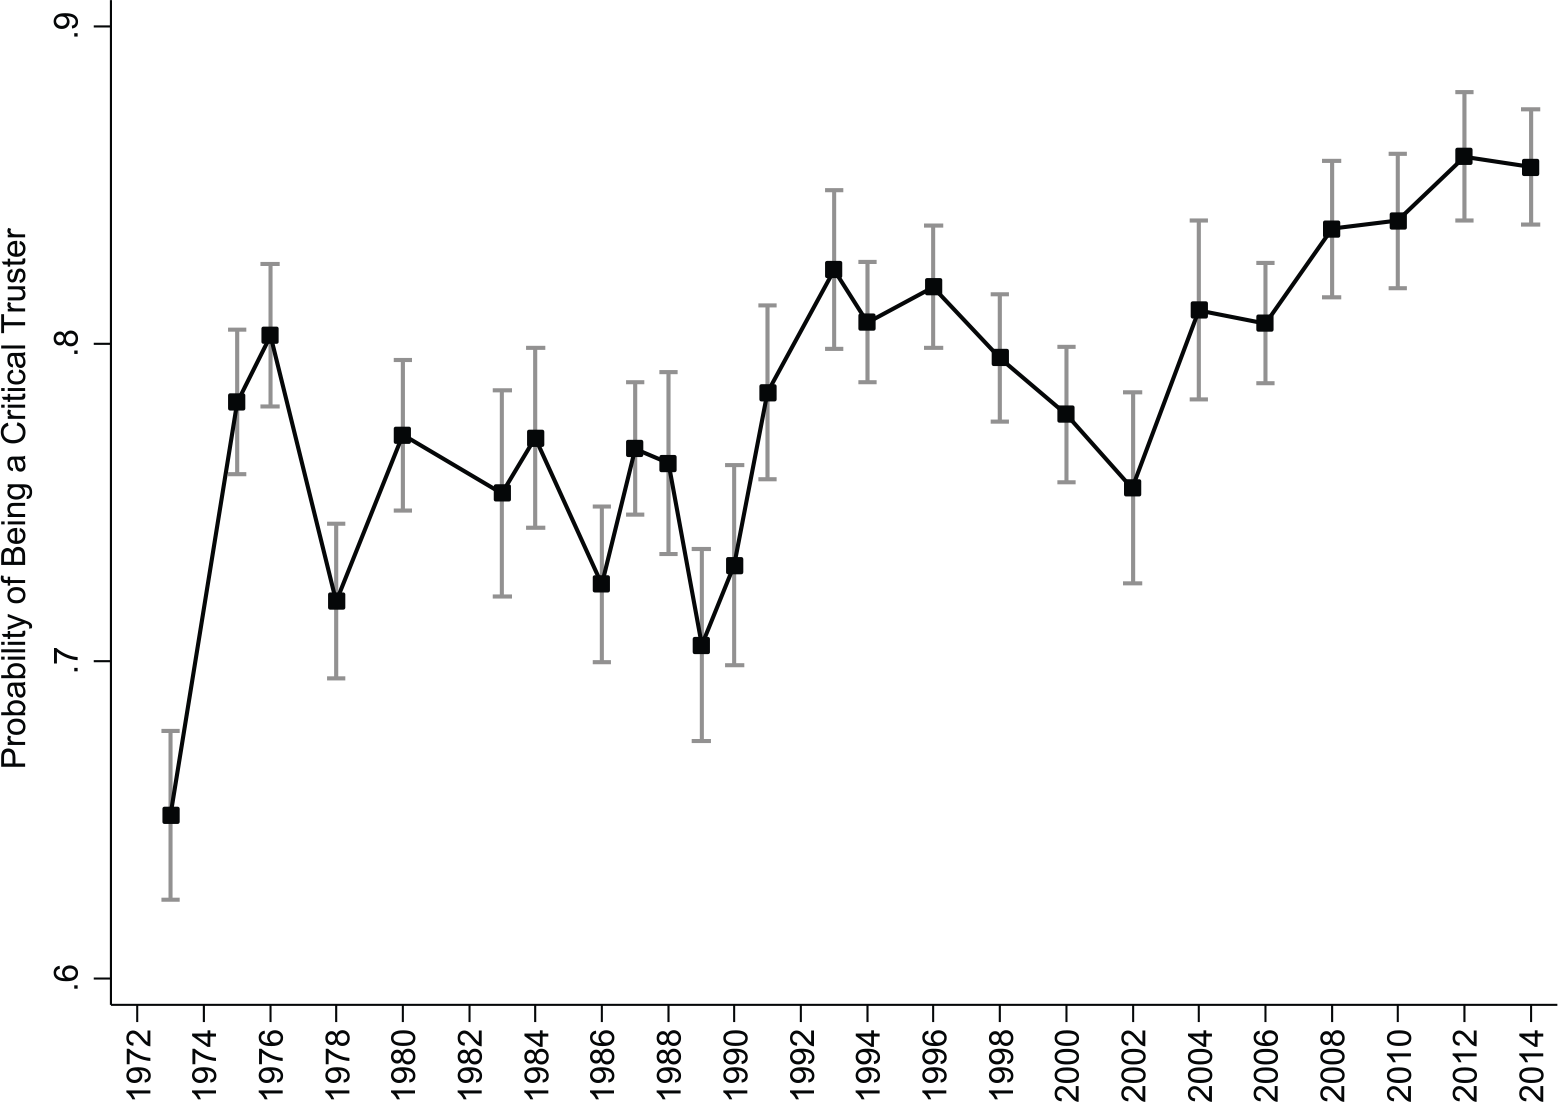
The rise of critical trust in the United States, 1972-2014.
The Changing nature of political support in the US (GSS, 1972–2014).
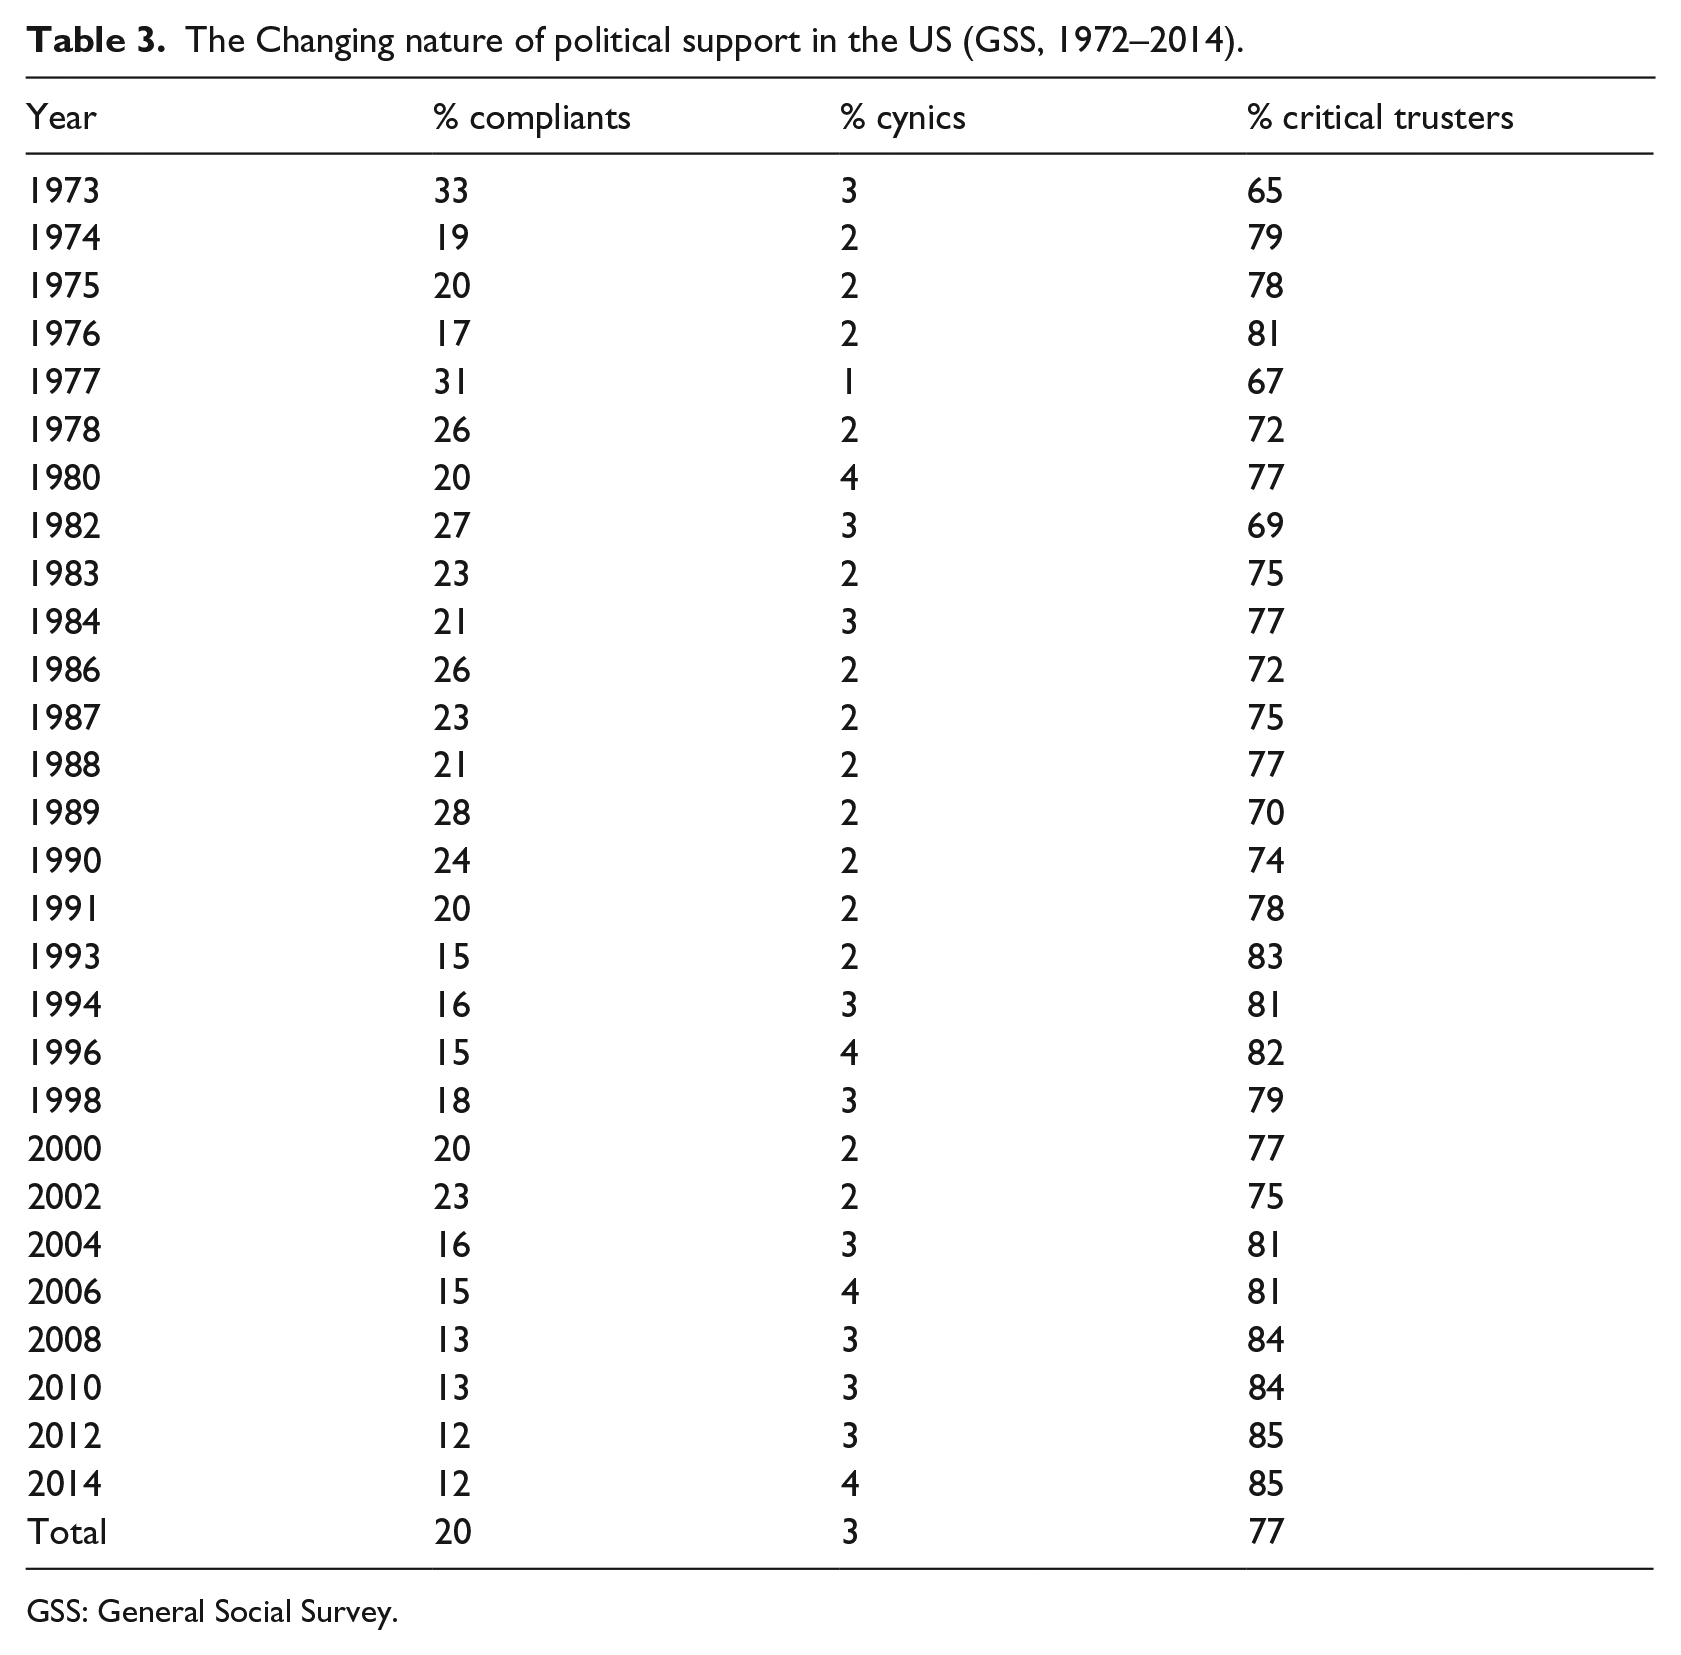
GSS: General Social Survey.
There is a general decline in the percentage of compliants. Trust in the executive branch of the federal government, in the Supreme Court, in Congress, and in the military was high across the board for 33 percent of Americans in 1973. However, only about 3 percent of Americans were truly cynical, a figure that has not changed since the 1970s. To explain why Americans’ trust became increasingly critical, we provide the results from a mixed-effects logistic regression model that include fixed effects of education, gender, race, age, and income as well as year random effects (see Appendix 3). As with the WVS, the likelihood of being critical taps into existing gender, age, and racial cleavages. 18 Younger people, the less educated, women, and racialized minority groups are less likely to have critical trust than older people, men, and White Americans. Over time, rising of general levels of education likely led Americans to become increasingly evaluative toward their political institutions. Still, even with controls for race, education, gender, income, as well as social trust, the predictive probability of being a critical truster shows a clear increase over the last four decades (1972–2014).
Discussion
The response pattern model differentiates between diffuse and specific trust (a half-century empirical challenge since Easton), and we use it to identify the distribution of compliants, cynics, and critical trusters across place and time. The greater prevalence of critical trusters in more democratic states, their growth in numbers within such states, and the concomitant prevalence of compliants and cynics under authoritarian regimes are illustrated using trust alone. Still, to ensure the generalizability of the model, we address a number of possible constraints.
First is whether the model simply reflects the role of acquiescence response set bias, that is, the tendency of some respondents to pick the same general position on the scale over and over (Kolson and Green, 1970). There is a parallel between this form of response set bias and diffuse trust and distrust – individuals with response set bias are either unable or uninterested in distinguishing between the objects of trust. However, what matters is that the pattern of giving similar answers, irrespective of the question, can and does occur on both ends of the scale and that this in itself is a meaningful distinction. Although the model does not address country-specific differences in scale location (e.g. see King et al., 2003), the pattern of consistent positive and negative answers shows large and meaningful temporal and cross-national differences.
Second is whether the variability taken to denote critical evaluation is in fact critical evaluation or whether it is simply the odd random response. As the multivariate analyses show, this is more than random response because other individual level predictors that typically correlate with evaluation, such as education, and country-level predictors, such as democratization, have a positive effect on the evaluative trust measure. The results are also more than random response because they hold when we change the variance cutoff. We used zero variance as the cut point to distinguish diffuse from specific trust and, hence, placed compliants and cynics in the diffuse category and critical trusters in the specific category. How do the results change if the cut point is more flexible? We conducted additional tests of whether the results are sensitive to the cut points used to classify the variability of trust as low or high with the WVS data (results in Appendix 4). The first line in the table shows the percentage of critical trusters with the cut point used in this article – no variance. The average percentage of critical trusters in full democracies is 90 percent, whereas it is 76 percent in authoritarian regimes. A change in the cut point shifts more respondents into the compliant and cynical category, but crucially, the basic relative pattern across regime types does not change. Even when there is variability on three out of seven questions, more democratic governments continue to have a greater preponderance of critical trusters than authoritarian regimes.
Third is whether the range of those considered critical is too large. In this article, our primary focus is on whether a given respondent is critical or not rather than on the level of criticality. Thus, critical trusters include those who score both positively and negatively on a 10-point scale (e.g. both 6,7,8,9,10 and 1,2,3,4,5 fit the definition of critical truster). The utility of coding a particular country as having 85 percent critical citizens might be an issue. This is a particular challenge in terms of thinking about cross-sectional research versus thinking about within country analysis. That is, we are dealing with countries with individuals that are going to have very different political orientations.
The difference between our article and previous studies is that the high proportion of critical trusters is made explicit (i.e. we provide the distribution of critical trusters). In contrast, to the best of our knowledge, previous work does not show the country-specific distribution of citizen types. We ran additional analyses, cutting the critical truster category into positive and negative critical trusters. The results show that in highly functional democracies such as Norway, Finland, Sweden, and Switzerland, more than 60 percent of critical trusters are on the positive side. This number goes down to around 50 percent in Great Britain, the United States, and Canada and to around 30–40 percent in France, Germany, Japan, and South Korea.
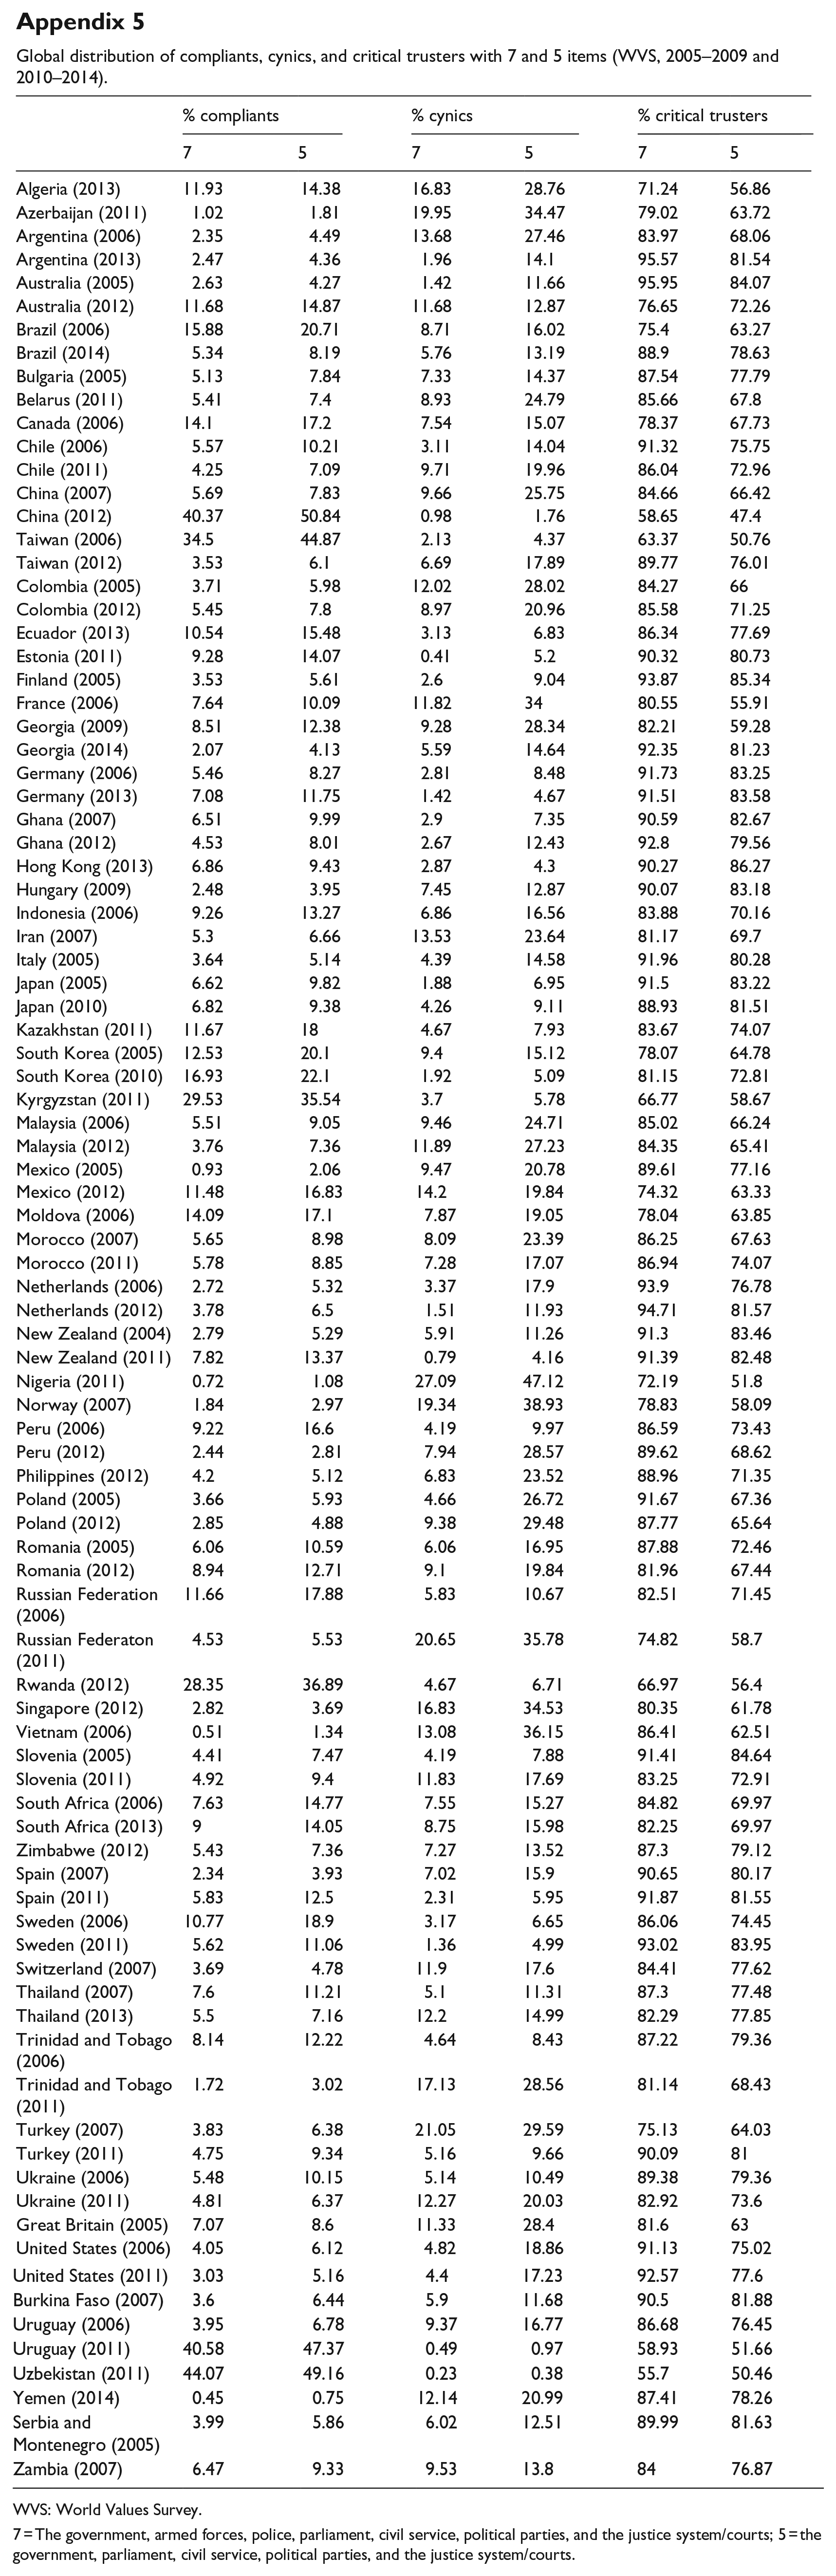
Fourth is whether the results are sensitive to the number of questions about trust used in the calculations of the mean and variance. The WVS has seven questions about trust in the government (in your nation’s capital), armed forces, police, parliament, civil service, political parties, and the justice system/courts. The GSS has four questions about trust in the executive branch of the federal government, the Supreme Court, Congress, and the military. Each of these datasets comprises a different number of items, and the findings are very similar. Are the results also robust within datasets to the number of items used?
We tested whether the general pattern and predictors were the same when dropping items. In the case of the WVS, we re-ran each model, dropping down to six items and then again down to five items. There are minor changes. For example, Australia has the highest percentage of critical trusters in 27 out of 28 possible combinations. Thus, even down to (any) five items, democracies have a higher percentage of critical trusters than authoritarian governments. Appendix 5 shows the distribution of critical trusters, cynics, and compliants for each country-year (WVS) when all seven items are used and when using five items (removing police and the military). With fewer items, the percentage of diffuse trusters (compliants and cynics) increases, but not to a large extent. In the United States, there is an increase in the percentage of cynics. Most importantly, however, the cross-national patterns do not change. Critical citizens dominate in democratic regimes, whereas non-democratic states such as China, Vietnam, and Uzbekistan still have a large percentage of compliants/cynics.
Fifth, is whether there are non-equivalent understandings of the political trust indicators across countries caused by the WVS survey instrument. The variability of the responses could be the result of non-equivalent properties of the survey instrument including differences stemming from translation or social context. As a reviewer pointed out, in one place, for example, people might evaluate local and regional political institutions similarly because the institutions fall under the same legal jurisdiction, whereas in another place where local politicians or clans have more power, people might be more likely to distinguish their trust responses. While we cannot rule out the possibility of these types of non-equivalence for the WVS items, studies show fairly robust measurement equivalence for the ANES (Poznyak et al., 2014) and for the European Social Survey (Reeskens and Hooghe, 2008) political trust items. Nevertheless, there needs to be further research on the extent to which such conclusions might also apply to the WVS data.
Conclusion
Political trust is the ‘sine qua non of good governance’ (Blind, 2007: 9), and for this reason, ‘generating and maintaining political support remains one of the most important tasks confronting both established and emerging democracies around the world’ (Peralta, 2013: 480). Decades of empirical research focused on how much trust societies need. The unanticipated election of Donald Trump to the Presidency of the United States and the soul-searching that this provokes among many within the academy is reflective of the fact that our models of political trust are in need of revision. We argued that, because the basis for existing models is an assessment of levels of trust, that is, whether an individual trusts or distrusts government, these models cannot indicate whether, at the low end, this is criticism or cynicism and whether, at the high end, this is simply compliance.
This article shifted the focus from the objects that citizens might trust (which is a question-centered approach) or distrust to how they trust and distrust (which is a response pattern approach). While previous work assumes that individuals display both specific and diffuse trust, we argue that the individual patterning of responses indicates either diffuse or specific trust but not both. Our model taps into this evaluation by using these types of trust to categorize respondents as critical trusters, as cynics, or as compliants. We did so by considering the combination of the mean (level – how much) and the variance (how) of their answers to a series of political trust questions. The approach is consistent with theoretical arguments about the kinds of citizens that are most conducive to democracy – what matters is that citizens learn ‘how to think, definitely not what to think. A public capable of thinking for itself is democracy’s first line of defense’ (Martin, 2015: 249; italics in original). By engaging with the objects of government, this critical group predominates in Western democracies.
Reflecting this idea, the response pattern model presented in the article has the potential to solve the puzzle of why high trust in authoritarian countries occurs at the same time as declining trust in democratic countries. Globally, polls indicate that only 40 percent of citizens around the world trust their government. This percentage is lower in many democracies and higher in many autocracies (Edleman Trust Barometer, 2015). These types of countries do not simply have different levels of trust. Instead, the distribution of different types of trust within these types of countries is variable. Democracies of all stripes – Sweden, Australia, and New Zealand to name a few – have the highest number of critical trusters. There are more cynics in hybrid and flawed democracies in Latin America and the former Eastern Bloc countries. Authoritarian regimes such as China, Vietnam, and Singapore, in contrast, have far more compliance because ‘autocracy attempts directly to institutionalize trust, and turn it into a strongly sanctioned formal demand’ (Sztompka, 1999: 148).
The response pattern model also provides a means of viewing the recent US electoral results in a way that does not de facto imply that the state of US democracy itself is in crisis. Early indicators show that while low, the share of the US population who voted in the recent election is comparable to that of other years (Harrington and Gould, 2016). The model shows that although trust in the United States declined, the number of true cynics has not changed in decades (see also Paxton, 1999). Although we do not wish to overstate the case, it is also worth noting that there are contemporary democracies that weathered similar challenges. Only 2 years ago, for example, in Canada levels of trust in government were comparable those in the United States (Ekos, 2016). Yet by 2016, political trust had rebounded to its highest level in years.
Footnotes
Appendix
Global distribution of compliants, cynics, and critical trusters with 7 and 5 items (WVS, 2005–2009 and 2010–2014).
| % compliants |
% cynics |
% critical trusters |
||||
|---|---|---|---|---|---|---|
| 7 | 5 | 7 | 5 | 7 | 5 | |
| Algeria (2013) | 11.93 | 14.38 | 16.83 | 28.76 | 71.24 | 56.86 |
| Azerbaijan (2011) | 1.02 | 1.81 | 19.95 | 34.47 | 79.02 | 63.72 |
| Argentina (2006) | 2.35 | 4.49 | 13.68 | 27.46 | 83.97 | 68.06 |
| Argentina (2013) | 2.47 | 4.36 | 1.96 | 14.1 | 95.57 | 81.54 |
| Australia (2005) | 2.63 | 4.27 | 1.42 | 11.66 | 95.95 | 84.07 |
| Australia (2012) | 11.68 | 14.87 | 11.68 | 12.87 | 76.65 | 72.26 |
| Brazil (2006) | 15.88 | 20.71 | 8.71 | 16.02 | 75.4 | 63.27 |
| Brazil (2014) | 5.34 | 8.19 | 5.76 | 13.19 | 88.9 | 78.63 |
| Bulgaria (2005) | 5.13 | 7.84 | 7.33 | 14.37 | 87.54 | 77.79 |
| Belarus (2011) | 5.41 | 7.4 | 8.93 | 24.79 | 85.66 | 67.8 |
| Canada (2006) | 14.1 | 17.2 | 7.54 | 15.07 | 78.37 | 67.73 |
| Chile (2006) | 5.57 | 10.21 | 3.11 | 14.04 | 91.32 | 75.75 |
| Chile (2011) | 4.25 | 7.09 | 9.71 | 19.96 | 86.04 | 72.96 |
| China (2007) | 5.69 | 7.83 | 9.66 | 25.75 | 84.66 | 66.42 |
| China (2012) | 40.37 | 50.84 | 0.98 | 1.76 | 58.65 | 47.4 |
| Taiwan (2006) | 34.5 | 44.87 | 2.13 | 4.37 | 63.37 | 50.76 |
| Taiwan (2012) | 3.53 | 6.1 | 6.69 | 17.89 | 89.77 | 76.01 |
| Colombia (2005) | 3.71 | 5.98 | 12.02 | 28.02 | 84.27 | 66 |
| Colombia (2012) | 5.45 | 7.8 | 8.97 | 20.96 | 85.58 | 71.25 |
| Ecuador (2013) | 10.54 | 15.48 | 3.13 | 6.83 | 86.34 | 77.69 |
| Estonia (2011) | 9.28 | 14.07 | 0.41 | 5.2 | 90.32 | 80.73 |
| Finland (2005) | 3.53 | 5.61 | 2.6 | 9.04 | 93.87 | 85.34 |
| France (2006) | 7.64 | 10.09 | 11.82 | 34 | 80.55 | 55.91 |
| Georgia (2009) | 8.51 | 12.38 | 9.28 | 28.34 | 82.21 | 59.28 |
| Georgia (2014) | 2.07 | 4.13 | 5.59 | 14.64 | 92.35 | 81.23 |
| Germany (2006) | 5.46 | 8.27 | 2.81 | 8.48 | 91.73 | 83.25 |
| Germany (2013) | 7.08 | 11.75 | 1.42 | 4.67 | 91.51 | 83.58 |
| Ghana (2007) | 6.51 | 9.99 | 2.9 | 7.35 | 90.59 | 82.67 |
| Ghana (2012) | 4.53 | 8.01 | 2.67 | 12.43 | 92.8 | 79.56 |
| Hong Kong (2013) | 6.86 | 9.43 | 2.87 | 4.3 | 90.27 | 86.27 |
| Hungary (2009) | 2.48 | 3.95 | 7.45 | 12.87 | 90.07 | 83.18 |
| Indonesia (2006) | 9.26 | 13.27 | 6.86 | 16.56 | 83.88 | 70.16 |
| Iran (2007) | 5.3 | 6.66 | 13.53 | 23.64 | 81.17 | 69.7 |
| Italy (2005) | 3.64 | 5.14 | 4.39 | 14.58 | 91.96 | 80.28 |
| Japan (2005) | 6.62 | 9.82 | 1.88 | 6.95 | 91.5 | 83.22 |
| Japan (2010) | 6.82 | 9.38 | 4.26 | 9.11 | 88.93 | 81.51 |
| Kazakhstan (2011) | 11.67 | 18 | 4.67 | 7.93 | 83.67 | 74.07 |
| South Korea (2005) | 12.53 | 20.1 | 9.4 | 15.12 | 78.07 | 64.78 |
| South Korea (2010) | 16.93 | 22.1 | 1.92 | 5.09 | 81.15 | 72.81 |
| Kyrgyzstan (2011) | 29.53 | 35.54 | 3.7 | 5.78 | 66.77 | 58.67 |
| Malaysia (2006) | 5.51 | 9.05 | 9.46 | 24.71 | 85.02 | 66.24 |
| Malaysia (2012) | 3.76 | 7.36 | 11.89 | 27.23 | 84.35 | 65.41 |
| Mexico (2005) | 0.93 | 2.06 | 9.47 | 20.78 | 89.61 | 77.16 |
| Mexico (2012) | 11.48 | 16.83 | 14.2 | 19.84 | 74.32 | 63.33 |
| Moldova (2006) | 14.09 | 17.1 | 7.87 | 19.05 | 78.04 | 63.85 |
| Morocco (2007) | 5.65 | 8.98 | 8.09 | 23.39 | 86.25 | 67.63 |
| Morocco (2011) | 5.78 | 8.85 | 7.28 | 17.07 | 86.94 | 74.07 |
| Netherlands (2006) | 2.72 | 5.32 | 3.37 | 17.9 | 93.9 | 76.78 |
| Netherlands (2012) | 3.78 | 6.5 | 1.51 | 11.93 | 94.71 | 81.57 |
| New Zealand (2004) | 2.79 | 5.29 | 5.91 | 11.26 | 91.3 | 83.46 |
| New Zealand (2011) | 7.82 | 13.37 | 0.79 | 4.16 | 91.39 | 82.48 |
| Nigeria (2011) | 0.72 | 1.08 | 27.09 | 47.12 | 72.19 | 51.8 |
| Norway (2007) | 1.84 | 2.97 | 19.34 | 38.93 | 78.83 | 58.09 |
| Peru (2006) | 9.22 | 16.6 | 4.19 | 9.97 | 86.59 | 73.43 |
| Peru (2012) | 2.44 | 2.81 | 7.94 | 28.57 | 89.62 | 68.62 |
| Philippines (2012) | 4.2 | 5.12 | 6.83 | 23.52 | 88.96 | 71.35 |
| Poland (2005) | 3.66 | 5.93 | 4.66 | 26.72 | 91.67 | 67.36 |
| Poland (2012) | 2.85 | 4.88 | 9.38 | 29.48 | 87.77 | 65.64 |
| Romania (2005) | 6.06 | 10.59 | 6.06 | 16.95 | 87.88 | 72.46 |
| Romania (2012) | 8.94 | 12.71 | 9.1 | 19.84 | 81.96 | 67.44 |
| Russian Federation (2006) | 11.66 | 17.88 | 5.83 | 10.67 | 82.51 | 71.45 |
| Russian Federaton (2011) | 4.53 | 5.53 | 20.65 | 35.78 | 74.82 | 58.7 |
| Rwanda (2012) | 28.35 | 36.89 | 4.67 | 6.71 | 66.97 | 56.4 |
| Singapore (2012) | 2.82 | 3.69 | 16.83 | 34.53 | 80.35 | 61.78 |
| Vietnam (2006) | 0.51 | 1.34 | 13.08 | 36.15 | 86.41 | 62.51 |
| Slovenia (2005) | 4.41 | 7.47 | 4.19 | 7.88 | 91.41 | 84.64 |
| Slovenia (2011) | 4.92 | 9.4 | 11.83 | 17.69 | 83.25 | 72.91 |
| South Africa (2006) | 7.63 | 14.77 | 7.55 | 15.27 | 84.82 | 69.97 |
| South Africa (2013) | 9 | 14.05 | 8.75 | 15.98 | 82.25 | 69.97 |
| Zimbabwe (2012) | 5.43 | 7.36 | 7.27 | 13.52 | 87.3 | 79.12 |
| Spain (2007) | 2.34 | 3.93 | 7.02 | 15.9 | 90.65 | 80.17 |
| Spain (2011) | 5.83 | 12.5 | 2.31 | 5.95 | 91.87 | 81.55 |
| Sweden (2006) | 10.77 | 18.9 | 3.17 | 6.65 | 86.06 | 74.45 |
| Sweden (2011) | 5.62 | 11.06 | 1.36 | 4.99 | 93.02 | 83.95 |
| Switzerland (2007) | 3.69 | 4.78 | 11.9 | 17.6 | 84.41 | 77.62 |
| Thailand (2007) | 7.6 | 11.21 | 5.1 | 11.31 | 87.3 | 77.48 |
| Thailand (2013) | 5.5 | 7.16 | 12.2 | 14.99 | 82.29 | 77.85 |
| Trinidad and Tobago (2006) | 8.14 | 12.22 | 4.64 | 8.43 | 87.22 | 79.36 |
| Trinidad and Tobago (2011) | 1.72 | 3.02 | 17.13 | 28.56 | 81.14 | 68.43 |
| Turkey (2007) | 3.83 | 6.38 | 21.05 | 29.59 | 75.13 | 64.03 |
| Turkey (2011) | 4.75 | 9.34 | 5.16 | 9.66 | 90.09 | 81 |
| Ukraine (2006) | 5.48 | 10.15 | 5.14 | 10.49 | 89.38 | 79.36 |
| Ukraine (2011) | 4.81 | 6.37 | 12.27 | 20.03 | 82.92 | 73.6 |
| Great Britain (2005) | 7.07 | 8.6 | 11.33 | 28.4 | 81.6 | 63 |
| United States (2006) | 4.05 | 6.12 | 4.82 | 18.86 | 91.13 | 75.02 |
| United States (2011) | 3.03 | 5.16 | 4.4 | 17.23 | 92.57 | 77.6 |
| Burkina Faso (2007) | 3.6 | 6.44 | 5.9 | 11.68 | 90.5 | 81.88 |
| Uruguay (2006) | 3.95 | 6.78 | 9.37 | 16.77 | 86.68 | 76.45 |
| Uruguay (2011) | 40.58 | 47.37 | 0.49 | 0.97 | 58.93 | 51.66 |
| Uzbekistan (2011) | 44.07 | 49.16 | 0.23 | 0.38 | 55.7 | 50.46 |
| Yemen (2014) | 0.45 | 0.75 | 12.14 | 20.99 | 87.41 | 78.26 |
| Serbia and Montenegro (2005) | 3.99 | 5.86 | 6.02 | 12.51 | 89.99 | 81.63 |
| Zambia (2007) | 6.47 | 9.33 | 9.53 | 13.8 | 84 | 76.87 |
WVS: World Values Survey.
7 = The government, armed forces, police, parliament, civil service, political parties, and the justice system/courts; 5 = the government, parliament, civil service, political parties, and the justice system/courts.
Acknowledgements
We thank Mark Warren, Sylvia Fuller, Jan Mewes, Howard Ramos, Rengin Firat, Eric Uslaner, Terry Clark, Christian Welzel, Chloe Sher, Malcolm Fairbrother, Editor David Smith, and six anonymous reviewers for their helpful comments and advice.
Funding
Funding for this research was provided by Riksbankens Jubileumsfonds: The Swedish Foundation for Humanities and Social Sciences (project no. NHS14-2035:1) and by an Insight Grant from the Social Sciences and Humanities Research Council of Canada.