
Abstract
The United States and Canada represent two of the largest immigrant-receiving countries. Although both countries have long histories of receiving immigrants, they are viewed differently in their abilities to integrate immigrants and their children. A popular and reoccurring narrative is Canada’s greater ability to integrate immigrants and their children compared with the United States. One possible explanation is that coethnic communities in Canada are more visible and supported by government funding than coethnic communities in the United States, which may differentially affect the outcomes of immigrants’ children in the two countries. Using nationally representative data from the Sensitive General Social Survey and Ethnic Diversity Survey, this study examines the effects of coethnic community, national origin group, and individual characteristics on educational attainment in the United States and Canada. This study utilizes differences in coethnic community and national origin group effects to understand institutional differences between the two countries. In particular, it finds that coethnic community education has a positive effect in both countries, but the effects for coethnic community income and educational selectivity differ. This study suggests that differences in coethnic community income and educational selectivity may be due to differences in immigration policy, which shape the types of settlement challenges and sources of support that immigrants and their children encounter upon arrival.
Keywords
The United States and Canada represent two of the largest immigrant-receiving countries. Immigrants and their children comprise about 20 percent 1 of the US population and nearly 40 percent 2 of Canada’s population. Despite each country’s long history of receiving immigrants, the two are viewed differently in their abilities to integrate immigrants and their descendants. A popular and reoccurring narrative is Canada’s greater ability to integrate immigrants and their descendants compared with the United States. In particular, explanations center around Canada’s context as a host country that provides government support for immigrant integration and a selective migration policy favoring skilled migrants. One way to understand these host country differences is vis-à-vis coethnic communities where immigrants and their children settle. Coethnic communities in Canada are more visible and supported by government funding than coethnic communities in the United States, which may differentially affect the outcomes of immigrants’ descendants in the two countries. Since coethnic communities operate under different conditions in the two countries, this study examines how the coethnic community affects the educational attainment of immigrants’ descendants in the United States and Canada, net of national origin group and individual characteristics.
Educational attainment of immigrants’ children
A primary focus of the integration of immigrants’ children centers around their educational attainment, especially as it predicts labor market outcomes. One puzzle concerning the educational outcomes of immigrants’ children is that they differ by host country context (Levels et al., 2008; Rothon et al., 2009). For instance, even though immigrants’ descendants appear to outperform the majority population in the United States and Canada, there are mixed findings in Britain and Spain, where they show lower educational aspirations and attainment (Portes et al., 2010; Rothon et al., 2009). Cross-national differences in educational attainment may be related to parental characteristics; since the economic outcomes of immigrant parents differ cross-nationally, they could transmit these advantages or disadvantages to their offspring (Reitz et al., 2011). However, the transmission of parental socioeconomic characteristics to children varies by country (Reitz et al., 2011). Moreover, there is growing evidence in the United States and Canada that the effect of parental education is less predictive for the education of immigrants’ children relative to their native-born counterparts (Corak, 2008; Luthra and Waldinger, 2013). Thus, parental characteristics alone do not fully account for cross-national disparities in the education of immigrants’ children.
Looking beyond parental characteristics, there is a focus on the contextual characteristics of host countries as they have unique effects that contribute to educational disparities (Levels et al., 2008). Segmented assimilation theory posited that whether immigrants’ offspring obtained high or low levels of education is determined by (a) the financial and human capital resources that immigrant parents bring with them, (b) the aggregate characteristics of national origin groups, and (c) the coethnic communities in the host country (Portes and Rumbaut, 2006; Portes and Zhou, 1993; Reitz et al., 2011; Reitz and Somerville, 2004). Within this framework, a variety of educational outcomes may occur, but segmented assimilation theory emphasizes those with the most resources versus those with the greatest vulnerabilities. Immigrants with high levels of human and financial capital who arrive from wealthier countries and move into well-established coethnic communities typically have children who attain high education levels (Portes and Rumbaut, 2006; Portes and Zhou, 1993). Conversely, immigrants with low levels of human and financial capital who arrive from poorer countries and move into modest coethnic communities typically have children who attain low education levels.
Distinguishing national origin group and coethnic community characteristics
This study focuses on two contextual factors identified in segmented assimilation theory: national origin groups and coethnic communities. Individuals from the same national origin groups share the same country of birth and similar aggregate group characteristics (Feliciano, 2005, 2006). For instance, persons born in China who live in the United States belong to the same national origin group and share similar group characteristics, such as the per capita gross domestic product (GDP) of the origin country, China. Some group characteristics are the same regardless of the destination country (e.g. origin country GDP), whereas others differ in different destinations (e.g. educational selectivity).
A related but distinct concept is the coethnic community, which consists of a national origin group living together in neighborhoods or small geographic areas. Coethnic communities differ from ethnic enclaves, ethnic economies, and ethnic entrepreneurship, which entail ethnic businesses (for a full discussion, see Zhou, 2004). Specifically, these concepts emphasize coethnic businesses and economic transactions in explaining immigrants’ wages and socioeconomic mobility. In contrast, this study is concerned with the residential concentration of coethnics, so I use the concept coethnic community as elaborated by Zhou and Bankston (1998) and Gibson (1988). While it is possible that ethnic businesses may exist in coethnic communities, they are not a central feature of these neighborhoods.
To illustrate coethnic community characteristics, the Chinese living in the same neighborhood share similar community characteristics, such as the average education level of coethnics in a neighborhood or the percentage of coethnics living in a neighborhood. Coethnic community effects vary within national origin groups because people with the same national origin characteristics live in coethnic communities with different characteristics. To illustrate, all Chinese living in San Francisco and Los Angeles share the same per capita GDP of their origin country (national origin characteristic), but the Chinese in San Francisco live in coethnic communities with different average educational levels than the Chinese in Los Angeles (coethnic community characteristics).
There are different interpretations of the coethnic community that are defined at various levels, such as small neighborhoods, metropolitan areas, or cities (Bygren and Szulkin, 2010; Fleischmann et al., 2012; Lee, 2016; Levels et al., 2008). This study defines the coethnic community within neighborhoods (e.g. census tracts), as noted by classical assimilation theorists (Burgess 1967 [1925]) and ethnographic studies (Gibson, 1988; Zhou and Bankston, 1998). Coethnic communities are sometimes conceptualized as a specific type of neighborhood characteristic since the average characteristics of coethnic neighbors are unique and cannot be captured from aggregate neighborhood effects (Lee, 2016; Pong and Hao, 2007). One reason is that coethnicity acts as a form of social capital exhibited via expectations, information sharing, and social norms (Pong and Hao, 2007). In addition, immigrants of the same racial and ethnic background typically share stronger ties than individuals of other racial and ethnic groups. Thus, the characteristics of coethnic neighbors may be more influential or may work differently than the characteristics of all neighbors.
Several components of segmented assimilation theory have empirically assessed the education of immigrants’ children. For instance, the effects of immigrants’ socioeconomic characteristics, such as parental socioeconomic status (SES), are well-known and have been thoroughly examined (review in Kao and Thompson, 2003). There is also some evidence that contextual factors, such as national origin characteristics (Borjas, 1995; Feliciano, 2005, 2006; Levels et al., 2008) and coethnic community characteristics (Åslund et al., 2011; Fleischmann et al., 2011; Gibson, 1988; Perreira et al., 2006; Portes, 2000; Zhou and Bankston, 1998), influence the education of immigrants’ children. Nonetheless, it is unclear whether there are separate effects of individual, national origin group characteristics, and coethnic community characteristics on children’s educational attainment when all three factors are examined together. Thus, this study assesses coethnic community characteristics with individual and group characteristics to see whether the effects remain net of each other.
Coethnic community and educational attainment
Segmented assimilation theory posits that the coethnic community could positively or negatively affect education depending on the resources in the coethnic community. For instance, coethnic adult neighbors serve as role models for immigrants’ offspring and may encourage or discourage academic achievement depending on their socioeconomic characteristics (Bygren and Szulkin, 2010; Pong and Hao, 2007; Portes and MacLeod, 1996; Portes and Rumbaut, 2001; Portes and Zhou, 1993; Zhou and Bankston, 1994). Nonetheless, segmented assimilation theory is not explicit about the underlying characteristics of the coethnic community that influence the education of immigrants’ offspring.
To identify specific coethnic community characteristics, one strand of research, the ethnic environment perspective, emphasizes the quality of coethnic adults in the neighborhood (Borjas 1992, 1995). In particular, this perspective highlights the effects of having close contact with individuals from the same country of origin, especially those that may occur in small neighborhoods or in the form of residential segregation (Borjas, 1995; Bygren and Szulkin, 2010; Fleischmann et al., 2011). For instance, Borjas (1995), Bygren and Szulkin (2010), and Fleischmann et al. (2011) found that the socioeconomic characteristics of coethnic adults shaped the academic performance or educational attainment of immigrants’ children. Moreover, Bygren and Szulkin (2010) found that the average education of the coethnic community was more influential than the size of the coethnic community. Thus, from the ethnic environment perspective, there is no inherent benefit or detriment to living with coethnic neighbors on education, but it depends on the aggregate characteristics of coethnic adults.
Drawing from the ethnic environment perspective, this study focuses on two socioeconomic characteristics of the coethnic community: the average education and average income of coethnics in the neighborhood. Immigrants’ descendants living in coethnic communities with high levels of collective education also obtain high education, whereas their counterparts living in coethnic communities with low levels of collective education obtain low education (Gibson, 1988; Gibson and Bhachu, 1988). One way that highly educated adult members affect the educational attainment of immigrants’ children is by influencing their outlook. While this has not been empirically examined, ethnographic studies imply how this works (Gibson, 1988; Gibson and Bhachu, 1988; Zhou and Kim, 2006). Gibson (1988) found that Punjabi youth living in an educated coethnic community were in constant contact with educated coethnic adults who illustrated the benefits and feasibility of high education. This, in turn, instills a more positive outlook for the children of immigrants on their chances for upward mobility (Levels et al., 2008).
Highly educated coethnic adults also influence the educational attainment of immigrants’ children by shaping their educational expectations. Educated coethnic adults will view formal education as a primary avenue for success and exert high educational expectations (Gibson and Bhachu, 1988). In turn, there is a collective expectation for immigrants’ descendants to achieve academically in educated coethnic communities (Gibson and Bhachu, 1988). This can be especially important when parents are poorly educated because immigrants’ children can still interact with educated adults (Gibson and Bhachu, 1988). In contrast, coethnic communities with poorly educated members who work in low-status jobs may signal limited payoffs to education (Perlmann and Waldinger, 1997; Portes and Zhou, 1993; Waldinger and Perlmann, 1998).
In addition to the average education of the coethnic community, a coethnic community’s financial resources positively influence the educational attainment of immigrants’ children (Kroneberg, 2008). Coethnic communities with higher earnings (Borjas, 1995) and a larger proportion of self-employed members (Kroneberg, 2008) show greater academic success among immigrants’ children. One explanation is that coethnic communities with greater financial resources are more likely to develop educational organizations in the coethnic community, such as ethnic afterschool programs and test preparation courses, which facilitate greater academic success (Zhou and Kim, 2006).
Although segmented assimilation theory and the ethnic environment perspective posit that coethnic community education and coethnic community income influence the educational attainment of immigrants’ children, there is no empirical assessment of these two factors using quantitative methods. Most are ethnographies of small and localized cases in the United States that are not generalizable to a wider population (Gibson, 1988; Zhou and Bankston, 1998). The most systematic assessment of coethnic community education on the educational attainment of immigrants’ children is by Bygren and Szulkin (2010), who quantitatively examined the effect of coethnic community education using official registry data for immigrants’ children in Sweden. However, their study is limited to the national context of Sweden, which differs from many host countries in their immigrant group composition and immigration policy. Sweden’s main immigrant groups are from European Union countries and the Middle East, and a large proportion of new immigrants arrive for humanitarian reasons, which may be less applicable to other large Western immigrant-receiving countries.
Related, most coethnic community studies focus on a single host country and do not examine coethnic community effects comparatively across different host countries. The most comprehensive assessment of the coethnic community is by Gibson and Bhachu (1988), who found that coethnic community education positively affects the academic performance of children of Indian immigrants in United States and Britain. They examined a small subsample of Indians, so it is unclear whether the effects are due to a shared national origin (Indian) or country differences between the United States and Britain (Kesler, 2006). In sum, a quantitative cross-national study with nationally representative data could establish the validity of previous coethnic community studies.
From segmented assimilation theory and the ethnic enclave perspective, I generate two hypotheses:
H1. Coethnic community education is positively associated with college attainment, net of individual and group characteristics.
H2. Coethnic community income is positively associated with college attainment, net of individual and group characteristics.
National origin group effects and education
In addition to coethnic community effects, segmented assimilation theory posited that national origin groups are received differently in the host society, depending on their characteristics upon arrival. In turn, group-level processes can also influence the educational attainment of immigrants’ children. While this study is not focused on national origin group effects per se, several group characteristics are included to assess whether the coethnic community has separate effects from the national origin group. I briefly review three national origin group characteristics below: (a) educational selectivity, (b) political stability, and (c) economic inequality. First, educational selectivity (the educational difference between those who migrate (immigrants) and those who remain in the origin country (non-immigrants)) positively influences the educational attainment of immigrants’ children. Individuals from highly selective groups are more likely to obtain higher education levels than individuals from less selective groups (immigrant groups with lower education than non-migrants in the origin country) (Borjas, 1995; Feliciano, 2005, 2006). Second, individuals in groups from politically stable countries show greater academic success because parents from politically unstable countries migrated for non-economic reasons (Levels et al., 2008). Third, individuals with parents from countries with greater economic inequality, compared with less economic inequality, exhibit greater academic performance because parents set high expectations and pressure youth to excel (Levels et al., 2008).
This study examines the specific educational transition of college attainment or more. Whereas segmented assimilation theory and ethnic enclave perspective provide general predictions for educational attainment and academic achievement, the predictions should also extend to college attainment, which is determined by academic achievement, high school grades, and parental SES (Baum and Flores, 2011). This study extends previous studies focusing on academic achievement and educational attainment by focusing on college attainment. Thus, given industrial demands for a college degree, it has direct consequences for determining class status and socioeconomic mobility (Jackson and Kurlaender, 2014).
Understanding contextual effects cross-nationally
Overall, much of the support for contextual factors is based on the US context. Outside of the United States, there are mixed results over the applicability of segmented assimilation theory, especially regarding how national origin group and coethnic community factors influence the education of immigrants’ children (Alba, 2005; Thomson and Crul, 2007). National origin group characteristics, such as a group’s educational selectivity and average education level, positively affect the education of immigrants’ children in several North American and European countries, New Zealand, and Australia (Ichou, 2014; Levels et al., 2008; Van de Werfhorst et al., 2014). In addition, there is scattered evidence that coethnic community characteristics in Sweden (Bygren and Szulkin, 2010), and to some extent Belgium (Fleischmann et al., 2011, 2013), positively affect the education of immigrants’ children. In contrast, Esser (2004), Phalet and Heath (2011), and Thomson and Crul (2007) found that national origin group and coethnic community characteristics do not benefit children’s education in the European context. The mixed results indicate that national origin group and coethnic community effects may vary across countries. A systematic examination of these factors in different host countries can confirm previous studies and assess whether the US-based theory is applicable for understanding long-term integration in different countries.
The most comprehensive assessment of the education of immigrants’ children in the United States and Canada is by Rothon et al. (2009) and Reitz and Zhang (2011). Given data limitations, both use large national data sets (e.g. national census data), but cannot control for individual-level factors, such as parental background, and limit their analyses to a few racial and ethnic groups. Nonetheless, Reitz and Zhang (2011) found that the effect of contextual characteristics, such as residential context, varies cross-nationally. Specifically, Afro-Caribbean second generation in major immigrant cities in the United States experience greater educational attainment than their counterparts in Toronto. Thus, where immigrants and their offspring live and settle has important consequences for their overall integration and socioeconomic mobility, and these effects vary by country (Reitz and Zhang 2011). This suggests that other residential contexts, like the coethnic community, may also differ cross-nationally and influence the education of immigrants’ children.
Overall, there are several challenges to examining cross-national disparities among the education of immigrants’ children. Data limitations loom large as cross-national data sets with host country characteristics are not widely available. Moreover, no data sets include host country characteristics with coethnic community and national origin group characteristics. A common approach for understanding host country characteristics is analyzing large cross-national data sets, but this approach relies on broad typologies of countries without considering nuanced differences (Levels et al., 2008; Levels and Dronkers, 2008). Under these typologies, the United States and Canada are often considered similar societies because they are older immigrant-receiving countries; however, this overlooks differences in migration policies, immigrant group composition, and policies for racial and ethnic minorities (Levels et al., 2008; Levels and Dronkers, 2008). Instead, this study proposes an alternative approach by examining coethnic community effects under different host country conditions. Cross-national patterns of coethnic community effects can help elucidate the role of host country policies and institutional characteristics.
Comparing the United States and Canada: diversity, immigration, and education
The United States and Canada are an interesting comparison because of similarities in citizenship rights and policies supporting the opportunities for immigrants’ children and racial and ethnic minorities and country differences in immigration policies, contexts of reception, and education systems (Castles et al., 2014). Both countries are more inclusive of immigrants and their descendants, who are viewed as part of the founding members of each society (Alba and Foner, 2015). The philosophy of inclusiveness in both countries is embodied in several national policies regarding citizenship and ethnoracial diversity (Reitz and Zhang, 2011). First, both countries offer clear and rapid pathways to full citizenship (Alba and Foner, 2015; Reitz and Zhang, 2011). In addition, they are the only two countries in the Western world to offer birthright citizenship, or jus soli, in an automatic and unqualified form. Other large immigrant-receiving countries, such as the United Kingdom, Australia, France, Germany, and the Netherlands, all have conditional forms of jus soli that delay acquisition until a later age or are determined by the parent’s citizenship or residency (Alba and Foner, 2015).
Second, both countries offer policies that increase opportunities for racial and ethnic minorities (Alba and Foner, 2015; Levels et al., 2008). To illustrate, the United States offers race-based policies that promote the greater representation of minorities in educational institutions and in the workplace, which benefits minorities and immigrants’ children (Alba and Foner, 2015; Kasinitz, 2008). Similarly, Canada offers affirmative action in the workplace although it does not extend to education (Alba and Foner, 2015). Canada also has a multicultural policy that promotes cultural diversity and encourages individuals to celebrate their ethnic heritage. Under the multicultural policy, the government provides funding for coethnic community organizations. Thus, the United States and Canada share similar provisions of citizenship rights and racial and ethnic policies that are essential for socioeconomic mobility (Bean et al., 2015) and facilitate the development of coethnic communities and collective membership based on racial and ethnic identities (Kasinitz, 2008).
Nonetheless, the United States and Canada differ in their immigration policies and settlement challenges among newcomers. Historically, the two countries shared similar immigration policies that were open to immigration from the Western hemisphere but restricted immigration from the Eastern hemisphere (Kaushal and Lu, 2014). Since the mid-1960s, the two countries adopted different immigration systems.
With the enactment of the 1965 Hart–Celler Act (Immigration and Nationality Act), the US immigration system began favoring family reunification, offering unlimited admission for immediate relatives, parents, and siblings of US citizens and permanent residents (Jasso and Rosenzweig, 1990; Kaushal and Lu, 2014). As indicated in Table 1, family reunification or kinship with a US citizen or permanent resident represents the primary route to the United States for approximately 64 percent of incoming migrants, whereas 15 percent are admitted as skilled and educated immigrants, who secured an employment sponsor prior to their arrival to the United States (Jasso and Rosenzweig, 1990). Thus, most incoming migrants have an established family network upon arrival (e.g. immigrants sponsored by existing family members in the United States) or can quickly reconstitute their family by sponsoring family members to the United States) (Aldrich and Waldinger, 1990; Jasso and Rosenzweig, 1995).
Percentage of immigrants admitted.
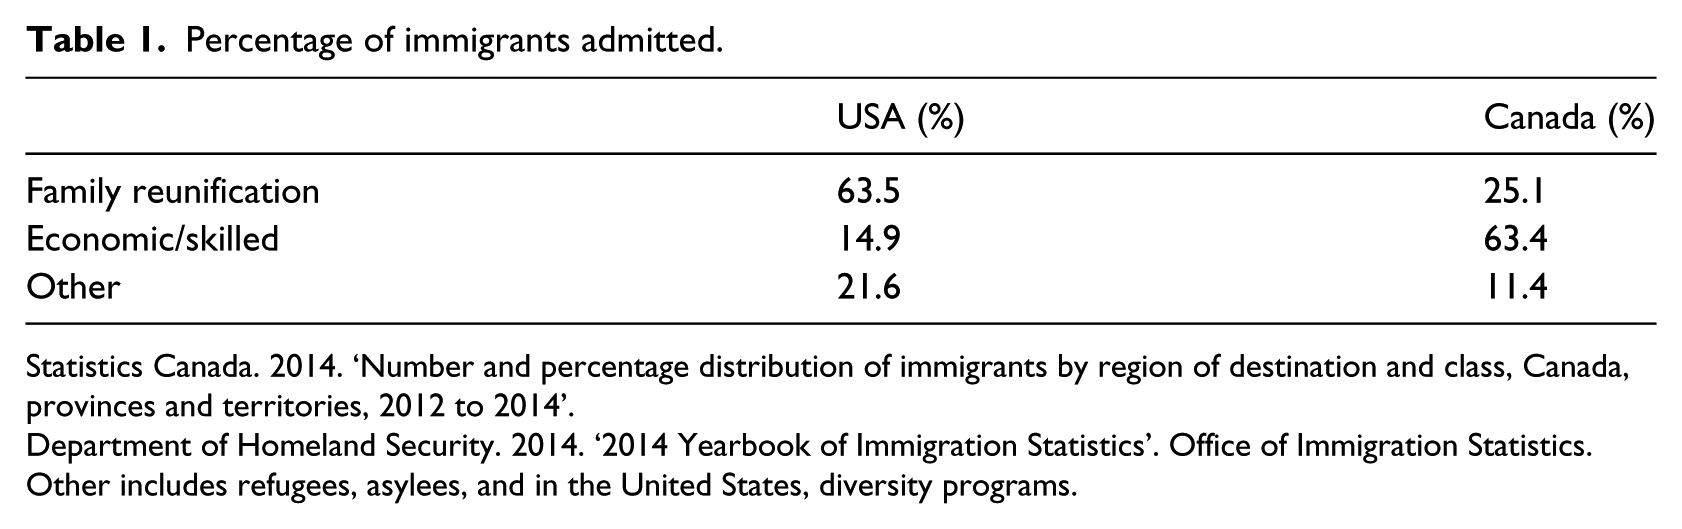
Statistics Canada. 2014. ‘Number and percentage distribution of immigrants by region of destination and class, Canada, provinces and territories, 2012 to 2014’.
Department of Homeland Security. 2014. ‘2014 Yearbook of Immigration Statistics’. Office of Immigration Statistics.
Other includes refugees, asylees, and in the United States, diversity programs.
The emphasis on family sponsorship in US immigration policy creates a settlement context that relies on an immigrant’s family networks (Bloemraad, 2006b). Upon arrival, immigrants often live with other settled family members in intergenerational households (Jasso and Rosenzweig, 1990). This can minimize settlement challenges for immigrants and their children as extended family members, such as grandparents, uncles, aunts, and cousins, can facilitate networking and job searches, pool financial resources, supervise children, and set high educational expectations for children (Beiser, 1988; Crozier and Davies, 2006; Phommasa, 2015; Sanders and Nee, 1996). Overall, US immigration policy emphasizes immigration as a collective process that may facilitate immigrants’ initial settlement process by encouraging the development of intergenerational households and extensive family networks (Jasso and Rosenzweig, 1990).
One caveat is the large undocumented population in the United States that does not enter through these categories. Many enter without legal documentation or overstay their visa (Alba and Foner, 2015). Approximately one-third of new immigrants since 1990 were undocumented, usually crossing the southern border (Kaushal and Lu, 2014). These immigrants are highly vulnerable to the labor market, ineligible for most federally funded welfare programs, and are more affected by economic and institutional factors than immigration policy (Alba and Foner, 2015; Kaushal and Lu, 2014). Undoubtedly, the experience of undocumented migrants differs greatly from that of legal migrants.
In contrast with the United States, family migration has a significantly smaller presence in Canada’s migration policy. Approximately one-quarter of Canada’s immigrants are admitted via family sponsorship for a few categories of eligible family members (e.g. spouses, dependent children, and limited visas for parents and grandparents). A sizable number of family sponsorship applications are unsuccessful because immigrant sponsors do not meet the minimum necessary income required to sponsor parents and grandparents (Neborak, 2013). Canada’s immigration policy uses an explicit points system to screen for immigrants with special skills or high education levels (Smith, 1994). Since the 1990s, there has been a growing emphasis on skilled migration regardless of job shortages or economic needs. Table 1 indicates that in 2014, 63.4 percent of Canada’s immigrants entered with a skilled visa. Thus, Canada avoided the mass migration of poorly educated individuals (Alba and Foner, 2014). Overall, the emphasis on economic self-sufficiency, immigrants’ skills, and limited family sponsorship in Canada’s immigration policy may result in limited family support (Neborak, 2013).
The emphasis on skilled migration in Canada’s migration policy can create a settlement context that is challenging for new immigrants. Despite being highly skilled, many immigrants face barriers in the labor market, have lower wages and employment rates than native-borns, and experience devaluation or denigration of their foreign credentials and work experience after arriving in Canada (Bauder, 2003; Guo, 2009; Zietsma, 2010). Approximately 77 percent of immigrants in Canada are underemployed, 21 percent are unemployed, and 19 percent are chronically in low income (Picot et al., 2007; Zietsma, 2010), which are higher than other immigrant-receiving countries, such as the United States and Australia (Guo, 2009). These settlement challenges also negatively affect the education of immigrants’ children. Recent immigrant parents with advanced degrees from their origin country may be disadvantaged due to few family networks, poor labor market outcomes, and limited knowledge of the host country’s education system (Crozier and Davies, 2006; review in Oseguera et al., 2011). To overcome these settlement challenges, immigrants and their descendants may require the assistance of coethnics outside of the family. Thus, government support for integration vis-à-vis coethnic communities may ease settlement challenges that arise from migrating with few family members (Bloemraad, 2006a).
Moreover, there are some cross-national differences in education systems that can affect the college attainment of immigrants’ offspring. In the United States, high school and university are similar as all states have 4 years of high school and 4-year university programs. The Canadian system varies by province and high school graduation is completed somewhere between 11 and 13 years depending on the province (Card and Freeman, 1993). In turn, more Canadian students graduate high school with lower levels of college readiness and attend vocational programs and community colleges. Despite Canada’s higher levels of tertiary education than the United States, this is primarily from vocational college-based attainment rather than university-based attainment (Organisation for Economic Co-operation and Development (OECD), 2017). Some of these differences may be alleviated by coethnic community members. Specifically, immigrants’ descendants living with highly educated coethnics are likely to receive more advice and encouragement to complete university degrees.
A US–Canada comparison is useful because of the large similarities between the two countries. In comparative studies, when units are more similar, it is easier to identify factors that may explain country differences (Lipset, 1990). Attewell et al. (2010), Bloemraad (2006a), Reitz and Breton (1994), and Kaufman (2009) adopted this type of comparative study, and this study follows their lead. This is an appropriate strategy for this study as it is not possible to measure host country characteristics as variables in my analyses. Rather, this study examines differences in coethnic community effects to understand institutional differences in the two countries. Given structural differences in immigration policies and education systems that result in fewer family networks and lower rates of college readiness and university-based degrees, coethnic community characteristics may be more influential in Canada than in the United States (hypothesis 3).
Data and methods
Analytic strategy
The ideal data set would include a large sample of immigrants’ offspring from multiple national origins with information on their individual, group, school, and coethnic community characteristics (Conger et al., 2011). To my knowledge, this data set does not exist for the United States or Canada, so I construct coethnic community and group variables using different data sources and append the variables to individuals in nationally representative surveys in the United States and Canada.
Following the work of Heath and Cheung (2007), Shavit and Blossfeld (1993), and Shavit and Müller (1998), this study uses standardized statistical analyses with nationally representative data and similar coding of the variables. For instance, Heath and Cheung (2007) employed logistic regression analyses for 12 Western countries. In general, all three studies used the results to understand large patterns and differences across countries rather than direct comparisons (Shavit and Müller, 1998). This study follows a similar approach and extends these studies by examining small geographic areas. Some limitations of this approach are that regression models are more basic; thus, they can indicate whether coethnic communities have a significant effect but cannot assess underlying mechanisms. In the absence of harmonized data, this approach allows us to systematically understand the extent to which coethnic communities are important contexts for college attainment in different societies, which can contribute to theory building.
The US analyses used non-public releases of the 2008 Sensitive General Social Survey (Sensitive GSS), a non-public biannual survey that collects data on education, work, communities, and racial and ethnic background in the United States. Sensitive GSS files indicate the census tract (small areas with a population of 2500–8000 persons) where respondents live, which are not included in the public versions. Sensitive GSS is available under contract, with special permission from National Opinion Research Center (NORC).
The Canadian analyses used non-public releases of Statistics Canada 2002 Ethnic Diversity Survey (EDS), a one-time survey with information on social, economic, and cultural life for persons of different ethnic backgrounds in Canada, and 2001 Canadian census microdata. Non-public releases of the EDS include census tracts that are not available in the public versions. EDS remains an informative data set as it oversamples racial and ethnic minorities and includes family background questions that are not available in the census. Non-public EDS and 2001 Canadian census microdata are available under contract and can only be accessed at research data centers in Canada.
Sensitive GSS in the United States and EDS in Canada are the most extensive and offer a nationally representative sample of immigrants’ descendants and information on their education and characteristics at the tract level. Although Sensitive GSS does not include any school information, it remains better than other US data sets, including National Longitudinal Survey of Youth (NLSY), National Education Longitudinal Study (NELS), High School and Beyond (HS&B), High School Longitudinal Study (HSL), and National Longitudinal Study of Adolescent to Adult Health (Add Health). 3 Another advantage of Sensitive GSS is that it is the only nationally representative data providing average education and income estimates by national origin group at the census tract level. The largest nationally representative data sets are the decennial census microdata (available through Integrated Public Use Microdata Series, IPUMS) and American Community Survey (ACS), but these data sources provide limited information for small geographic areas. 4
The approach for obtaining data was similar in the two countries: (a) individual data were retrieved from Sensitive GSS and EDS; (b) coethnic community characteristics were created among individuals with the same national origin at the census tract level, using aggregated survey or national census data; and (c) group characteristics were coded from various public sources and attached to all individuals with the same national origin. Data sources and coding of individual, coethnic community, and group variables are detailed in Appendix 1, Table 5.
I examine the first generation (persons born abroad) and second or higher generation (born in the destination country) in the United States and Canada. Given the small sample of second-generation respondents, I combine them with the third and higher generation for statistical power in the regression analyses. Thus, the analyses include the first, second, and third and higher generations because of the small sample size in Sensitive GSS. In Sensitive GSS, I restricted the first generation to individuals that immigrated at age 18 or younger to capture respondents who had some experience in the US education system and completed their final degree in the United States. 5 In EDS, I restricted the sample to individuals who completed their final degree in Canada.
Although my analytic strategy incorporates comparable data sets in two countries, there are several limitations. First, Sensitive GSS, EDS, and 2001 Census are non-public data and are prohibited from removal from the secure labs in the United States and Canada, and thus, they could not be merged together and were analyzed separately for each country. I analyze the data of each country with identical models to ensure that the data are as comparable as possible. Thus, the results are not directly comparable per se, but I provide similar analyses for two countries. Still, there are issues when comparing two data sets that include different information. EDS is much larger and the difference in sample sizes could affect the results. Sensitive GSS has a smaller sample with less variation across national origin characteristics. Nonetheless, given the specific data requirements, especially the use of census tracts, Sensitive GSS and EDS represent the best data sources available to address this research question. Second, the regression analyses combine the second generation with later generation native-borns, which may conflate the second-generation experience with the native-born experience. Third, there is not enough information in the data to create a reliable measure for coethnic community size or the proportion of coethnics living in the census tract. 6 However, this has been quantitatively assessed across several countries and consistently shown a significant effect on educational outcomes (Åslund et al., 2011; Bygren and Szulkin, 2010; Lee, 2016). Notwithstanding these limitations, the data allow us to examine coethnic community and national origin group characteristics in two countries, which is not possible with any other data. Fourth, given the sample size of Sensitive GSS, it is not possible to disaggregate the coethnic community effect by national origin or generation. Nonetheless, a significant coethnic community effect indicates an effect for a large set of individuals.
The dependent variable is college attainment measured as a dichotomous variable of a college degree or more compared with less than a college degree. 7 Key independent variables are two coethnic community variables: education and income. Group-level variables include educational selectivity, political stability, and economic inequality of the origin country. Individual-level controls are sex, age, generation status, father’s education, and region.
Coethnic community variables
The coethnic community is defined at the census tract level. Although the regression analyses focus on the first and second and higher generations, there is greater nuance in the coding of coethnic community measures. In both Sensitive GSS and EDS, coethnic community characteristics for the first and second generation are based on foreign-born coethnics aged 25 or older living in the same census tract. For third- and higher-generation individuals, coethnic community characteristics are based on third- and higher-generation individuals aged 25 or older living in the same census tract. Although the second and third and higher generations are combined in the regression analyses, coethnic community and national origin group characteristics are preserved and remain distinct from third- and higher-generation respondents.
For the United States, I created two coethnic community characteristics (education and income) using aggregated 2006 and 2008 Sensitive GSS data and attached the two characteristics to individual-level data representing first- and second-generation respondents in the 2008 Sensitive GSS. There were slight differences in coethnic community variable construction in 2006 and 2008 Sensitive GSS. In 2006, I averaged the education and income levels for foreign-born coethnics aged 25 or older living in the same census tract. In 2008, I did the same except restricted it to foreign-born coethnics aged 25 or older who arrived after the age of 18, so they received most of their education in the origin country. This ensures that coethnic community characteristics were not based on respondents who would also be in the dependent variable. I recoded coethnic community income as a categorical variable measured in income quintiles.
For Canada, I created coethnic community education and income using 2001 Census microdata and attached these characteristics to first- and second- and higher-generation respondents in EDS. For the first and second generations, coethnic community education and income are based on the average education and income of the foreign-born coethnics aged 25 and older living in the same census tract. Coethnic community income is the average income of all foreign-born coethnics aged 25 and older in each tract. I then recoded coethnic community income as a categorical variable measured in income quintiles. For the third and higher generations in the United States and Canada, I created coethnic community education and income based on the average education and income of third- and higher-generation individuals living in the same census tract.
National origin group variables
Group characteristics are coded from public sources. Educational selectivity for the United States is coded using Feliciano’s (2005, 2006) published measures; I replicate Feliciano’s (2005, 2006) method to code educational selectivity for Canada. Following Feliciano (2005), I use the net difference index (NDI), which compares immigrants’ and nonimmigrants’ educational attainment along different educational benchmarks controlling for age. An index of 0.50 indicates that an immigrant’s educational attainment will surpass the education of a nonmigrant’s 50 percent more often than a nonmigrant will surpass the education of an immigrant (Feliciano, 2005). For full details on this method, see Feliciano (2005) and Lieberson (1976, 1980). In the United States, educational selectivity is recoded as a dichotomous variable, with a 0 representing all scores less than or equal to 0 and a 1 representing all scores above 0. Political stability is coded using Worldwide Governance Indicators from the World Bank (a scale from −2.5 to 2.5 ranking a country’s perceived chance of being overthrown) (Kaufmann et al., 2006). Economic inequality is coded using the World Bank’s estimate of Gini coefficients, which ranges from 0 (perfect equality) to 100 (perfect inequality). Group characteristics were based on available information for the year closest to immigrants’ average year of migration. Third- and higher-generation individuals are assigned values of the host country closest to the average year of migration. 8
Individual variables
Individual-level characteristics (sex, age, generation status, father’s education, and region) come from Sensitive GSS and EDS. Female is a dichotomous variable with male as the reference. Age is a continuous variable from 25 to 65. Father’s education is an ordinal variable with three categories: less than a high school degree (reference category), high school degree, and college degree or more. I focus on father’s education since they have higher education than mothers, which may reflect traditional gender norms of males as primary providers with greater earning potential abroad (Salazar Parreñas, 2008). 9 Region is a categorical variable capturing the geographic area where individuals live. In Sensitive GSS, region includes New England, Atlantic, Central, Mountain, Other, and Pacific (reference category); in EDS, region includes Québec and Atlantic Provinces, Ontario, Manitoba and Saskatchewan, Alberta, and British Columbia (reference category). 10
Logistic regression analysis
This study uses logistic regression analysis to examine coethnic community effects along with national origin group and individual characteristics on college attainment or more. In separate analyses, I analyzed the data using multilevel regression and the results were consistent with those analyzed with logistic regression. Nonetheless, logistic regression is a better fit for this study for two reasons. First, survey weights, which link survey observations with the national population and make the data nationally representative, are difficult to analyze with multilevel regression and often result in very complicated models that are difficult to interpret (Chromy and Abeyasekera, 2005; Gelman, 2007). Second, the rationale for using multilevel regression is to account for individuals who may be clustered in communities or groups, but survey weights explicitly account for the correlational nature of the data. 11 Survey weights are very similar to clustered robust standard errors and produce a similar correction (StataCorp 2013). 12 Thus, the approach of using logistic regression models with survey weights is similar to using clustered robust standard errors, which makes fewer assumptions than multilevel models (Primo et al., 2007).
Results
Tables 2 and 3 provide coethnic community and group characteristics in the United States and Canadian samples, respectively. These reflect the main national origin groups in each country with information on their coethnic community characteristics in each data set. Table 2 shows that for the US sample, the groups with the highest levels of community education are Canadian (18 years), Indian (16.6 years), and Filipino (15.3 years) communities, which surpass the average education of US native-born communities (13.6 years).
Coethnic community and group characteristics by national origin in the United States.

Coethnic community and group characteristics by national origin in Canada.

Similarly, Indians (0.86) and Filipinos (0.60) are the most educationally selective. In contrast, Mexicans (8.5 years) and Puerto Ricans (9 years) have the lowest coethnic community education. This is consistent with the low educational selectivity among Puerto Ricans (−0.06) and Mexicans (0.20). The average level of coethnic community income corresponds with coethnic community education and educational selectivity of the groups. Puerto Rican, Mexican, and Spanish immigrants belong to low-income communities, with coethnics showing average incomes that range from US$15,000 to US$19,999. These coethnic community incomes are below the average of US native-born communities (US$20,000–US$24,999). In contrast, Filipinos, Indians, and Canadians belong to higher income coethnic communities (at least US$25,000), surpassing the average income of US native-borns. Descriptive statistics for the variables in the US analysis are given in Appendix 1, Table 6.
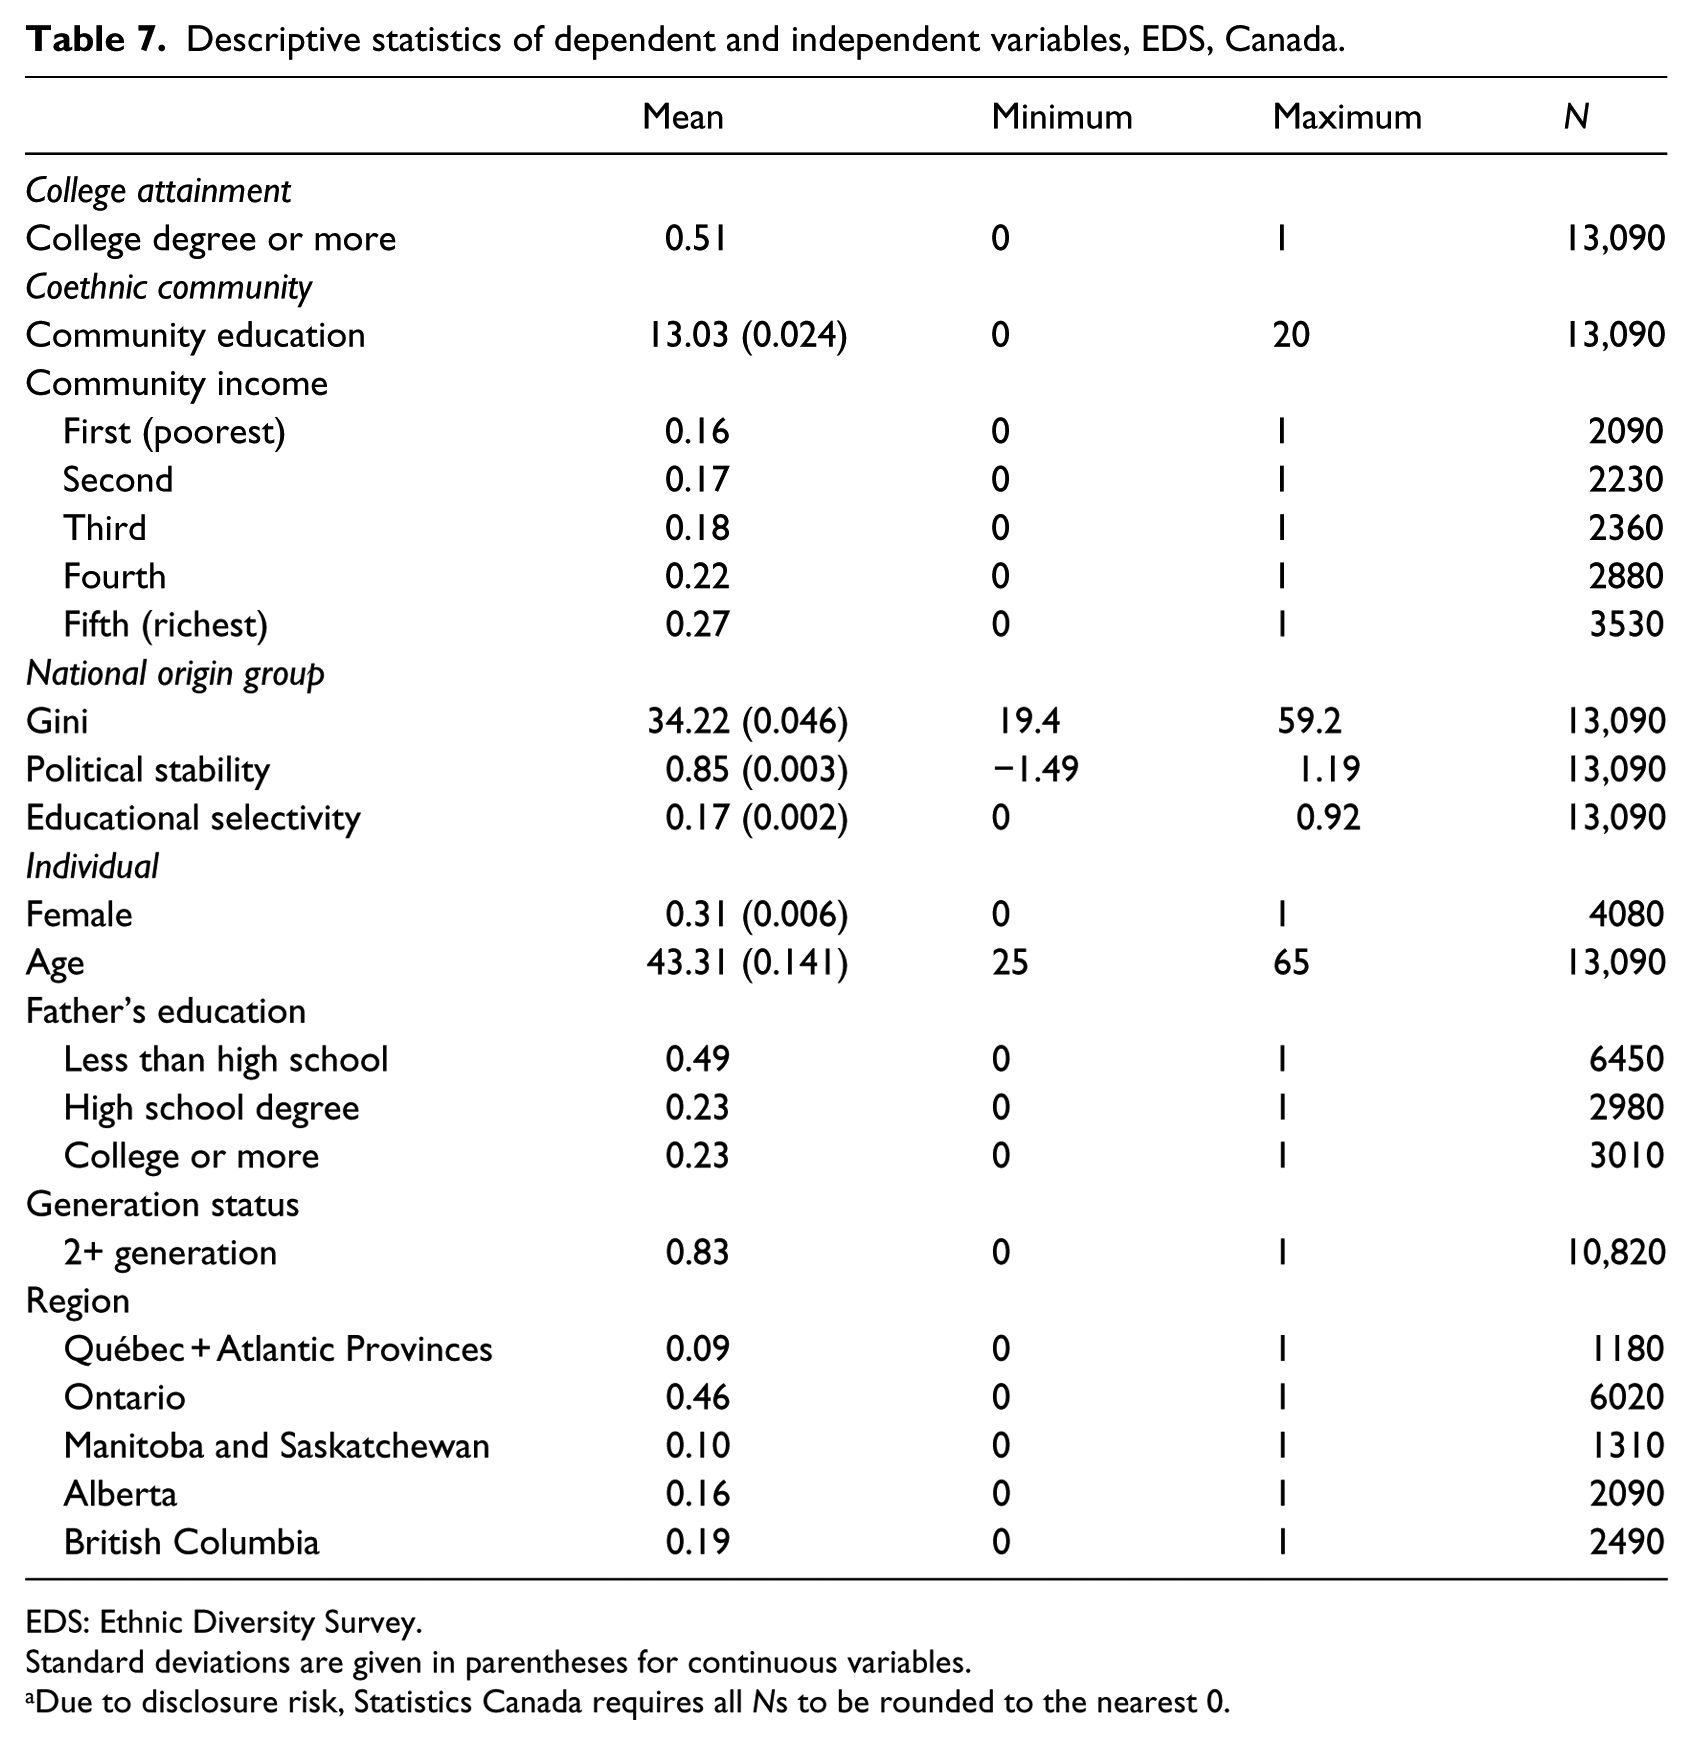
Table 3 shows that in Canada, Pakistani (14.59) and Indian (13.86) communities are the most educated, whereas Greek (9.46) and Danish (11.41) communities are the least. This strongly correlates with the educational selectivity scores for each of the groups: Pakistani (0.83), Indians (0.80), Greek (0.25), and Danish (0.36). The French (10.37) and Danish (10.29) have the highest levels of coethnic community income, whereas Mexican (9.98) and Chinese (10.03) have the lowest. The descriptive statistics for the variables in Canadian analysis are given in Appendix 1, Table 7.
Table 4 presents the results from the logistic regression analyses for the United States and Canada separately. I assess the effects of coethnic community, group, and individual factors on college attainment in the United States and Canada. Table 4, Model 1 presents the odds ratios of obtaining a college degree or more compared with less than a college degree. The standard errors for each variable are presented in parentheses next to the odds ratios. Table 4, Model 1 examines the effects of the coethnic community, group, and individual factors on college attainment or more for the United States and Canada, respectively. Given methodological concerns with comparing odds ratios across models, this study does not directly compare the odds ratios between the United States and Canada. Rather, the identical models elucidate the effects of coethnic community, group, and individual characteristics on college attainment in the two countries. 13
Odds ratios of college attainment for first and second and higher generations in the United States and Canada – Sensitive GSS and EDS.
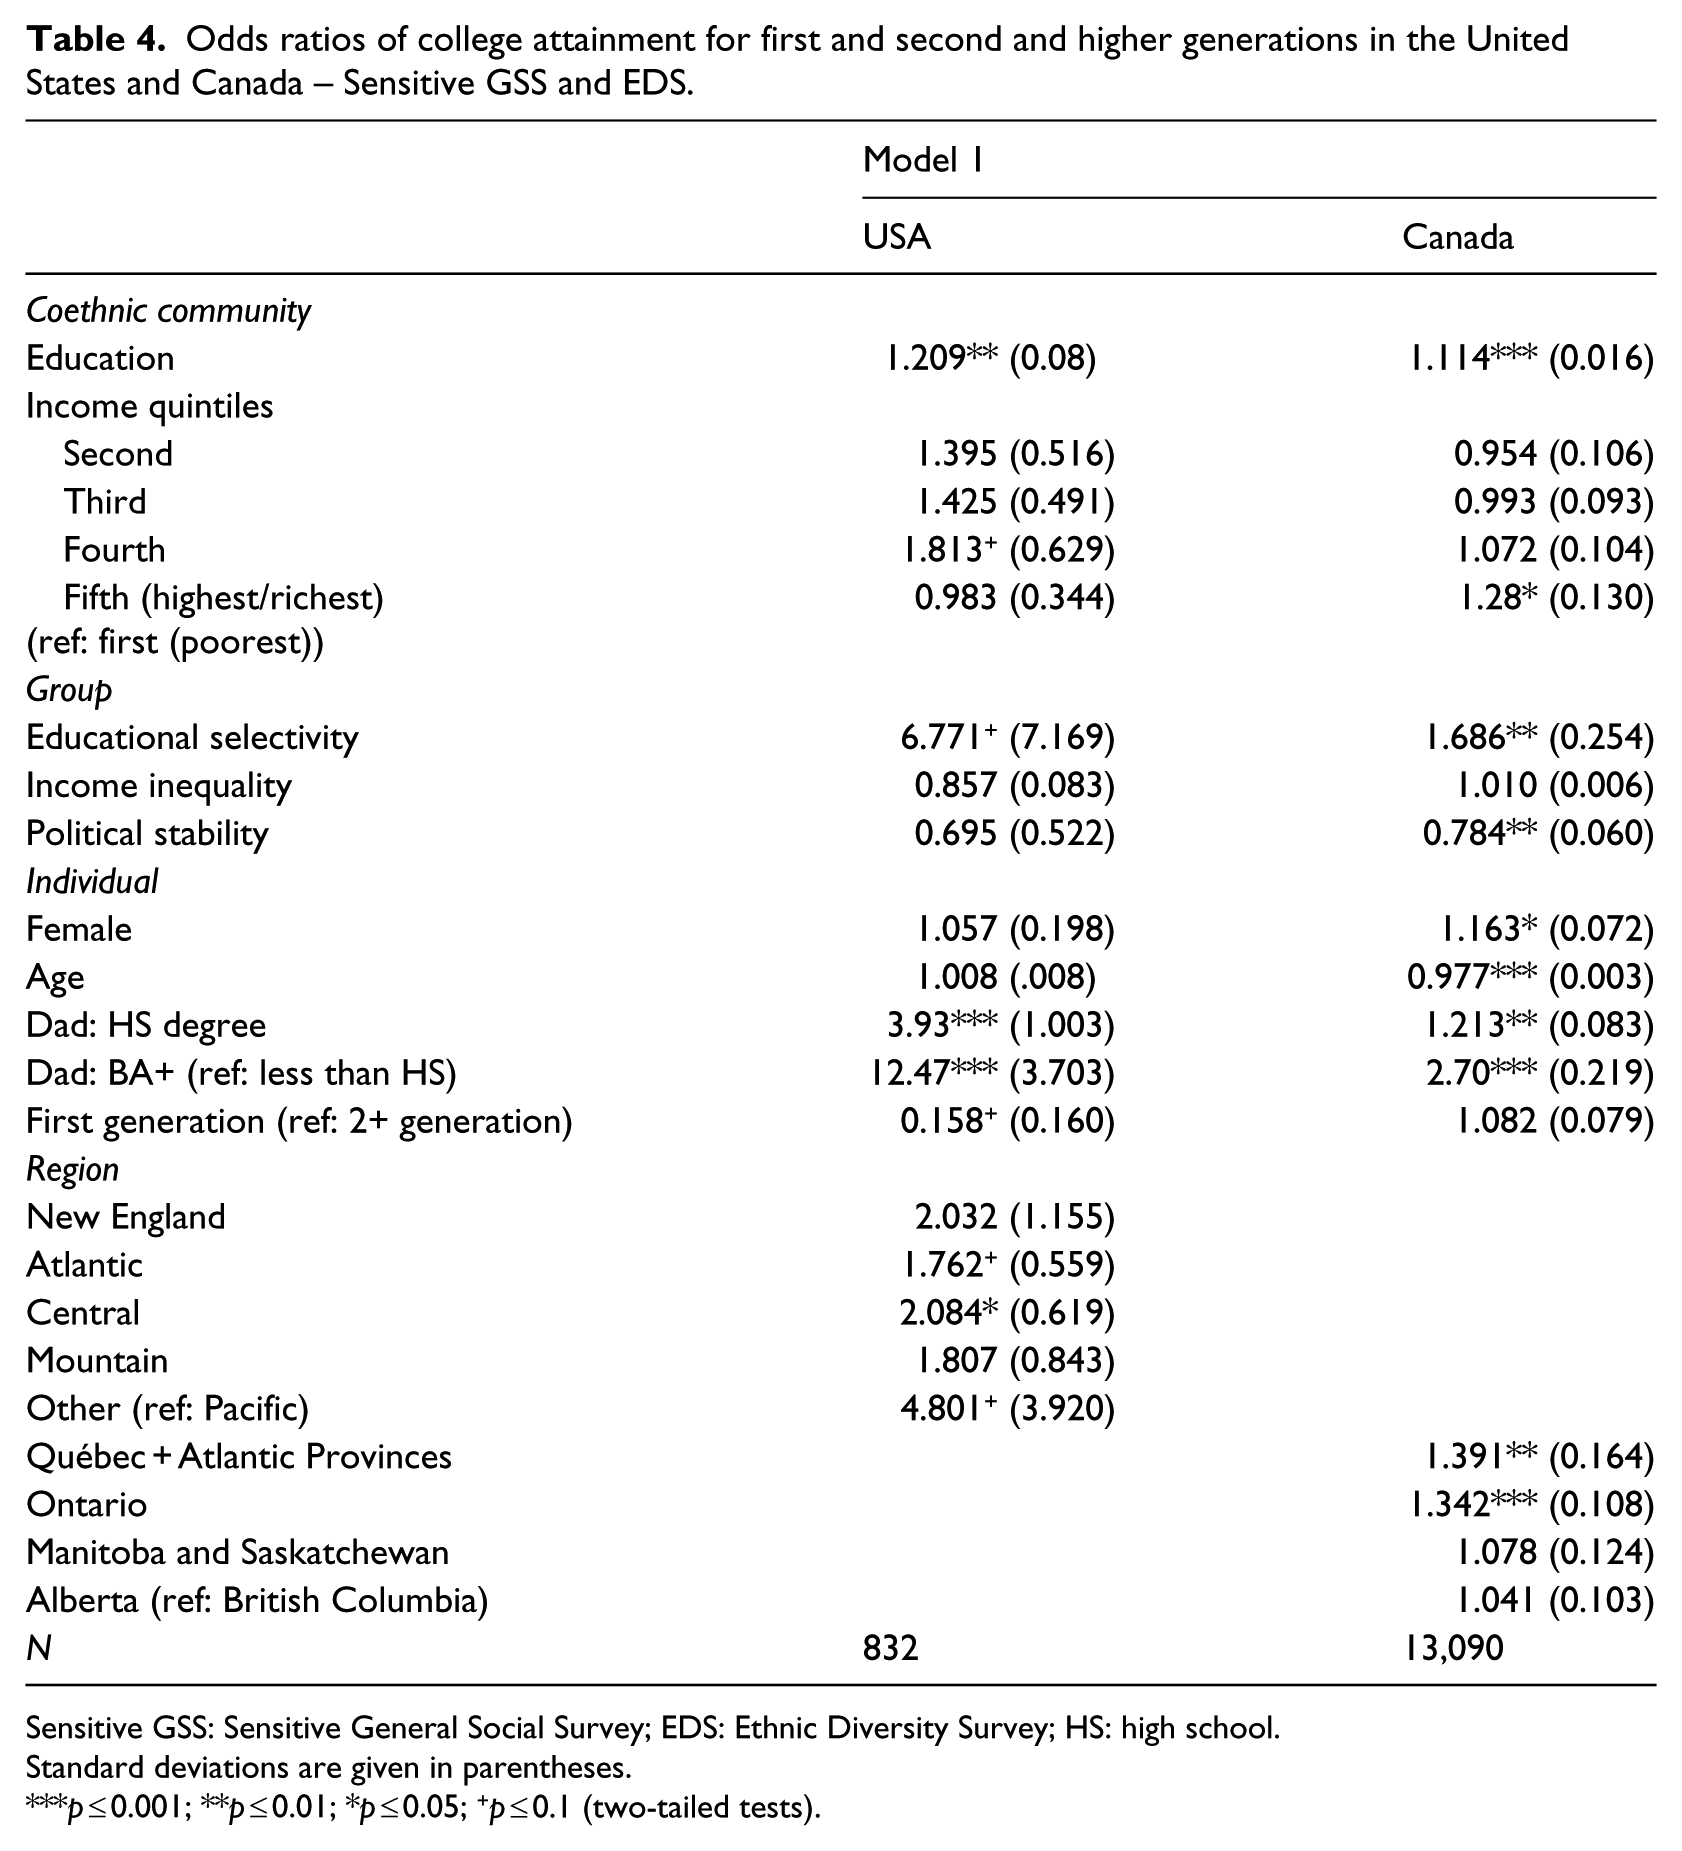
Sensitive GSS: Sensitive General Social Survey; EDS: Ethnic Diversity Survey; HS: high school.
Standard deviations are given in parentheses.
p ≤ 0.001; **p ≤ 0.01; *p ≤ 0.05; +p ≤ 0.1 (two-tailed tests).
Model 1, Column 1 presents the odds ratios for the United States. The first set of variables in Model 1 are coethnic community variables. In the United States, the odds ratio for community education is 1.209 and statistically significant. This suggests that a 1-year increase in the average education of the coethnic community increases the odds of college attainment by 20.9 percent. The odds ratios for coethnic community income categories are not statistically significant with the exception of the fourth quintile, which borders significance. Thus, coethnic community education is a strong and positive predictor of college attainment in the United States, net of individual and group controls.
The next set of variables in Model 1 are national origin group characteristics. Specific national origin groups are not included as variables in the equation, but educational selectivity, political stability, and economic inequality control for several attributes of national origin groups. Educational selectivity borders statistical significance and income inequality and political stability are not statistically significant. The last set of variables are individual characteristics. Three individual variables, female, age, and generation status, were not statistically significant. The odds ratio for fathers with a high school degree (3.93) and the odds ratio for fathers with a bachelor’s degree or more (12.47) are both statistically significant. The first generation are disadvantaged relative to the second and higher generation, but this effect only borders significance. In addition, living in the Central region (2.084) increases the odds of college attainment, relative to the Pacific region. The Atlantic and other regions border significance. Overall, Model 1 shows that for the United States, coethnic community education is a significant predictor of college attainment, net of individual and group variables. Father’s education, especially those with a college degree or more, is the strongest predictor of college attainment in the United States, and there are some regional effects on college attainment as well.
Model 1, Column 2 presents the odds ratios for Canada. The odds ratio for coethnic community education (1.114) is positively associated with college attainment or more in Canada. Living in coethnic communities with the highest income (1.28) is positively associated with college attainment. The next set of variables are group-level variables. The odds ratio for educational selectivity is 1.686 and statistically significant, which suggests that a one-unit increase in the educational selectivity score increases the odds of college attainment by 68.6 percent. The odds ratio for political stability (0.784) is statistically significant; countries with greater political stability have lower odds of college attainment. Individual controls, such as female, age, and father’s education, are statistically significant and work in expected directions. The odds ratio for generation status is not significant. There are also regional differences; Québec and Atlantic Provinces (1.391) and Ontario (1.342) have greater odds of college attainment, relative to British Columbia. Overall, Model 1, Column 2 shows that coethnic community education and high coethnic community income are positive predictors of college attainment in Canada, and these effects remain even after individual and group factors are considered. In addition, educational selectivity, political stability, females, father’s education, Québec/Atlantic Provinces, and Ontario are positively associated with college completion, whereas political stability and age are negatively associated with college completion.
Model 1 shows that net of individual and group characteristics, coethnic community education has a strong and positive effect on the odds of college attainment in both countries. Furthermore, coethnic community income and educational selectivity have strong and positive effects on college attainment in Canada, but not in the United States. In both countries, father’s education is the greatest predictor of college attainment, but the coethnic community education effect remains significant, net of father’s education. It is possible that the nonsignificant effects of coethnic community income and educational selectivity in the United States are due to the smaller sample size compared with the Canadian sample. While there is no way to assess this, the odds ratio and standard errors appear to be performing normally in the US sample, which suggests that the data are not underpowered.
Given methodological concerns with comparing odds ratios across samples, I use predicted probabilities to understand the relationship between coethnic community education and college attainment in each country (Mood, 2010; Powers and Xie, 2008). Figure 1 presents the predicted probability of college attainment or more by years of coethnic community education in the United States and Canada. Predicted probabilities are based on Model 1 with covariates held at their mean. Figure 1 shows that as coethnic community education increases, so does the probability of college attainment. However, the likelihood of college attainment in Canada is consistently higher than that in the United States. In Canada, the coethnic community education effect is consistent; however, in the United States, the effect becomes stronger when coethnic community education is higher. Thus, the gap in college attainment between the two countries narrows as coethnic community education increases. Overall, Figure 1 shows that coethnic community education positively influences the higher education process of immigrants’ descendants in both countries.
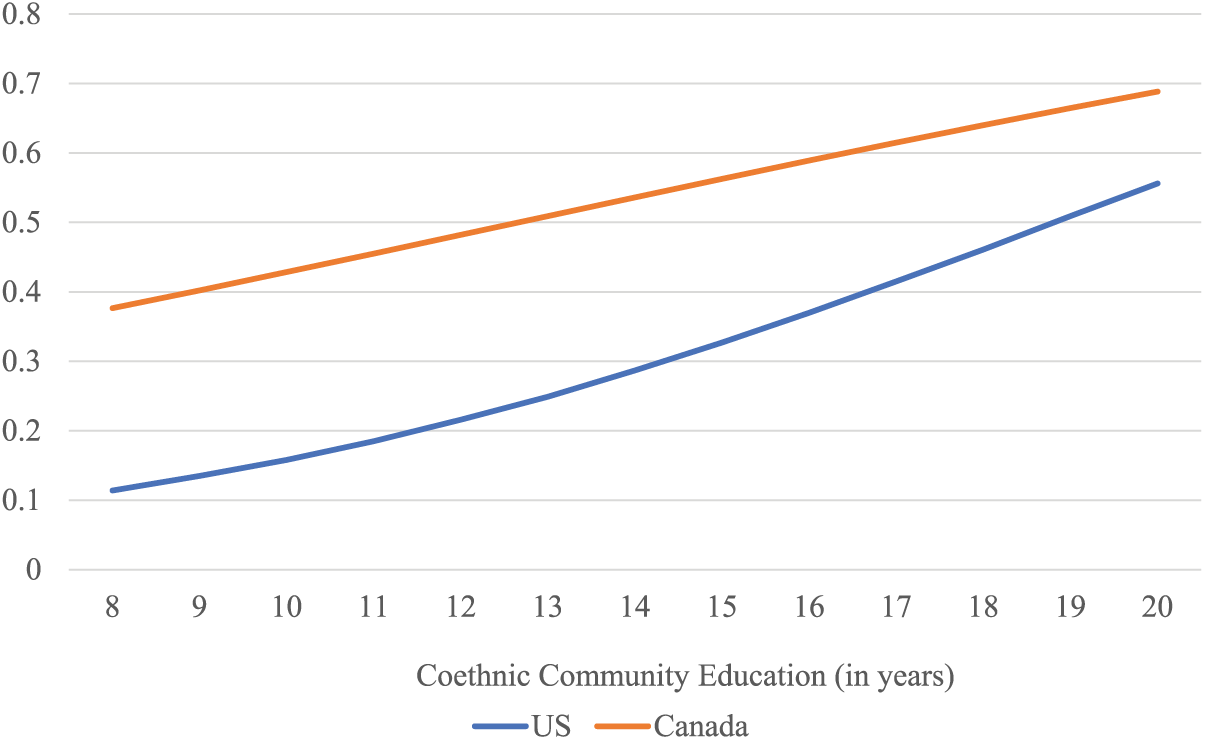
Predicted probabilities of college attainment or more by coethnic community education in the United States and Canada.
Discussion
This study examines coethnic community effects on college attainment in the United States and Canada and finds that the effect of coethnic community education is similar between the two countries whereas the effect of coethnic community income differs. Consistent with hypothesis 1, coethnic community education is positively associated with college attainment, net of individual and group characteristics. The strong coethnic community education effect is apparent in both countries despite differences in institutional characteristics, immigration policies, and immigrant groups. The findings support the ethnic environment perspective that posits that the quality of the coethnic community, such as the average education and income, positively shapes the education of immigrants’ children (Borjas, 1995; Bygren and Szulkin, 2010; Fleischmann et al., 2011). Related, the findings support qualitative studies that found a positive coethnic community effect on academic success, but could not assess the magnitudes of these effects (Gibson, 1988; Pong and Hao, 2007; Portes and MacLeod, 1996; Portes and Rumbaut, 2006; Zhou and Bankston, 1998). This study extends previous coethnic community studies that are limited to small localized contexts (Pong and Hao, 2007), one national origin group (Gibson, 1988; Zhou and Bankston, 1998), or one national context (Bygren and Szulkin, 2010; Fleischmann et al., 2012, 2011; 2013; Zhou and Bankston, 1998). Thus, this study provides tentative evidence that the coethnic community offers a protective effect for several groups in two large immigrant-receiving countries.
One possible explanation for the similar coethnic community education effect in both countries is that they share policies acknowledging and protecting racial and ethnic minorities, which is less prevalent in many European countries (Mollenkopf and Hochschild, 2010). This recognition and support for ethnoracial diversity may shape the level of institutional support for coethnic communities. For instance, Thomson and Crul (2007) infer that the children of immigrants in European countries have less socioeconomic mobility from living in the coethnic community because European countries are less supportive of ethnic and racial minorities. Thus, this may suggest that in countries with greater racial and ethnic protection, coethnic communities may also receive greater institutional support, which can positively affect the socioeconomic outcomes of immigrants’ descendants (Kasinitz, 2008).
This study also finds that coethnic community income has a positive effect on college attainment in Canada but no effect in the United States, showing partial support for hypothesis 2. Together, the significant coethnic community education and income effects in Canada are consistent with hypothesis 3. Overall, the varied effects of coethnic community income between the United States and Canada could be attributed to differences in immigration policy. The emphasis on family migration in the United States and skill-based migration in Canada shape the types of settlement challenges and sources of support (family versus non-family) that immigrants and their offspring encounter upon arrival.
Family sponsorship in US immigration policy offers a network of immediate and extended family members that supports the education of immigrants’ children (Bloemraad, 2006b; Jasso and Rosenzweig, 1990; Phommasa, 2015). Extended family members, such as cousins, grandparents, aunts, and uncles, set high educational expectations, often share responsibilities with parents by encouraging youth to attend specific schools, facilitate the college application process, and offer career advice (Crozier and Davies, 2006; Phommasa, 2015). In turn, immigrants’ descendants with access to extensive family networks and support may be less reliant on the human capital of coethnic adults outside the family. Thus, family-based immigration policies in the United States have positive implications for the integration of immigrants and their children. This contrasts with larger public debates, particularly in the United States, which have been critical of family reunification in favor of skill-based migration. 14
In contrast, Canada’s immigration policy emphasizes self-sufficiency as most immigrants must rely on their own education, skills, and financial capital (Bloemraad, 2006a). In turn, immigrants face settlement difficulties from limited family networks, precarious labor market outcomes, and less familiarity with the Canadian education system (Bauder, 2003; Crozier and Davies, 2006; Guo, 2009; review in Oseguera et al., 2011; Picot et al., 2007; Zietsma, 2010). These settlement challenges have consequences for education as immigrant parents and family members may be less available to provide assistance. For immigrants’ descendants to succeed academically in these harsh contexts, they may rely on the assistance of coethnic adults beyond the family (Feliciano, 2006; Zhou and Bankston, 1998).
High-income coethnic community members may represent an instance of these coethnic relationships. They may shape educational attainment by providing information about school choice, school quality, the host country’s education system, and the college application and selection process (Crozier and Davies, 2006). Individuals in high-income communities are likely to have a better understanding of the host country’s education system or the higher education process. In turn, they may increase the educational expectations and level of college readiness among youth in their communities. In addition, they can help individuals with limited information or resources to successfully enter college (Feliciano, 2006; review in Perreira and Spees, 2015; Zhou and Kim, 2006). For instance, youth with limited family ties can rely on coethnic adults outside of the family for school support, which is crucial in the Canadian context because of the large number of economic migrants who arrive without a family network. While my data cannot directly assess the underlying mechanisms, future research may ascertain whether these mechanisms or pathways work in the predicted direction.
Since my analysis uses cross-sectional data, I cannot make strong empirical claims about the causal direction of coethnic communities and educational attainment (Fleischmann et al., 2012, 2011). As with all neighborhood studies, one concern is that omitted variables select individuals with certain characteristics into specific tracts and cause a spurious association between coethnic community education and college completion. The data ask where respondents live at the time of the survey, and this could differ from where they grew up. Thus, I cannot be certain whether living in a census tract with educated coethnics is associated with greater odds of college attainment as is suggested by immigration studies, or whether these results are due to a selection process in which highly educated coethnics tend to settle together in the same neighborhoods (Fleischmann et al. 2011). However, it is unlikely that highly educated individuals live with other coethnics; rather, highly educated individuals tend to live in neighborhoods that are mixed with more Whites and fewer coethnics (Alba and Denton, 2004).
Conclusion
Overall, this study contributes to our understanding of cross-national and comparative migration and contextual factors in several ways. An ongoing concern in immigrant adaptation research is the extent to which theoretical models based on post-1965 immigration in the United States apply to other host countries with different immigrant groups and institutional characteristics (Alba, 2005; Thomson and Crul, 2007). Despite differences in immigration policy and national origin groups in the United States and Canada, this article shows that several features of immigrants, immigrant groups, and coethnic communities that influence educational attainment in the United States are also important in the Canadian context. This study’s emphasis on several large groups in the national context contributes to larger theoretical frameworks that examine broader processes of immigrant integration in different host countries.
Moreover, this study disentangles national origin and coethnic community effects by using separate measures to capture the two concepts. This study systematically assesses the role of coethnic community education and income quantitatively. Although the evidence is tentative, this study extends the work of previous cross-national studies that are more descriptive and rely on large administrative or census data. While data limitations prevent this study from being truly comparative, it still provides insights about the integration of immigrants’ children in two country contexts. In addition, the Canadian findings can extend to other host country contexts like Australia and New Zealand, two large immigrant-receiving countries that rely on skilled migration policies.
This study’s focus on the coethnic community can also inform neighborhood and contextual studies more generally. Specifically, coethnic communities represent a special feature of a neighborhood, which has not been given as much attention as general neighborhood characteristics. Given that many immigrants settle in areas with other coethnics, researchers interested in the outcomes of the children of immigrants may consider the importance of the coethnic community context. Future research should assess whether the coethnic community acts as a site of social capital that can alleviate challenges associated with skilled immigration policies and decreased family networks.
Footnotes
Appendix 1
Descriptive statistics of dependent and independent variables, EDS, Canada.
| Mean | Minimum | Maximum | N | |
|---|---|---|---|---|
| College attainment | ||||
| College degree or more | 0.51 | 0 | 1 | 13,090 |
| Coethnic community | ||||
| Community education | 13.03 (0.024) | 0 | 20 | 13,090 |
| Community income | ||||
| First (poorest) | 0.16 | 0 | 1 | 2090 |
| Second | 0.17 | 0 | 1 | 2230 |
| Third | 0.18 | 0 | 1 | 2360 |
| Fourth | 0.22 | 0 | 1 | 2880 |
| Fifth (richest) | 0.27 | 0 | 1 | 3530 |
| National origin group | ||||
| Gini | 34.22 (0.046) | 19.4 | 59.2 | 13,090 |
| Political stability | 0.85 (0.003) | −1.49 | 1.19 | 13,090 |
| Educational selectivity | 0.17 (0.002) | 0 | 0.92 | 13,090 |
| Individual | ||||
| Female | 0.31 (0.006) | 0 | 1 | 4080 |
| Age | 43.31 (0.141) | 25 | 65 | 13,090 |
| Father’s education | ||||
| Less than high school | 0.49 | 0 | 1 | 6450 |
| High school degree | 0.23 | 0 | 1 | 2980 |
| College or more | 0.23 | 0 | 1 | 3010 |
| Generation status | ||||
| 2+ generation | 0.83 | 0 | 1 | 10,820 |
| Region | ||||
| Québec + Atlantic Provinces | 0.09 | 0 | 1 | 1180 |
| Ontario | 0.46 | 0 | 1 | 6020 |
| Manitoba and Saskatchewan | 0.10 | 0 | 1 | 1310 |
| Alberta | 0.16 | 0 | 1 | 2090 |
| British Columbia | 0.19 | 0 | 1 | 2490 |
EDS: Ethnic Diversity Survey.
Standard deviations are given in parentheses for continuous variables.
Due to disclosure risk, Statistics Canada requires all Ns to be rounded to the nearest 0.
Acknowledgements
I thank Rebecca Jean Emigh, the editorial board, and the anonymous reviewers for their comments on previous versions of this manuscript. While the research and analysis are based on data from Statistics Canada, the opinions expressed do not represent the views of Statistics Canada.
Funding
This research was supported by Quebec Inter-University Centre of Social Statistics, International Council for Canadian Studies, and Foreign Affairs and International Trade Canada.