



Abstract
Access to insurance coverage is challenging for middle-aged adults with higher perceived insurance needs (e.g., declining health status) and higher barriers to coverage (e.g., unstable employment and income status). Focusing on middle-aged adults, this study investigated the extent to which employment, financial, and health statuses are associated with changing patterns of insurance status following implementation of the Affordable Care Act (ACA). Seven waves (2002–2014) of the Health and Retirement Study, combined with the RAND Center for the Study of Aging data, were used. Four patterns of insurance status change emerged: constantly insured, constantly uninsured, insured after ACA, and uninsured after ACA. Compared to constantly insured, other subgroups were associated with unstable employment, unskilled labor, and part-time employment. The role of public insurance might be nearly negligible for those who were in unstable employment status and needed to shift to other forms of private coverage. More attention is needed to better understand how the insurance market functions and policy changes that could improve it. There were demographic patterns in those who remained chronically uninsured: constantly low income and poor health conditions. This suggests a much-needed practical underpinning for policymaking efforts regarding this high-risk group entering old age with catastrophic health care costs.
Discordance between uninsurance rates and health care needs may be a particular concern for uninsured middle-aged adults when their health status resembles that of older adults and is worse than that of younger adults. 1 Since the Affordable Care Act (ACA) open-enrollment period started in October 2013, the number of previously uninsured Americans declined significantly.2,3 However, as of the second quarter of 2016, 11% of middle-aged adults and over half of middle-aged adults in states that did not expand Medicaid eligibility remain uninsured. 4 To date, existing literature on insurance status under ACA has focused on all-age adults,5,6 young adults,7,8 or children, 9 but knowledge of middle-aged adults is limited. 1
This study addresses 2 particular concerns. First, most studies have focused on descriptive and cross-sectional analyses of insurance status, understating the number of people who experience periods of uninsurance. 10 It is important to understand how uninsured periods have changed over time due to strong associations between the duration of uninsurance and cost- and health-outcome consequences of uninsurance. 11 Those with long periods of uninsurance might have low employability or suffer high access barriers to health care, whereas those with short periods may experience job transitions but no barriers to long-term or preventive care. 12 Despite the importance to health policy, few studies have examined the uninsured after ACA implementation regarding their insurance coverage prior to ACA implementation. 10 To our knowledge, no studies have focused on middle-aged adults.
Second, the effects of uninsurance risk factors among middle-aged adults have rarely been examined. Health insurance coverage closely interacts with financial, employment, and health statuses; and such interactions appear stronger among middle-aged adults. Many experience life transitions such as early retirement and declining health, along with increasing medical expenses.1,13 Both lead to the loss of employment-based health insurance coverage and to high costs and access barriers in the private insurance market. 14 Uninsured middle-aged households with a newly ill member lost between 30% and 50% of household assets while comparable insured households did not face such a decline in wealth. 15 As the ACA’s long-term goal is to expand insurance coverage and thus enhance health care access for those with low income and poor health conditions, research that incorporates factors associated with health insurance access will advance understanding of uninsured middle-aged adults.
In the present study, we address these gaps by exploring the length of uninsurance periods among the middle-aged population before ACA implementation and whether insurance coverage status changed after ACA implementation. We examine the extent to which employment, financial, and health statuses are associated with changed insurance. We place this against the backdrop of short or long periods of uninsurance prior to ACA enactment. To our knowledge, this is the first study to examine and quantify long-term insurance coverage status among middle-aged adults using a nationally representative data set (including 2014 data) that includes post-ACA implementation information.
Changes in Health Insurance Status
Health insurance status changes over time, but cross-sectional estimates of the uninsured understate the number who are uninsured over a period of time. 16 Although estimating the uninsured at a particular post-ACA point in time is useful for counting and characterizing uninsured persons by simple categories of uninsured and insured, estimates from longitudinal analyses will better assess the policy implications of being uninsured. Counting the uninsured over longer periods will produce a dynamic pattern of insurance status over time based on the duration of insurance coverage.10,17 For example, those uninsured for long periods are likely to have different characteristics than those uninsured for short periods. The former tends to include persons who are unemployed, have less education, or are black or Hispanic. The latter tend to have a relatively higher socioeconomic status and to be uninsured due to job transitions. 18
Over half of adults who were uninsured prior to ACA implementation reported that they had been uninsured for more than 2 years. 19 Other studies also found that almost half (47%) of those still uninsured after ACA implementation had been uninsured for 5 years or more, and those who had been uninsured for their whole lives comprised 18% of still-uninsured adults. 20 These studies suggested the need for exploring coverage patterns, because lack of coverage could be a serious issue for still-uninsured adults.
Few extant studies focus on changes in health insurance status among middle-aged adults. McWilliams et al.21 examined changes in use of health care services by focusing on comparisons between those who had held insurance continuously or intermittently, or those who were uninsured constantly. 21 They found that – compared with the constantly insured – intermittently uninsured near-elderly adults were more likely to be non-white, live in the South, have lower education and income, and be in poor health. Skopec et al.22 explored the length of coverage among adults ages 50–64 between 2013 and 2015. 23 Of these, 57.7% who had insurance for only part of the year had unmet health care needs; 49.1% of those without insurance reported unmet needs. Adults with no, or short-term, insurance coverage had greater difficulty affording care than those with continuous coverage.
Uninsurance Risk Factors Among Middle-Aged Adults
The ACA expanded access to health insurance coverage for middle-aged adults through Medicaid expansion, health insurance marketplaces, and regulations for insurers (e.g., prohibiting them from denying coverage, charging higher rates, or restricting premiums). Despite the public investment in insurance coverage expansion, nearly 1 in 3 adults ages 50–64 faced unmet health needs due to cost; such needs were 3 times more likely to be experienced by those with incomes at or below 138% of the federal poverty level (FPL). 22 As life circumstances regarding employment, income, and health changed rapidly, middle-aged adults were also likely to alternate between Medicaid and private insurance or between no coverage and coverage.12,14
To better understand why some middle-aged adults remain uninsured after ACA implementation, employment, financial, and health statuses need to be examined as characteristic risk factors. First, middle-aged adults face a dilemma: Their declining health status may cause early retirement; or, it may require them to stay in the labor force due to the perceived value of employment-based insurance. 24 Sloan and Conover found that middle-aged adults’ insurance status was more affected by their employment status than younger adults. 25 Moreover, their insurance status appeared unstable because they transitioned in and out of the labor force, moving, e.g., from full- to part-time employment before retiring.24,26 Blumberg, Garrett, and Holahan also found a significant relationship between unemployment and uninsurance among the near-elderly, regardless of income level. 27 Coverage denial rates appeared to increase as adults approached age 65; individuals in their early 60s who lacked employment-based insurance paid nearly twice the cost of the average individual market premium for non-elderly adults. 14 Accordingly, they place greater value on employment-based insurance coverage than younger workers. 28 But, many tend to leave health needs unmet until they are Medicare eligible. 21 Middle-aged adults with poor health and low education are likely to be unskilled workers; retire early; or hold unstable jobs associated with low wages and fewer employer-provided health care benefits.1,29
Second, high financial burdens for health care are more prevalent among low- and middle-income, middle-aged adults. 14 These burdens may influence their decisions about whether to seek insurance coverage. The ACA expands Medicaid eligibility to low-income individuals. Nevertheless, 13.4% of middle-aged adults with incomes at or below 138% of FPL were uninsured. 30 Also, 17% of middle-aged adults were in a coverage gap because they were ineligible for publicly financed coverage in their state or lacked income to purchase coverage in a private marketplace. 4 Most were in low-income working families and could not afford their share of the insurance cost even with employment-based coverage. 4 Given the limited budgets of persons with lower incomes in states not expanding Medicaid eligibility, additional out-of-pocket costs after purchasing marketplace coverage may have been prohibitively expensive. 31
Third, health status itself can be a reason for uninsurance. The middle-aged with good health may choose not to purchase insurance because they have low (or no) willingness to pay for insurance. 32 Alternatively, those with chronic health conditions and functional limitations are unlikely to be offered employment-based insurance coverage and likely to experience uninsurance until they reach Medicare eligibility. 33 Some, regardless of health conditions, might choose to wait for Medicare eligibility; e.g., those who were continuously and intermittently uninsured received less preventive care prior to Medicare eligibility and increased their use of services after gaining Medicare coverage. 34
In sum, access to insurance coverage is challenging for middle-aged adults with higher perceived insurance needs (e.g., declining health status) and higher barriers to coverage (e.g., unstable employment and income status). From a policy perspective, it is important to examine to what extent these characteristic factors are associated with uninsurance.
Present Study
The present study has 2 research aims. First, using 7-wave longitudinal data, we examine how insurance status changed over time among middle-aged adults before and after ACA implementation, and the differences across insurance change subgroups. We expect to find groups with no insurance, short-term insurance, or continuous insurance, as well as varied insurance status before and after ACA implementation. Based on previous studies, we also hypothesize that, compared to those who were constantly insured throughout the observation period, those who were constantly uninsured will have disadvantaged sociodemographic characteristics. Those who became insured or uninsured after ACA implementation are also mutually exclusive subgroups, and we hypothesize that their characteristics also differ. For example, it may be that those who obtained insurance under ACA are more likely to have lower incomes, as they are the ACA’s target population. However, we hypothesize that those who became uninsured under ACA may have higher incomes.
Second, we examine to what extent middle-aged adults’ employment, income, and health statuses are associated with different insurance-change subgroups. Based on previous studies – which recommend research on middle-aged adults who experience increased health problems and have unstable employment status and income – we hypothesize that a strong positive association between being uninsured and employment instability (e.g., unemployment, part-time employment, and unskilled manual labor) will emerge. We hypothesize that those with low incomes (e.g., less than 138% of FPL) will become insured under ACA. We also expect to find an association between health status and uninsurance. Based on previous studies, we expect middle-aged adults with poor health to be associated with either the constantly insured or constantly uninsured group.
Data and Methods
Data and Sample
To obtain the latest pre- and post-ACA snapshot of the middle-aged population in the United States, we pooled 7-wave (2002–2014) consolidated data files from the Health and Retirement Study (HRS) in combination with the RAND Center for the Study of Aging (RAND HRS) data. The HRS is a longitudinal survey that interviews a nationally representative sample of adults aged 51 and older and their spouses every 2 years. Data from the HRS is well suited for the present analysis because it provides detailed information on health insurance coverage status and also includes survey response information about health care access, history of medical conditions, income, employment, and demographics. The 2002 wave is our study baseline because RAND HRS includes poverty measures based on U.S. Census Bureau poverty threshold levels by household composition.
We restricted our sample to adults ages 51–64, because most people over 65 are eligible for Medicare and unaffected by ACA provisions. We further limited the sample to respondents who provided health care insurance status in 2014 (a post-ACA time point), along with employment and sociodemographic information. To consider status change in health insurance and related factors, we included in the analysis only those who responded at least 3 times during the 7 waves. Listwise deletion for missing information on either the dependent or explanatory variables led to further reduction, resulting in a sample of 28,980 observations (n = 2,343 as of the 2014 wave).
Measures
Insurance status
At each wave, respondents indicated the type of insurance coverage they had. Using this information, we first grouped them into 2 categories: had any coverage (employment-based, privately purchased, and public, etc.) and had no coverage between 2002 and 2014. Then, we created subgroups based on insurance status in 2014 and number of years insured between 2002 and 2012. These subgroups included (1) uninsured for all years or for more than half of the observations between 2002 and 2012 and uninsured in 2014 (constantly uninsured); (2) uninsured for all years or for more than half of the observations between 2002 and 2012 but became insured in 2014 (insured after ACA); (3) insured for all years or for more than half of the observations between 2002 and 2012 but became uninsured 2014 (uninsured after ACA); and (4) insured for all years or for more than half of the observations between 2002 and 2012 and insured in 2014 (constantly insured, reference group).
Risk factors
To identify risk factors, we first created time-varying dummies for employment status between 2002 and 2014. These included (1) constantly employed (reference); (2) constantly unemployed, used to work for most years but became unemployed (including retired) in 2014; and (3) used to be unemployed (or used to identify as retired) but became employed in 2014. We also considered occupation and types of work, characterizing them by occupation (skilled professional = 0; unskilled manual = 1) and type of work (full time for those who work over 35 hours per week = 1; part time = 0). Second, we stratified household income at less than 138% of FPL (hereafter, poor) and greater than 138% of FPL (hereafter, non-poor), because this is the eligibility limit for Medicaid coverage.
We used the family income-to-poverty ratio provided by RAND HRS and defined 4 categories of household income: (1) those with incomes continuously above 138% of FPL; (2) those with incomes continuously below 138% of FPL; (3) those with incomes that changed from below to above 138% of FPL; and (4) those with incomes that changed from above to below 138% of FPL. (At the time of this analysis, RAND HRS had not yet provided household income and poverty measures for the 2014 wave.) Lastly, health status was measured with self-rated health and chronic conditions in 2014. Originally, self-rated health was measured with a 5-item scale (1 = excellent, 2 = very good, 3 = good, 4 = fair, 5 = poor). We created a binary indicator of poor self-rated health (responses of 4 or 5 = 1, or otherwise 0) and categorized number of chronic conditions into 3 dummies: none, 1 chronic condition, and 2 or more chronic conditions.
Covariates
Educational attainment was measured as a binary: high school graduate or less than high school (0–12 years of education), and – as a reference group – some college education and above (13 and more years). Marital status was measured in the same manner as employment status: (1) constantly married (reference); (2) constantly unmarried; (3) changed from unmarried to married; and (4) changed from married to unmarried between 2002 and 2014. Respondents’ age was measured with cohort groups (aged below 62 = 0, aged 62–64 = 1). This category was based on the substantial reduction in Social Security benefits for early retirement. Other covariates were measured as gender (women = 1; men = 0) and race (Caucasians = 0; African Americans = 1; others = 2).
To determine whether Medicaid expansion states are associated with insurance status, we created 5 region dummies based on the 32 expansion states reported as of July 7, 2016. The HRS does not specify the states in which respondents reside; rather it identifies 9 divisions among 4 regions (Northeast, Midwest, South, and West). We set the Middle Atlantic Division of the Northeast Region (NY, NJ, PA) and the Pacific Division of the West Region (WA, OR, CA, AK, HI) as reference groups since all states in these divisions adopted Medicaid expansion. Then, we categorized the remaining states – including expansion and non-expansion states – into 4 dummies: New England Division of Northeast Region (ME, NH, VT, MA, RI, CT); East North Central and West North Central Divisions of the Midwest Region (OH, IN, IL, MI, WI, MN, IA, MO, ND, SD, NE, KS); South Atlantic, East South Central, and West South Central Divisions of the South Region (DE, MD, DC, VA, WV, NC, SC, GA, FL, KY, TN, AL, MS, AR, LA, OK, TX); and Mountain Division of the West Region (MT, ID, WY, CO, NM, AZ, UT, NV).
Analytic strategy
To investigate the characteristics of uninsured individuals and predicting factors for uninsured status, we created subgroups based on health insurance change over the 12-year observation period. Bivariate tests were conducted to explore characteristics of individuals within each subgroup according to independent variables included in the final analysis model. Finally, multinomial logistic regression, with the most prevalent subgroup as the reference group, was used to determine predictors of distinct insurance status subgroups.
Results
Descriptive and Bivariate Analyses
Table 1 presents characteristics of the sample and differences across insurance change subgroups. The 4 subgroups consisted of middle-aged adults who were (1) insured for most or all years prior to ACA and continued to be insured after ACA (constantly insured); (2) uninsured for most or all years before ACA and still uninsured after ACA (constantly uninsured); (3) uninsured for most or all years prior to ACA but became insured after ACA (insured after ACA); and (4) insured for most or all years before but became uninsured after ACA (uninsured after ACA). Constantly insured, the largest group, had a smaller proportion of non-Caucasians, men, those with less than high school education, those working at unskilled manual-labor jobs, and those with the highest household income. Constantly uninsured had the second-lowest mean value of household income and the second-highest proportion of those whose incomes were constantly below 138% of the federal poverty level (FPL). It also included the highest proportion of those who were constantly unmarried, those working at unskilled manual-labor jobs, and part-time workers.
Descriptive Statistics (Percentages; n = 2,343; Observations = 28,980).

Source: 2002–2014 Health and Retirement Study.
Abbreviations: ACA, Affordable Care Act; FPL, federal poverty level.
a“Before” refers to “before ACA implementation,” and insurance status was measured with 2002–2012 data. “After” refers to “after ACA implementation,” and insurance status was measured using the 2014 wave data.
bThe unemployed include those who identified themselves as retired; constantly unemployed means those who never worked for pay during 2002–2014. “Worked but became unemployed” indicates those who worked for most years during 2002–2012 but became unemployed or retired in 2014.
The share of those with incomes below 138% of FPL and income changes in each subgroup presents an interesting finding. For example, insured after ACA had a higher proportion of people with incomes constantly below 138% than constantly uninsured. These 2 groups also included a higher proportion of people whose income changed either positively or negatively over observation years, compared with constantly insured and uninsured after ACA. A higher proportion of respondents in insured after ACA were likely to have poor self-rated health, followed by those in constantly uninsured. Insured after ACA also had a higher prevalence of chronic diseases when compared with other groups.
Uninsurance Rate by Year
Figures 1 and 2 present the unadjusted yearly mean for uninsurance rates during the study period 2002–2014. They show the overall improvement in trends between 2012 and 2014, following the ACA’s first open enrollment period in 2013. Figure 1 illustrates the uninsurance rate by income change group. Middle-aged adults whose incomes were above 138% of FPL during the whole study period comprised about 5% of uninsured individuals, rose to 16.7%, and fell to 12.3% following ACA implementation. Those whose incomes were constantly below 138% of FPL had the largest proportion of uninsured individuals, which fell to about 24% after ACA implementation from 47.9%. Those with incomes that changed to above or below 138% of FPL showed the large change in uninsurance rates. Figure 2 shows uninsurance rates by employment status. Among unemployed middle-aged adults, 14.11% lacked insurance at baseline. Their uninsurance rate steadily increased, reaching 33.1% in 2012. A significant decrease (to 19.9%) was observed in 2014. However, unskilled manual workers’ uninsurance rates showed a lower reduction between 2012 and 2014 (from 56.1 to 50.7%). The uninsurance rate of part-time workers also appeared to decrease after ACA implementation, but 24.1% remained uninsured.
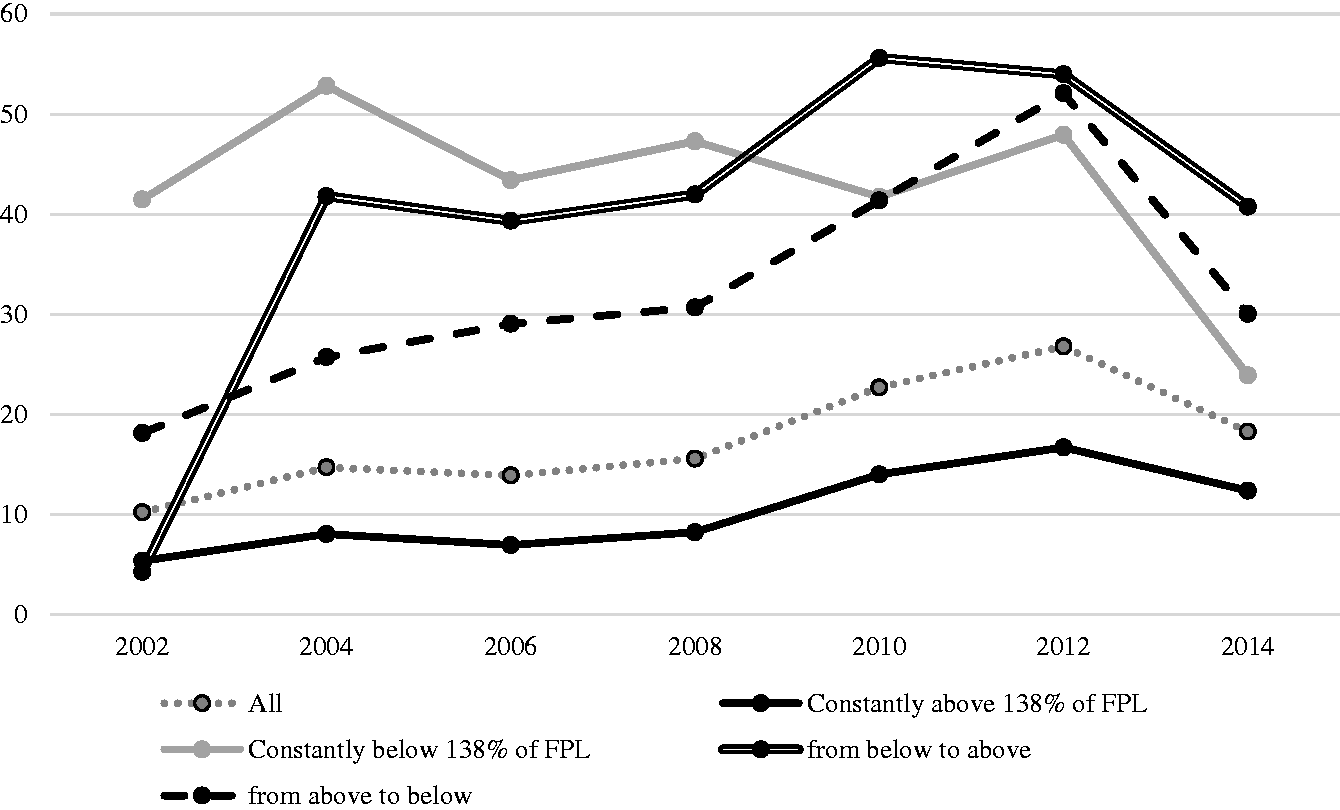
Uninsurance rate by income status. Note that all estimates presented are unadjusted means. FPL, federal poverty level.
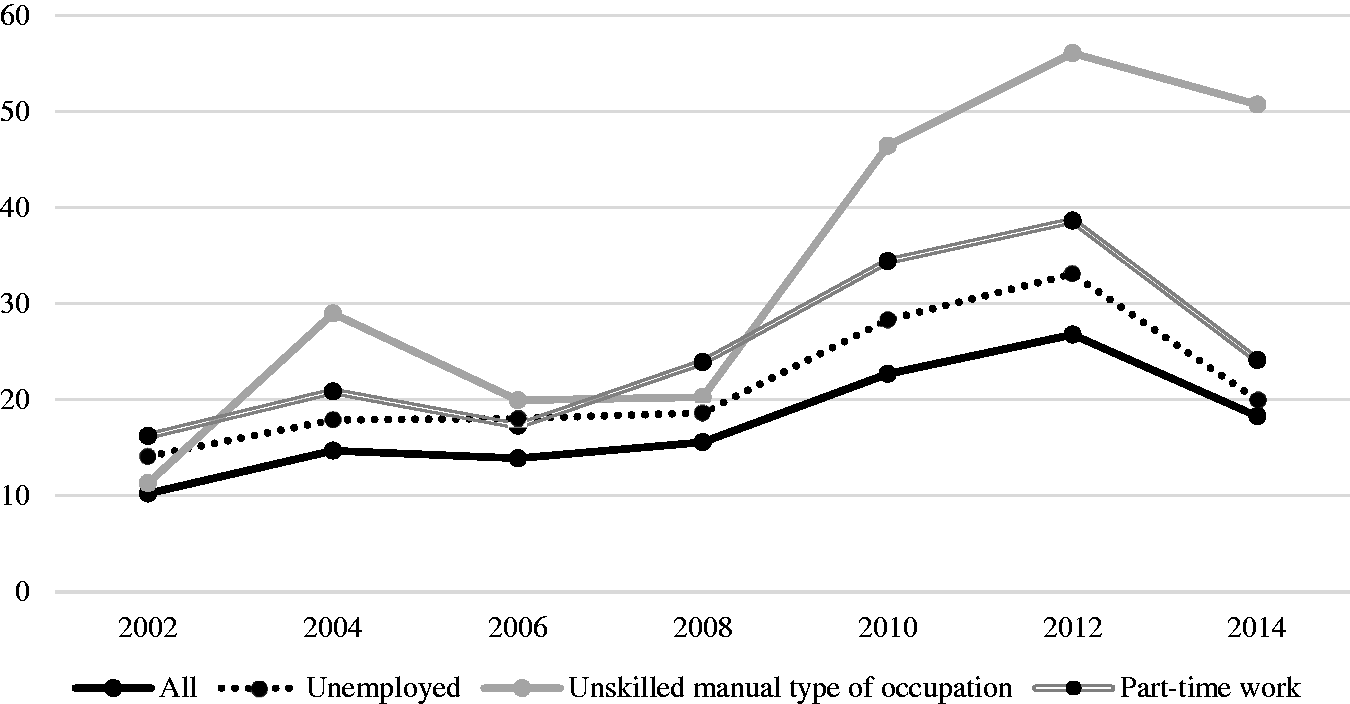
Uninsurance rate by employment status. Note that all estimates presented are unadjusted means.
Role of Risk Factors in Predicting Changes in Insurance Status
Table 2 shows the estimates that were derived from multinomial logistic regression analyses where coefficient estimates were reported as relative risk ratios (RRR = e b , where b is the logistic regression coefficient). We examined the insurance status changes by looking at the effects of employment, income, and health statuses, and constantly insured formed the reference group. Partially consistent with the findings from bivariate analyses, results revealed key factors were strong predictors of insurance change subgroups.
Multinomial Logistic Regression (n = 2,343). a

Source: 2002–2014 Health and Retirement Study.
Significance level of P value: *P < .05; **P < .01; ***P < .001.
Abbreviation: ACA, Affordable Care Act.
aThe reference group is “constantly insured” who were insured for most or all years of observations during 2002–2012 and continued to be insured in 2014.
bReference group for region includes Middle Atlantic Division of Northeast region (NY, NJ, PA) and Pacific Division of West region (WA, OR, CA, AK, HI) that adopted Medicaid expansion.
Of the key factors, employment status was significantly associated with all groups: unskilled manual workers were more likely to be in the constantly uninsured, insured after ACA, and uninsured after ACA groups than in the constantly insured group. But, part-time employment was only associated with constantly uninsured. Interestingly, continuous unemployment was not significantly associated with any group; rather, those whose employment status changed, regardless of the change direction, were more likely to belong to the constantly uninsured, insured after ACA, and uninsured after ACA groups, rather than constantly insured. Household income history appeared to be related to only constantly uninsured and insured after ACA. Relative to those whose incomes were consistently above 138% of FPL, those with incomes consistently below 138% of FPL and those with income changes were more likely to be constantly uninsured and insured after ACA than constantly insured. Those with chronic illnesses were less likely to be constantly uninsured while those with poor self-rated health were more likely to be constantly uninsured or insured after ACA than constantly insured.
In terms of covariates, those living in the South Region were more likely to be constantly uninsured or become insured after spending most of the time without insurance between 2002 and 2012. Except for the Midwest, those living in the New England Division of the Northeast Region and the Mountain Division of the West Region were more likely to be constantly uninsured, relative to those in divisions comprised solely of expansion states. Non-African American ethnic groups and those with low education were more likely to be constantly uninsured and insured after ACA than constantly insured. African Americans tended to belong to insured after ACA and uninsured after ACA groups rather than constantly insured. Unstable marital status was found to be more associated with constantly uninsured and insured after ACA than constantly insured.
Discussion
This study identified 4 longitudinal patterns of insurance status in middle-aged adults using nationally representative data over a 12-year period of time and investigated the extent to which their employment, income, and health statuses are associated with the different change patterns of insurance status under the Affordable Care Act (ACA). Middle-aged adults with unstable employment status and unskilled manual types of occupations were more likely to have unstable insurance coverage or constantly no insurance coverage than those with stable employment status and skilled occupations. Respondents with incomes consistently below 138% of the federal poverty level and poor health were more likely to experience long uninsured periods. These demographic characteristics associated with each insurance-change pattern may inform policy-level predictions of characteristics of those at risk of having lack of insurance and entering old age with high barriers to health services and financial burdens of health care costs.
A large body of literature on ACA effects focuses on either those adults who, under ACA, remain uninsured or who gained coverage.5,27,35 Very few ACA-related studies have explored insurance status change patterns among middle-aged adults; moreover, uninsurance periods were observed for only a year after ACA implementation. 23 Some longitudinal studies focusing on middle-aged adults examined differences in health care services among continuously uninsured, continuously insured, and intermittently uninsured; but these observations were not related to ACA implementation. 34 By considering insurance status prior to ACA implementation, we emphasize the need to study both the constantly uninsured and those whose insurance status changed after ACA implementation.
For insurance status change, we found different change patterns among middle-aged adults and substantial differences in socioeconomic characteristics among groups. Our hypothesis of disadvantaged sociodemographic characteristics among the constantly uninsured was confirmed. Interestingly, the group who gained insurance coverage after spending most of the time without insurance prior to ACA implementation appeared to have a higher proportion of individuals with racial minority status, unstable marital and employment statuses, consistently low-income histories, and poor health conditions than the constantly uninsured. Coverage gains are expected to vary depending on income for non-elderly adults. In the states that did not expand Medicaid, poor adults were not eligible for a federal subsidy but could purchase individual coverage in the marketplace while such adults became eligible for Medicaid in expansion states. 27 Therefore, the coverage gains for both poor groups could be more sizable than those with higher incomes whose insurance purchases were not subsidized. 36 This finding may support the positive effect of the ACA that its advocates hoped would emerge among disadvantaged populations.37,38
For the effects of middle-aged risk factors on insurance status change, we hypothesized that strong associations exist between being uninsured and changes in employment, income, and health statuses. Our results partially supported this hypothesis. When compared with the constantly insured, instability in employment status was significantly associated with those who experienced uninsurance before and/or after ACA implementation. This may support previous findings that middle-aged adults are likely to move in and out of the labor force before they reach retirement age, which results in unstable insurance status.24,25 Unskilled manual labor occupations and part-time employment also appeared to be related to the 3 types of uninsured status. This relationship may indicate that individuals with no coverage between the study period had unstable or irregular insurance coverage or experienced financial barriers to purchasing insurance due to reduced or low income related to vulnerable employment types. 5
In regard to changes in household income, those with incomes consistently below 138% of the FPL and with income changes were more likely to be constantly uninsured or to become insured after spending years prior to ACA implementation without insurance. This finding seems to present mixed messages: income low enough to be eligible for Medicaid under ACA could play a positive role for some people, while others with low income face financial barriers and continue to be uninsured under ACA. It is assumed that those with incomes below 138% of FPL might live in states that did not adopt Medicaid expansion. 39 For those whose incomes changed in either direction (to below or above 138%), the marketplace could have placed them in a more secure position with subsidized individual coverage than employment-based coverage. However, many reported costs of coverage as a major financial barrier, resulting in their remaining uninsured. 40
It is still too early to conclude whether these changes are associated directly with the ACA.10,27 The sharp decline in employer-sponsored insurance, especially among low-wage workers, and the increase in the uninsurance rate were exacerbated by the Great Recession. However, many observe that the economy is now in recovery and cite a reduced unemployment rate leading to increased employer-sponsored insurance.41,42
One recent study estimated counterfactual forecasts of uninsured in each age and income group as if there had been no ACA and compared these with actual coverage changes under the ACA. 27 It was found that the ACA reduced the number of uninsured adults by 18.1 million. We believe our analysis provided stronger findings by actually estimating insurance status over time, including the reference period (implementation of the ACA).
We acknowledge several limitations in our study. First, to better capture effects of the ACA, a difference-in-differences approach could have been employed as this approach compares outcomes under policy changes as well as between treatment and comparison groups. The approach is commonly used to study health policies; but, it was hard to define treatment and comparison group membership as a function of income, employment, and health statuses. Second, in terms of regions, states’ decisions about Medicaid expansion appeared to have an impact on health insurance status change, consistent with previous findings. 39 We found that those living in the South Region were more likely to be constantly uninsured or to become insured after spending most of the time between 2002 and 2012 without insurance, relative to those in divisions including only expansion states. However, findings on these divisions are incomplete unless it includes information on states for individuals. Third, unemployment of most middle-aged adults might include early retirement, but we did not include whether they retired or were temporarily unemployed. We tried to create various employment status variables, including retirement status, based on changes in employment status over years. However, each employment status variable carried too small cases. Fourth, we did not include participants’ 2014 income information, which is after ACA implementation, since RAND had not provided it at the time of our analysis.
Conclusions
The ACA will substantially change both the number of insured and the composition of the uninsured population. Our study contributes to literature on uninsured middle-aged adults and informs policy improvements that expand coverage. In particular, the analysis of insurance status over time among middle-aged adults represents a stronger research design than descriptive analyses comparing coverage differences.
Our findings have important policy implications. First, the analysis results may be helpful in estimating the number of uninsured middle-aged adults in the context of periods of uninsurance as well as providing policy-level predictions of the ACA’s coverage expansion effects on the uninsured. Second, the different patterns of insurance change also provide necessary background for informed policy improvements. Especially, understanding the characteristics of the near-elderly population with chronically uninsurance status helps us identify this population that holds promise for large coverage gains under the ACA. It also provides indicators of effective outreach strategies for public and private entities, allowing an informed discussion of the need for additional assistance in obtaining coverage. Third, causes and consequences of being uninsured have figured prominently in political debates on health care policy, since access barriers to insurance and underuse of essential health care services result in poorer health status and decreased economic productivity. 43 Instability in employment status and financial difficulties associated with long periods of uninsurance may also help policy makers and researchers move beyond merely reducing the number of uninsured to providing the information necessary to reshape the health coverage system. The implementation of Medicaid expansion and marketplace subsidies is not homogeneous across states, which could have influenced eligibility for coverage. Future research should characterize the remaining uninsured middle-aged invincible poor and the factors determining the uninsured status. This further research could shed light on ongoing changes in coverage of middle-aged adults in the post-ACA era.
Footnotes
Declaration of Conflicting Interests
The author(s) declared no potential conflicts of interest with respect to the research, authorship, and/or publication of this article.
Funding
The author(s) received no financial support for the research, authorship, and/or publication of this article.