




Abstract
Health care-based negative production externalities, such as greenhouse gas emissions, underscore the need for hospitals to implement sustainable practices. Eco-certification has been adopted by a number of providers in an attempt, for instance, to curb energy consumption. While these strategies have been evaluated with respect to cost savings, their implications pertaining to hospitals’ financial viability remain unknown. We specify a fixed-effects model to estimate the correlation between Energy Star certification and 3 different hospitals’ financial performance measures (net patient revenue, operating expenses, and operating margin) in the United States between 2000 and 2016. The Energy Star participation indicators’ parameters imply that this type of eco-certification is associated with lower net patient revenue and lower operating expenses. However, the estimated negative relationship between eco-certification and operating margin suggests that the savings in operating expenses are not enough for a hospital to achieve higher margins. These findings may indicate that undertaking sustainable practices is partially related to intangible benefits such as community reputation and highlight the importance of government policies to financially support hospitals’ investments in green practices.
For decades, the United States has devoted considerable efforts to the reduction of greenhouse gas (GHG) emissions through the creation of the US Environmental Protection Agency. These efforts include the creation in 1992 of a volunteer-based program called Energy Star, which aims at reducing GHG produced by property plants and buildings across the United States. Since 1992, a growing number of industries, such as the hospitality sector, have initiated climate change policies to their company structure in order to reduce their environmental impact. A total of 36 262 commercial and public properties have volunteered for the program and followed strict energy guidelines to increase energy efficiency and reduce emissions. However, the health care industry has experienced a relatively low participation rate in these eco-certification programs. While only 5.5% or 324 of all hospitals in the country are currently participating in Energy Star, the health care industry contributes 7.6% to national emissions. 1
Reducing GHG in a given industry creates positive, health-related externalities that make eco-certification appealing. However, whether this business strategy is financially sustainable is an important aspect that should be taken into account. A growing body of literature has studied the association between eco-certified buildings and companies’ financial performance. Spenser et al 2 looked at the financial and operational performances of eco-certified hotels over noneco-certified hotels (e.g., Energy Star, LEED). Similar to Energy Star, Leadership in Energy and Environmental Design (LEED) is a private organization run by the nonprofit US Green Building Council. LEED seeks to reduce commercial building emissions. Using a random-effects model, the study uses 3 dependent variables as proxies for the financial performance of eco-certified hotels: occupancy rate, average daily rate, and revenue per available room. The results reported show only marginal increases in each dependent variable among Energy Star- and LEED-certified hotels from 2009 to 2013.
Unlike the hospitality or service industries, hospitals operate 24 h per day and are occupied and administered by thousands of individuals daily. To accommodate high patient and employee volumes and sophisticated systems such as heating, ventilation, and air conditioning (HVAC), imaging technology, and operating rooms, hospitals consume an enormous amount of energy and resources. For instance, in 2003, the Commercial Building Energy Consumption Survey reported that hospitals accounted for slightly <1% of total commercial buildings. 3 However, the survey reports that large hospitals account for 4.3% of the total delivered energy used by the commercial sector in 2003. Moreover, Energy Star reports that hospitals spend more than $6.5 billion on energy each year. 4 In addition, consumption of natural gas, a major source of energy production, among large hospitals is projected to increase in cost, due to reduced production. 5 Consequently, hospitals may seek alternative solutions to offset these current and increasing operating expenses that go beyond achieving production efficiency. Alternative solutions, such as Energy Star and LEED, suggest reducing hospital emissions, while improving financial performance.
Berry et al 6 conducted a benefit–cost analysis of eco-certification based on a simulated hospital, Fable Hospital. To generate Fable Hospital, the Center for Health and Design partnered with health care organizations to collect health care data and improve health care design. Health care organizations that partnered with the center were denoted as “Pebble Hospitals.” To conduct a benefit–cost analysis, incremental costs and financial impacts are calculated using averages obtained from Pebble hospitals. This study reports reduced nurse turnover rates, nosocomial infections, and drug costs as well as an increase in market share for Fable-like hospitals. Based on these measures, the authors conclude that the financial benefits of building a Fable Hospital outweighed the corresponding financial costs. Comparatively, Bilec et al 7 track various performance measures of the Children's Hospital of Pittsburgh (CHP) over a period of time, beginning in 2005, as the hospital transitions to a new, LEED-certified building. Moreover, at the time of the study (2010), data is continuously being collected to quantify the benefits and costs of moving CHP to the new LEED-certified building. Five general categories are measured prior to moving CHP: staff productivity, quality of care, utility data, expenses, and staff satisfaction. Measuring these categories prior to the transition demonstrates the trends in which CHP is heading. While these categories are quantifiable prior to the transition, additional data collection is necessary to determine the benefits and costs of transitioning to an eco-certified building, as this is an ongoing study. Furthermore, to determine the economic benefits of eco-certification, the authors suggest the use of breakeven analysis, benefit–cost ratio, and net present value to quantify this transition. We aim to expand upon studies, such as the Fable Hospital and CHP case studies, by incorporating larger sample sizes and measuring the financial performance of eco-certified hospitals once they are eco-certified.
Beyond eco-certification, several studies have investigated the correlation between specific health care reimbursement programs, such as pay-for-performance (P4P) and electronic medical records (EMRs), and hospital financial performance following the enactment of the Affordable Care Act in 2010.8,9 Kruse et al 8 apply a difference-in-difference approach to analyze how the P4P initiative affected the finances of hospitals participating in the program. In their analysis, the results yielded almost no change in financial performance among hospitals participating in P4P compared to their counterparts. Conversely, Encinosa and Bae 9 analyze how the introduction of EMRs in hospitals affects hospital spending and patient safety outcomes. They conclude that the introduction of EMRs reduced the rate of patient safety events and increased total savings by 16% by increasing hospital efficiency. 9
While several studies have analyzed the association between government-mandated reimbursement programs and hospitals’ financial performance, there exists a gap in the empirical literature related to voluntary eco-certification initiatives and financial performance. Using a fixed-effects econometric approach, we empirically estimate the correlation between eco-certification (e.g., Energy Star) and 3 hospitals’ financial performance measures (net patient revenue, operating expenses, and operating margin) in the United States between 2000 and 2016. The association between green building strategies in a hospital setting and revenue levels may be indirectly influenced by the corresponding improvements in the quality of medical care delivered, brand reputation, and philanthropic contributions. In a 2011 cost–benefit study, Sadler et al 10 investigated how improvement in indoor air quality, provision of natural light, and reduction of noise levels correlate with patient care. The authors found a significant reduction in patient length of stay, the rate of hospital-acquired infections, and intervention errors. While this improvement in quality of care could be associated with a decrease in operating expenses in the long run, it may also result in loss of patient revenue due to a decrease in demand for medical services. Another aspect of the implementation of green building strategies is its relation to brand image improvement and its corresponding effect on hospital revenue levels. A growing number of studies have argued that eco-certification could foster brand recognition and ultimately increase hospital revenues.11,12 It is worth noting that revenue from medical care services may also be correlated with other characteristics that are not necessarily related to green building initiatives, such as case mix, hospital output, reimbursement system, and charges for medical care delivered. In terms of revenue sources other than patient revenues, studies have suggested a positive correlation between green building initiatives and philanthropic contributions.13,14 These arguments highlight the importance of conducting an analysis that considers measures beyond energy usage in order to assess the operational impact of eco-certification. 15
To our knowledge, this is the first study to estimate the association between eco-certified health care providers and their operating margin. The data for this study come from the Hospital Cost Report Information system (HCRIS) and Energy Star database.
Pollution, Green Health Care, and Health
The environmental footprint of hospital-based care stems from energy-intense hospital operations as well as from indirect activities related to the delivery of care, including procurement and waste management.16–19 Another source of environmental pollution is environmental hazards in the manufacture and disposal of pharmaceuticals and biohazardous products,20,21 including inhaled anesthetics that are themselves potent GHGs.22–24 Based on an economic input–output life cycle assessment modeling and national health expenditures, Eckelman and Sherman 16 and Eckelman et al 25 estimated an annual loss of 614 000 disability-adjusted life years between 2003 and 2013 and 388 000 in 2018 due to pollution from health care.
The implementation of sustainable health care practices has both direct and indirect positive impact on health outcomes. These benefits can be experienced at the local, community, and global scales. Within a given hospital, green health care can significantly reduce respiratory illnesses, decrease allergies and asthma, reduce sick building syndrome symptoms, and decrease premature deaths. 26 Buonocore et al 27 estimated a reduction of 3600 in premature deaths per year as a result of a 32% decrease in carbon pollution from 2005 levels. A 2015 analysis published by the Healthcare Climate Council reports that reducing GHG emissions from electricity consumption by 30% in the hospital industry would result in fewer premature deaths (4130) and asthma attacks (85 000) and save $1.2 billion in health costs by 2030. 28 In a more recent study, Buonocore et al 29 estimated the health cobenefits of a carbon pricing initiative in Massachusetts for the period 2017 to 2040, concluding that a reduction in fossil fuel-based electricity production would result in fewer hospitalizations for cardiovascular and respiratory health, resulting in 340 lives saved over that time period. Ulrich et al 30 conducted a meta-analysis of peer-reviewed studies to investigate whether the physical environment of a hospital associates positively with health care quality and safety. The authors found a strong correlation between sustainable health care practices and patient and staff outcomes. Stress and fatigue levels were significantly lower for both patients and staff, which in turn increased effectiveness in delivering care and overall health outcomes. In particular, access to views and natural light in health care facilities has been shown to have stress-reducing effects and to reduce pain and the length of stay at the hospital. 31
On the community scale, reducing the carbon footprint of hospital-based care decreases environmental hazards and protects natural resources. A hospital can contribute to the reduction of motor vehicle traffic and help achieve cleaner air in a community by being connected with well-developed pedestrian infrastructure and mass transit. It can also reduce waste sent to landfills by decreasing food packaging and by adopting biodegradable utensils and plates.
On the global scale, green health care lowers pressure on scarce resources while reducing environmental degradation. Local procurement decreases GHG emissions by lowering transportation distances of goods. In addition, a health care facility that installs flooring made from sustainably harvested wood helps slow deforestation. 32
Background: Energy Star Certification
Energy Star is a program created by the US government in 1992 to help offset GHG emissions and reduce overall energy consumption among buildings and property plants across the country. Moreover, Energy Star allows businesses to achieve cost savings by reducing their energy consumption and carbon footprint. For instance, Energy Star states that it helped businesses and partners save an estimated $35 billion in energy costs in 2018. 33 A wide array of entities participate in the program. For instance, Figure 1 shows the diversity among organizations participating in the program. If a business applies for Energy Star certification, a score is evaluated based on its energy use, relative to similar buildings that are part of the program.

Total number of Energy Star-certified properties by type of property. Nine members were excluded due to a low number of observations. 33
To calculate the score of a given hospital within the United States, Energy Star utilizes data from an industry survey conducted by the American Society for Healthcare Engineering.34,35 Based on this data, Energy Star performs a statistical analysis to determine the energy performance of an entity relative to that of its peers. This statistical analysis identifies components of the hospital that increase energy consumption. These components include variables such as the number of magnetic resonance imaging machines, percentage of square footage relative to a unit (e.g., trauma rooms, operating rooms), and heating degree days.34,35 This analysis assigns a score between 1 and 100 to each hospital. A score greater than 50 means the hospital is performing better than 50% of its peer hospitals. A score of 75 or above means an entity can become Energy Star certified. It is worth noting that hospitals in our sample identified as Energy Star certified have a score of 75 or above. 35
Materials and Methods
Data
To estimate the proposed fixed-effects models, 2 sources of data were used: HCRIS and the Energy Star website. Hospitals’ cost information comes from annual financial reports submitted to a Medicare Administrative Contractor and maintained by the Centers for Medicaid & Medicare Services in the HCRIS. Hospitals’ status regarding Energy Star certification was determined based on the Buildings and Plants document published by Energy Star. Between 2000 and 2016, the initial sample size in the HCRIS was 80 708 or 7563 unique health care providers’ identifiers. As reported in Table 1, 2 filters were used in the cost and utilization data set obtained from HCRIS to exclude observations and types of hospitals based on the following conditions: (1) hospitals identified as specialty hospitals, such as Veteran Administration Medical Centers and those focused on psychiatric, cancer, psychiatric, rehabilitation, children, or alcohol and drug care (15 113 observations); and (2) observations with missing financial information (2112 observations). As of 2016, there were 242 health care providers identified as Energy Star certified in the Buildings and Plants data set. A total of 94 hospitals were excluded based on being Veteran Administration Medical Centers, on financial data being consolidated with other providers, and on being specialty hospitals. As a result of these filters, the empirical estimates reported in this study are based on 63 483 observations or 4940 unique hospital identifiers (Tables 2 and 3).
Data Filter and Estimation Procedure.

Variable Definitions.
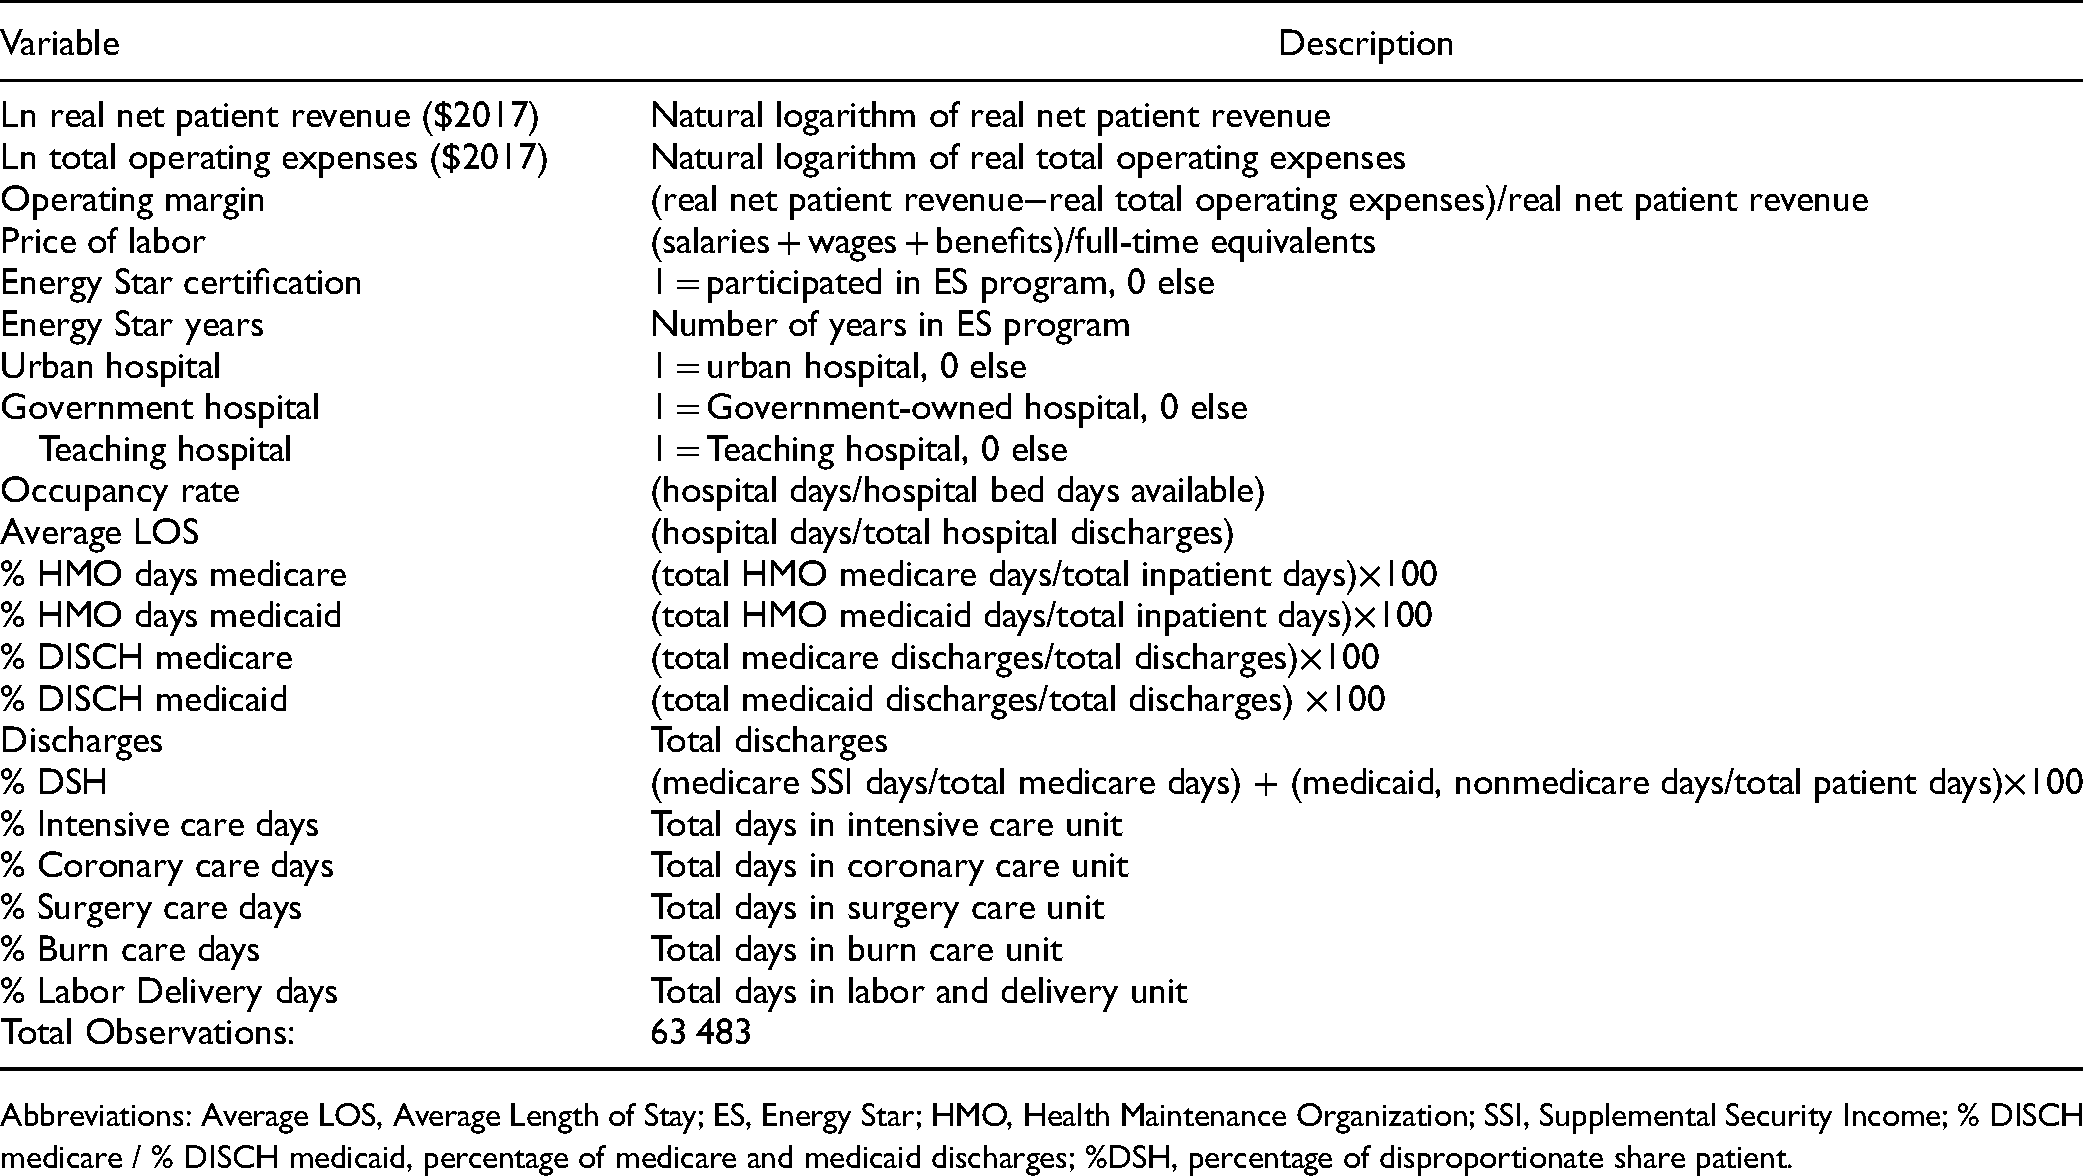
Abbreviations: Average LOS, Average Length of Stay; ES, Energy Star; HMO, Health Maintenance Organization; SSI, Supplemental Security Income; % DISCH medicare / % DISCH medicaid, percentage of medicare and medicaid discharges; %DSH, percentage of disproportionate share patient.
Descriptive Statistics.
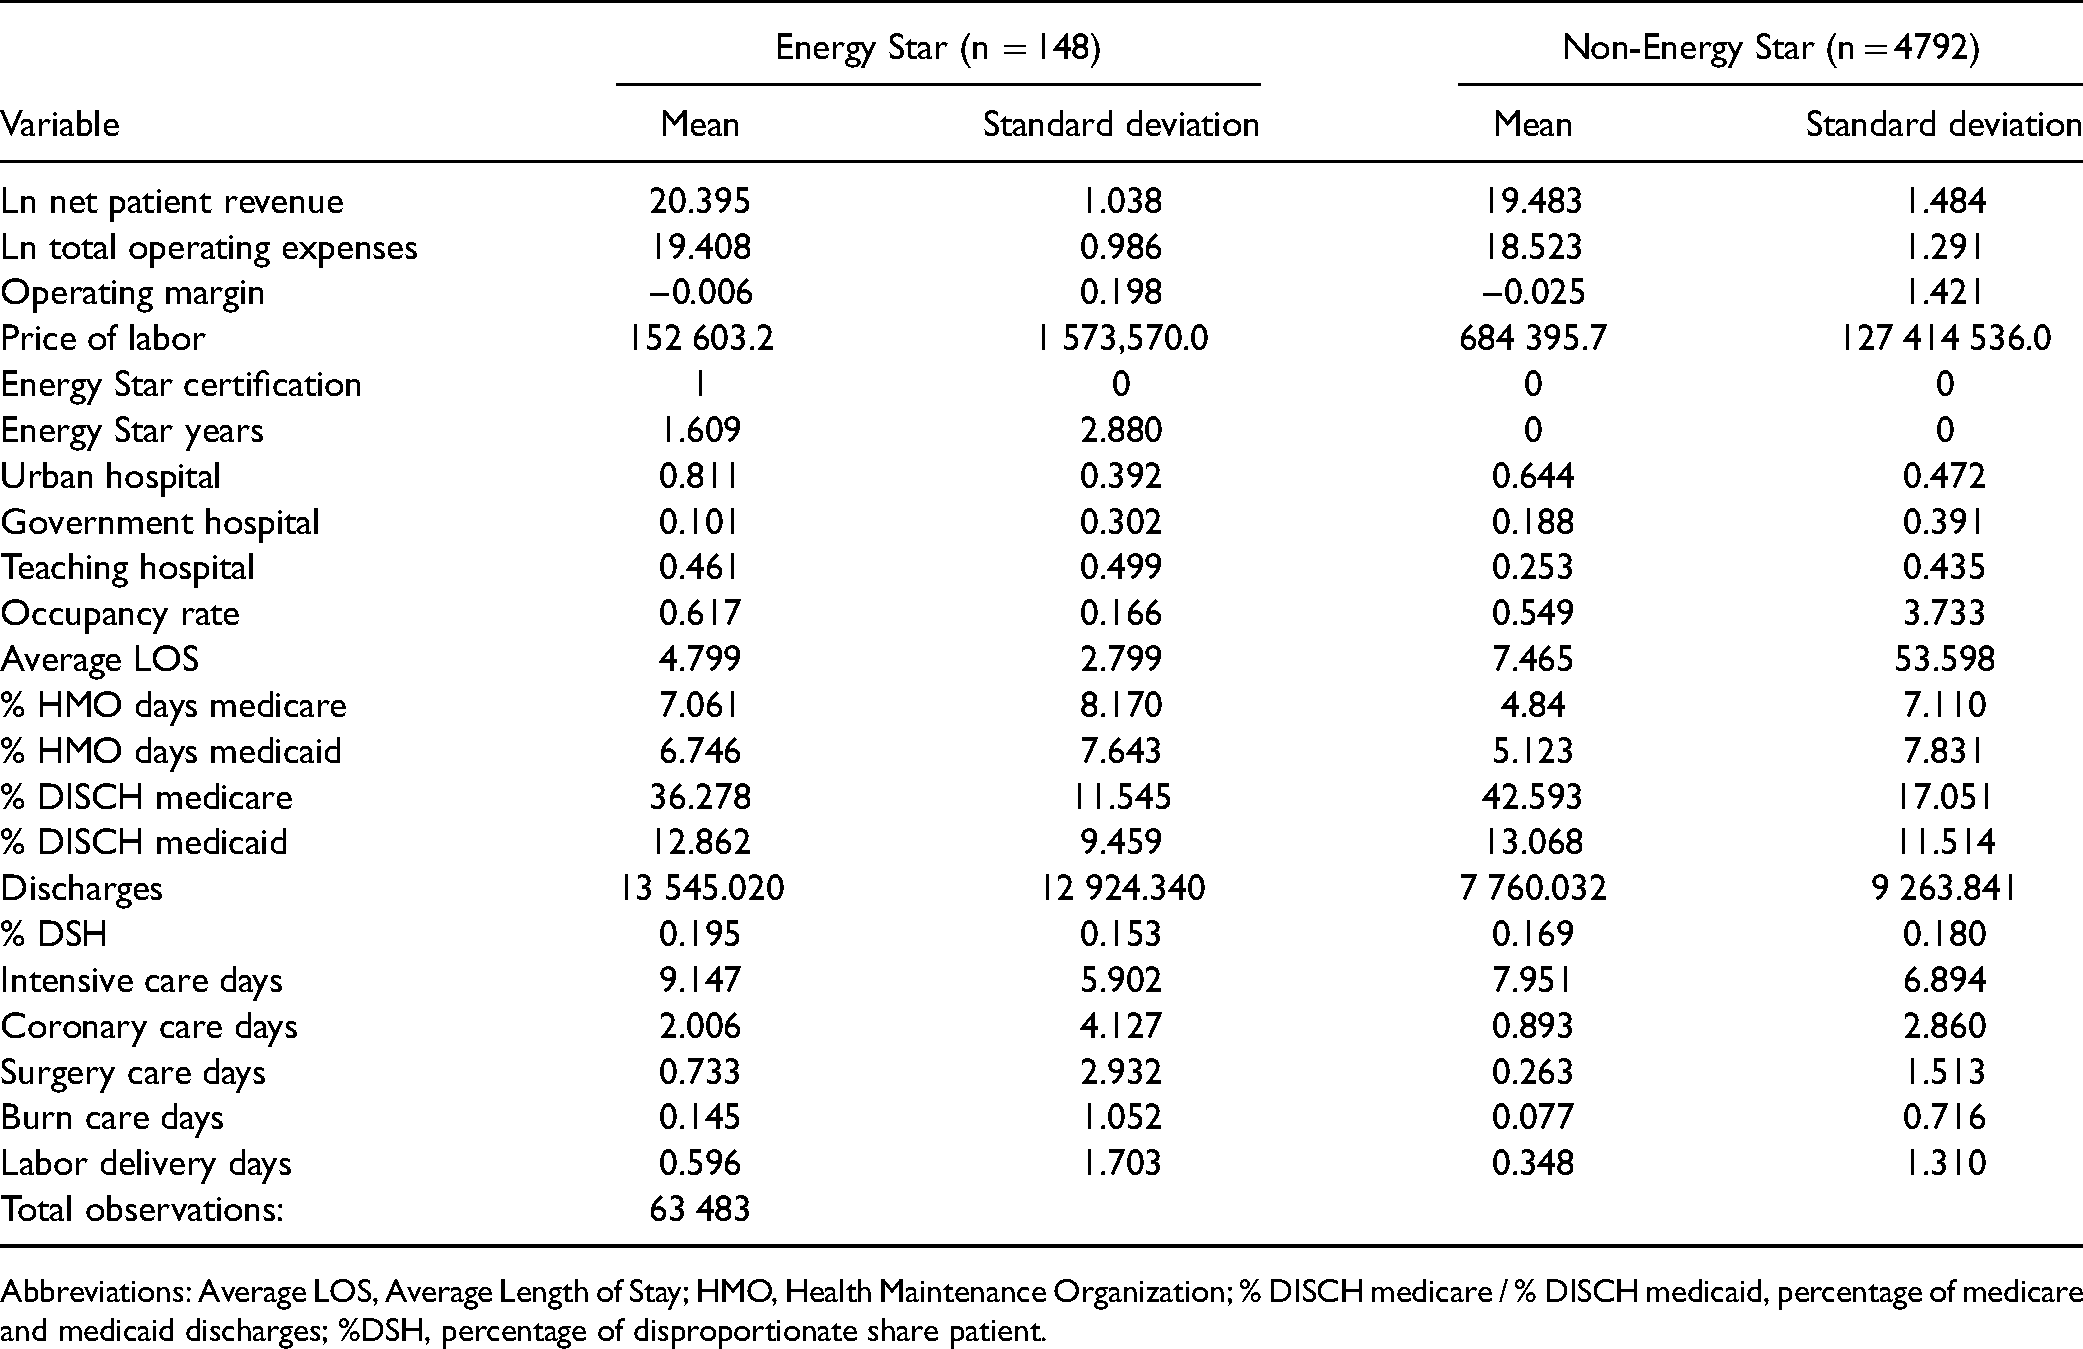
Abbreviations: Average LOS, Average Length of Stay; HMO, Health Maintenance Organization; % DISCH medicare / % DISCH medicaid, percentage of medicare and medicaid discharges; %DSH, percentage of disproportionate share patient.
Three financial performance measures are specified as dependent variables in this study: the natural logarithm of real net patient revenue, the natural logarithm of real total operating expenses, and operating margin. The latter is a measure of profitability and is calculated as the difference between net patient revenue and total operating expenses divided by net patient revenue.
The price of labor for each hospital is the sum of a hospital's reported total salaries, wages, and benefits divided by the number of full-time equivalents for all staff categories. This variable is also log-transformed. Three variables control for the volume of patients treated: average length of stay, occupancy rate, and total discharges.
To account for observed time-variant heterogeneity in hospital output, we control for care intensity and structural quality. In the case of intensity of care, we include % intensive care days, % coronary care days, % surgery care days, % burn care days, and % labor delivery days. An indicator variable for hospital teaching status is included to account for structural quality. This type of hospital tends to quality-differentiate and serve patients with a more diverse array of diagnoses. 36 Because teaching hospitals have goals that may not be conducive to cost minimizing, we anticipated that the indicator variable would have a negative coefficient with regard to operating margin. 37
To control for the mission, vision, and values of a hospital, we include an indicator for Energy Star certification, percentage of disproportionate share patient (% DSH), and ownership status. To assess the correlation between Energy Star certification and the corresponding dependent variable, an indicator variable equal to 1 for the first and subsequent years of Energy Star certification as well as the number of years a hospital has been certified are specified in the model. Due to safety-net hospitals’ financial vulnerability under policy reforms and economic recessions, we include a variable (% DSH) that is defined as the ratio of the sum of medicare and medicaid days and total patient days.38–40 We also include an indicator variable (Government Hospital) representing government-owned status with other types of ownership, such as for-profit and nonprofit, as reference categories. This variable controls for the internal pressures on hospital cost inefficiency related to hospital ownership status.41,42 Property Rights Theory indicates that public hospitals are less cost efficient than their peers.43,44
Another important factor that affects the financial performance of hospitals is the type of reimbursement system these entities face. To account for the correlation between the prospective payment system reimbursement and hospitals’ budgets, we include the percentage of medicare and medicaid discharges (% DISCH medicare and % DISCH medicaid). As prospective payment system medicare reimbursements are often below providers’ costs, we expect a negative correlation between this variable and total margin. 45 We also account for the proportion of medicaid and medicare patients enrolled in Health Maintenance Organization (HMO) plans. This variable is the sum of a provider's reported discharges from medicaid and medicare managed care divided by a hospital's total discharges for each year. While the rise of HMO plans has been shown to be inversely correlated with hospital costs,46,47 we expect a negative correlation between these variables and total margin due to the low reimbursements relative to health care costs.
Methodology
This study endeavors to estimate the correlation between Energy Star certification and financial performance in the hospital sector. A recurring issue with panel data is the presence of unobserved time-invariant heterogeneity across different groups. Two plausible empirical approaches to account for this include fixed-effects and random-effects models. The former is designed to study how a predictor or independent variable relates to changes in the dependent variable within a given group or entity (e.g., company, health care provider), and it has 2 main assumptions. The first is that because unobserved time-invariant characteristics may bias the influence that observed independent variables have on a dependent variable, the correlation between an entity's error term and predictor variables is nonzero. As shown in equation (2), the fixed-effects approach mitigates this potential bias by specifying an entity fixed effect
Following Greene's
48
theoretical framework, the baseline empirical fixed-effects model can be specified as follows:


Another recurring issue that pertains to panel data is whether the outcome variable of interest is also dependent on time. To control for time fixed effects, equation (3) can be rewritten as follows:
One drawback of the fixed-effects approach is that it cannot be used to investigate time-invariant causes of the dependent variables, because time-invariant characteristics of the individuals are perfectly collinear with
An alternative empirical method to a fixed-effects model is a random-effects specification. Under this approach, the time-invariant heterogeneity across entities is assumed to be random and thus uncorrelated with independent variables included in the model. Therefore, time-invariant observed characteristics can be included in the model. As equation (5) shows, in random-effects models, unobserved time-invariant heterogeneity across entities is modeled as a function of a constant term and a random component:
Results
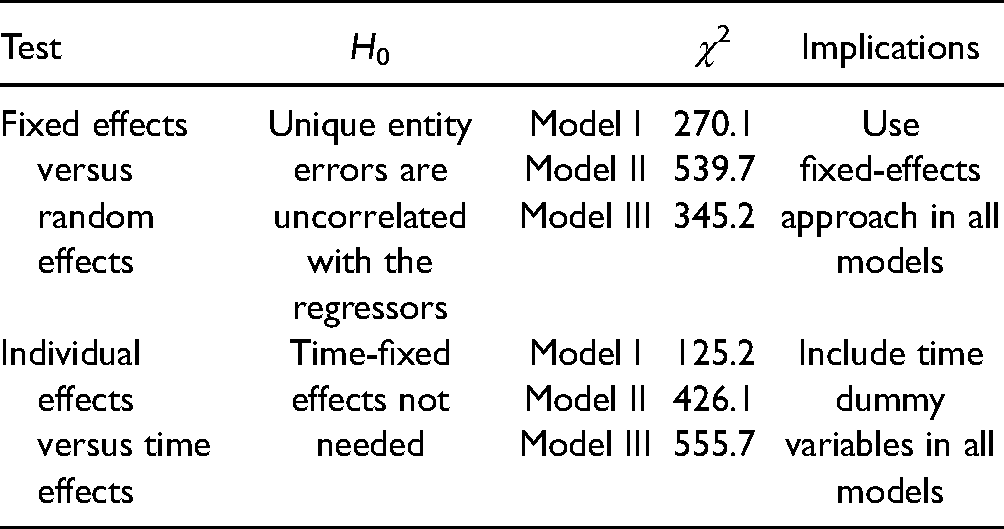
The results for a number of diagnostics tests are reported in Table 4. These tests aid in the identification of the preferred model, estimation technique, and statistical distribution of the inefficiency term. Based on the reported chi-squared (χ2) values, the preferred model is a fixed-effects model with both individual and time effects specification for all 3 models. The estimated parameters for the preferred model specifications are reported in Table 4. The sign of the coefficients for the price of labor suggest a positive correlation between this variable and the 3 dependent variables specified. While an increase in salaries is associated with higher hospital revenue, it also correlates with increases in total operating expenses. The resulting net effect reported in the last column indicates that an increase in labor input price corresponds to an increase in the operating margin realized by the hospital. The estimated coefficients pertaining to the certification in the Energy Star program are negative across the different models. Being Energy Star certified is associated with lower net patient revenue as well as lower operating expenses, which highlights the importance of exploring its correlation with operating margin. The estimated negative relationship between eco-certification and operating margin suggests that the corresponding lower operating expenses are not enough for a hospital to achieve higher margins (Table 5).
Model Identification Process.
Fixed-Effects Results.

Abbreviations: Average LOS, Average Length of Stay; HMO, Health Maintenance Organization; % DISCH medicare / % DISCH medicaid, percentage of medicare and medicaid discharges; %DSH, percentage of disproportionate share patient.
Note: *P < .1; **P < .05; ***P < .01.
The coefficients for whether a hospital is categorized as urban- and government-owned are negative across all 3 model specifications. These findings suggest that while being urban or having a government owned-status is correlated with lower operating expenses, these hospital characteristics are associated with lower operating margins. Teaching hospitals exhibit relatively lower operating margins. The estimated parameters for the percentage of HMO medicare days, HMO medicaid days, and medicaid discharges have a negative correlation with operating margin. This suggests that the prospective payment system that hospitals are subject to when delivering care to patients with public insurance puts significant pressure on a provider's financial performance.
Conclusion
The rapid increase in energy costs coupled with a rising concern about the carbon footprint of hospital-based care have been important drivers behind hospitals’ eco-certification efforts. While such business strategies present environmental benefits that go beyond a hospital setting, there remains the question of whether acquiring eco-certification is financially sustainable. This study contributes to the growing number of empirical analyses evaluating the association between eco-certification and financial health of an organization by estimating the association between Energy Star certification and operating margin in the hospital industry in the United States.
In this study, we assess the correlation between Energy Star certification and various financial performance measures (net patient revenue, operating expenses, and operating margin) through the years 2000 to 2016 using a fixed-effects model with controls for eco-certification, public insurance, inpatient care intensity, and structural quality. The financial and utilization data for this study come from the HCRIS, while the eco-certification participation was obtained from the Energy Star website. Based on a fixed-effects model approach, the estimated parameter for the indicator representing the correlation between participation in the Energy Star program and operating margin is negative. This implies that participation in the Energy Star program was associated with a decrease in hospitals’ operating margin during the study period. This negative correlation indicates that while eco-certification may have positive environmental benefits, it may not improve a hospital's financial performance. This finding may relate to the fact that many of the sustainable projects undertaken have long payback periods and require significant upfront investment. A 2009 survey conducted by the American College of Healthcare Executives found that 74% of the respondents cited financial cost as the main barrier for implementing sustainable strategies. 49 While this is troublesome, there may be other intangible benefits of eco-certification that incentivize an organization to implement sustainable practices. The cobenefits of implementing green health care practices that we alluded to previously may go well beyond financial gains for hospital. There are cobenefits, such as reduction in respiratory illnesses, decrease in allergies, and decrease in premature deaths and in stress and fatigue levels, that can be inferred from this analysis, but they need estimation procedures and data that are outside the scope of this study. For instance, hospitals in the United States can estimate the health effects that correspond to a given level of fossil fuel-based energy consumption, including premature deaths, contributions to chronic bronchitis, and asthma attacks, by using the energy impact calculator developed by the organization Practice Greenhealth. 50 Moreover, as members of a community, health care providers strive to not only achieve financial goals, but also to foster brand image and increase trust and employee satisfaction. 51 The negative correlation between eco-certification and a hospital operating margin implies that undertaking sustainable practices may partially be related to cobenefits at a local, community, and global scale.
Strengths and Weaknesses
When interpreting this study's findings, it is important to recognize several constraining factors: the sample size of Energy Star hospitals, the availability of financial and utilization data for the study period, and the focus on financial performance as opposed to health care quality. While the number of Energy Star-certified health care providers (148) is relatively small, it is important to realize that as of 2016, the total number of nonspecialty hospitals that were Energy Star certified was 148. Therefore, the analysis conducted in this study is based on the population of certified hospitals as opposed to a sample. Secondly, only a subset of noncertified hospitals reported financial and utilization data for the period considered, and generalizing these findings to providers not included in our sample should be done only after careful consideration. Lastly, while this study focuses on the association between eco-certification and various financial performance measures, other cobenefits of sustainable practices would also need to be considered to conduct a more comprehensive assessment of the benefits of green health care practices.
It is also important to point out that the cost data used in this study (e.g., operating expenses) should not be entirely attributed to the specific green building initiative being analyzed (e.g., eco-certification). The dollar amount representing hospitals’ total operating expenses includes the costs associated with green practices such as heating, ventilation, and air conditioning systems as well as other types of expenses, including those related to the implementation of safety protocols and hygiene. Depending on the particular process for cleaning and disinfecting a patient's room, a hospital might incur operating costs that are not only unrelated to eco-certification but also very different from those of another facility.
Another aspect that should be considered when interpreting the findings of this study is the fact that a single health care provider may have multiple buildings with different ages, and older facilities may not have HVAC systems. While controlling for the age of buildings would be desirable, the HCRIS database does not provide this information, and the authors acknowledge this as another limitation of this study.
As mentioned previously, green building initiatives in a hospital setting may lower readmission rates and hospital-acquired conditions and, at the same time, increase quality of care and staff safety. These factors may be strongly correlated with a hospital's financial performance and should be considered in future studies.
Footnotes
Declaration of Conflicting Interests
The authors declared no potential conflicts of interest with respect to the research, authorship, and/or publication of this article.
Funding
The authors received no financial support for the research, authorship, and/or publication of this article.
