
Abstract
Background:
Service users with non-psychotic disorders are rarely studied. How continuity of care functions for this group is unknown.
Aims:
To compare users of community mental health teams with non-psychotic disorders to those with psychotic disorders in terms of demographic and illness characteristics, continuity of care and clinical and social functioning.
Methods:
Service users with non-psychotic disorders (N = 98) were followed up for one year and compared to 180 service users with psychotic disorders. Continuity of care factors were tested for association with user, illness and service variables.
Results:
Service users with non-psychotic disorders experienced more care transitions, but there were no differences in team practices in relation to these two different groups.
Conclusion:
The underlying concepts of continuity of care derived from users with psychotic disorders appear to be meaningful for users with non-psychotic disorders. Their greater likelihood of experiencing disruptive and distressing care transitions needs to be addressed.
Background
The ECHO study was designed to explore the nature and operation of continuity of care for people in long-term community mental health team (CMHT) care. This paper reports the extension of this study to a cohort with non-psychotic disorders, the original study having focused on a cohort with psychotic disorders (Catty et al., 2011). This analysis of the cohort with non-psychotic disorders was designed to replicate the analysis of those with psychotic disorders, and hence readers are referred to the companion paper for details of background and methodology.
As well as focusing on narrow definitions of continuity, previous studies have largely either ignored the experiences of service users with non-psychotic disorders or have failed to delineate or investigate their specific needs. Indeed, people with non-psychotic disorders have rarely been the focus of psychiatric services research over the last two to three decades, despite evidence that they place a significant burden on CMHTs (Paykel, Mangen, Griffith, & Burns, 1982). The present paper reports our analysis of associations between continuity and clinical outcomes for this group, along with a comparison of the operation of continuity of care between this group and the group with psychotic disorders.
Objectives
We aimed to compare service users with non-psychotic disorders to those with psychotic disorders, in terms of their demographic and illness characteristics, experiences of continuity of care and the relationship between continuity factors and clinical and social functioning outcomes. Our specific objectives were: to compare the two groups on demographic and illness characteristics; to assess the relationship between service user characteristics and continuity of care, and the impact of continuity on mental health and social functioning, for the group with non- psychotic disorders; and to compare the levels of the continuity factors in the two groups.
Material
Sample, setting and procedure
People with long-term non-psychotic mental health problems were recruited from the caseloads of seven CMHTs in two mental health trusts (Trust 1 and Trust 2), assessed at baseline (T1) and followed up one year later (T2). The study was designed to replicate the methodology used for the cohort with psychotic disorders in the care of the same CMHTs (Catty et al., 2011), minimally modified to be appropriate to the patient group. The inclusion criteria were: primary diagnosis of any non-psychotic disorder; on the ‘enhanced’ level of the Care Programme Approach (CPA: DoH, 1999) or having at least monthly contact with the CMHT; in contact with psychiatric services for at least two years; on the caseload of the CMHT for at least six months; aged 18 to 65. Clinical diagnoses for the sample were taken from case notes.
Data were collected through interview on: demographic and illness variables; patterns of contact with organizations and individual professionals; breaks in care; days in hospital; depression and anxiety (Hospital Anxiety and Depression Scale, HADS: Zigmond & Snaith, 1983); functioning (Global Assessment of Functioning, GAF: Endicott, Spitzer, Fleiss, & Cohen, 1976); needs for care (Camberwell Assessment of Need, CAN: Phelan, Slade, & Thornicroft, 1996); therapeutic relationship (Scale to Assess Therapeutic Relationships in Community Mental Health Care – service user version, STAR: McGuire-Snieckus, McCabe, Catty, & Priebe, 2007); quality of life (Manchester Short Assessment of Quality of Life, MANSA: Priebe, Huxley, Knight, & Evans, 1999); Schedule for the Evaluation of Individual Quality of Life, SEIQoL: McGee, O’Boyle, Hickey, O’Malley, & Joyce, 1991); empowerment (User Empowerment Scale: Rogers, Chamberlin, Ellison, & Cream, 1997) and ‘experienced continuity’ (Continuity of Care–User Measure, CONTINU-UM: Rose et al., 2009). Data on service contact and information flow were collected from CMHT records. All data related to continuity of care were collected for the year prior to interview.
Sample size
We aimed to recruit 100 service users. This sample size was primarily determined by pragmatic considerations, but was adequate for the planned analyses. When comparing the levels of continuity between the two groups, adjusting for the unequal size of the groups (180 psychotic and 100 non-psychotic users), the sample sizes would be sufficient to detect between group effect sizes of 0.4 (a small to medium effect) and above with 90% power at a 5% significance level.
Characteristics of the two cohorts compared
Demographic and care characteristics of the sample were compared to those of the group with psychotic disorders. Users who had been discharged from secondary care by the end of the study were compared to those who had not, and users who dropped out of the study were compared to those who did not. For continuous variables, groups were compared using independent samples t tests and for categorical variables, groups were compared using χ2 tests. Bonferroni’s correction was applied to allow for multiple testing.
Continuity of care for service users with non-psychotic disorders
A seven-factor model of continuity of care derived from analysis of the cohort with psychotic disorders (Burns et al., 2009) was used to explore the experiences of continuity of the present group (Table 1). Its robustness for the latter group was tested in a confirmatory factor analysis (to be reported separately).
Continuity of care factors: Definitions and measures.
(definitions corresponding to a high score on each factor).
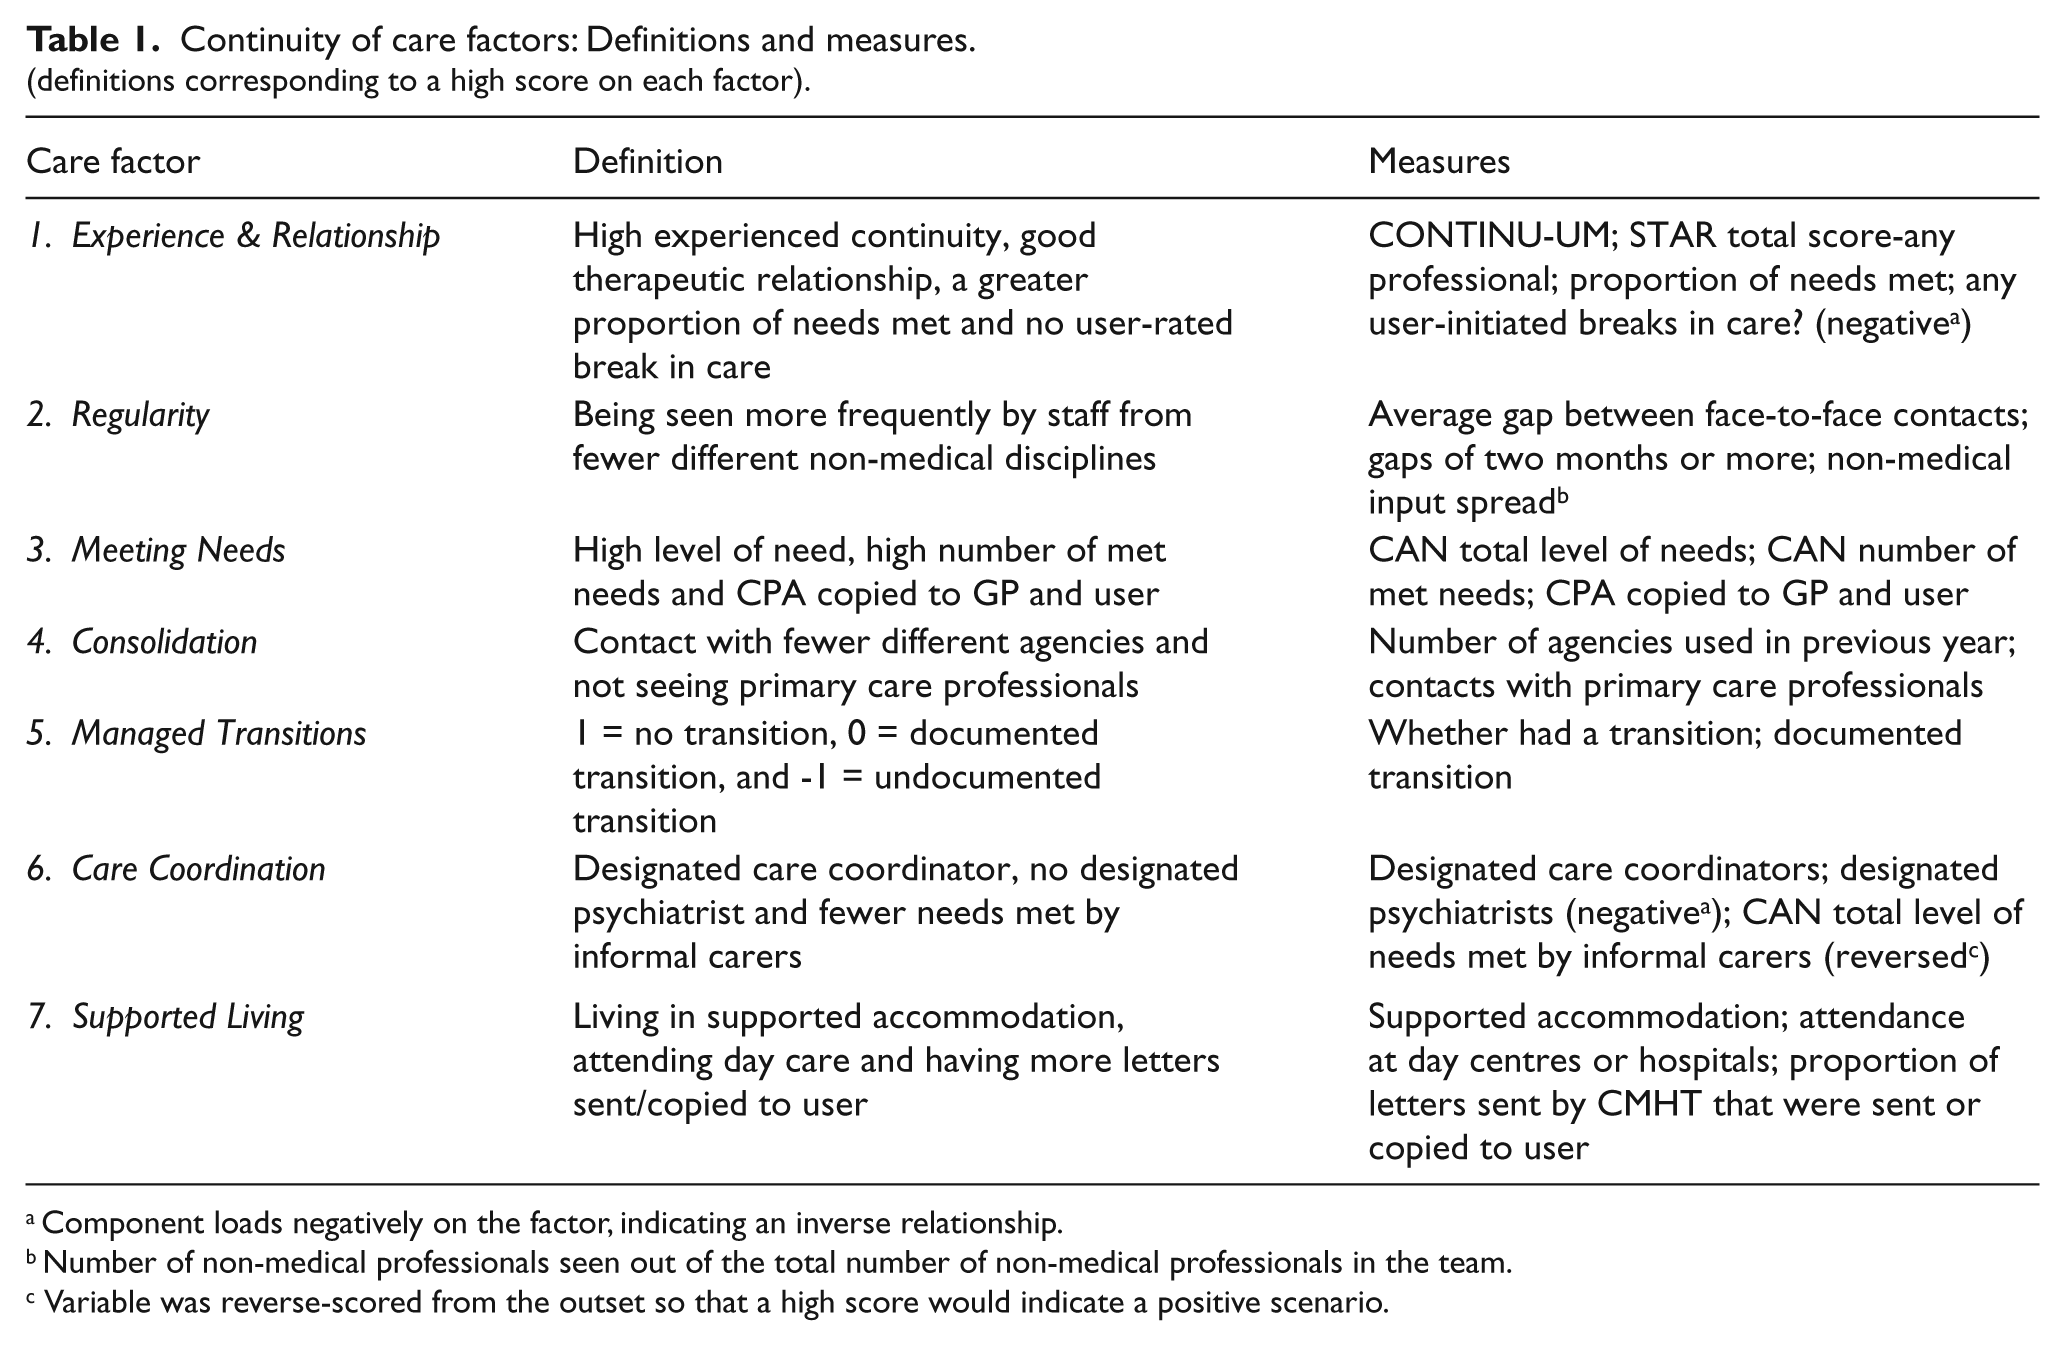
Component loads negatively on the factor, indicating an inverse relationship.
Number of non-medical professionals seen out of the total number of non-medical professionals in the team.
Variable was reverse-scored from the outset so that a high score would indicate a positive scenario.
We conducted three analyses, identical to those conducted for the psychotic group (Catty et al., 2011) except that the present cohort was followed up only once rather than twice, providing data at two time-points rather than three. The first two analyses examined clinical and social variables associated with the continuity of care factors: Analysis 1 assessed associations between the variables as explanatory variables and the continuity factor scores as contemporaneous data points, while Analysis 2 assessed associations between levels of the continuity factors at T2 and change in clinical and social functioning in the previous year (T1–T2). Analysis 3 explored the impact of continuity of care on clinical and social outcomes by assessing the association between the continuity factors at T1 and change in clinical and social variables over the subsequent year (T1–T2). Thus in the first analysis, the seven continuity factors were used as the outcome (dependent) variables, while in the second and third analyses they were used as possible explanatory (independent) variables. Each of these analyses was multi-level, using data from multiple time-points.
Analysis 1: Contemporaneous associations with continuity of care factors. The following variables were tested against each continuity factor as the dependent variable: time-point, socio-demographic variables, dual diagnosis, duration of contact with psychiatric services, hospitalized in previous year, ethnicity, presence of informal carer, team and clinical and social functioning variables (as above). A multi-level model provided the framework for this phase of analysis. PROC MIXED from SAS version 9.1 statistical software (SAS Institute Inc., 1989) was used when the dependent variable was continuous, incorporating a random effect for service user. (For full analytic details for each analysis, see companion paper.)
For Managed Transitions (Factor 5), the smaller sample size of the non-psychotic sample and their having one fewer data collection point necessitated a different analysis. This was carried out using two separate logistic regressions including a random effect with PROC GLIMMIX, ‘no transition’ being the reference category in each model.
Analysis 2: Associations between continuity factors and change in previous year. As change variables were being used, the two measurements per user were not correlated, so a simple linear regression was used when testing the continuous continuity factors and a one-way analysis of variance (ANOVA) when testing the categorical continuity factors. When hospitalization in the previous year was the dependent variable, PROC GLIMMIX was used to incorporate a random user effect. Data from both time-points were used in this analysis, as the dependent variable related to information over the previous year.
Analysis 3: The impact of continuity of care on clinical and social outcomes. To determine the impact of continuity of care, each continuity factor at T1 was tested for association with change in the clinical and social variables between T1 and T2. When hospitalization in the previous year was the dependent variable, the level of continuity at T1 was tested for association with whether the service user had been hospitalized between T1 and T2.
Comparison of continuity of care between cohorts
Mean scores on each continuity factor for the two groups were compared, using independent samples t tests for continuous variables and χ2 tests for categorical variables. Differences in the operation of the continuity factors between the two groups are explored discursively.
Results
Sample
Initially, 203 service users were identified as eligible for the study. Of these, 59 did not meet the inclusion criteria, 29 declined and 17 were not contactable or had not agreed to participate by the end of the recruitment period, leaving 98 people (48%) interviewed at T1 (63 from Trust 1 and 35 from Trust 2). At T2, 85 users (86.7%) were interviewed, with four being uncontactable and nine declining (Figure 1).

Flow of participants.
Baseline characteristics, drop-out and discharge
Baseline characteristics are shown in Table 2. Those who dropped out (did not complete T2) reported significantly better quality of life at T1 than those who were interviewed at T2 (SEIQoL M: 73.6 (SD = 14.7) vs 59.2 (SD = 20.1), t = −2.38, p = .020). They also had significantly higher Care Coordination scores (1.25 (SD = 0.97) vs 0.28 (SD = 1.47), t = −2.30, p = .024). There were no other significant differences between the two groups.
By the end of the study, 25 service users (25.5%) had been discharged from secondary care. They were included in the follow-up and analyses. There were few statistically significant differences between the groups in terms of T1 characteristics. The discharged group were, however, more likely not to have been educated beyond 16 (20 (83.3%) vs 31 (43.1%), χ2 = 11.73, p = .001) and there was a greater proportion of white people in the discharged group than in the group remaining on the caseload (24 (96.0%) vs 58 (79.5%), χ2 = 3.73, p = .053). There were no differences in factor scores.
Baseline characteristics.

t test statistic.
χ 2 test statistic.
Not significant when Bonferroni corrections were applied (significance level of .004).
41 of those in the psychotic group living in supervised accommodation were living with others.
7 people in the non-psychotic group living in supervised accommodation were living with others.
Includes full-time work, part-time work, sheltered work and self-employment.
Includes users seeking work, unable to work, students, retired and other.
Bonferroni corrections yielded a significance level of .007.
Characteristics of the two cohorts compared
Users with non-psychotic disorders differed significantly on a number of demographic and clinical characteristics from those with psychotic disorders, being more likely to be female, white and to have experienced fewer lifetime admissions. They reported slightly lower empowerment and quality of life, and had significantly more needs with a smaller proportion being met (Table 2).
Analysis 1: Contemporaneous associations with continuity of care factors. Users who scored highly on Experience & Relationship were more likely to be in Trust 1, and in two particular Trust 1 teams, to be older and to report a better quality of life (MANSA). Experience & Relationship was also low for users who had been discharged from their original teams (Table 3). Regularity was associated univariately with anxiety (B = 0.11, 95% CI: 0.04, 0.18), depression (0.08, 0.02, 0.15), lower functioning (-0.04, -0.08, -0.01), lower quality of life (MANSA: -0.42, -0.80, -0.03; SEIQoL: -0.02, -0.03, -0.00) and lower empowerment (-0.03, -0.07, 0.00)). In the multifactorial analysis, none of the variables remained in the model. Users scoring highly on Meeting Needs were more likely to have had more lifetime admissions, not use drugs and have poorer functioning (Table 4).
Associations with Factor 1 – Experience & Relationship.

p < .05.
Associations with Factor 3 – Meeting Needs.

p < .05.
Users scoring highly on Consolidation were more likely to be living in supported accommodation and using alcohol (Table 5). Managed Transitions was related univariately to functioning, anxiety and depression, accommodation and time-point. Having had an undocumented transition as opposed to no transition was associated with worse functioning (OR = 0.94, 95% CI: 0.91, 0.96), anxiety (OR = 1.1, 95% CI: 1.0, 1.2) and depression (OR = 1.1, 95% CI: 1.0, 1.2) but none of these variables remained in the adjusted model. Having had a documented transition as opposed to none was associated with worse functioning (OR = 0.96, 95% CI: 0.91, 1.0) and living in supported accommodation (OR = 0.19, 95% CI: 0.05, 0.77) and was also more likely at T2 (OR = 2.7, 95% CI: 1.2, 6.2), with only supported accommodation and time-point remaining in the adjusted model. Users who scored highly on Care Coordination were likely to have better functioning (Table 6). Supported Living was associated univariately with being unemployed, under the care of Team 2c and time-point. In the multifactorial analysis, only time-point remained in the model, with users more likely to score highly on this factor at T1 (Table 6).
Associations with Factor 4 – Consolidation.

p < .05.
Associations with Factor 6 – Care Coordination and Factor 7 – Supported Living.

p < .05.
M = −0.00222.
Upper 95%CI: −0.00229.
Analysis 2: Associations between continuity factors and change in previous year. Higher Experience & Relationship was associated with having had a decrease in depression during the previous year (B = −0.47; 95% CI: −0.85, −0.09). Higher scores on Regularity and Meeting Needs, however, were associated with having had an increase in depression during the previous year (Regularity: B = 0.50; 95% CI: 0.07, 0.93; Meeting Needs: B = 0.69; 95% CI: 0.21, 1.2). Users with undocumented transitions tended to have had an increase in depression during the previous year compared to users with no transition, approaching statistical significance (mean difference = 2.4, 95% CI: −0.03, 4.8).
Higher Experience & Relationship was also associated with an increase in mean empowerment (B = 0.78, 95% CI: 0.002, 1.6) during the previous year. Higher Meeting Needs was associated with a decrease in reported quality of life (MANSA: B = −0.08; 95% CI: −0.16, −0.01) during the previous year. Users with no transition during the previous year had a higher difference in quality of life than users with undocumented transitions (SEIQoL: mean difference = 13.6; 95% CI: 0.83, 26.3).
When using hospitalization as the outcome, users scoring one point higher on Regularity were 21.1% more likely to have been hospitalized in the previous year (OR = 1.21, 95% CI: 0.984, 1.488). Users scoring one point higher on Meeting Needs were 28.0% more likely to have been hospitalized in the previous year (OR = 1.281, 95% CI: 1.028, 1.596). When both factors were entered into the model together, Regularity ceased to be significant.
Analysis 3: Impact of continuity of care factors on clinical and social outcomes. No significant associations between the continuity factors and change in social and clinical outcomes or hospitalization were found.
Table 7 shows a summary of each factor and the components associated with it in the multi-level analyses.
Summary of continuity factors and components associated with them.
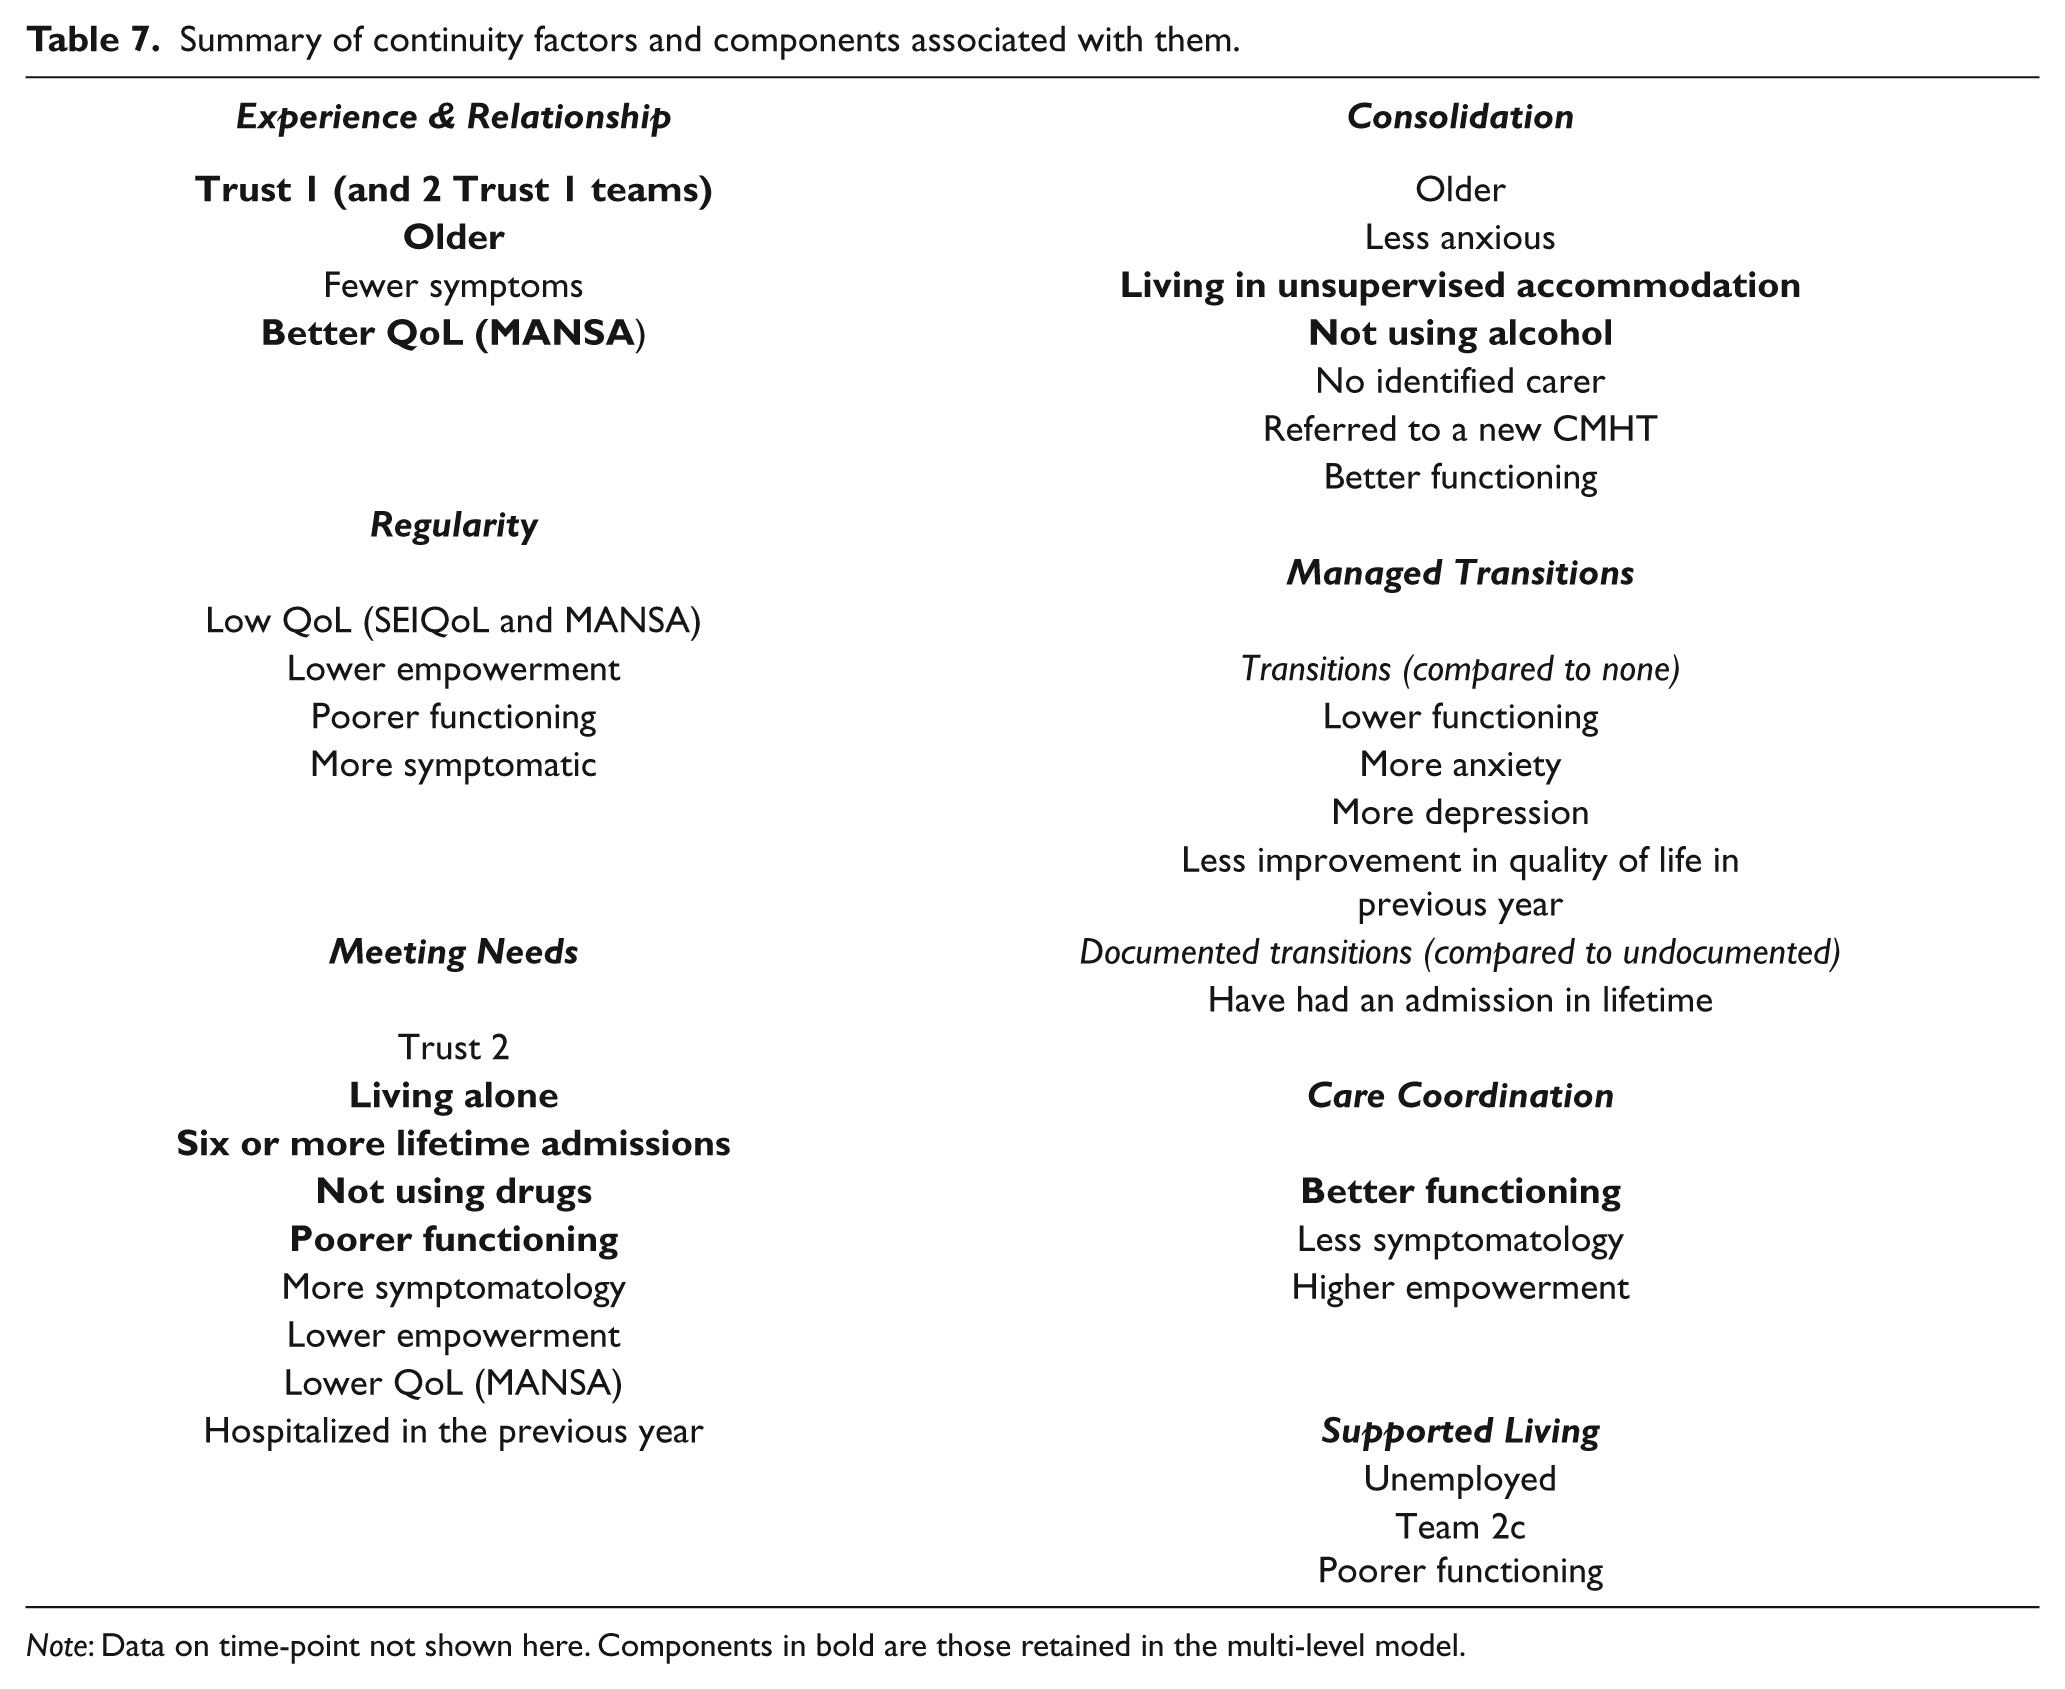
Note: Data on time-point not shown here. Components in bold are those retained in the multi-level model.
Comparison of continuity of care between cohorts
The non-psychotic group had lower mean Experience & Relationship scores (p < .001). They also had higher mean Care Coordination scores (p = .002). They had experienced proportionately fewer documented transitions (40.8% vs 69.0%) and more undocumented transitions (34.7% vs 21.3%) (p < .001). They had slightly higher Supported Living scores (p = .046), but this was non-significant when Bonferroni’s correction was applied.
In many respects, the continuity factors behaved in similar ways in the two groups. Experience & Relationship was higher for those in both cohorts who had fewer symptoms and better quality of life. Meeting Needs was higher for those who had poorer functioning, more symptoms and lower quality of life. Consolidation was higher for those who had better functioning. Having a transition was associated with lower functioning. Care Coordination was higher for those who had better functioning, fewer symptoms and higher self-reported empowerment. Regularity was higher for people with non-psychotic disorders if they had poorer functioning and were more symptomatic, while for those with psychotic disorders it was high if they had depot injections. For Supported Living, those with non-psychotic disorders had higher scores if they were unemployed, while those with psychotic disorders had higher scores if they had left school by 16.
Discussion
This study assessed the experiences of a cohort of service users with non-psychotic disorders in CMHT care, as well as comparing them to a cohort with psychotic disorders. Despite the clinical heterogeneity of this rarely studied group, several key findings emerged. Our study suggests that their experiences of continuity of care differ in key respects from those with psychotic disorders: in particular, they rate their experience of continuity and their relationships with professionals less highly.
Limitations
The study was originally designed around the cohort with psychotic disorders. Study design and the selection of measures were, however, based on the service users being people with chronic disorders served by CMHTs, rather than being designed for people with psychotic disorders specifically. The methodology was therefore assumed to be appropriate, but the applicability of the continuity factor structure to the non-psychotic cohort was separately assessed (Burns et al., 2007).
We did not analyse sub-groups of diagnoses due to the high degree of overlap between categories owing to this group receiving multiple co-occurring diagnoses.
Differences in characteristics between cohorts
There were clear demographic differences between the two groups. Although in some respects the group with non-psychotic disorders had better community tenure, being more likely to be living alone and independently, and they were also more likely to have identified carers, they reported lower quality of life. They had also experienced far more transitions, such as hospital admission and discharge, referral to another service or discharge to general practice (only 41% had had no transition compared to 69% of the psychotic group).
Continuity of care and non-psychotic disorders
As well as experiencing more transitions overall, users with non-psychotic disorders had proportionately more undocumented transitions, associated (for both groups) with greater symptomatology and (for this group alone) with being more depressed and anxious, having had fewer admissions in the past and feeling less empowered. Conversely, they had proportionately fewer documented transitions, consistent with their not being as often hospitalized as the group with psychotic disorders.
Service users with non-psychotic disorders also had lower Experience & Relationship scores and higher Care Coordination scores. That their mean Regularity and Consolidation scores were not significantly different, however, suggests that there were no differences in within-team practices (such as frequency of contact, use of different agencies), while the lack of difference in Meeting Needs scores suggests that they were not a less needy group and that services were no better or worse at meeting these needs. That users from the non-psychotic group with higher Regularity scores had become more depressed and were more likely to have been hospitalized during the previous year suggests that services were responding to users’ deterioration, as had been found for the psychotic group (Catty et al., 2011).
Lower perceived quality of life – perhaps a proxy for mood – and greater depression may at least partially account for the lower overall Experience & Relationship score of the non-psychotic group, as they were more likely to be depressed than the cohort with psychotic disorders (reported anecdotally) and they also reported lower quality of life.
Robustness of the continuity model
Our analyses suggest that the seven-factor model derived from the group with psychotic disorders was meaningful in practice with the non-psychotic group. Confirmatory factor analytic procedures reported elsewhere (Burns et al., 2007) suggested that a lack of fit for this model was largely caused by the presence of components linked to multiple factors, as well as by the smaller size of this sample, although clearly this would merit further exploration. Using the seven-factor model to analyse data from this non-psychotic cohort provided much evidence of the data working in consistent or similar ways in the two cohorts. For both groups, Experience & Relationship related to the user’s experience of their illness and their reported quality of life, while Meeting Needs related to functioning and symptomatology and Consolidation to age, functioning, symptoms and quality of life. For both cohorts, having more transitions was associated with poorer functioning. For both, Care Coordination was associated with functioning, symptomatology and empowerment, while Supported Living was associated with functioning.
There were no significant associations between the continuity factors and subsequent change in clinical or social outcomes for the non-psychotic cohort. This contrasts with the cohort with psychotic disorders, for whom there was evidence of the impact of continuity on such outcomes. Whether this was due to the smaller sample size of the non-psychotic cohort or to other reasons is as yet unclear and would merit further research.
Future research
There was no evidence of CMHTs modifying their practices for this group of service users. They were seen as often and had the same level of met need. Conversely, however, there was no evidence about how this group’s higher rate of transitions in care was being managed by services. The patterns of care we found suggest that there should be as much research into this group as into the more extensively studied group with psychotic disorders. Moreover, the level of distress reported informally to researchers was substantially higher in this group. Non-psychotic service users appear to place as much of a clinical burden on teams as psychotic ones, suggesting that their relative exclusion from the research agenda should be urgently addressed.
Footnotes
Acknowledgements
This study was funded by a grant from the National Institute for Health Research Service Delivery and Organization Programme (SDO 88/2004). Additional thanks are due to Dr Frank Holloway for his facilitation of this study.