




Abstract
Background:
Medically unexplained symptoms are difficult to measure and in most cases the diagnosis is made either from independent data such as consultants’ opinions or medical outcomes, or by proxy measures such as numbers of symptoms or consultations. A valid self-rated measure would be of value in assessing this highly prevalent condition.
Aims:
To describe a new scale of nine items, the Schedule for Evaluation of Persistent Symptoms (SEPS), its properties, its internal consistency, its distribution in a sample of 470 medical patients, its relationship to social functioning and health anxiety (hypochondriasis), and its construct validity by comparing its results with an independent diagnostic examination of each patient’s notes two years subsequent to assessment.
Method:
A prevalence study was carried out in 405 consenting medical patients in primary care, cardiology, respiratory medicine, gastroenterology and endocrine clinics, in which the SEPS scale, the Health Anxiety Inventory (HAI) and the Social Functioning Questionnaire (SFQ) were each completed.
Results:
The mean score on the SEPS scale in 470 patients was 13.4. Exploratory factor analysis revealed two main factors, one concerned focus on symptoms and the other on their attribution. Examination of all data showed a cut-off point of 14 as indicating the presence of pathological medically unexplained symptoms (MUS). Agreement between the consultants’ diagnosis and pathological MUS scores was fairly good with a score of 14 or more on the SEPS showing sensitivity of 0.65 and negative predictive accuracy of 0.90.
Conclusion:
It is concluded that the SEPS scale has potential value in screening patients with suspected medically unexplained symptoms.
Introduction
Medically unexplained symptoms are one of the major puzzles of mental health. They are remarkably common, with figures suggesting a prevalence of around 8% in primary care (Jackson & Kroenke, 2008) and 40–65% in secondary care (Fink, Steen Hansen, & Søndergaard, 2005; Nimnuan, Hotopf, & Wessely, 2001; Reid, Wessely, Crayford, & Hotopf, 2002). They also tend to persist and incur great costs to health services (Reid, Crayford, Patel, Wessely, & Hotopf, 2003). In spite of these high levels of prevalence they are very difficult to measure and classify. Because they are classified mainly by negative features – the absence of explanatory physical pathology – these symptoms have generally been measured by a proxy measure: independent examination of medical notes. The judgement is that those indicating no physical pathology suggest the presence of medically unexplained symptoms by default. They also overlap considerably with common mental disorders such as depression and anxiety (Escobar et al., 2010) and also with health anxiety (hypochondriasis) and related disorders.
In the course of research in this subject we felt it would be desirable to develop an instrument to assess this pathology as the existing instruments such as the Patient Health Questionnaire (PHQ) (Interian, Allen, Gara, Escobar, & Díaz-Martínez, 2006), the Whitely Index (Pilowsky, 1971; Pilowsky & Spence, 1994) and the Illness Attitude Scale (IAS) (Kellner, 1986) have many limitations in addressing this broad diagnostic concept. Most of these scales are aimed at identifying somatoform disorders rather than medically unexplained symptoms specifically, or have relatively poor specificity and sensitivity (de Vroege, Hoedeman, Nuyen, Sijtsma, & van der Feltz-Cornelis, 2012). Most attempts to measure medically unexplained symptoms have to involve a separate, usually retrospective, assessment to exclude medically explained conditions (Reid et al., 2003; Sumathipala et al., 2008) and these have to cover a fairly long time course to ensure that the prodrome of a medical condition has not been detected initially. Unfortunately, recall of medically unexplained symptoms by patients is generally poor (Leiknes, Finset, Moum, & Sandanger, 2006) and so is not reliable.
Method
While assessing patients for the prevalence of health anxiety in genito-urinary medicine clinics (Seivewright et al., 2004), it was realized that many patients had significant somatic symptoms that were not part of health anxiety and yet had many of the same characteristics, only differing in their attribution. A short scale, the Schedule for Evaluating Persistent Symptoms (SEPS), was developed and refined in practice until a final version of nine items was created (Appendix 1). It was then tested in four separate clinics in secondary (hospital) care and a small general practice population in a prevalence study of health anxiety and associated symptoms.
Among the aims of the study were to examine the influence of age on the prevalence of medically unexplained symptoms in medical outpatients, to test the construct validity of the SEPS scale by comparing its findings with an independent assessment of diagnosis at least two years after the administration of the SEPS, and to examine its internal consistency and factor structure. We also wanted to study its relationship to other measures of anxiety, depression and social function, using three questionnaires: the Hospital Anxiety and Depression Scale (HADS) (Zigmond & Snaith, 1983), the Health Anxiety Inventory (HAI) (Salkovskis, Rimes, Warwick & Clark, 2002) and Social Functioning Questionnaire (SFQ) (Tyrer et al., 2005).
Population and procedure
The patients invited to take part in the study were all attending four types of clinic at Kings Mill Hospital, North Nottinghamshire, UK: cardiology, respiratory medicine, gastroenterology and endocrinology clinics. An additional subset of patients seen in primary care in the area was also included. The patients were not intended to be consecutive ones and research assistants attended on days when available and assessed all patients. Exclusion criteria were patients aged under 18 or over 65 and those currently attending psychiatric services. The patients were given an information sheet and after an explanation of the study signed a consent form if they agreed to take part. Ethical approval was given by the Derbyshire Research Ethics Committee (06/Q2401/130). Those who agreed were given a brief explanation of the nature of the questionnaires and then completed the HAI, the SEPS,the HADS and the SFQ.
Details were taken of all those who had completed the questionnaires and between 18 and 30 months later the consultant or another independent doctor who had no knowledge of the questionnaire scores completed a form after full examination of the patients’ notes. The only way in which the validity of an assessment of medically unexplained symptoms can be made at present is by independent medical assessment of the patients’ problems. This was done in the study by asking the doctor to make a three-point assessment (3 = definitely medically unexplained; 2 = possibly medically unexplained; 1 = definitely organic), for each of the patients assessed in the study. This followed the principles of Reid et al. (2002) who suggested that a symptom should be designated as ‘definitely medically unexplained’ if there was evidence of a thorough investigation of the symptoms, all of which were negative, and either psychosocial reasonswere suggested for the presentation or a diagnosis was madethat implied a medically unexplained syndrome (fibromyalgia,irritable bowel syndrome, etc.).
Statistical analysis
All analyses were conducted using Stata 9.2 by PB (the fifth author). Comparison between scores in clinics was made using analysis of variance, correlations between scores using Pearson product-moment correlation coefficients, Cronbach’s α to measure the internal consistency of the scale, and standard receiver operating characteristics (ROC) curves for assessment of construct validity.
Scoring
The SEPS is scored in two sections: a general section of three questions (SEPS-1), in which the number of main symptoms noted by the patient are summed and the nature, frequency and interpretation of the main symptom scored on a four-point Likert scale (range 0–9); and (2) a specific section of six questions, also scored on a similar four-point scale (SEPS-2) (range 0–18), which addresses the importance and implications of the main symptom. The total SEPS score is the sum of SEPS-1 and SEPS-2, giving a score range of 0–27.
Results
Feasibility and acceptability
Of 473 patients approached, 68 (14.3%) refused or were unable to complete the questionnaires. The total time needed to complete all the assessments was about 35 minutes and as the patients were waiting for their outpatient appointments when approached, this non-completion rate was expected. No difficulties were experienced in completing the SEPS scale, which normally took only five minutes to complete, and there were no complaints or confusion expressed about any of the scale questions.
Variation in SEPS scores by age
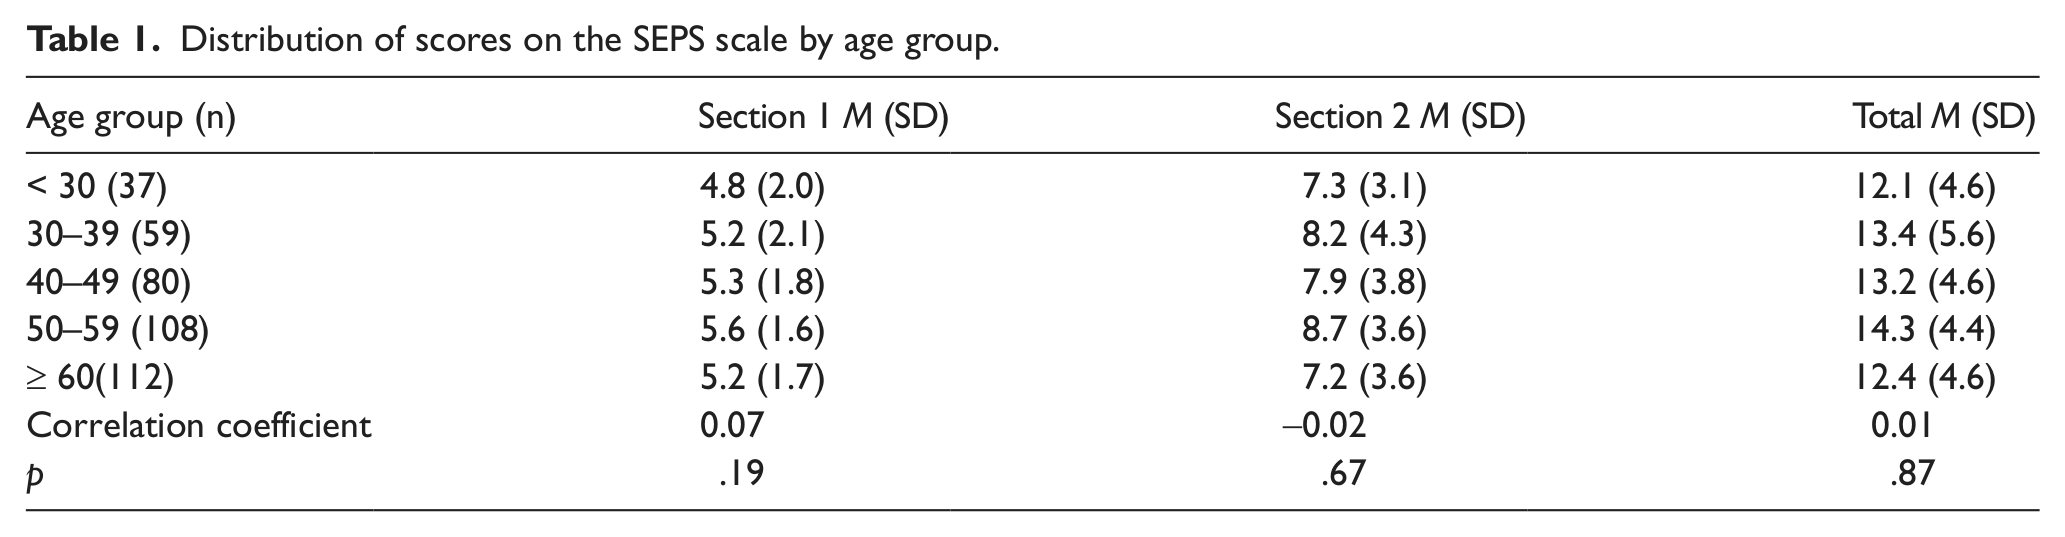
Older people have more physical morbidity than younger people, and are more likely to have persistent symptoms.When symptoms are likely to be of non-organic origin, age is likely to be less important. The first set of analyses examined how the SEPS values varied in different age groups separated in 10 year groups. Pearson product-moment correlations were also used to examine the association between age and the two sections of the SEPS scale. The analysis results suggested that there was no evidence of a significant association between age and the overall SEPS total score, or between age and each of the two components of the score (Table 1).
Distribution of scores on the SEPS scale by age group.
Internal consistency
Cronbach’s α was used to examine the internal consistency of the nine constituent questions of the SEPS score. This gave a value of 0.64, which represents a reasonable degree of consistency, suggesting that the items in the scale are contributing to a common latent construct.
Distribution of scores by clinic
The SEPS scores varied between the five clinics that took part in the study. Scores were highest in respiratory medicine clinics and least in general practice (p = .02) (Table 2).
Distribution of scores on the SEPS scale by clinic group.
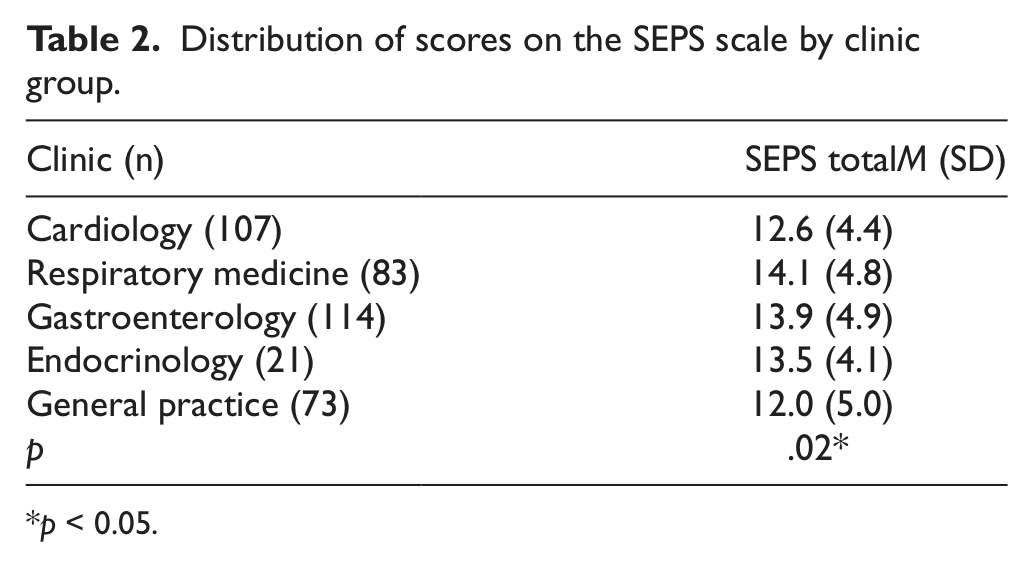
p < 0.05.
Construct validity: Score on SEPS indicative of pathological symptoms
The validity of the SEPS in identifying symptoms that were not organic can only be determined by an external yardstick of known validity. By independent examination of the notes of patients, preferably some time after administration of any questionnaire, the ‘best fit’ evidence for an organic syndrome can be determined. This dichotomous assessment was carried out by scoring the patients with ‘definite unexplained medical symptoms’ as a ‘true’ diagnosis of medically unexplained symptoms and those in the other two groups as ‘not medically unexplained’.
A ROC curve analysis was used to examine the effectiveness of the SEPS score in correctly assigning diagnosis. This analysis gave an area under the ROC curve (AUC) of 0.63, with corresponding 95% confidence interval of 0.55–0.72 (Figure 1). As this interval did not cross the 0.50 line at any point, a statistically significant, but not highly impressive, conclusion was that the SEPS score was a valid representation of the two-year outcome. The alternative dichotomous split of regarding ‘definite’ and ‘possibly’ medically unexplained symptoms as a ‘true’ diagnosis of medically unexplained symptoms was not quite as discriminating, with an area under the ROC curve of 0.57.

Receiver operating characteristics (ROC) analysis curve showing the relationship between SEPS score and independent diagnostic assessment of medically unexplained symptoms (definitely unexplained vs all others).
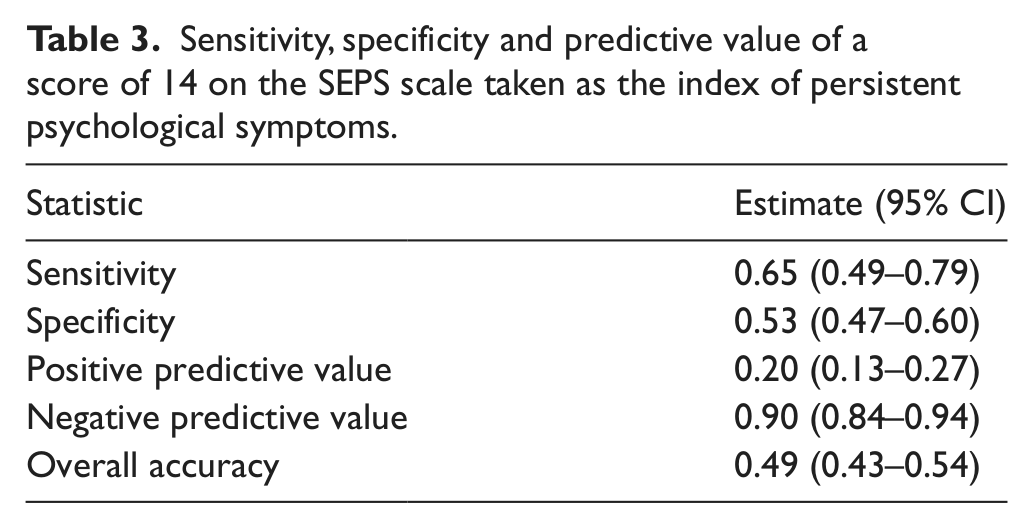
The ROC curve was also used to choose the optimum cut-off on the score to maximize the sensitivity and specificity of medically unexplained symptoms. This suggested that a score of 14 and above indicated that pathological medically unexplained symptoms were present. The performance of this cut-off in predicting medically unexplained symptoms is summarized in Table 2. The results suggested a sensitivity of 0.65, indicating that 65% of all those with medically unexplained symptoms were identified using the SEPS scale. The scale was better at predicting those who did not have medically unexplained symptoms rather than those who had, with a positive predictive value of 0.2 and a negative predictive value of 0.90 (Table 3).
Sensitivity, specificity and predictive value of a score of 14 on the SEPS scale taken as the index of persistent psychological symptoms.
Much of the empirical evidence suggests that health anxiety comprises part of, but certainly not all, of the spectrum of medically unexplained symptoms. People with health anxiety have a fear of having, or developing, an organic disease but many of those with medically unexplained symptoms complain of symptoms alone and have no specific concerns about disease. This was confirmed by the results in which both generalized and health anxiety were positively correlated with SEPS scores, mainly in Section 2 of the scale (Table 4).
Correlations between the sections and total scores of the SEPS scale and Health Anxiety Inventory (HAI), Hospital Anxiety and Depression Scale (HADS), and Social Functioning Questionnaire (SFQ) scores.
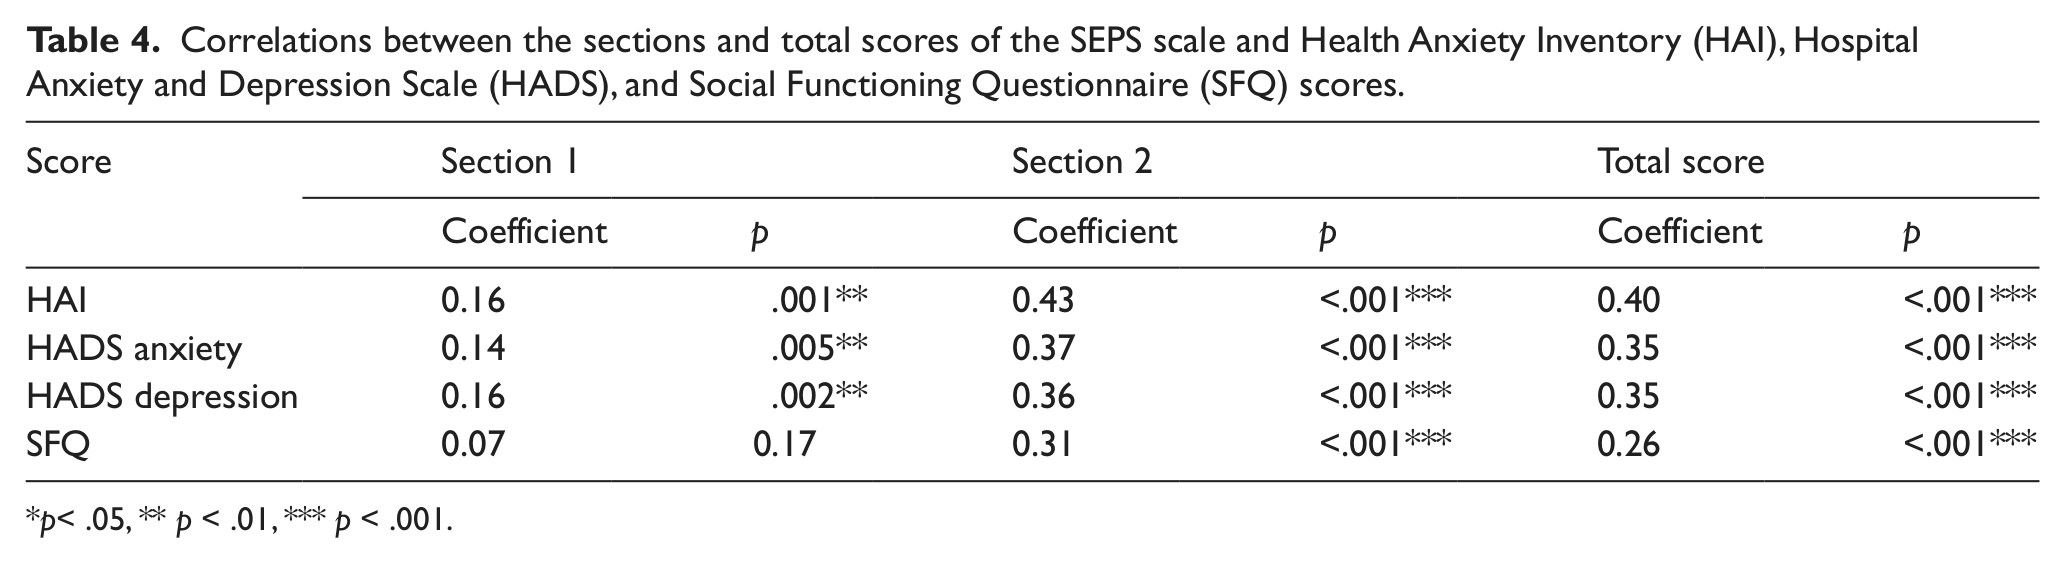
p< .05, ** p < .01, *** p < .001.
The results confirmed that the total SEPS score was significantly associated with the HAI score, both HADS measures and the SFQ score, the latter indicating that social dysfunction was associated with higher SEPS scores. The SEPS score was positively correlated with all measures, suggesting that a higher SEPS score was associated with a higher score on each of the other scales.
The two individual sections of the SEPS score were significantly associated with the majority of the other scores.
Exploratory factor analysis
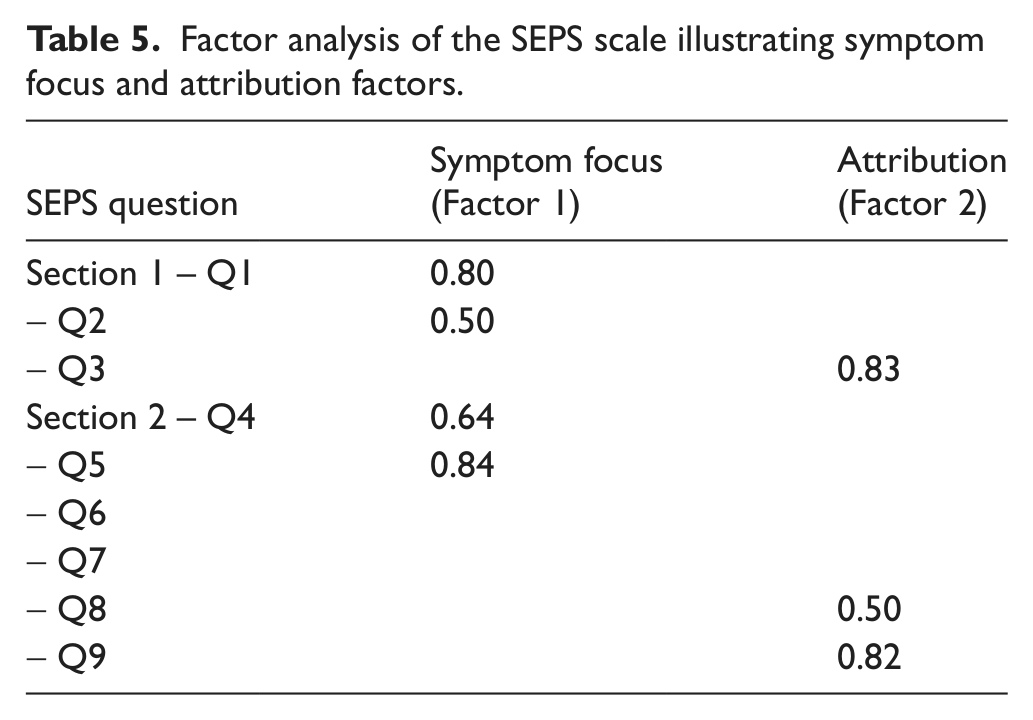
An exploratory factor analysis was carried out on the nine-item measure to determine if there were any trends in the data, and to pick out questions that might record similar information. This analysis following a scree plot suggested that two components explained nearly half of the variance. The first component explained 29% of the total variance, while the second component explained 18% of the total variance. Each of these is a relatively small amount, suggesting no great associations between component questions. Examination of the two components suggest that they relate to symptom focus (Factor 1) and attribution (Factor 2) (Table 5).
Factor analysis of the SEPS scale illustrating symptom focus and attribution factors.
Discussion and implications
To our knowledge, the SEPS scale is the first self-rated instrument to record medically unexplained symptoms and consequently its degree of success in achieving this goal is difficult to elucidate in the absence of a comparative measure. The nearest equivalent is the less than satisfactory record of symptom count, even though this appears to be a good predictor of psychopathology (Escobar et al., 2010). But symptom count can only be a rough indicator of the nature of the pathology; the advantage of a more specific measure is its clinical utility. A strong indication that a patient might have medically unexplained symptoms (before subsequent investigations have been needlessly undertaken)may help in reducing further tests and investigations and in focusing attention on psychological aspects of the complaints. It may also help in selecting those patients who might respond to treatment for these symptoms per se rather than other treatments for anxiety, depression and similar symptoms (Tyrer, Tyrer, & Lovett, 2011).
The factor structure suggests that the scale can be separated into two components, but these only account for 47% of the total variance. This is of some interest in separating the scale from others.For example, health anxiety, which shows some overlap with medically unexplained symptoms, has been found to have a somewhat different factor structure, with thought intrusion and fear of illness as the two main factors (Alberts, Sharpe, Kehler, & Hadjistavropoulos, 2008). The focus on symptoms and their attribution as something requiring further investigation suggests that the second factor in the HAI score (fear of illness) may be relevant here (and explain some of the correlation with the HAI, particularly in Section 2 of the SEPS scale), but that the first is independent. The focus on symptoms in medically unexplained symptoms is not regarded as intrusive but necessary.
The value of the SEPS scale appears to be strongest as a screening instrument, and so would be particularly useful in epidemiological studies in which medically unexplained symptoms at present can only be roughly inferred (e.g. Clark, Goodwin, Stansfield, Hotopf, & White, 2011). The negative predictive value of 0.90 (assuming the independent medical diagnosis was a true measure) suggests that when a patient scores between 0 and 13 on the scale it is highly unlikely that they have medically unexplained symptoms (although a score of 12 or 13 might lead to some doubt. For those who score 14 or more, the index of suspicion that the pathology may not be organic becomes much greater, and may offer the opportunity to feed back results to patients and engage in a wider discussion over the nature of the symptoms. The evidence of somewhat better concordance between the SEPS score and the definitely unexplained symptom group compared with the combined definite and possibly unexplained groups, together with lowered specificity of 0.6, suggests that false positives are more likely than false negative results and that the scale is best used as a screen.
Footnotes
Appendix 1: SEPS Scale
Acknowledgements
This work was supported by the Nicola Pigott Memorial Fund. We thank the consultants at King’s Mill Hospital for their cooperation and help with ratings, and Professor Michael Sharpe for valuable feedback during the development of the SEPS scale.