
Abstract
Background:
Data from Turkey on prevalence of personality disorders (PD) in the normal population are sparse.
Aims:
The present study conducted in a community sample aimed to investigate personality disorders in terms of prevalence, associated risk factors and personality dimensions.
Methods:
A stratified sampling procedure allowed us to compose a sample consisting of 774 participants residing in Aydin, Turkey. The DSM-IV and ICD-10 Personality Questionnaire (DIP-Q) and the Temperament and Character Inventory (TCI) were used to assess PDs and personality dimensions, respectively.
Results:
Roughly 20% of the participants received a PD diagnosis. Among the individual PD categories, schizotypal and obsessive-compulsive PDs were the most prevalent diagnoses. Participants with PD were more likely to have higher self-directedness and cooperativeness scores. These risk factors and personality dimensions were most strongly associated with the cluster B disorders.
Conclusion:
New versions of the diagnostic systems should include schizotypal, obsessive-compulsive and cluster B PDs as separate diagnostic categories, and impaired self-directedness as well as cooperativeness as a general diagnostic criterion for the sake of backward and forward compatibility of the research in this field.
Introduction
Personality disorder (PD) is defined by the World Health Organization (WHO) as ‘a severe disturbance in the characterological condition and behavioral tendencies of the individual, usually involving several areas of the personality, and nearly always associated with considerable personal and social disruption’ (NIMH, 2003, p. 9). McGilloway, Hall, Lee & Bhui (2010) suggest that policy should highlight the need for clinicians to be more culturally aware, and that differences in race and ethnicity must be taken into account when diagnosing PDs.
The prevalence of PD among normal samples in various countries such as Australia, Norway, the USA, England and Mexico is reported to be between 4% and 13% (Benjet, Guilherme & Medina-Mora, 2008; Coid, Yang & Tyrer, 2006; Jackson & Burgess, 2000; Lenzenweger, Lane, Loranger & Kessler, 2007; Lewin, Slade, Andrews, Carr & Hornabrook, 2005; Samuels et al., 2002; Torgersen, Kringlen & Cramer, 2001). The literature contains studies with findings that indicate higher prevalence rates, for example 28% in Finland (Kantojärvi et al., 2004), 14.8% and 15.7% in the USA (Crawford et al., 2005; Grant et al., 2004), 18.6% in Australia (Moran, Coffey, Mann, Carlin & Patton, 2006) and 29% in the UK (Yang, Coid & Tyrer, 2010).
In normal population studies, the prevalence rates seem to be affected by the socio-demographic characteristics of the selected sample (age, education, sociocultural level, etc.), the country in which the study was conducted, and the assessment tools used (Lenzenweger, 2008; Paris, 2010). Converging findings of various studies suggest an association of PD with solitary living and lower educational level (Benjet et al., 2008; Coid et al., 2006; Ekselius, Tillfors, Furmark & Fredrikson, 2001; Grant et al., 2004; Jackson & Burgess, 2000; Samuels et al., 2002; Torgersen et al., 2001), and with younger age (Coid et al., 2006; Grant et al., 2004; Jackson & Burgess, 2000; Lewin et al., 2005; Yang et al., 2010).
Arguably, Cloninger’s psychobiological model is congruent with current epigenetic understanding of behaviour development and ethiopathogenesis of PD (Svrakic & Cloninger, 2010). Each of the three Diagnostic and Statistical Manual of Mental Disorders (DSM) (APA, 1994) PD clusters corresponds to one of the underlying temperament traits (e.g. cluster A reflects low reward dependence, cluster B reflects high novelty seeking, cluster C reflects high harm avoidance) (Svrakic et al., 2002). The proposals derived from this model are consistent with the DSM-5 draft defining the essential features of personality disorders as impairments in self (identity and/or self-directedness) and interpersonal (empathy and/or intimacy) functioning (Skodol, 2012; Svrakic & Cloninger, 2010).
Until now, no study addressing the prevalence of PD in a Turkish community sample has been published. In one of the two studies conducted on clinical samples, the rate of cluster B PDs was found to be 10.2% for borderline PD, 5.0% for histrionic PD, 3.8% for antisocial PD, and 1.0% for narcissistic PD (Senol, Dereboy & Yüksel, 1997). The second clinical study (Doğan, Önder & Doğan, 2004) reported a prevalence rate of 3.02% for antisocial PD. The present study aims to examine PDs in a sample drawn from a normal population in Turkey with respect to prevalence rates, associating temperament and character features, as well as social and demographic parameters. A lack of any measure in Turkish that can be used for screening PDs in accordance with the current diagnostic systems meant that we had to translate the DSM-IV and ICD-10 Personality Questionnaire (DIP-Q) for this study. The reason for choosing the DIP-Q among several measures was its ability to provide PD diagnoses with respect to the latest versions of DSM as well as ICD systems. Also, the DIP-Q diagnostic procedure ensures that the researchers take into account level of impairment in psychosocial functioning, which should be an indispensible part of personality assessment (Livesley & Lang, 2005).
Methods
Sample
Stratified sampling method was employed to draw a sample representing the urban population of Aydın, a city with a population of nearly 170,000 located at the Aegean region of Turkey. We felt that such a sample would represent the Turkish urban population to a great extent as Aydın is an average city in terms of population (ranking 38th among 62 cities with populations over 100,000), income (24th among 81 provinces) and human development (27th among 81 provinces). The desired sample size was determined as 864 with estimated prevalence of 10%, confidence interval of 95%, and d (absolute precision) of 0.02 (Lwanga & Lemeshow, 1991). Initially, we planned to visit 518 addresses at 22 districts in the city, with the expectation that we would find two persons aged between 18 and 60 at each address and 80% of these individuals would volunteer to participate. However, nearly one half of the visited addresses contained no one willing to participate and most of the remaining addresses contained only one volunteer. Therefore, we continued to systematically pick and visit new addresses at each district for as long as our finances permitted. In conclusion, a total of 1,435 addresses from 22 districts of the city were visited, 706 households (49.2%) refused to participate and 774 individuals from 729 households volunteered to participate; the size of our actual sample turned out to be 90% of that of the desired sample. A few months after initiation of the data-collection phase, we managed to secure research funds from the Scientific and Technological Research Council of Turkey (TUBITAK) to employ research assistants and to reimburse participants. Therefore, 246 individuals volunteering to participate initially received no reimbursement, whereas 528 individuals participating in the study at a later period were paid five Turkish liras for their contribution, and the Temperament and Character Inventory (TCI) was administered solely to the reimbursed participants. The entire sample consisted of 373 males (48.2%) and 401 females (51.8%), with a mean age of 33.4 (range = 18–75, SD = 12.5). Table 1 summarizes the socio-demographic characteristics of the participants.
Socio-demographic and descriptive characteristics of the sample and prevalence of DSM-IV personality disorder.
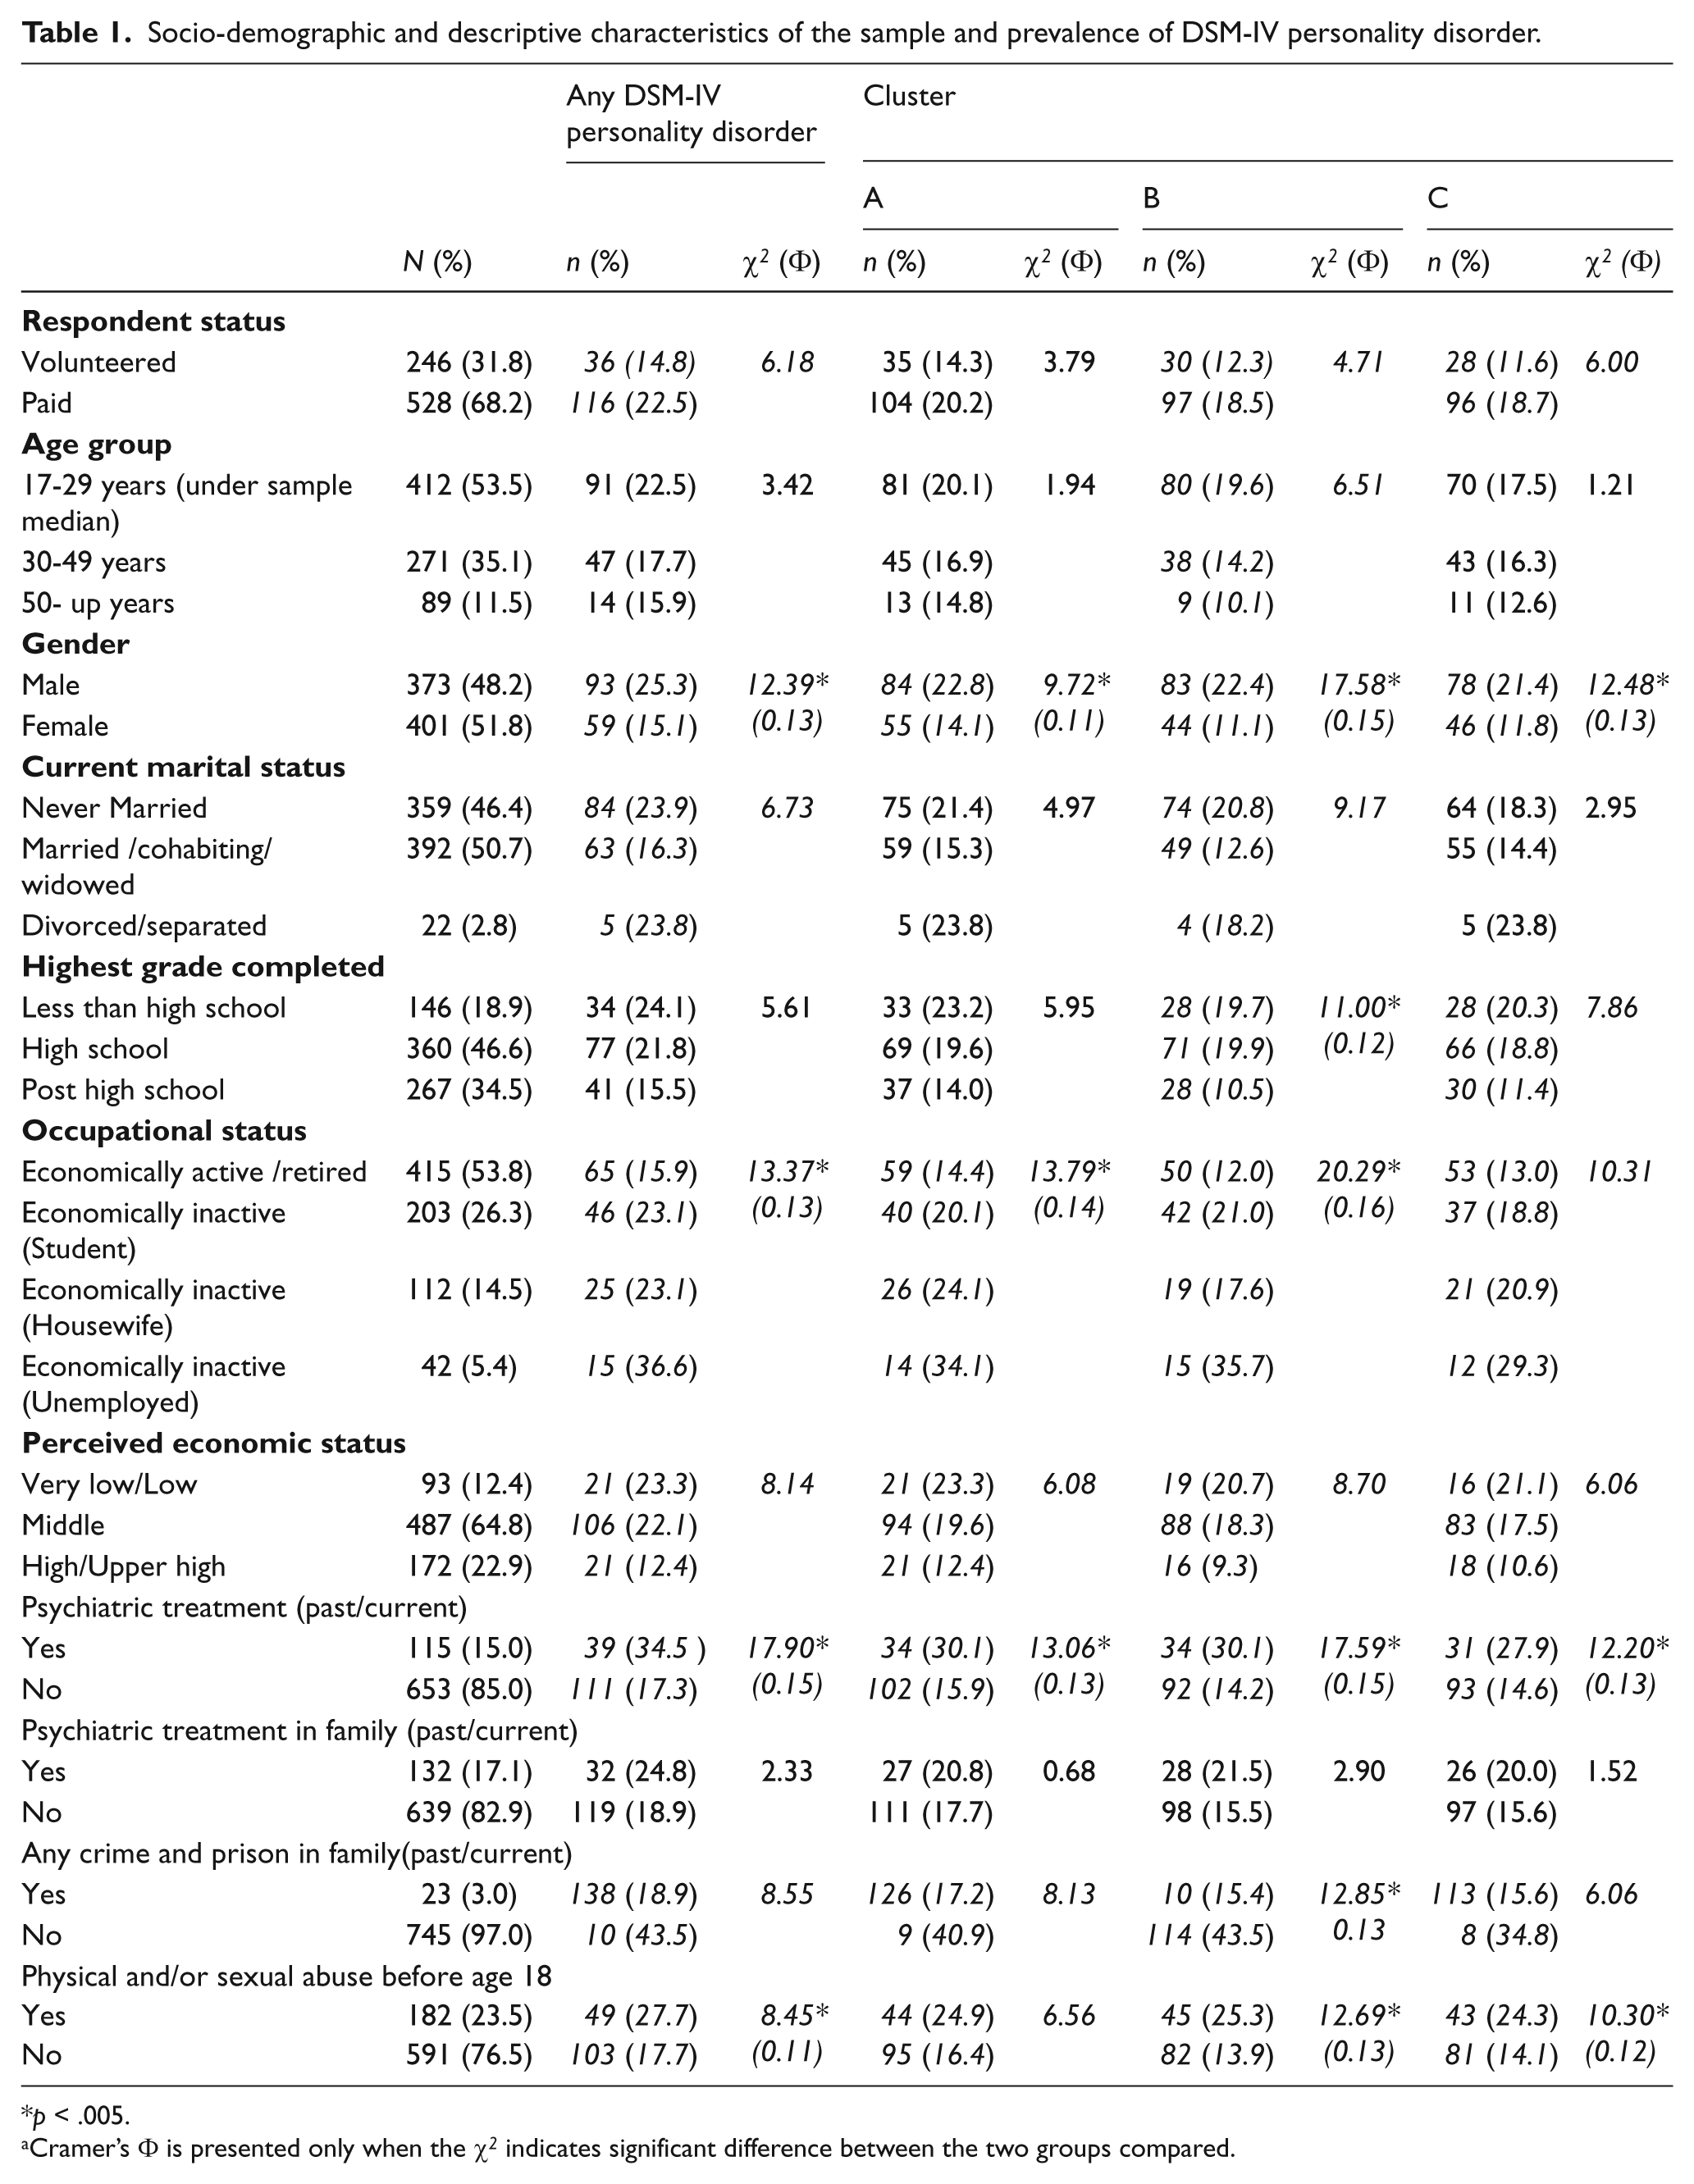
p < .005.
Cramer’s Φ is presented only when the χ2 indicates significant difference between the two groups compared.
Instruments
DSM-IV and ICD-10 Personality Questionnaire (DIP-Q). Originally developed in Sweden (Ottosson et al., 1995), the DIP-Q is a true/false self-report questionnaire designed to measure all DSM-IV and ICD-10 PDs. We employed a procedure similar to Brislin’s (1970) back-translation method to create a Turkish version of the tool from the Swedish (original) and English versions. The Cronbach’s a coefficient for internal consistency of the DIP-Q was found to be 0.90, which is the bare minimum if important decisions are to be made with respect to specific test scores (Nunnaly & Bernstein, 1994). The DIP-Q consists of 140 items, 135 of which keyed to the diagnostic criteria for specific PDs, and five of which to the general criteria for PDs. Accordingly, the DIP-Q yields criteria scores for each DSM-IV and ICD-10 PDs, as well as an Impairment and Distress (ID) scale score for the general PD criteria. Also, the self-report version of the Global Assessment of Functioning (GAF) scale based on the original 0–100 scale (APA, 1994; Bodlund, Kullgren, Ekselius, Lindström & von Knorring, 1994) is always administered along with the DIP-Q to gauge impairment in the level of functioning. A specific PD diagnosis requires that: (1) the criteria score for that PD reaches the threshold specified by the DSM-IV and ICD-10 manuals; and (2) the ID score and/or the GAF self-report scale score reaches the thresholds specified by the researchers. Over-diagnosis is a widespread problem with self-report screening instruments (Yang et al., 2010), and researchers are recommended to tackle this problem with the DIP-Q by applying reasonable cut-offs to ID scale scores and self-report GAF scale scores (Ottosson et al., 1998). When we tentatively applied a cut-off point of 2 to the ID scale scores, following the original Swedish study (Ekselius et al., 2001), the prevalence rate of PD was computed as 44.9%. This was mostly due to the endorsement of two particular items (nos 61 and 95) of the ID scale by approximately 30% of the participants. Likewise, the mean GAF score obtained in this study (79±19) was too close to the cut-off point of 70 determined for Sweden, and we felt that a reasonable cut-off should be at least one standard deviation away from the mean score. Therefore, we adjusted cut-off scores in such a way that a diagnosis of PD could be made either when the ID scale score is 3 or more, and/or the GAF scale score is 60 or less.
Temperament and Character Inventory (TCI). The TCI is a self-report instrument consisting of 240 true/false questions measuring four dimensions of temperament and three dimensions of character. Temperament dimensions are novelty seeking (NS), harm avoidance (HA), reward dependence (RD) and persistence (PS). The character dimensions are self-directedness (SD), cooperativeness (CO) and self-transcendence (ST) (Cloninger & Svrakic, 2009). The Turkish version of the TCI has been found to have adequate psychometric properties (Arkar et al., 2005; Köse et al., 2004).
Participant information form. Data pertaining to the participants’ age, gender, educational level, occupation, perceived economic and marital status, parents, physical/sexual abuse during childhood, physical disability, and existence of mental problem in the household were collected by means of a self-report form.
Procedure
We employed a group of graduate and undergraduate students to take the measurement tools to every house determined by the sampling method, explain the project to the household, and ask for their participation in the study by completing the questionnaires. When members of the household agreed to participate, they were given a few hours to fill in the questionnaires. The TCI was given only to the endorsed participants (n = 528).
Data analysis
The internal consistency of DIP-Q was determined by Cronbach a values. To investigate chance corrected level of agreement between DSM-IV and ICD-10 diagnoses, we computed kappa (κ) statistics with equal weights and employed Fleiss’s (1981) standards in interpreting κ coefficients (0.75 and above: good; 0.40–0.75: average; 0.40 and below: poor). Associations of certain variables considered to be potential risk factors with PD and PD clusters were explored by means of the χ2 test. Since this test was applied for 11 variables in total, Bonferroni adjustment was made to prevent inflated type I error, hence the a for each test was adjusted to be 0.05/11 = 0.005. Cramer’s phi (Φc) was employed as the effect size indicator with Cohen’s (1988) standards (≥ 0.1 small, ≥ 0.3 medium, ≥ 0.5 large effect size) for contingency tables with two cells in the smaller dimension. We used student’s t-test to compare groups with and without cluster A, B or C diagnoses in terms of the TCI scores. Since these comparisons were repeated for the entire sub-scales of the TCI, the a for each test was corrected as 0.05/25 = 0.002. Cohen’s d was calculated and interpreted (≥ 0.20 small, ≥ 0.50 medium, ≥ 0.80 large effect size) in order to determine the size of the difference between the groups where the t-test suggested a significant difference (Cohen, 1988). All analyses were performed with the Statistical Package for Social Sciences (SPSS) version 13.0.
Results
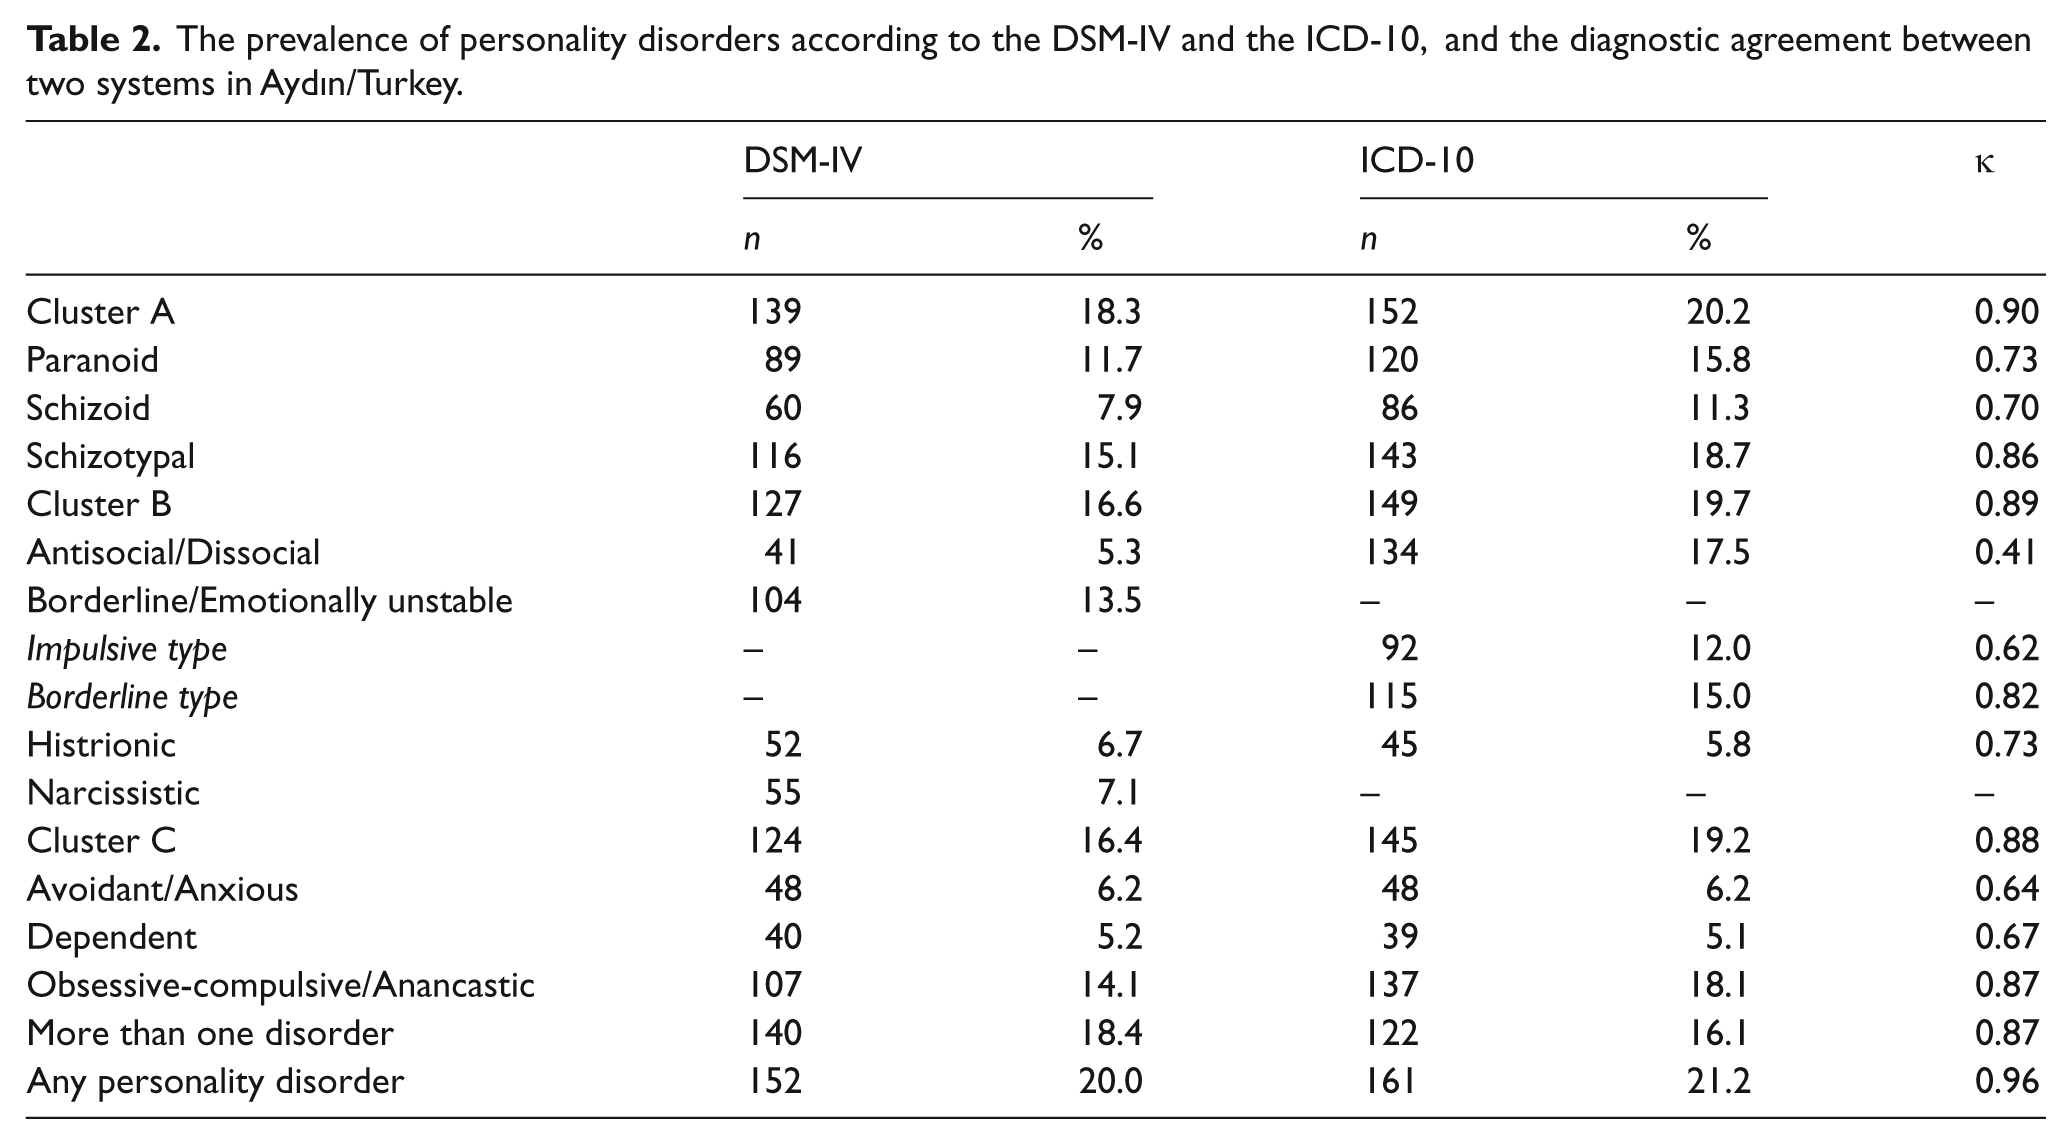
Table 2 displays the prevalence of PD diagnoses in accordance with the DSM-IV and ICD-10 criteria, and the κ statistics indicating level of agreement between the two diagnostic systems. Table 2 summarizes the findings pertaining to the impact of several socio-demographic and psychological variables on prevalence rates of the DSM-IV PDs. Tables 3 and 4 show the findings of the comparisons between the groups with and without PD diagnoses in terms of the TCI sub-scale scores.
The prevalence of personality disorders according to the DSM-IV and the ICD-10, and the diagnostic agreement between two systems in Aydın/Turkey.
Comparison of the participants with and without cluster diagnoses in terms of TCI temperament scores.

p < .002.
Cohen’s d is presented only when the t-test indicates significant difference between the two groups compared.
NS = novelty seeking, NS1 = exploratory excitability vs stoic rigidity, NS2 = impulsiveness vs reflection, NS3 = extravagance vs reserve, NS4 = disorderliness vs orderliness, HA = harm avoidance, HA1 = worry and pessimism vs uninhibited optimism, HA2 = fear of uncertainty vs boldness, HA3 = shyness with strangers vs outgoing, HA4 = fatigability and asthenia vs energetic, RD = reward dependence, RD1 = sentimentality vs aloof, RD3 = attachment vs detachment, RD4 = dependence vs independence, P = persistence.
Comparison of the participants with and without cluster diagnoses in terms of TCI character scores.
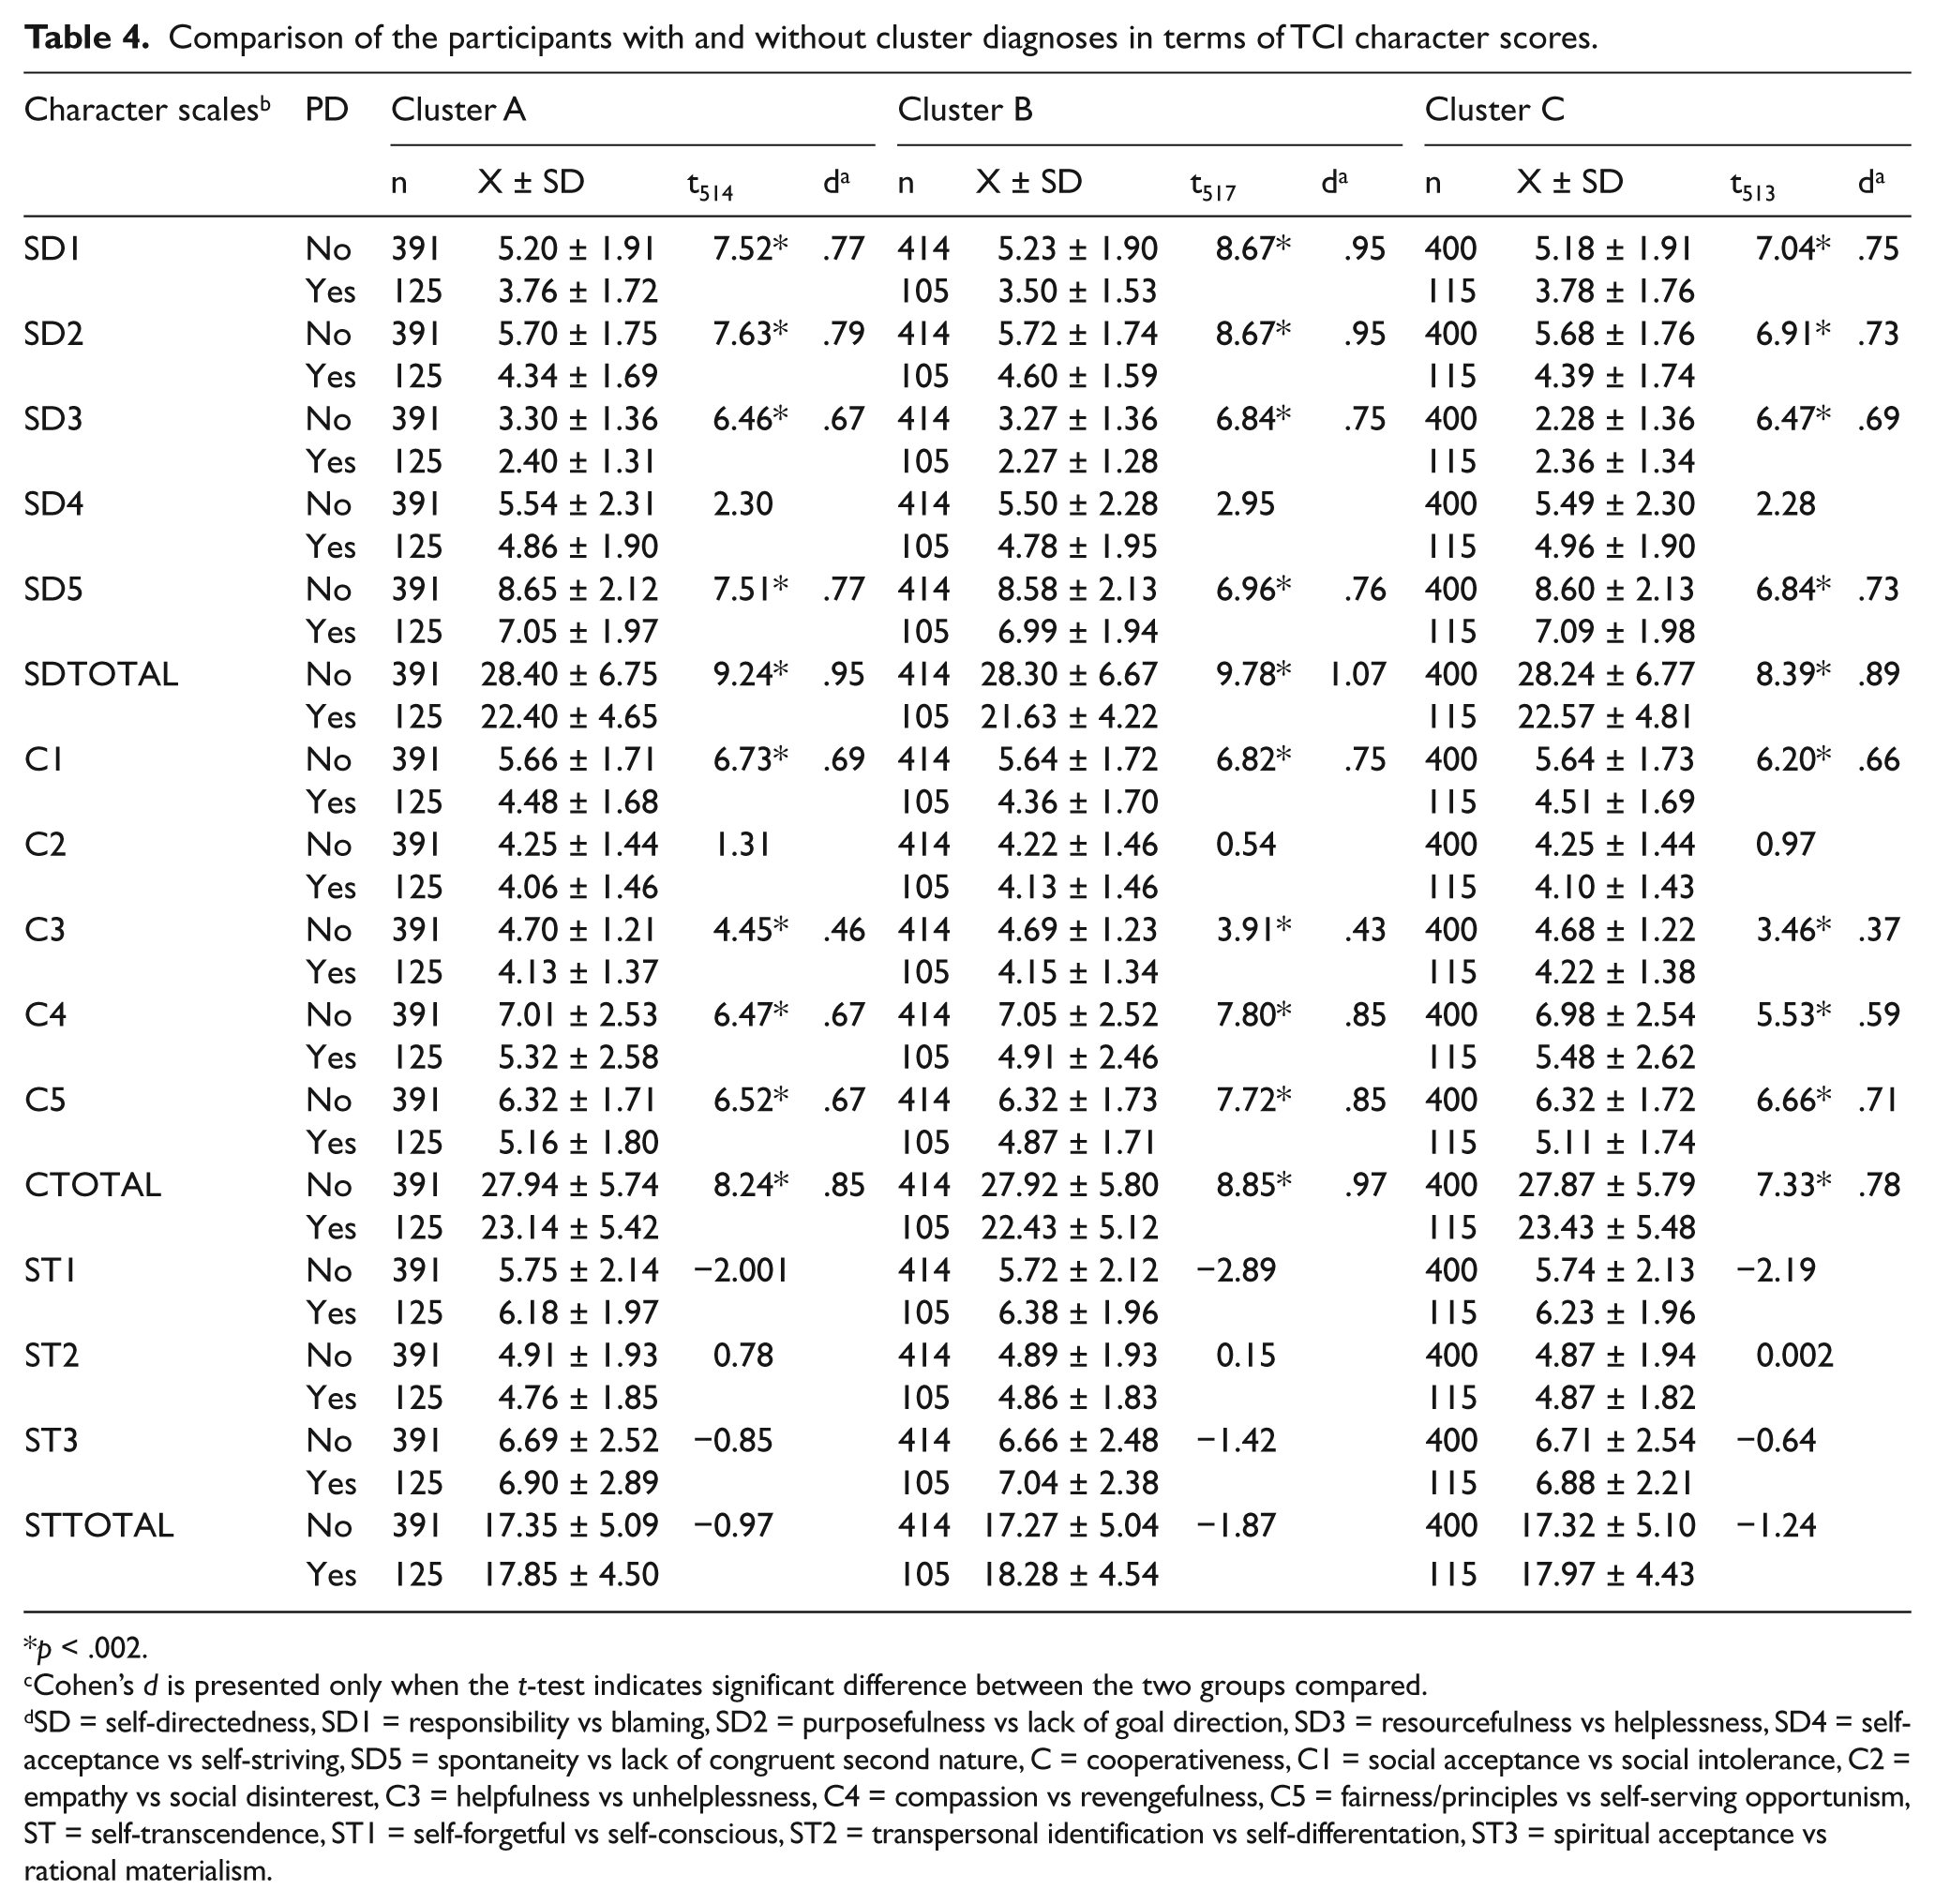
p < .002.
Cohen’s d is presented only when the t-test indicates significant difference between the two groups compared.
SD = self-directedness, SD1 = responsibility vs blaming, SD2 = purposefulness vs lack of goal direction, SD3 = resourcefulness vs helplessness, SD4 = self-acceptance vs self-striving, SD5 = spontaneity vs lack of congruent second nature, C = cooperativeness, C1 = social acceptance vs social intolerance, C2 = empathy vs social disinterest, C3 = helpfulness vs unhelplessness, C4 = compassion vs revengefulness, C5 = fairness/principles vs self-serving opportunism, ST = self-transcendence, ST1 = self-forgetful vs self-conscious, ST2 = transpersonal identification vs self-differentation, ST3 = spiritual acceptance vs rational materialism.
Discussion
In the present study, the percentage of participants diagnosed with at least one of the PDs was 20% and 21.2% for the DSM-IV and ICD-10 criteria, respectively. In previous studies carried out using DIP-Q to diagnose PD, the prevalence rate ranged between 11% and 14% (Bodlund, Grann, Ottosson & Svanborg, 1998; Ekselius et al., 2001; Lindal & Stefansson, 2009; Ottosson et al., 1998). The DIP-Q requires adjustment of the raw diagnostic rate by applying varying cut-off scores to ID and GAF scales. In the present study, the raw rate of 44.3% was decreased to 20% following the adjustment. In a study conducted in Iceland with the DIP-Q and DIP-I (interview form) the raw rate of 38% was decreased to 14% following the adjustment (Ottosson et al., 1998). A Swedish study conducted with the DIP-Q reported PD prevalence as 11% and 12% according to the DSM-IV and ICD-10 criteria, respectively (Lindal & Stefansson, 2009), a finding that was replicated by another study conducted in the same country in a sample with a mean age of 41.9 for women and 43.2 for men (Ekselius et al., 2001). It is noteworthy that lower age seems to be associated with higher prevalence (Coid et al., 2006; Grant et al., 2004; Jackson & Burgess, 2000; Lewin et al., 2005). In two studies where the mean ages of the samples were 33 and 24, the prevalence of PD was 16% and 19%, respectively (Crawford et al., 2005; Moran et al., 2006). In our view, prevalence of PD observed in our study might be explained, at least partially, by the fact that our sample’s mean age was 33.4, which was by no means an artifact but a reflection of the population age in a country where the median age was 28.3 during the data-collection phase of the present study (Türkiye Istatistik Kurumu, 2008). Previous investigations conducted with the DIP-Q reported prevalence rates of 3.5% or 3.9% for multiple PD (Ekselius et al., 2001), and comorbidity rates of 67% and 80% for PD (Lindal & Stefansson, 2009). In the present study, participants with multiple PD accounted for 18.4% (DSM-IV) or 16.1% (ICD-10) of the entire sample, or 91.4% (DSM-IV) and 96.3% (ICD-10) of the group with any PD diagnosis. Hence, not only any PD but also multiple PD appears to be more frequent in our normal sample compared with the samples of previous studies. We feel that extreme personality traits are likely to be more common in a younger society, which might explain more frequent single and multiple PD diagnoses.
The relevant literature contains inconsistent findings pertaining to relative frequency of the PD clusters (Benjet et al., 2008; Coid et al., 2006; Kantojärvi et al., 2004; Lenzenweger et al., 2007; Lewin et al., 2005; Samuels et al., 2002). In the present study, the most commonly diagnosed PD cluster was cluster A, followed up by clusters B and C, a finding that is in line with those of an American (Lenzenweger et al., 2007) and a Mexican study (Benjet et al., 2008). As Lenzenweger and associates (2007) proposed, the fact that cluster A PDs are less common in clinical samples than in normal samples might imply that such individuals rarely seek treatment.
Notwithstanding that normal sample prevalence rates of individual PDs have fluctuated in various countries (Lenzenweger, 2008), the ranking of the PDs has been relatively stable across research reports. In line with the two previous studies conducted with DIP-Q (Ekselius et al., 2001; Lindal & Stefansson, 2009), schizotypal and obsessive-compulsive PDs proved to be the most prevalent diagnoses in our study. There exist some investigations reporting the most common individual PD as DSM-IV obsessive-compulsive and ICD-10 anancastic PD (Bodlund et al., 1998; Coid et al., 2006; Ekselius et al., 2001; Grant et al., 2004; Jackson & Burgess, 2000; Lewin et al., 2005; Lindal & Stefansson, 2009; Ottosson et al., 1998) or antisocial PD (Samuels et al., 2002; Torgersen et al., 2001). Obsessive-compulsive PD involves certain features perceived as proper by most people, such as ‘want to be perfect’, ‘higher moral standard’, ‘cautious and always try to avoid mistakes by means of control’. In our opinion, individuals queried about their personality features by self-report instruments or interviewers might be inclined to admit to obsessive-compulsive personality features because of the social desirability bias that is in effect in almost every culture.
In the present study, κ coefficient of agreement between the two classification systems was 0.96 for any PD, 0.87 for obsessive-compulsive/anancastic PD, and lower for other individual PDs. Our findings replicate a previous study reporting κ coefficients of 0.97 for any PD and 0.91 for obsessive-compulsive PD (Ekselius et al., 2001). We found the least satisfactory agreement between the two classification systems with respect to antisocial PD diagnoses (κ = 0.41). Likewise, Ottosson, Ekselius, Grann, & Kullgren (2002) reported the lowest agreement coefficients between the two diagnostic systems for antisocial (0.41) and schizoid (0.26) PDs. This discrepancy might be due to the fact that, in order to diagnose someone with antisocial PD, the DSM-IV requires three of the 15 diagnostic criteria of conduct disorder to be met before age 15, whereas the ICD-10 has no such requirement.
We found an association of PD with male gender, economically inactive status (student, housewife, unemployed), history of childhood abuse and current/previous psychiatric treatment. Additionally, cluster A and B PDs were more common among economically inactive participants, cluster B and C PDs among victims of childhood abuse, and cluster B PDs among those with lower educational background and with a family history of crime. As indicated by the small effect sizes, however, these were rather weak associations. Nevertheless, among the three clusters of PD, cluster B emerges as the one associated with most of the socio-demographic and developmental risk factors investigated. Our findings converge with previous research addressing relationship between PDs and certain risk factors, namely, male gender (Coid et al., 2006; Jackson & Burgess, 2000; Samuels et al., 2002), unemployment (Coid et al., 2006; Ekselius et al., 2001; Yang et al., 2010), student status (Ekselius et al., 2001), lower level of education (Benjet et al., 2008) and history of childhood maltreatment and/or sexual abuse (Johnson, Cohen, Brown, Smailes & Bernstein, 1999; Yang et al., 2010). Obviously, student status and unemployment are two participant characteristics associated with younger age, which is an established risk factor for PD (Cloninger & Svrakic, 2009).
As indicated by large effect sizes, we observed a strong association for all three PD clusters with higher TCI self-directedness sub-scale (SD total) scores; for cluster A and B diagnoses with higher cooperativeness sub-scale (C total) scores; and for cluster B diagnoses with higher SD1 (responsibility vs blaming), SD2 (purposefulness vs lack of goal direction), C4 (compassion vs revengefulness) and C5 (fairness/principles vs self-serving opportunism) sub-scale scores. As compared with the cluster A and C diagnoses, cluster B diagnoses were found to be related to more character dimensions, and in a more intensive manner as implied by the highest effect sizes observed. As opposed to character sub-scales, we obtained no more than small effect sizes when investigating the relationship between PD diagnosis and temperament sub-scales except for the NS2 (impulsiveness vs reflection) and NS4 (disorderliness vs orderliness) scores demonstrating medium size association with cluster B diagnoses. In general, B appeared to be the cluster most correlated with character as well as temperament sub-scales. Our results replicate findings of a previous clinical study reporting lower self-directedness (SD total) and cooperativeness (C total) scores among psychiatric patients with PD diagnosis (Svrakic et al., 2002); this supports the notion that deficient self-directedness and cooperativeness are common to all categories of PD, and that both dimensions need to be assessed while performing a diagnostic evaluation of personality functioning (Cloninger, Svrakic & Pryzbeck, 1993; Svrakic, Whitehead, Pryzbeck & Cloninger, 1993).
Limitations
The basic limitation of this study is that the prevalence of PDs has been investigated by means of a self-report instrument. Compared with screening by means of structured interviews, self-report instruments yield inflated (about 20%) PD prevalence rates (Ekselius, Linström, von Knorring, Bodlund & Kullgren, 1994). Although the appropriate design for studying epidemiology of PDs calls for complementing self-reports with diagnostic interviews (Lenzenweger, 2008), that would be beyond our resources. Besides, we feel that a cross-sectional evaluation with a clinical interview does not guarantee correct PD diagnosis as a thorough evaluation of one’s personality requires longitudinal data collection from multiple sources.
Conclusion
Despite its limitations, the present study provides the first epidemiological data on the prevalence of PD in a representative Turkish sample, and our findings suggest that research conducted in various cultures to investigate personality pathology in normal samples reveals similarities rather than differences, namely, the most prevalent diagnoses being schizotypal and obsessive-compulsive PDs, the most conspicuous risk factors for PD being young age, male gender and childhood abuse, and finally the most closely associated personality dimensions with PD being deficient self-directedness and cooperativeness. It has been argued that once DSM-V is published, PD researchers will be working with a different system and will need to repeat these studies (Paris, 2010). In our view, backward and forward compatibility of the PD research in this field could be secured to a great extent if the new versions of the diagnostic systems include the most prominent and most prevalent individual PDs as separate diagnostic categories, and impaired self-directedness and cooperativeness as indicators of personality functioning.
Footnotes
Funding
This research received a grant from the Scientific and Technological Research Council of Turkey (TUBITAK).