
Abstract
Objective:
Expressed emotion (EE) predicts the outcome of treatment in patients with anxiety disorders. We aimed to investigate the relationship between EE and demographic and clinical characteristics of patients with panic disorder (PD), to determine whether there is a difference between PD, major depressive disorder (MDD) patients and healthy controls (HC) in terms of EE and to investigate the effect of EE on quality of life (QOL) in patients with PD.
Methods:
Our study involved a total of 150 participants (50 patients in each group). All participants were given the Level of Expressed Emotion (LEE) scale and the short-form health survey (SF)-36 . Furthermore, the EE scale was completed by the participant’s key relatives.
Results:
EE was associated with some sociodemographic and clinical variables in patients with PD. There was no significant difference between PD and MDD and between PD and HC in terms of the LEE and the EE and their subscale scores. It was also demonstrated that EE had no effect on the QOL in patients with PD.
Conclusion:
EE was not different in PD compared to MDD and HC. Additionally, EE was not related to QOL in PD.
Introduction
The quality of family relationships is closely related to the development, maintenance and treatment response of many psychiatric disorders (Blosch, Haffer, Harari, & Szmukler, 1994). Expressed emotion (EE) refers to the care giver’s attitude toward a person with a mental disorder as reflected by the comments about the patient made to an interviewer (Amaresha & Venkatasubramanian, 2012). The concept of EE was initially developed and validated as a predictor of relapse in patients with schizophrenia (Brown, Birley, & Wing, 1972). After discharge from hospital, patients with schizophrenia living with their relatives who were rated as high in EE, relapse was two to three times more likely to occur (Cechnicki, Bielańska, Hanuszkiewicz, & Daren, 2013; Vaughn, Snyder, Jones, Freeman, & Falloon, 1984). In addition to this, subsequent studies have demonstrated that EE had predictive validity across a variety of psychiatric disorders, including unipolar depression (Hooley, Orley, & Teasdale, 1986), bipolar disorders (Kim & Miklowitz, 2004), anxiety disorders (Renshaw, Chambless, & Steketee, 2006), eating disorders (Szmukler, Eisler, Russell, & Dare, 1985), dementia (Vitaliano, Young, Russo, Romano, & Magana-Amato, 1993) and alcoholism (O’Farrell, Hooley, Fals-Stewart, & Cutter, 1998). There is a growing evidence concerning the role of EE in psychiatric disorders, but only a few studies have investigated the role of EE in patients with panic disorder (PD). EE was shown to be a significant predictor of treatment outcome and relapse for individuals with PD with agoraphobia (Renshaw et al., 2006). In general, higher hostility was associated with poorer outcome, while non-hostile criticism was related with better outcome from behavior therapy (Chambless & Steketee, 1999; Renshaw et al., 2006).
PD is an anxiety disorder consisting of recurrent, unexpected panic attacks usually accompanied by a variety of somatic and cognitive symptoms. PD affects multiple aspects of life, including the social, occupational, psychological and emotional domains. It has been established that PD is independently associated with disability showing moderate to severe impairment on multiple domains of quality of life (QOL) (Candilis et al., 1999; Rapaport, Clary, Fayyad, & Endicott, 2005). Yet, the treatment of PD has been demonstrated to achieve symptom remission and to improve the QOL in PD (Davidoff, Christensen, Khalili, Nguyen, & Ishak, 2012). In the Diagnostic and Statistical Manual of Mental Disorders–Fourth edition, Text Revision (DSM-IV-TR; American Psychiatric Association, 2000), it was possible to diagnose PD in the presence or absence of agoraphobia, while in the Diagnostic and Statistical Manual of Mental Disorders–Fifth edition (DSM-5; American Psychiatric Association, 2013), PD and agoraphobia have been separated from each other, and separate specific diagnostic criteria for both of them have been proposed. Whereas EE was associated with treatment outcome in patients with PD with agoraphobia, to date, no study has investigated the association between the level of EE and the demographic and clinical characteristics of patients with PD. In this study, we aimed to investigate the relationship between EE and the demographic and clinical characteristics of patients with PD, to determine whether there is a difference between PD, major depressive disorder (MDD) patients and healthy controls (HC) in terms of EE and to investigate the effect of EE on QOL in patients with PD. Based on the prior findings about EE, we hypothesized that higher levels of anxiety in PD patients would be associated with higher scores on Level of Expressed Emotion (LEE) scale and EE scales. Second, we expected that EE would have a significant impact on QOL in patients with PD.
Methods
Participants
Participants were 50 patients with PD and 50 patients with MDD treated at Gaziosmanpaşa University, School of Medicine, Department of Psychiatry and 50 HC. The patients’ and HC’s key relatives also participated in the study in order to assess EE. After completing the sociodemographic data form, all participants were given the LEE scale and the SF-36 Quality of Life scale. Furthermore, the EE scale was completed by the participants’ key relatives. The HC were recruited from outpatients at Gaziosmanpaşa University Hospital. They were excluded from the study if they had a previous psychiatric history. Patients’ key relatives who were living with the patient for at least 3 months prior to the study were included to the study. Additionally, the State-Trait Anxiety Inventory (STAI)-I and STAI-II were completed by patients with PD, and the Beck Depression Inventory (BDI) was completed by patients with MDD. Patients were diagnosed with PD and MDD according to the DSM-5 criteria. Psychiatric comorbidity was determined according to clinical interview. Patients with PD were included if they were experiencing symptoms for at least 1 year. The MDD group consisted mostly from patients with recurrent depression. Inclusion criteria were as follows: (a) being between 18 and 65 years and (b) at least primary school graduates. Participants were excluded from the study if they had a comorbid psychiatric disease, a serious medical condition or central nervous system disorder, alcohol or substance abuse in the previous 6 months or mental retardation.
Measures
LEE scale
The LEE is a 60-item, self-report measure that assesses the emotional environment in the patient’s most important relationships. It consists of four subscales, that is, intrusiveness, emotional response, attitude toward illness and tolerance and expectations. It was developed by Cole and Kazarian (1988). The reliability and validity of the Turkish-language version of the scale were established by Berksun (1993). It was completed by the patients, and high scores indicate high levels of negative expression of emotions.
EE scale
The EE consists of questions related about how the family members perceive the patient and themselves, and the level of EE is determined according to the answers given. The scale is evaluated by a true–false answer pattern and includes two dimensions, that is, criticism/hostility (29 items) and emotional overinvolvement (12 items). The scale was developed by Berksun (1993).
The STAI-I and STAI-II
STAI-I and STAI-II were used for the assessment of patients’ stress levels. STAI-I measures the reactions of anxiety in a certain time and condition, and STAI-II measures the permanence of anxiety independent of the circumstances (Spielberger, 1976). The inventory has been standardized for the Turkish population by Özusta (1993).
BDI
This self-report questionnaire consists of 21 items and is indicative of a presence of significant depressive symptoms over a cut off score of 17 (Beck, Steer, & Brown, 1996). It was adapted to Turkish by Hisli (1988).
36-item Short Form Health Survey (SF-36)
The SF-36 is used as a general measure of health-related QOL (Ware & Sherbourne, 1992). This instrument measures the respondents’ health-related functioning in eight areas. The reliability and validity of the Turkish-language version of the scale were established by Koçyiğit, Aydemir, Fişek, Ölmez, and Memiş (1999).
Statistical analysis
Data were analyzed using the computer software Statistical Package for Social Sciences (SPSS) version 18.0 (SPSS, 2009). Descriptive statistics for continuous variables were shown by mean (M) ± standard deviation (SD), whereas for categorical variables, the statistics were shown by the number of cases (n) and percentage (%). The significance of the difference of mean age and of the mean scores of the scales between the groups was analyzed by one-way analysis of variance (ANOVA). If a significant difference was detected by ANOVA, post-hoc Tukey test was used to identify the responsible cases. Categorical variables were analyzed by Pearson’s chi-square. Stepwise linear regression analyses within each diagnostic group were undertaken to investigate the predictive role of demographic and clinical variables, that is, predictors, on the subscale and total scores of the EE scales, that is, outcome. Further stepwise linear regression analyses were used to evaluate the effect of EE on QOL, where the total and subscale scores of the QOL scales were chosen as the dependent variables, and the demographic variables and the scores of the EE scales were entered as predictors. Statistical significance was set at a level less than .05.
Results
The mean age of the patients with PD, MDD and HC was 38.08 (±13.52), 40.58 (±12.49) and 33.00 (±9.73), respectively. There was no statistically significant difference between the PD and MDD groups and the PD and HC groups in terms of age. But, the mean age was higher in the MDD group compared to the HC group (p < .05). Sociodemographic variables other than age were dichotomized in order to simplify the comparison between groups. In terms of sex, level of education, marital status and level of income, there were no significant differences between the groups. Comparison of sociodemographic and clinical features of patients with PD, MDD, and HC is shown in Table 1.
Distributions of sociodemographic variables according to groups.
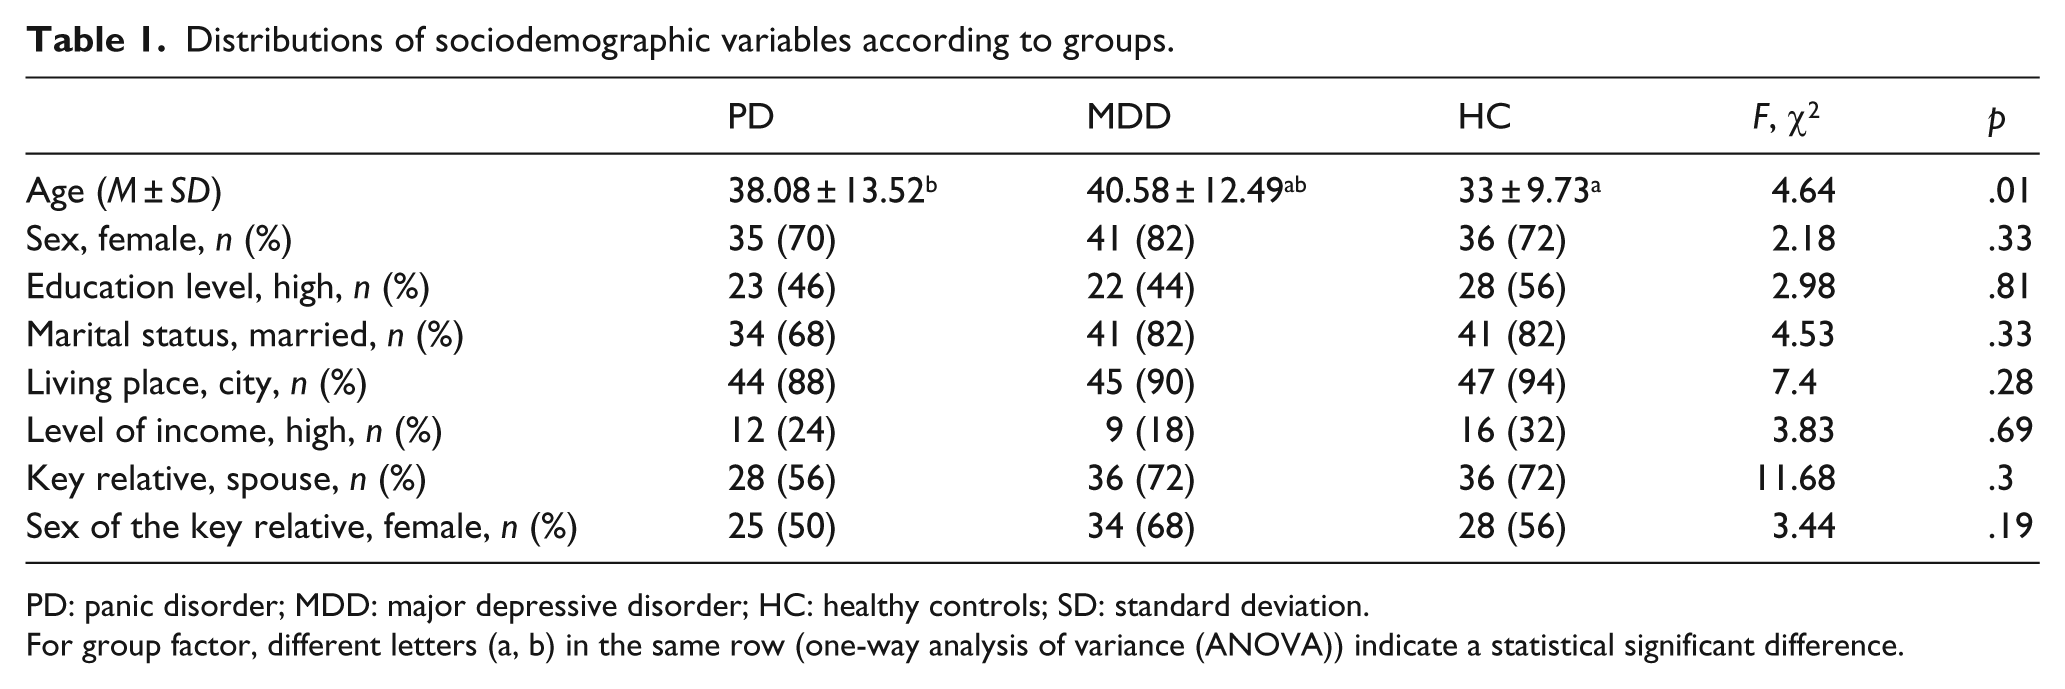
PD: panic disorder; MDD: major depressive disorder; HC: healthy controls; SD: standard deviation.
For group factor, different letters (a, b) in the same row (one-way analysis of variance (ANOVA)) indicate a statistical significant difference.
Linear regression analysis was used to investigate the relationship between the demographic and clinical features and LEE and EE scales and their subscales. In patients with PD, there was a linear relationship between the STAI-I score and the LEE scale total score and the LEE-emotional response subscale and LEE-attitude toward illness subscale scores and between the STAI-II score and the LEE-attitude toward illness subscale score. Single or widowed patients with PD had higher LEE-attitude toward illness and LEE-tolerance/expectation subscale scores compared to married patients. Married patients with PD had higher EE-emotional overinvolvement subscale scores compared to single or widowed ones. Patients whose key relatives were their spouses had higher LEE-attitude toward illness subscale scores and lower EE-emotional overinvolvement subscale scores compared to patients whose key relatives were not.
When PD patients were compared with MDD patients and the HC in terms of the LEE and the EE scales and their subscale scores, no significant differences were found. With regard to the LEE and EE scales and their subscales, the only difference was found in the LEE-attitude toward illness subscale scores between the MDD and HC groups. LEE-attitude toward illness subscale scores were higher in the MDD group compared to HC (Table 2).
Comparison of groups with regard to Level of Expressed Emotion (LEE) and Expressed Emotion (EE) scale scores and their subscale scores.
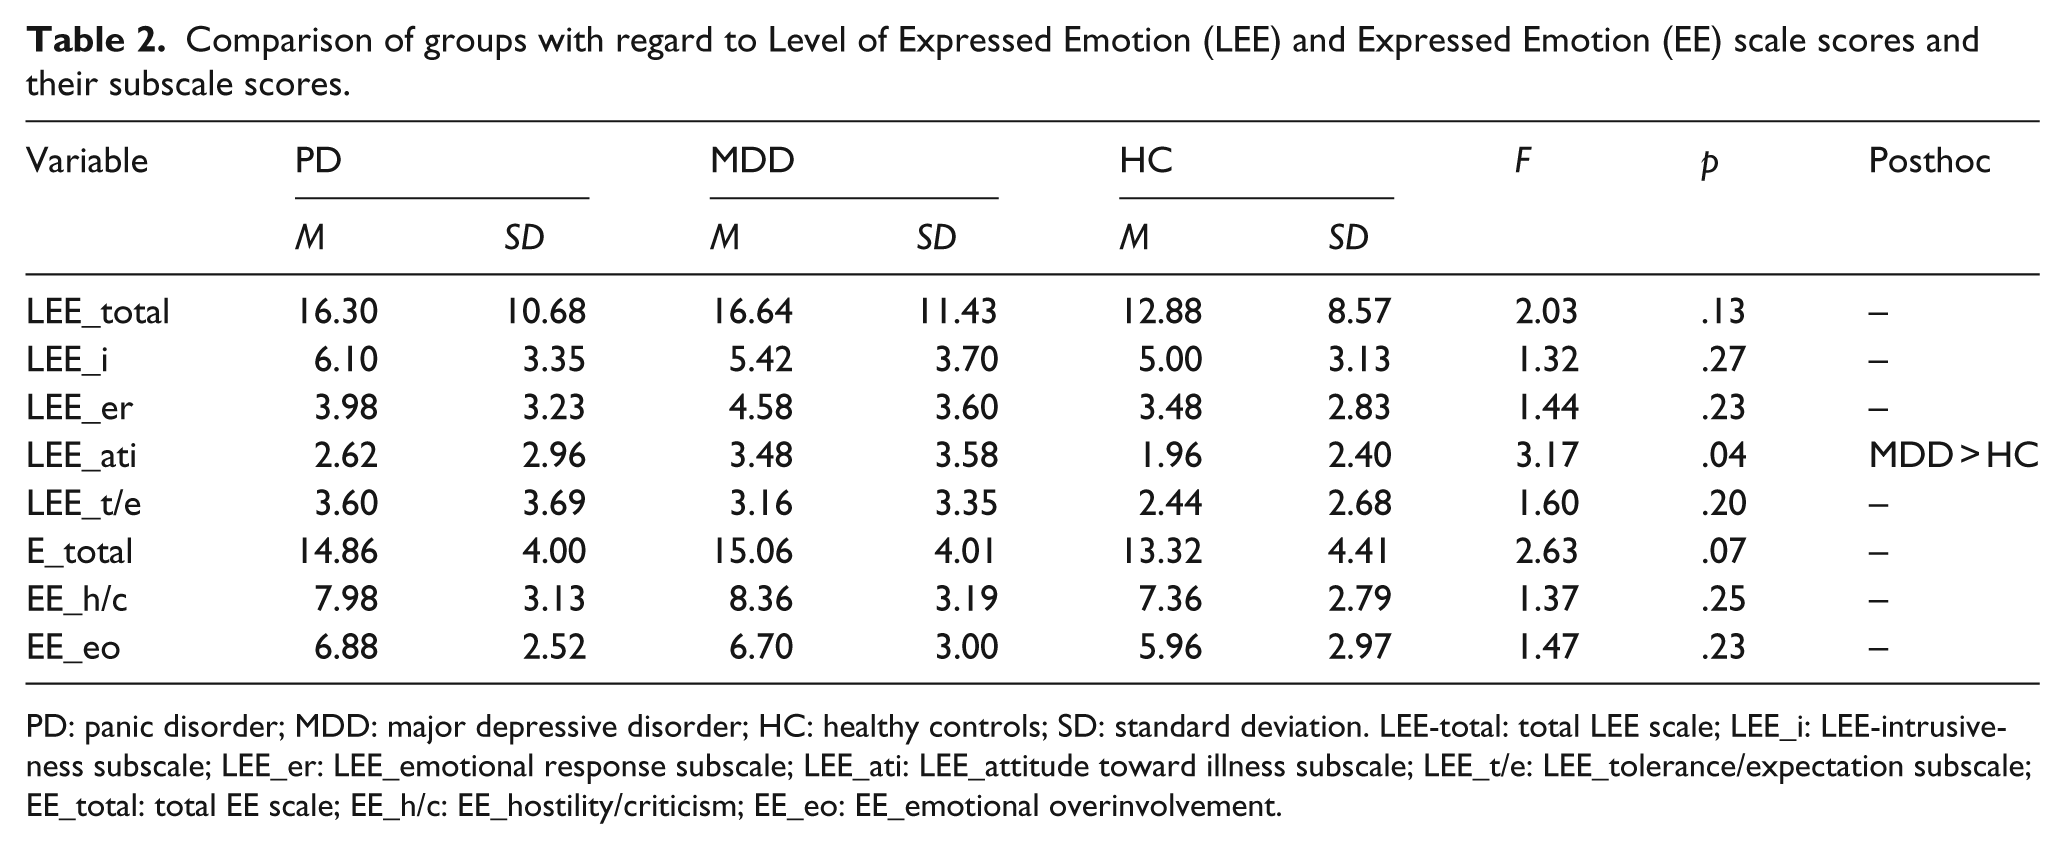
PD: panic disorder; MDD: major depressive disorder; HC: healthy controls; SD: standard deviation. LEE-total: total LEE scale; LEE_i: LEE-intrusiveness subscale; LEE_er: LEE_emotional response subscale; LEE_ati: LEE_attitude toward illness subscale; LEE_t/e: LEE_tolerance/expectation subscale; EE_total: total EE scale; EE_h/c: EE_hostility/criticism; EE_eo: EE_emotional overinvolvement.
We also analyzed the effect of EE on the QOL of patients with PD via regression analyses. Yet, the results revealed that EE had no significant effect on the QOL of patients with PD.
Discussion
In this study, we aimed to explore the relationship between EE and the demographic and clinical characteristics of patients with PD, to determine whether there is a difference between PD, MDD and HC in terms of EE and to investigate the effect of EE on the QOL of patients with PD.
Our results indicated that there was a linear relationship between the STAI-I score and the LEE total score and LEE-emotional response, LEE-attitude toward illness subscale scores and between the STAI-II score and the LEE-attitude toward illness subscale score. Although STAI scales measure the subjective level of anxiety of the patient rather than specifically evaluating the severity of PD, previously it was demonstrated that the STAI scores correlated positively with the frequency of panic attacks (Chambless, Caputo, Jasin, Gracely, & Williams, 1985). Therefore, it may be suggested that the perceived level of EE increases as the level of anxiety escalates. Yet, the relationship between the severity of the disorder and EE has been contradictive in the literature. While some studies have shown that EE increased as the severity of the disorder increased, other studies have failed to support these results (Barrowclough & Hooley, 2003; Lebell et al., 1993; Scazufca, Kuipers, & Menezes, 2001). In this, single/widowed patients perceived their relatives as unfavorable, intolerant and highly expectant toward their illness compared to married patients with PD. Moreover, relatives of married patients with PD scored higher on the EE-emotional overinvolvement subscale. There is no study showing an association between a person’s marital status and EE. Still, it is a well-established fact that social support is higher in married people compared to singles (Cairney, Boyle, Offord, & Racine, 2003). Therefore, it may be speculated that single/widowed patients’ relatives may be worried about the lack of marriage and the occupational status of the patient. It must be kept in mind that the marital and occupational status might be affected by the high EE of single/widowed patients’ relatives, as well. In the PD group, if the key relative was identified as the patient’s spouse, the results indicated that they were more unfavorable toward the patient’s illness compared to other key relatives. Additionally, key relatives other than the spouse scored higher on EE-emotional overinvolvement compared to the spouses. Renshaw et al. (2006) demonstrated that relatives (especially parents) except the spouses were more emotionally involved compared to spouses. This finding is in line with our study. Key relatives of the patients other than the spouses were mostly their parents, and the parent–child relationship may be more protective and supportive when compared to a couple’s relationship. Furthermore, parents of a child, who developed a mental disorder, may be feeling guilty for their child’s illness. This sense of guilt has been shown to lead them to initiate reparative efforts to make things better for the child and to behave overprotective toward the sick person (Amaresha & Venkatasubramanian, 2012).
There was no relationship between the PD patients’ age, sex, level of education, area of residence, level of income and the LEE and EE scores.
There was no significant difference between the PD and MDD groups and between the PD and HC groups in terms of the LEE and LE total scores and their subscale scores. The concept of EE was the first and mostly studied in patients with schizophrenia. It was shown that patients with schizophrenia scored higher on EE scales compared to patients with MDD (Vaughn & Leff, 1976). Even though PD and MDD are disorders that cause functional impairment and impair the QOL, the chronic course and functional deterioration are more frequent in schizophrenia compared to other mental disorders (Göğüş, 1999). In addition, as stigmatization is less prevalent among patients with PD and MDD compared to patients with schizophrenia, this might also contribute to explain the low levels of EE in these disorders (Woodward, 1987). Finally, as we included a homogenous sample and excluded other psychiatric disorders for PD, this might have influenced the results.
Studies exploring the role of EE in patients with PD demonstrated that EE affected adherence to treatment and treatment outcomes (Chambless & Steketee, 1999; Peter & Hand, 1988; Renshaw, Chambless, & Steketee, 2001; Renshaw et al., 2006). Peter and Hand (1988) found that non-hostile critical comments predicted better outcome. Another study including PD patients’ comorbid with agoraphobia demonstrated that relatives’ hostility and emotional overinvolvement predicted higher rates of treatment dropout, and higher hostility and levels of perceived criticism were predictive of poorer outcome. Inversely, non-hostile criticism was associated with better outcome12. Renshaw et al. (2006) included a similar patient group and showed that patients whose relatives negatively attributed to the patient’s disorder received less benefit from therapy compared to patients whose relatives who made no such attributions. Awareness and support to mental disorders differ across different cultures. Similarly, it is known that the level of EE is lower in developing countries and traditional communities compared to developed countries (Jenkins & Karno, 1992). As the study population is part of the former group, this might also have affected the indifference of EE between the PD, MDD and HC groups.
Last, this study has also demonstrated that EE has no effect on the QOL in patients with PD. Studies until now have not investigated the association between EE and QOL in PD. However, EE was associated with lower QOL in patients with schizophrenia (Lennart, 1997). Therefore, this lack of effect of EE on the QOL in this study might be due to the different effects of EE on diverse mental disorders. It might also be related with the low sample size of our study. Numerous studies have shown that comorbid MDD, neuroticism, older age, lower educational status, lower social support, the frequency of panic attacks and agoraphobic avoidance were associated with a decline of QOL in PD (Carrera et al., 2006; Hollifield et al., 1997; Mogotsi, Kaminer, & Stein, 2000).
Results of our study must be interpreted taking into consideration the following limitations: (1) As our study has a cross-sectional design, it is not possible to comment about the effect of EE on treatment outcome. (2) The EE scale used in our study lacks reliability and validity. Yet, since there is no other scale to evaluate the relatives’ EE in Turkish, it was used in this study. Additionally, it was used in other studies to assess the relatives’ EE (Özkiriş, Essizoglu, Gulec, & Aksaray, 2015). While SF-36 has some limitations like not taking into consideration a sleep variable, it is widely used to measure QOL in psychiatric disorders. (3) Although it was shown that the STAI scales correlate positively with the frequency of panic attacks, a specific scale to measure the severity of PD was not administered to patients. (4) Different scales were given to different patient groups, which limits the comparison of the patient groups and HC. (5) Homogeneity of our sample might have affected the results.
Despite its limitations, this study is important in terms of being the first study investigating the relationship of EE in patients with PD with demographic and clinical variables and its effect on the QOL. Follow-up studies with larger sample sizes evaluating how EE of patients with PD affects the course of the disorder and investigating the relationship between EE and treatment outcomes and relapses in PD patients will help us to better understand this topic.
Footnotes
Declaration of Conflicting Interests
The author(s) declared no potential conflicts of interest with respect to the research, authorship and/or publication of this article.
Funding
The author(s) received no financial support for the research, authorship and/or publication of this article.