



Abstract
Background:
There have been cases of suicide following the Work Capability Assessment (WCA), a questionnaire and interview for those claiming benefits due to ill health or disability in the United Kingdom.
Aims:
To examine whether experiencing problems with welfare benefits, including WCA, among people with pre-existing mental health conditions was associated with poorer mental health and wellbeing and increased health service use and costs.
Methods:
A prospective cohort study of an exposed group (n = 42) currently seeking help from a Benefits Advice Service in London and a control group (n = 45) who had recently received advice from the same service. Questionnaires at baseline and 3-, 6- and 12-month follow-ups.
Results:
The exposed group had higher mean scores for anxiety (p = .008) and depression (p = .016) at baseline and the control group higher mean scores for wellbeing at baseline (p = .034) and 12 months (p = .035). However, loss to follow-up makes overall results difficult to interpret. The control group had higher incomes throughout the study, particularly at the 12-month follow-up (p = .004), but the differences could have been accounted for by other factors. Health service costs were skewed by a few participants who used day-care services intensively or had inpatient stays. Over the study period the proportion of exposed participants engaged in benefits reassessment ranged from 50% to 88%, and 40% to 76% of controls.
Conclusion:
The hardship of living with financial insecurity and a mental health condition made it difficult for our participants to sustain involvement in a 12-month study and the frequency of benefit reviews meant that the experiences of our controls were similar to our exposed group. These limitations limit interpretation but confirm the relevance of our research. The control data raise the question of whether people with mental health conditions are being disproportionately reassessed.
Introduction
Disability benefits were first introduced in Britain in 1971. By 1997 spending on them had reached £22 billion (Berthoud, 1998). Since 2000 successive UK governments have tried to reduce expenditure and the number of claimants. In 2008, the Department of Work and Pensions (DWP) replaced Incapacity Benefit with Employment Support Allowance (ESA) for all new benefit claimants. Eligibility was determined by a new assessment protocol, the Work Capability Assessment (WCA). In 2011, the WCA was extended to people already receiving Incapacity Benefit, whose eligibility had been previously established and who were not formerly required to regularly justify their eligibility. This meant assessing 1.9 million more people (Grant, 2011). There were protests: the WCA’s unpopularity stemmed from reports of people being deemed fit for work while unwell or even terminally ill.
The WCA evolved in response to delivery issues, government policy amendments and recommendations made in the statutory independent annual reviews during the first 5 years of the WCA (Harrington, 2010, 2011, 2012; Litchfield, 2013, 2014). Every review expressed concern about the suitability of the WCA to assess people with mental health conditions, a concern also expressed by people with mental health problem themselves (Shefer et al., 2016). In 2014, the fifth and final review reported ‘that mental health conditions represent the primary cause of incapacity in 40% of cases going through the WCA’ (Litchfield, 2014). This is similar to other countries: on average ‘about one-third of new disability benefit claims are attributable to mental disorders with the figure as high as 50% in some countries’ (Hewlett & Moran, 2014; (OECD, 2012b)).
Mind in Croydon, a mental health charity in Greater London, has been offering a Welfare Benefits Advice Service (WBAS) since 1995. Service staff observed that the processes of assessment and review were adversely impacting claimants’ health and questioned the rationale of trying to reduce expenditure on welfare benefits if the procedure itself was leading to poorer health and consequent higher health expenditure.
The study aims were therefore to assess whether the loss of income and/or threatened loss of income due to welfare benefits assessment and/or other benefits problems were (1) associated with poorer mental health status; (2) increased mental health service use; and (3) increased service costs among people with mental health conditions. The study compared an exposed group of people contacting the service about a new welfare benefit problem, and a control group of individuals who had received previous support from the service and were in receipt of their correct benefit entitlement.
Our hypothesis was that, compared to the control group: (1) the exposed group would show poorer mental health outcomes, increased mental health service use and increased service costs; (2) participants undergoing the WCA in the exposed group would be at higher risk of mental health problems; and (3) the exposed group would have lower incomes.
Methods
Study design and setting
We used a prospective cohort design to compare exposed and control groups with follow-ups at 3, 6 and 12 months. The study was approved by Brent Research Ethics Committee 13/LO/0081.
All participants were recruited by Mind in Croydon. Of the 33 London boroughs, Croydon is the most southerly and second-most populous (2011 Census 363,378 (Croydon Local Authority, 2011)). Like London generally, its population is younger than the UK average and more ethnically mixed. Croydon is more deprived than the majority of districts in England for housing and services, crime, employment and health. Approximately 1.04% of residents registered with a general practitioner (GP) in Croydon in 2012/2013 had been diagnosed with a severe mental health condition, close to the London average of 1.03% but above the national average of 0.84% (Borough Profile 2015, 2015).
Participants were eligible to take part if they were aged 16–64 years, had a self-reported mental health problem and were in receipt of benefits. The exclusion criterion was an inability to provide informed consent.
Recruitment
Exposed group: Clients who contacted Mind in Croydon’s service for help with a current benefits problem, for which they had not previously sought advice, were invited to take part. At a client’s first assessment, the benefits advisor provided information about the study and invited those interested to meet a trained Mind in Croydon volunteer.
Control group: Former clients of the WBAS were invited to take part if their last contact with the service was within the previous 18 months and if benefits advisors had judged at that time that they were receiving their correct benefit entitlement. Trained volunteers contacted eligible people, by whichever method they had previously indicated as their preference, to provide information about the study and answer participants’ questions. They obtained written or oral consent the following day.
Data collection
Data collection started in July 2013 and finished in April 2015 (12 months after the last baseline assessment).
Data were collected with questionnaires and from medical records. Consent forms were attached to all questionnaires at all time points for completion before the questionnaires. At baseline and follow-up, participants were invited to complete the questionnaires by post, telephone or at organised attendance days at Mind in Croydon’s premises. Specialist benefit advisors (n = 3), King’s College London researchers (n = 2) and trained volunteers (n = 25 over study duration) were at the attendance days to offer individual assistance. Covering letters with telephone contact details were sent to those receiving the questionnaires by post.
Measures
Mental wellbeing was measured using the Warwick–Edinburgh Mental Wellbeing Scale (WEMWBS): 14 questions with five frequency response categories (NHS Health Scotland, The University of Warwick and The University of Edinburgh, 2006; Tennant et al., 2007). Anxiety symptoms were measured using the Zung Self-Rating Anxiety Scale: 20 questions with four frequency categories (Zung, 1971). Depression symptoms were measured using The Centre for Epidemiologic Studies Depression Scale (CES-D) also with 20 questions and four frequency categories (Radloff, 1977). One aspect of empowerment, self-esteem/self-efficacy, was measured using the Empowerment Scale with nine questions and four Likert-type options: strongly agree, agree, disagree and strongly disagree (Rogers et al., 1997).
Service use was measured using an adapted version of Client Service Receipt Inventory (CSRI) (Beecham & Knapp, 2001). The overall period measured was 18 months: 6 months prior to baseline, 3-month periods prior to the 3- and 6-month follow-ups, and 6 months leading up to the 12-month follow-up. Services included those in primary care settings (face-to-face GP consultations), secondary care services (in-patient stays, contacts with psychiatrists or specialist mental health teams), community health services (psychologists, occupational therapists, counsellors/therapists, mental health nurses, drug and alcohol advisers) and social care services (contacts with social workers). Data were collected on which services were used and the number of contacts. Service use was self-reported but for inpatient care the number of days spent in hospital was extracted from South London and Maudsley NHS Foundation Trust records. Where a service had been used but the number of contacts was missing, median values were derived from those who had this information.
Mind in Croydon piloted the baseline questionnaire with client visitors and found that question 18 about current benefits circumstances was difficult as it included 26 response options plus space for ‘Other’ comments. The research team agreed that a benefits advisor would help participants answer this question with reference to records. Postal questionnaires would be checked and if question 18 was not completed, an advisor would telephone the participant to help answer the question.
Statistical analyses
Demographic data for the exposed and control groups were compared by frequency counts, percentages, Chi-square and Pearson’s t-tests using Stata 13 and Stata IC 15 (Stata Statistical Software, 2013, 2017).
We created a sub-dataset to analyse the multiple answers to question 18 about participants’ current benefits situations. We removed duplicate responses recorded at subsequent time points, answers which related to overpayment, and ‘Other’ notes which were irrelevant to the reassessment of ESA, Disability Living Allowance (DLA) or Personal Independence Payments (PIP).
Service costs were calculated by combining the service-use data with appropriate national unit costs. For most services, unit costs were obtained from an annual compendium commissioned by the Policy Research Programme in the Department of Health (Curtis, 2014). These costs reflect salaries, overheads and capital and are divided by the amount of face-to-face time professionals spend with patients. The UK Government National Health Service Schedule of Reference Costs (Reference Costs 2013–2014, 2014) was used for inpatient hospital services. Our economist (B.O.) checked medical records of all participants registered with South London and Maudsley NHS Foundation Trust. Adult education class fees per hour were obtained from Surrey County Council and we assumed each class would last for 2 hours. All unit costs, in GBP, were estimated at 2013–2014 prices.
Comparisons of service use and costs were made between the two groups at baseline and the three follow-up time points using Stata 12 (Stata Statistical Software, 2011). The t-tests were used to compare differences in the mean service costs but not the individual cost components.
Mind in Croydon provided an estimated average cost per participant for the benefits advice service.
Mean scores for the four mental health measures (our primary measure of the effect of benefit reassessment) were reported for the exposed and control groups. Differences between the groups were assessed using t-tests. We also used repeated measures mixed models to test whether the mental health scores differed depending on the time point. We did not correct for running multiple tests on the same data and it is possible that we obtained a false positive by chance. We therefore interpreted our results with caution.
Results
Participant numbers at baseline were 42 exposed and 45 controls. Table 1 shows the loss to follow-up.
Number of participants at each time point by exposed and control.

Demographic comparisons
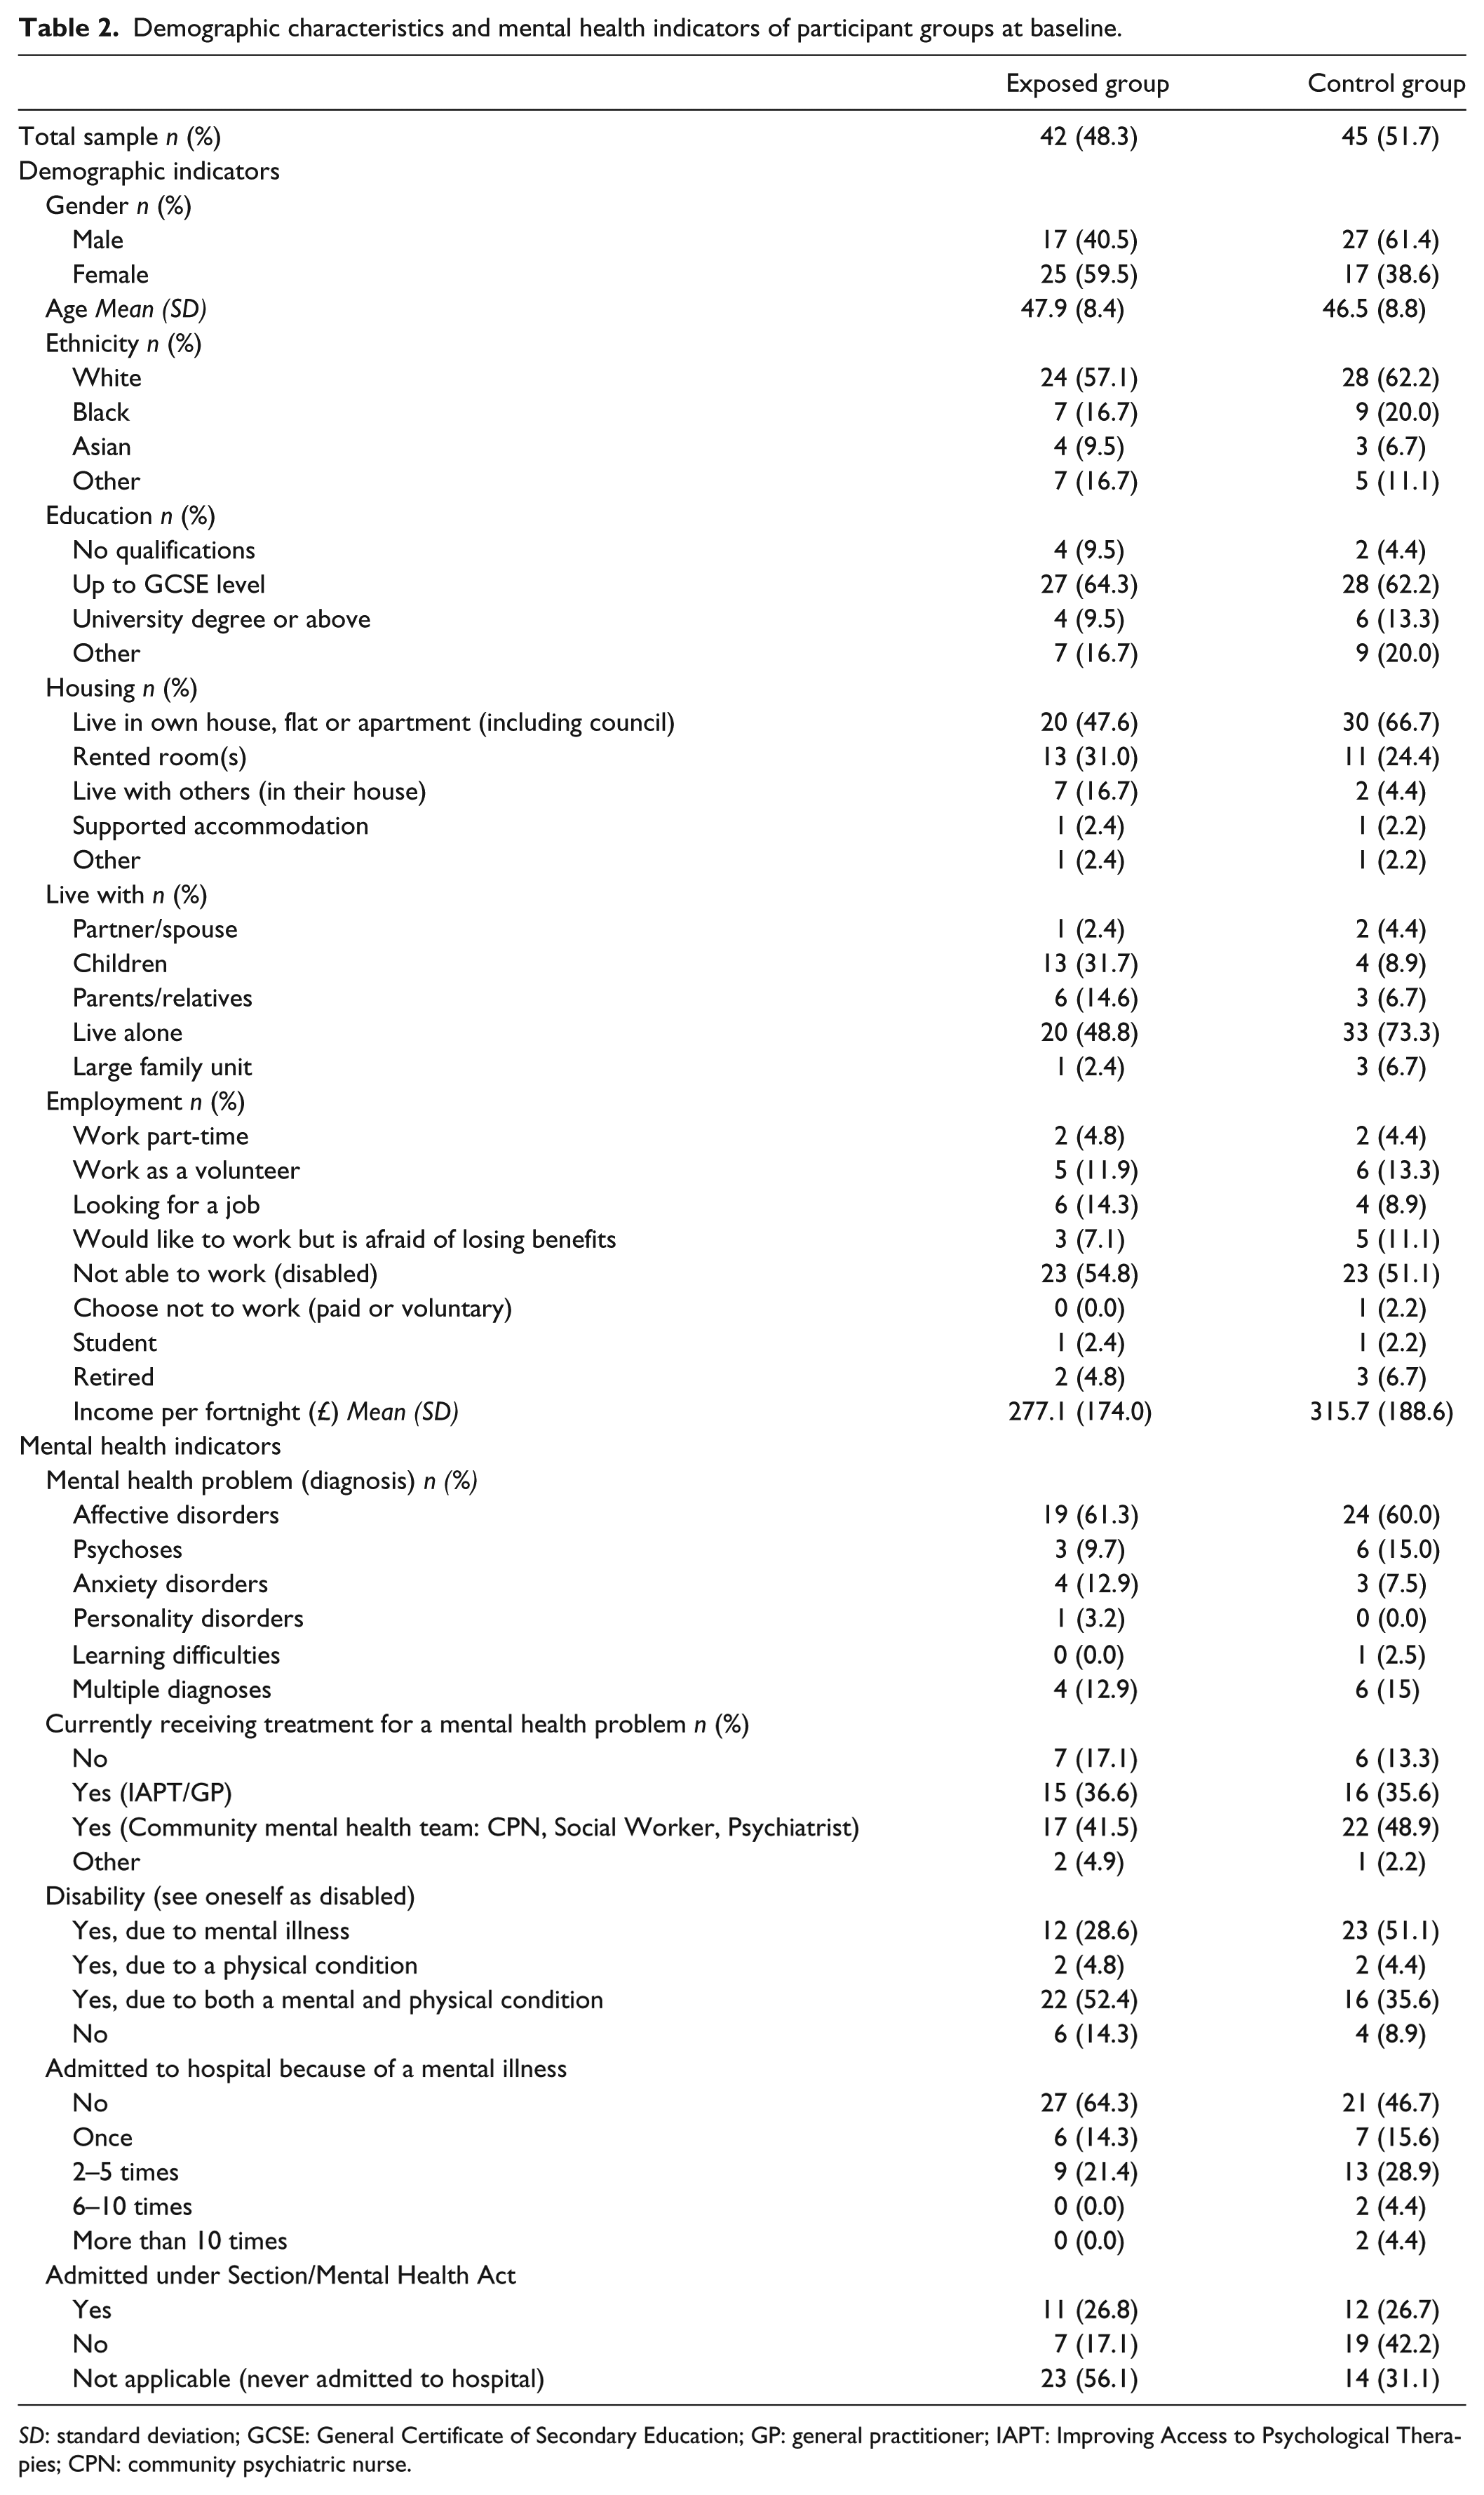
Table 2 sets out baseline demographic characteristics, including income and mental health indicators.
Demographic characteristics and mental health indicators of participant groups at baseline.
SD: standard deviation; GCSE: General Certificate of Secondary Education; GP: general practitioner; IAPT: Improving Access to Psychological Therapies; CPN: community psychiatric nurse.
The groups were similar in age, ethnicity and education. Mean ages were: exposed group (E) 47.9 years, control group (C) 46.5 years. Most participants in both groups were White (E: 57.1%; C: 62.2%) in line with the 2011 census record that 57.0% of working-age Croydon residents were White (Borough Profile 2015, 2015). The most frequent highest level of education in both groups was the General Certificate of Secondary Education (GCSE) (E: 64.3%; C: 62.2%). GCSE examinations are typically taken at age 16, the lowest age for leaving school in the UK.
The exposed group had more females, 59.5%, and the control group more males, 61.4%. A higher proportion of participants in the control group (66.7%) lived in their own house/flat (including houses/flats rented from local authorities) compared to the exposed group (47.6%). In total, 73.3% of participants in the control group lived alone compared to 48.8% in the exposed group, both much higher than the 2011 census figure for one-person households in Croydon: 29.7% (Croydon Local Authority, 2011). A higher proportion of participants in the exposed group lived with their children (31.7%), compared to the control group (8.9%).
Approximately half the participants in each group stated they were unable to work because of a disability (E: 54.8%; C: 51.1%). A small proportion were retired (E: 4.8%; C: 6.7%) or students (E: 2.4%; C: 2.2%).
Income
Mean incomes per fortnight (2 weeks) were higher for the control group throughout the study. At baseline they were £277.10 for the exposed group and £315.70 for the control (Table 2). At 3 months they were E: £294; C: £352; and at 6 months E: £304; C: £374. At 12 months the difference was larger: E: £255; C: £447.
Mental health indicators
There were several similarities between the groups’ mental health. Most participants had affective disorders (E: 61.3%; C: 60.0%); and, among those who received treatment, most were cared for by community mental health teams (E: 41.5%; C: 48.9%).
The main distinction between the groups was that more than half the exposed group (52.4%) saw themselves as disabled due to mental and physical health conditions, whereas more than half of the control group (51.1%) indicated they were disabled due to mental illness alone (Table 2).
Fewer participants in the exposed group had been admitted to hospital for mental illness. Almost two-thirds of the exposed group (64.3%) indicated that they had never been admitted compared to 46.7% of the control group. However, the proportion of the exposed group detained under the Mental Health Act (26.8%) was almost the same as the control group (26.7%) which indicates that a higher proportion of their admissions were under the Act compared to the controls.
Welfare benefits indicators
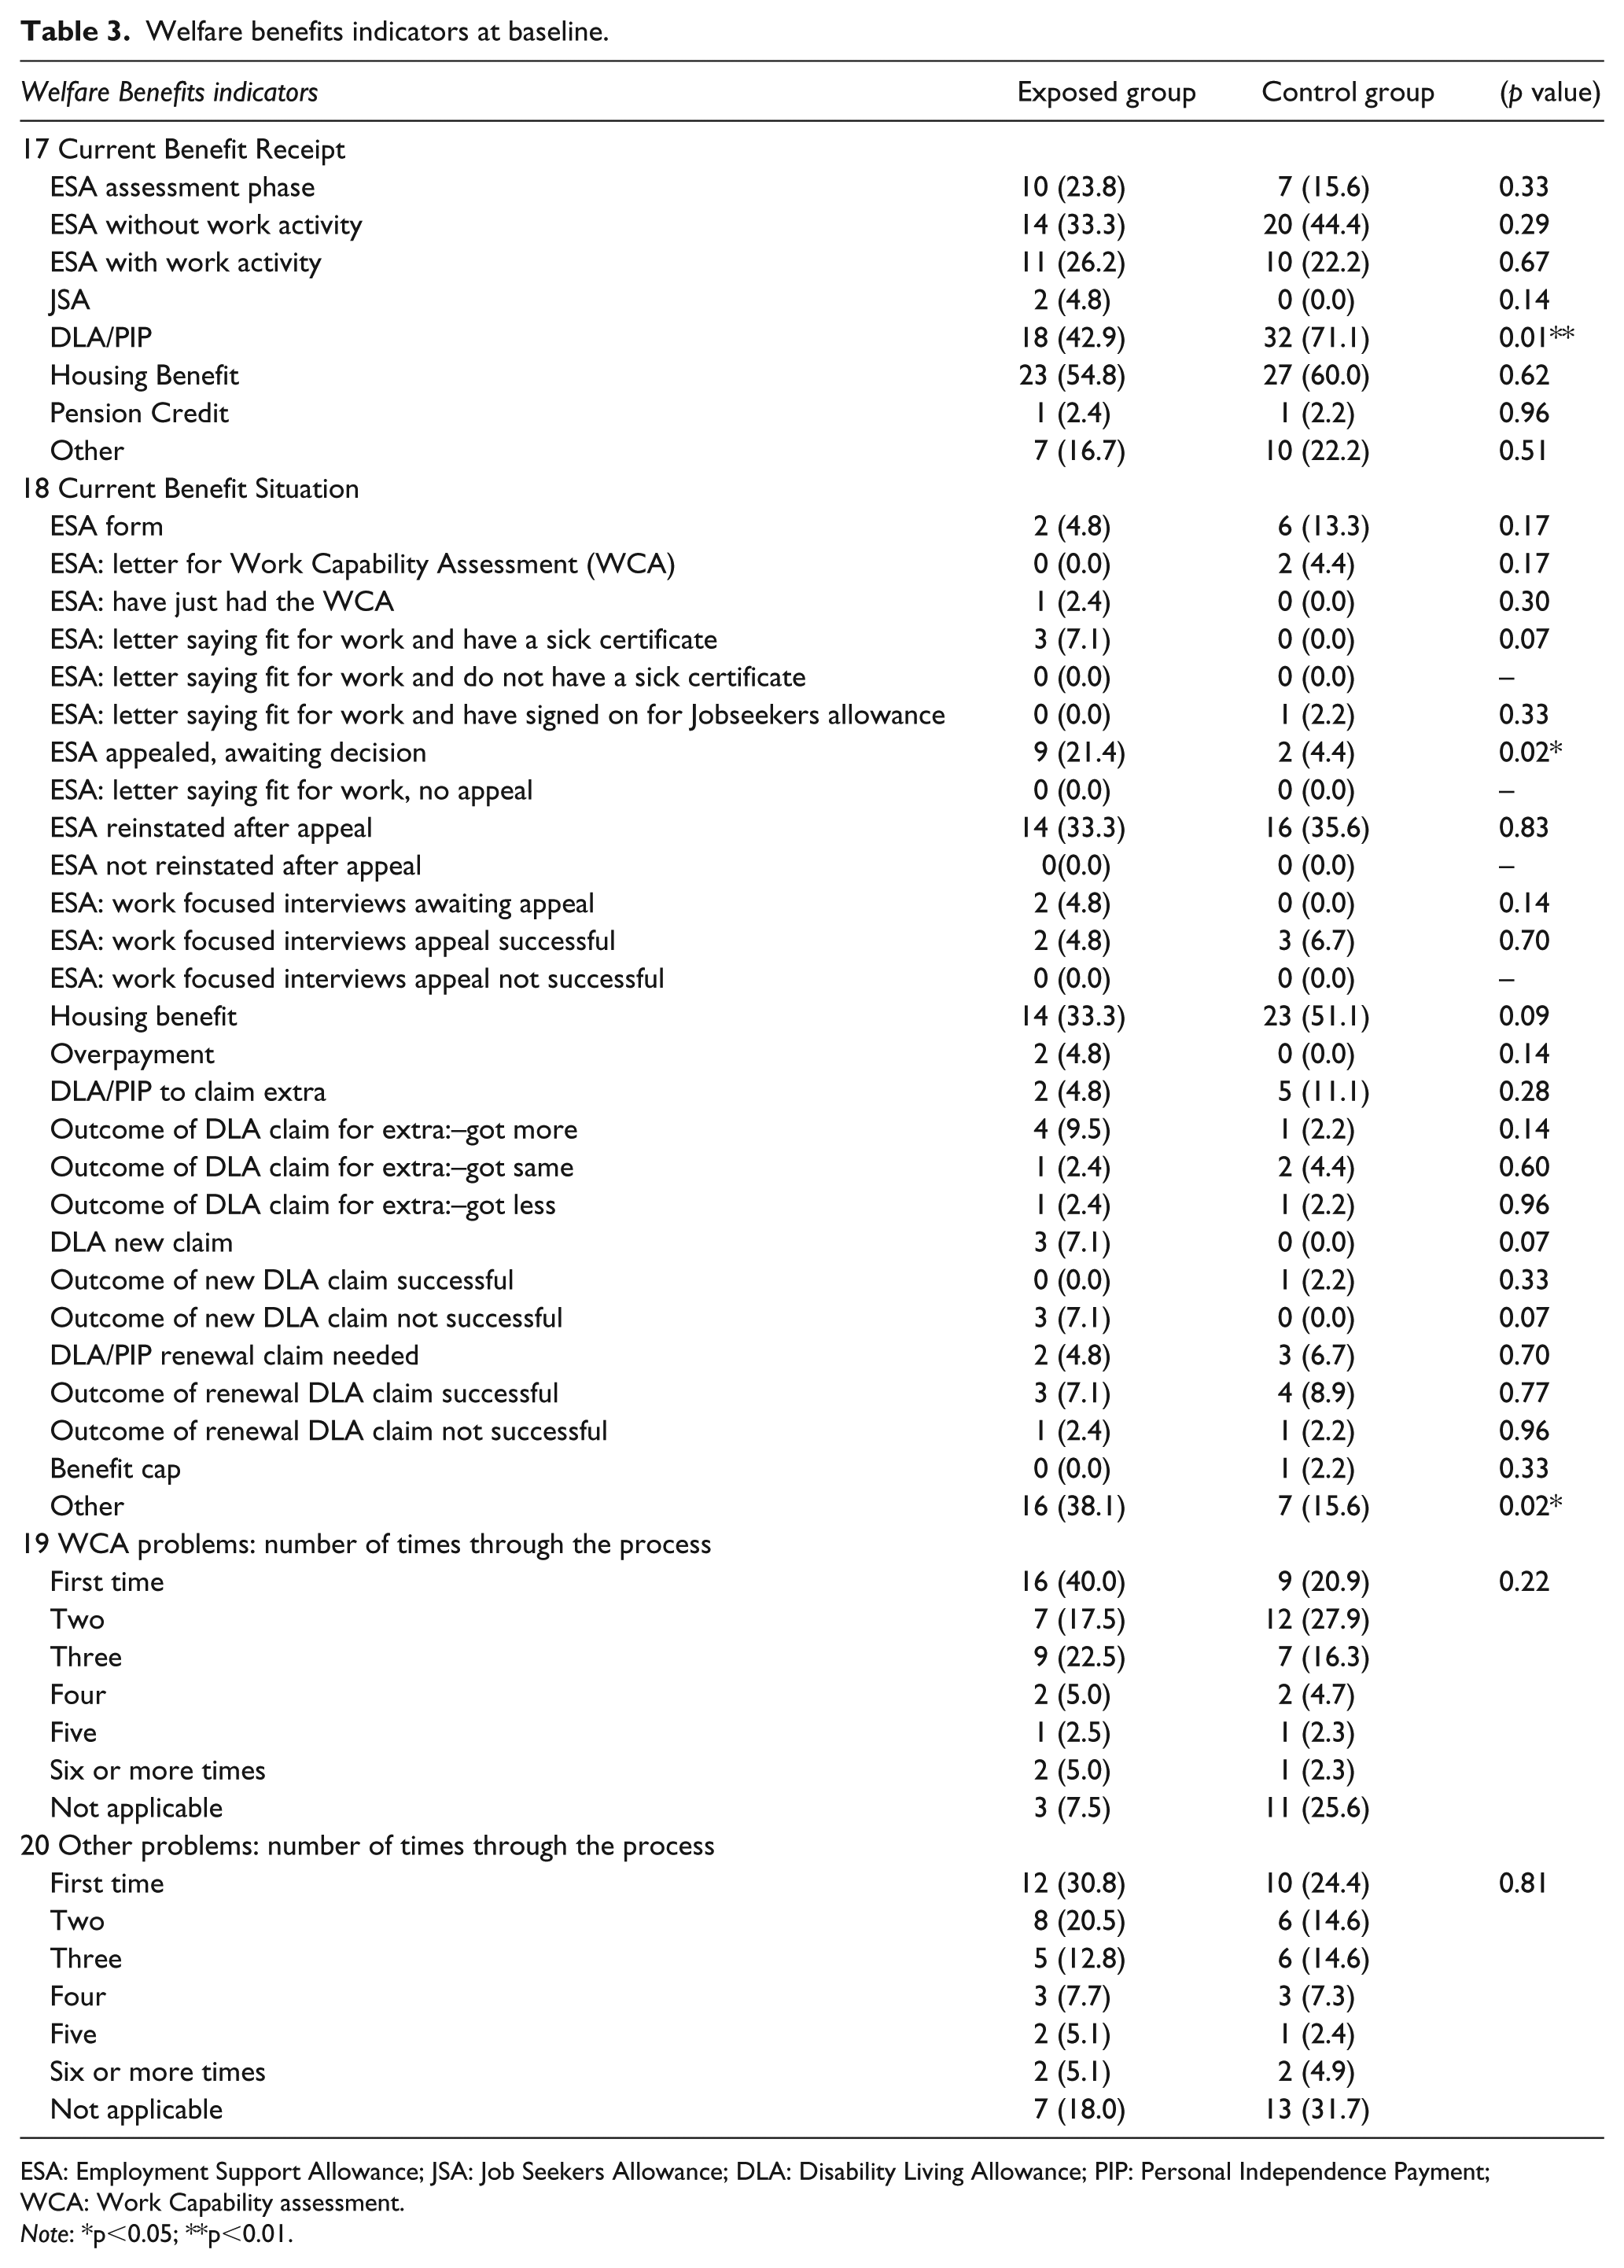
Table 3 sets out responses at baseline to questions 17–20 about welfare benefits. Each line of the table corresponds to one of the optional answers listed in the questionnaire. For questions 17 and 18 ‘on current benefits’, respondents selected as many as applicable.
Welfare benefits indicators at baseline.
ESA: Employment Support Allowance; JSA: Job Seekers Allowance; DLA: Disability Living Allowance; PIP: Personal Independence Payment; WCA: Work Capability assessment.
Note: *p<0.05; **p<0.01.
A higher proportion of the control group received non-means-tested disability benefits DLA or PIP (E: 42.9%; C: 71.1%). More control participants (E: 33.3%; C: 44.4%) received ESA without any requirement for work-related activity intended as preparation for employment. Most participants in both groups received Housing Benefit at baseline (E: 54.8%; C: 60.0%) and a higher proportion of control participants received Housing Benefit at all time points: 3 months E: 45.0%, C: 53.3%; 6 months E: 46.2%, C: 70.0%; 12 months E: 25.0%, C: 81.3%.
Higher proportions of the exposed group were awaiting a decision on their appeal for ESA (E: 21.4%; C: 4.4%) and had relevant ‘Other’ answers (E: 38.1%; C: 15.6%).
At baseline, while 35.6% of controls had had their ESA reinstated on appeal, another 13.3% had already received another assessment letter and 15.6% in total were again undergoing ESA reassessment. Similarly, 11.1% of control participants were in the process of claiming extra non-means-tested disability benefits (DLA or PIP).
Table 4 shows the proportions of participants in both groups engaged in reassessment across all time points: either claiming or appealing ESA, DLA or PIP, or waiting for the outcome of such a claim or appeal. Not all exposed participants were engaged in reassessment at all time points. Some received housing benefit only (for example because they were a student), or a pension, or data for question 18 was missing.
Participants engaged in reassessment of any disability benefit by group and time point.

ESA: Employment Support Allowance; DLA: Disability Living Allowance; PIP: Personal Independence Payments.
Housing Benefit and Overpayment data excluded. Duplicate responses from subsequent time points excluded. ‘Other’ responses included only if they indicated change or uncertainty about ESA, DLA or PIP, for example, ‘ESA not paid yet’.
At each time point, the proportion of control participants engaged in reassessment was similar to the exposed group: at baseline E: 88.10%, C: 75.56%; at 3 months E: 65.00%, C: 40.00%; at 6 months E: 53.85%, C: 42.86%; and at 12 months E: 50.00%, C: 43.75% (Table 4).
A total of 40% of the exposed group reported that this was the first time they had been through the WCA process or had WCA problems. A total of 53% (52.5%) had been through the process before. For the control group the respective figures were 20.9% and 53.5%. (Table 3)
In total 51% (51.2%) of the exposed group and 43.8% of controls had problems with other benefits before. (Table 3)
Mental health status
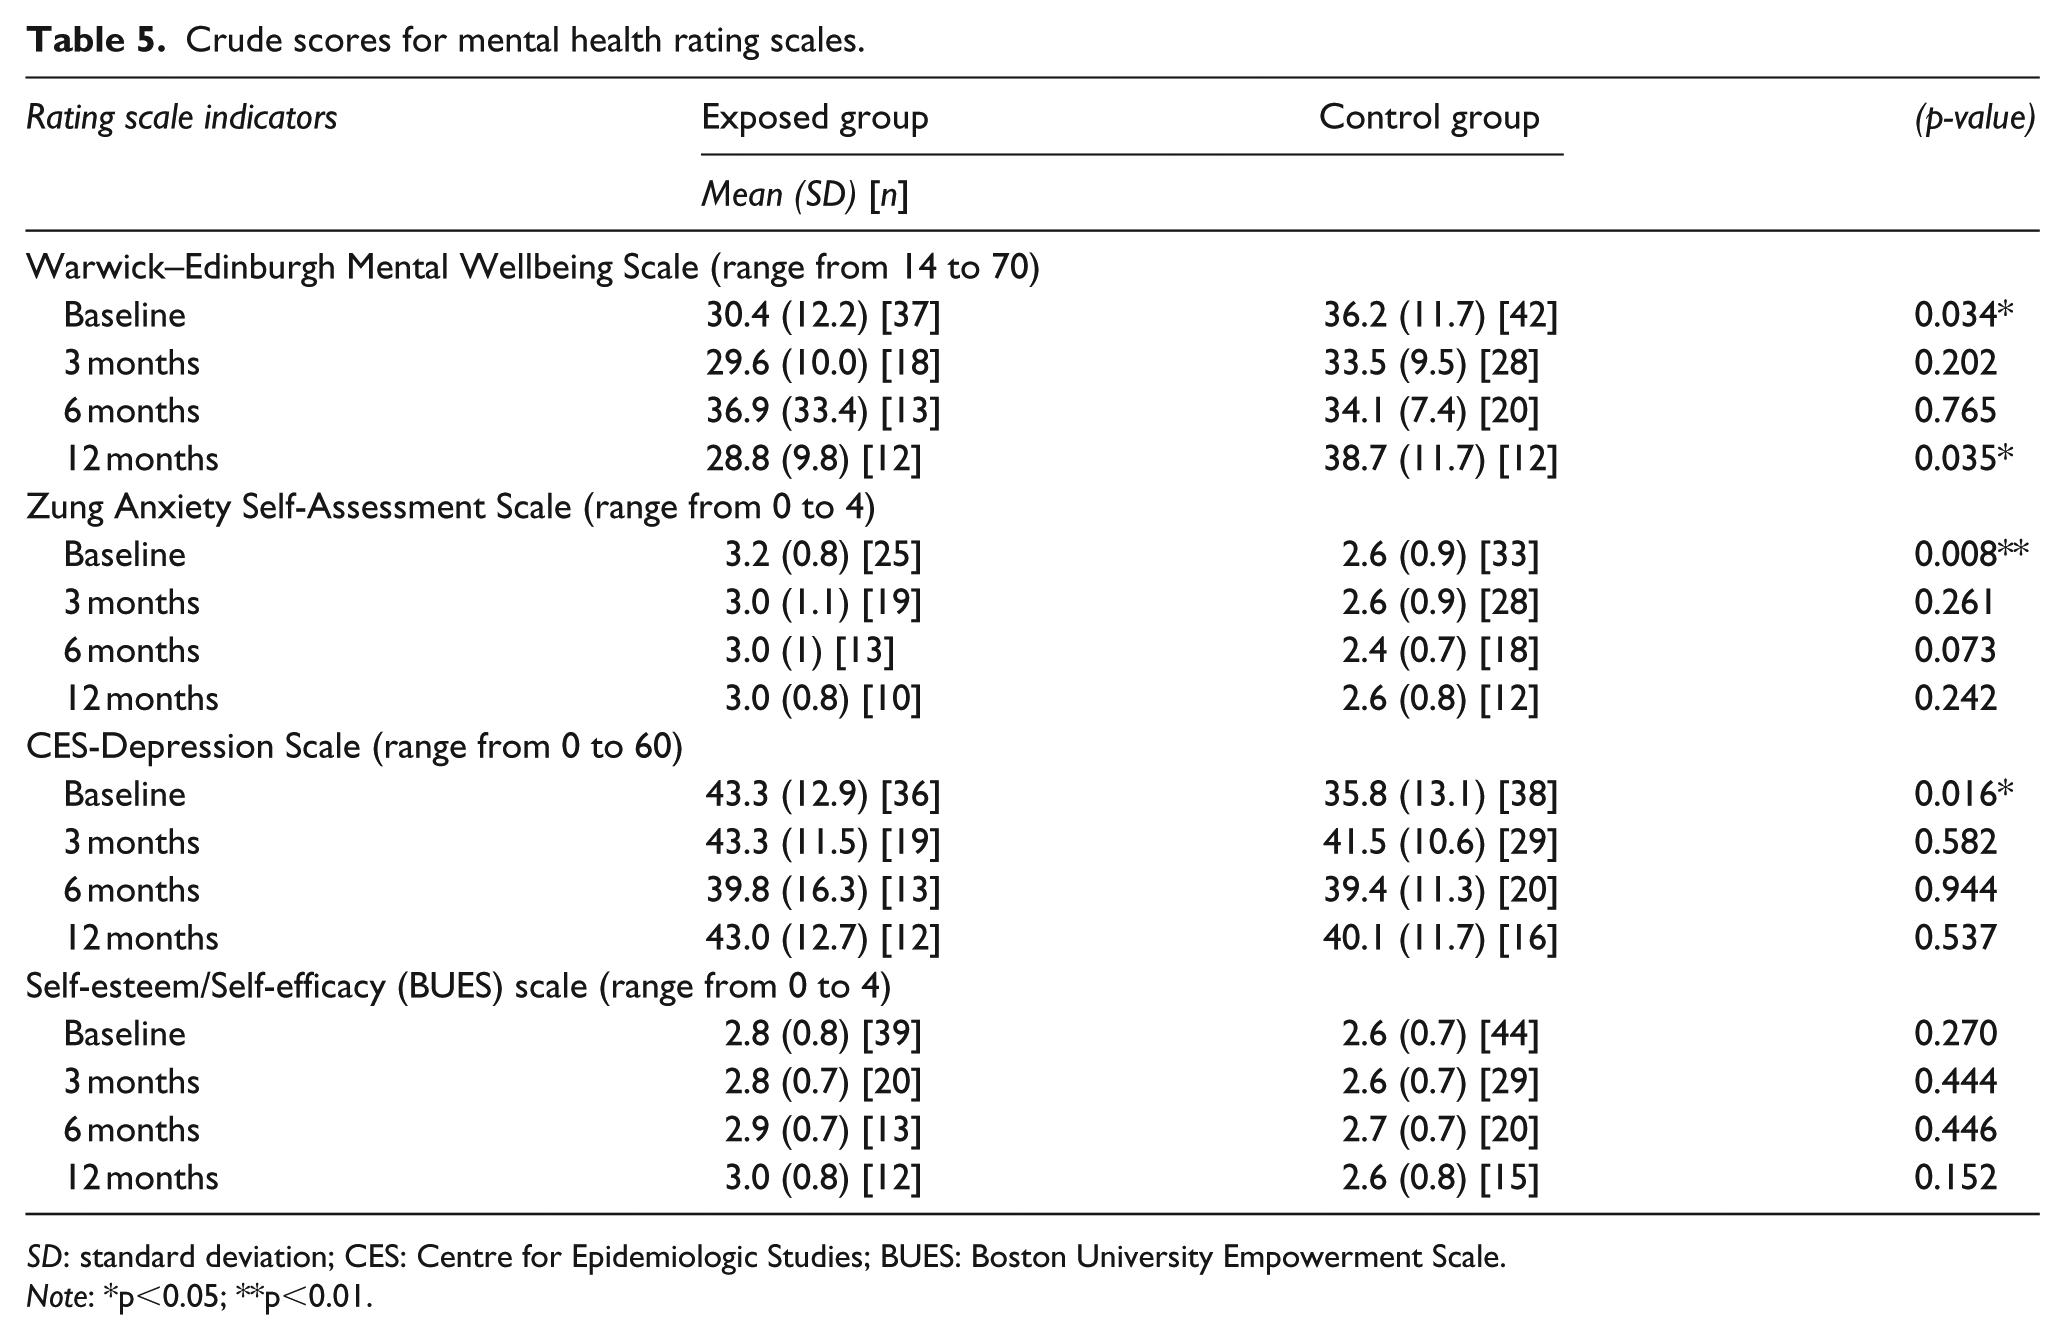
Table 5 sets out participants’ mental health rating scores by group at all time points.
Crude scores for mental health rating scales.
SD: standard deviation; CES: Centre for Epidemiologic Studies; BUES: Boston University Empowerment Scale.
Note: *p<0.05; **p<0.01.
At baseline, the mean WEMWBS (range 14–70) in the exposed group was 30.4 (SD 12.2) [CI 26.3–34.4] and control 36.2 (SD 11.7) [CI 32.5–39.9], p = .034. On the Zung Anxiety scale (range 0–4), the exposed mean was 3.2 (SD 0.8) [CI 2.9–3.5] and control 2.6 (SD 0.9) [CI 2.3–2.9], p = .008. On the CES-Depression scale (range 0–60) the mean scores were exposed 43.3 (SD 12.9) [CI 38.9–47.6] and control 35.8 (SD 13.1) [CI 31.5–40.1], p = .016.
At 3 and 6 months the differences in mean wellbeing scores were not significant: respectively, exposed group mean 29.6 (SD 10.0) [CI 24.7–34.6] and control 33.5 (SD 9.5) [CI 29.8–37.2], p = .202; and exposed group mean 36.9 (33.4) [CI 16.8–57.1] and controls 34.1 (7.4) [CI 30.6–37.5] p = .765. At 12 months the exposed group had the lower mean wellbeing score again 28.8 (SD 9.8) [CI 22.5–35.0] compared to the controls 38.7 (SD 11.7) [CI 31.2–46.1], p = .035.
For the Zung Anxiety and CES-Depression scales the groups’ 3-, 6- and 12-month follow-up scores were similar. Both groups’ scores on the self-esteem scale were similar throughout the study.
Repeated measures mixed models were run for each of the scales, including an interaction between group and time point. We found evidence that the WEMWBS results differed between groups depending on the time point (p = .0409), however, this interaction was not significant for the other scales. We also tested whether variation in the mental health scores could be explained by the baseline gender difference between the groups (p = .053), or the large difference in incomes at 12 months (p = .004) but controlling for gender and income did not explain the differences in the mental health scores.
Service use
Services used
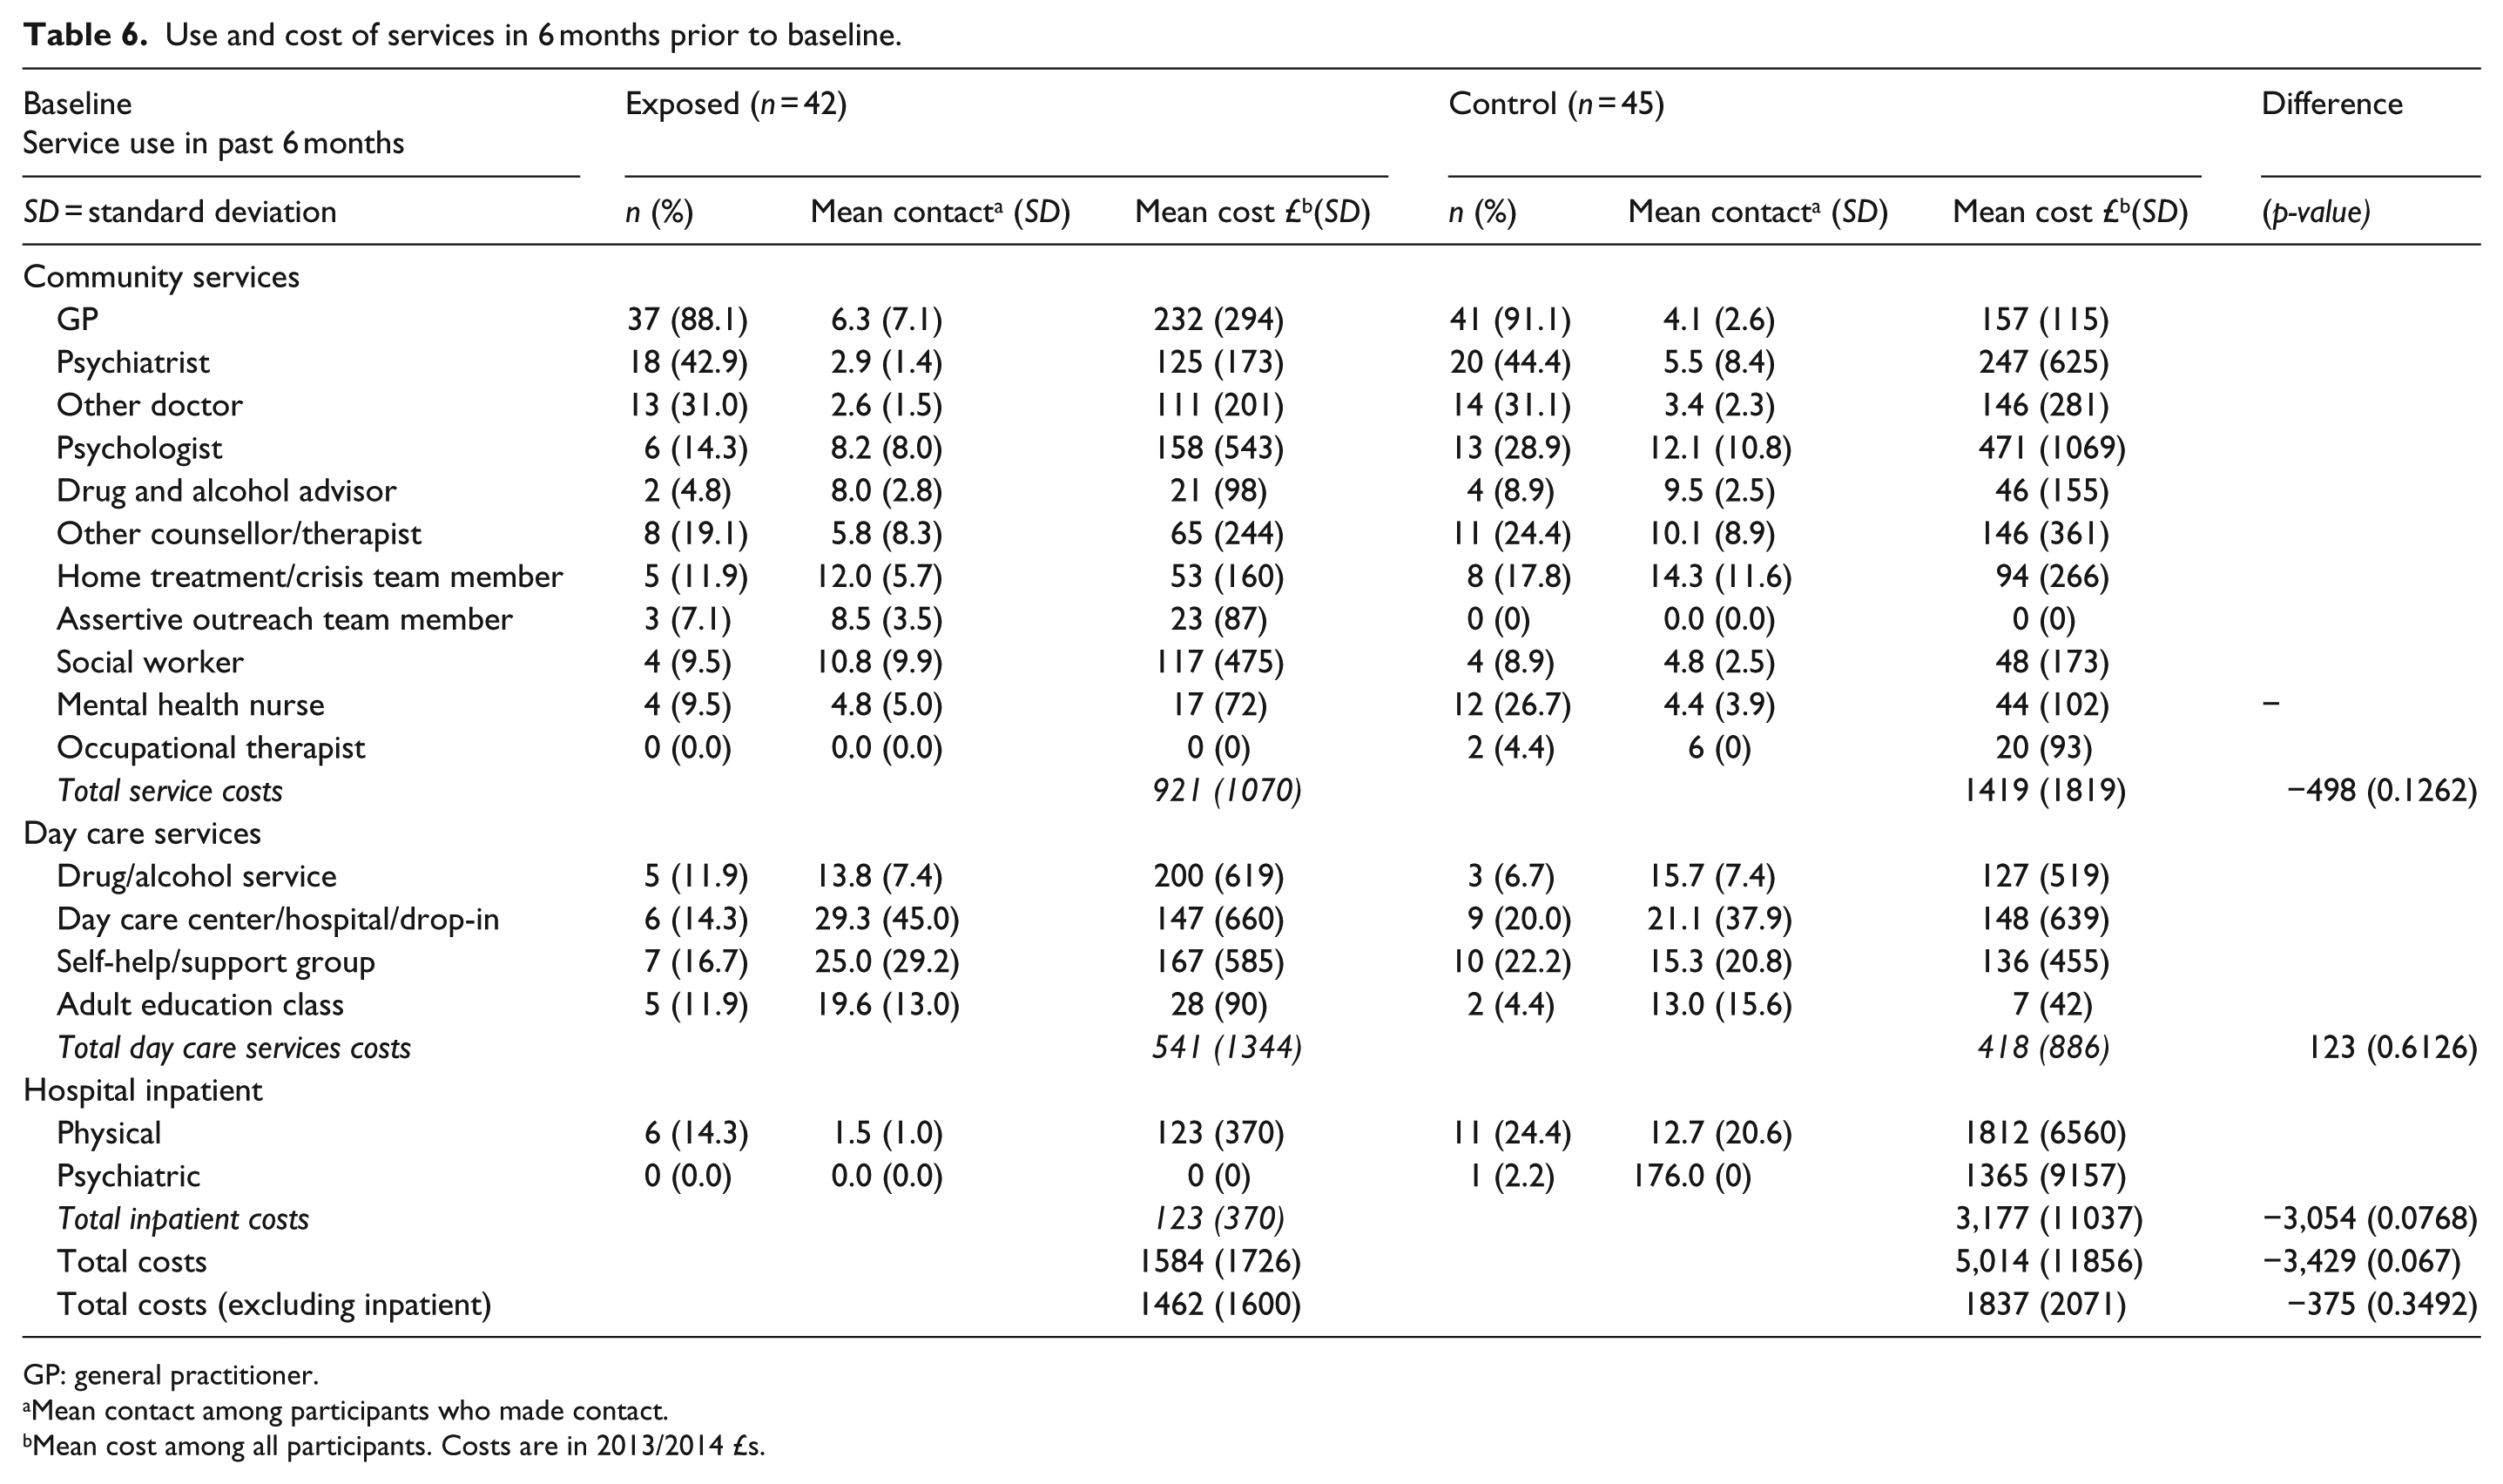
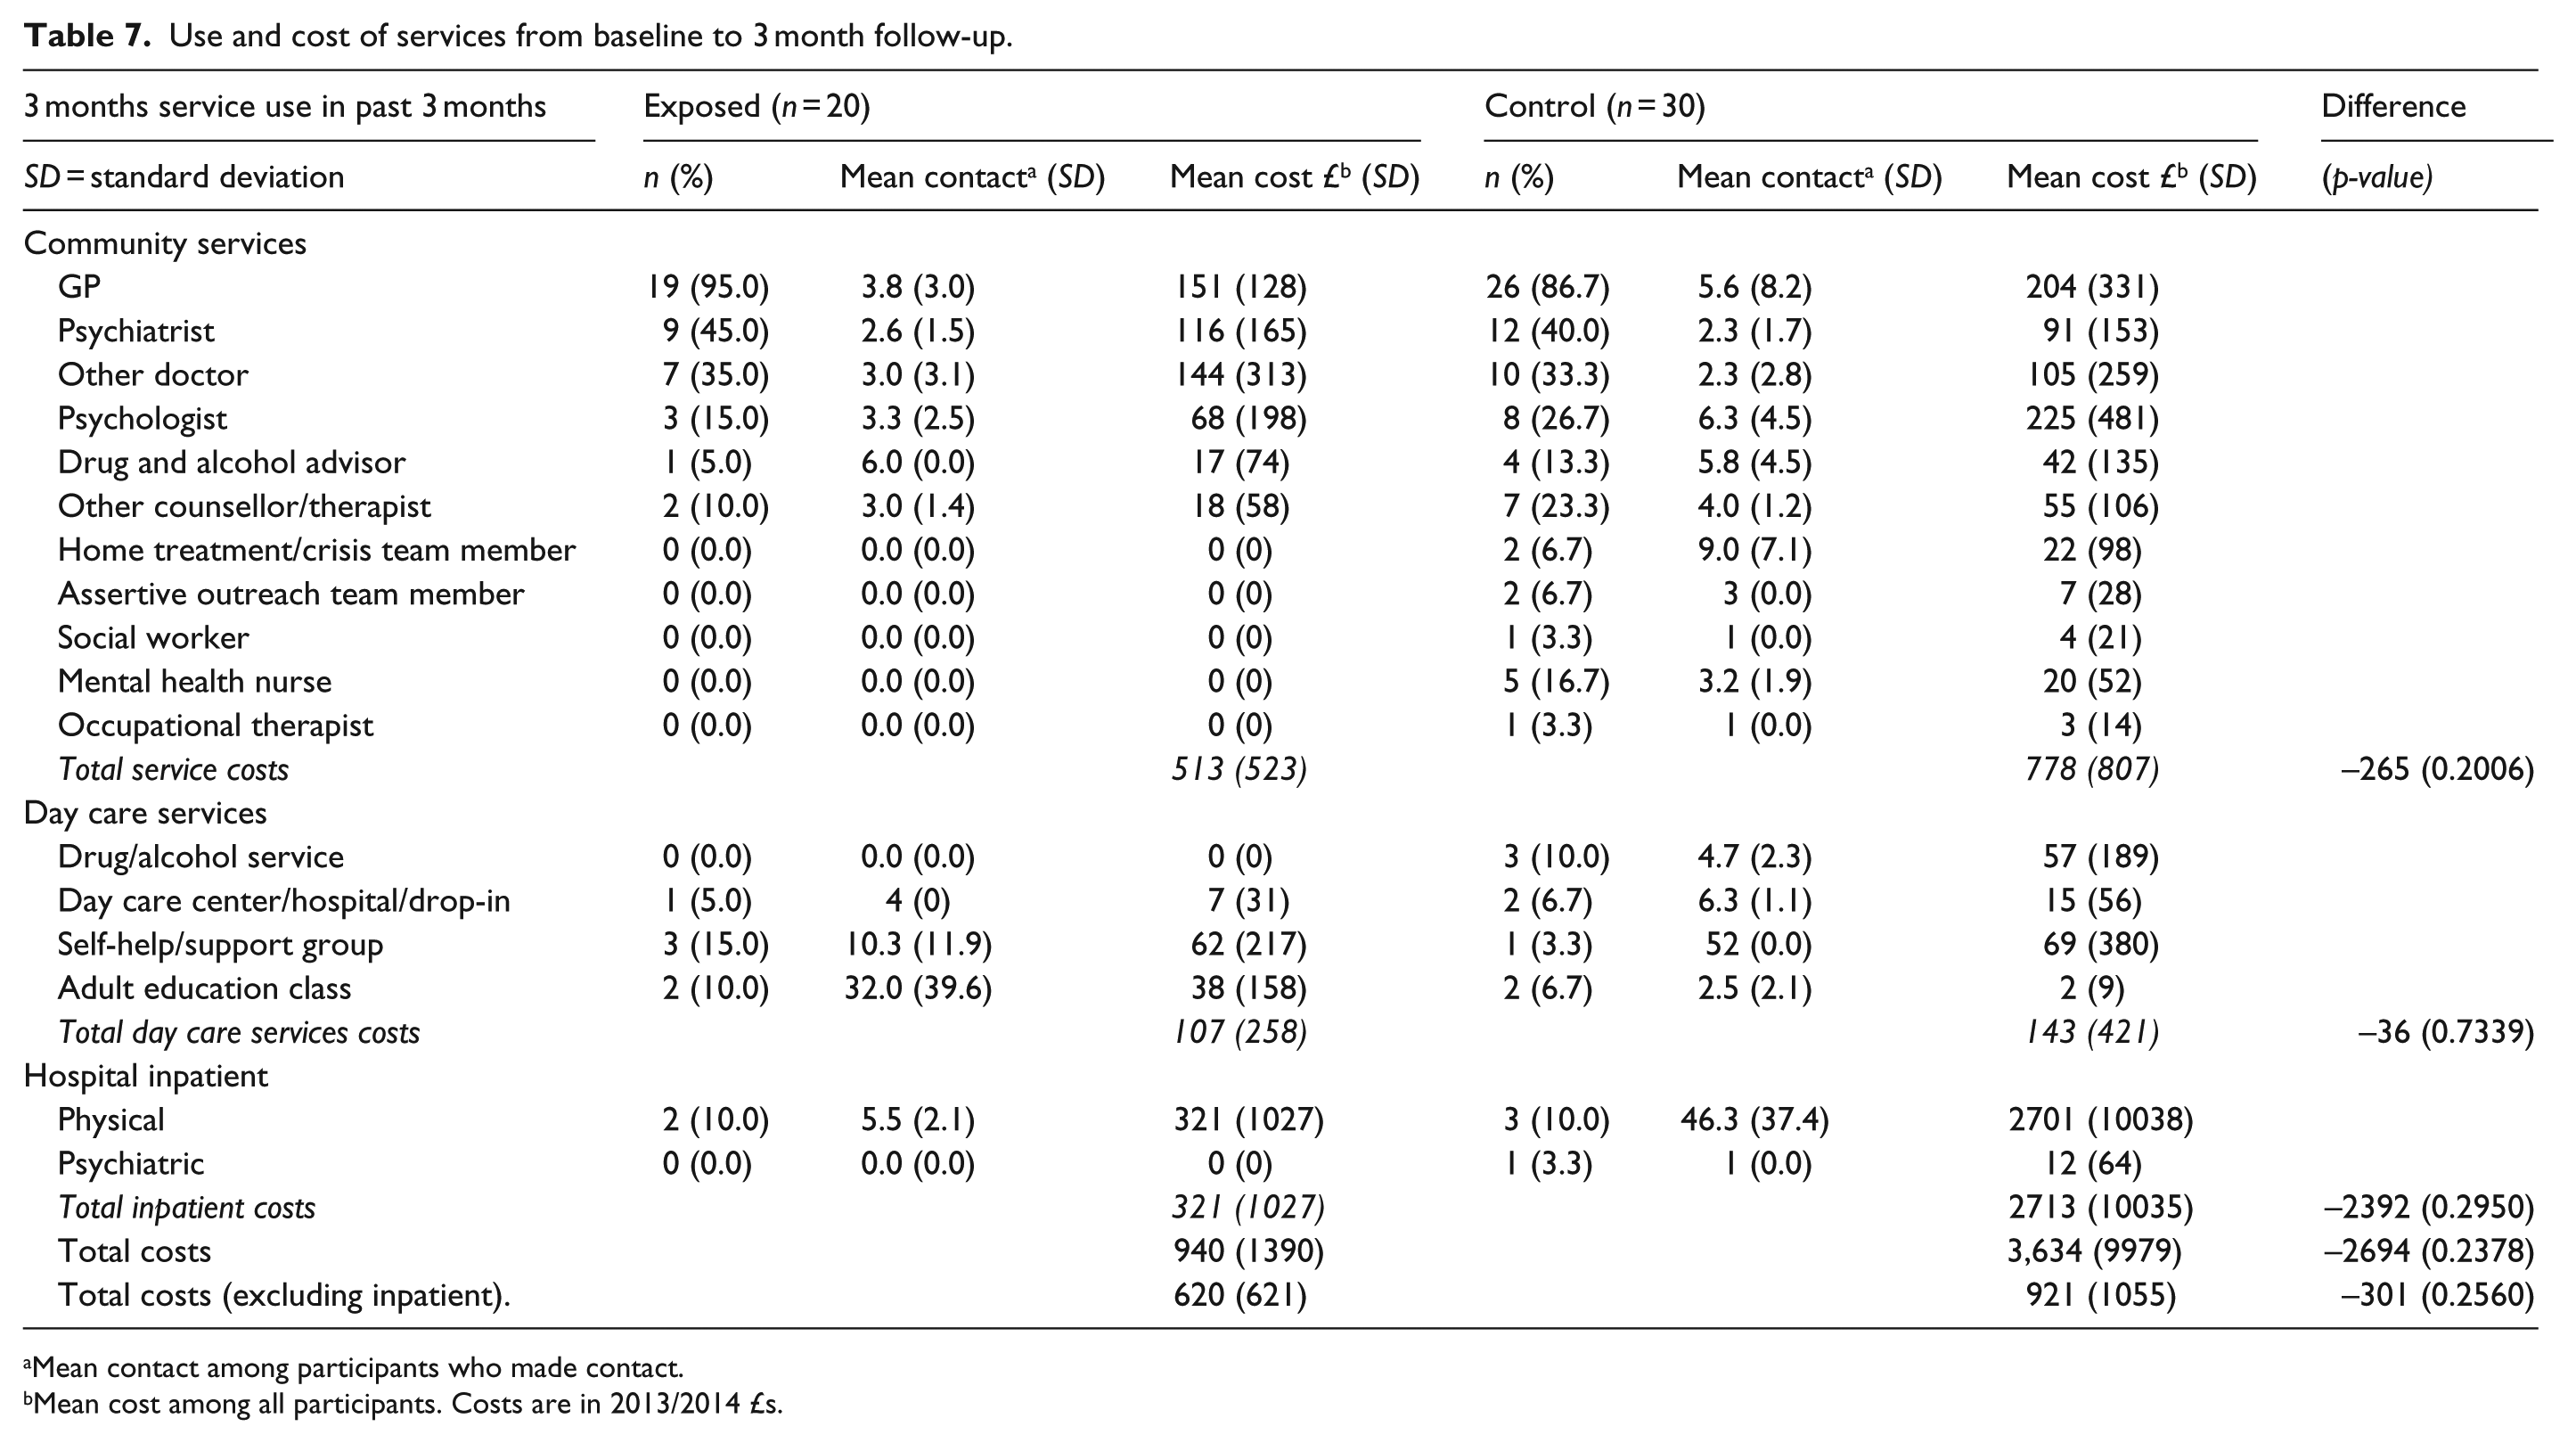
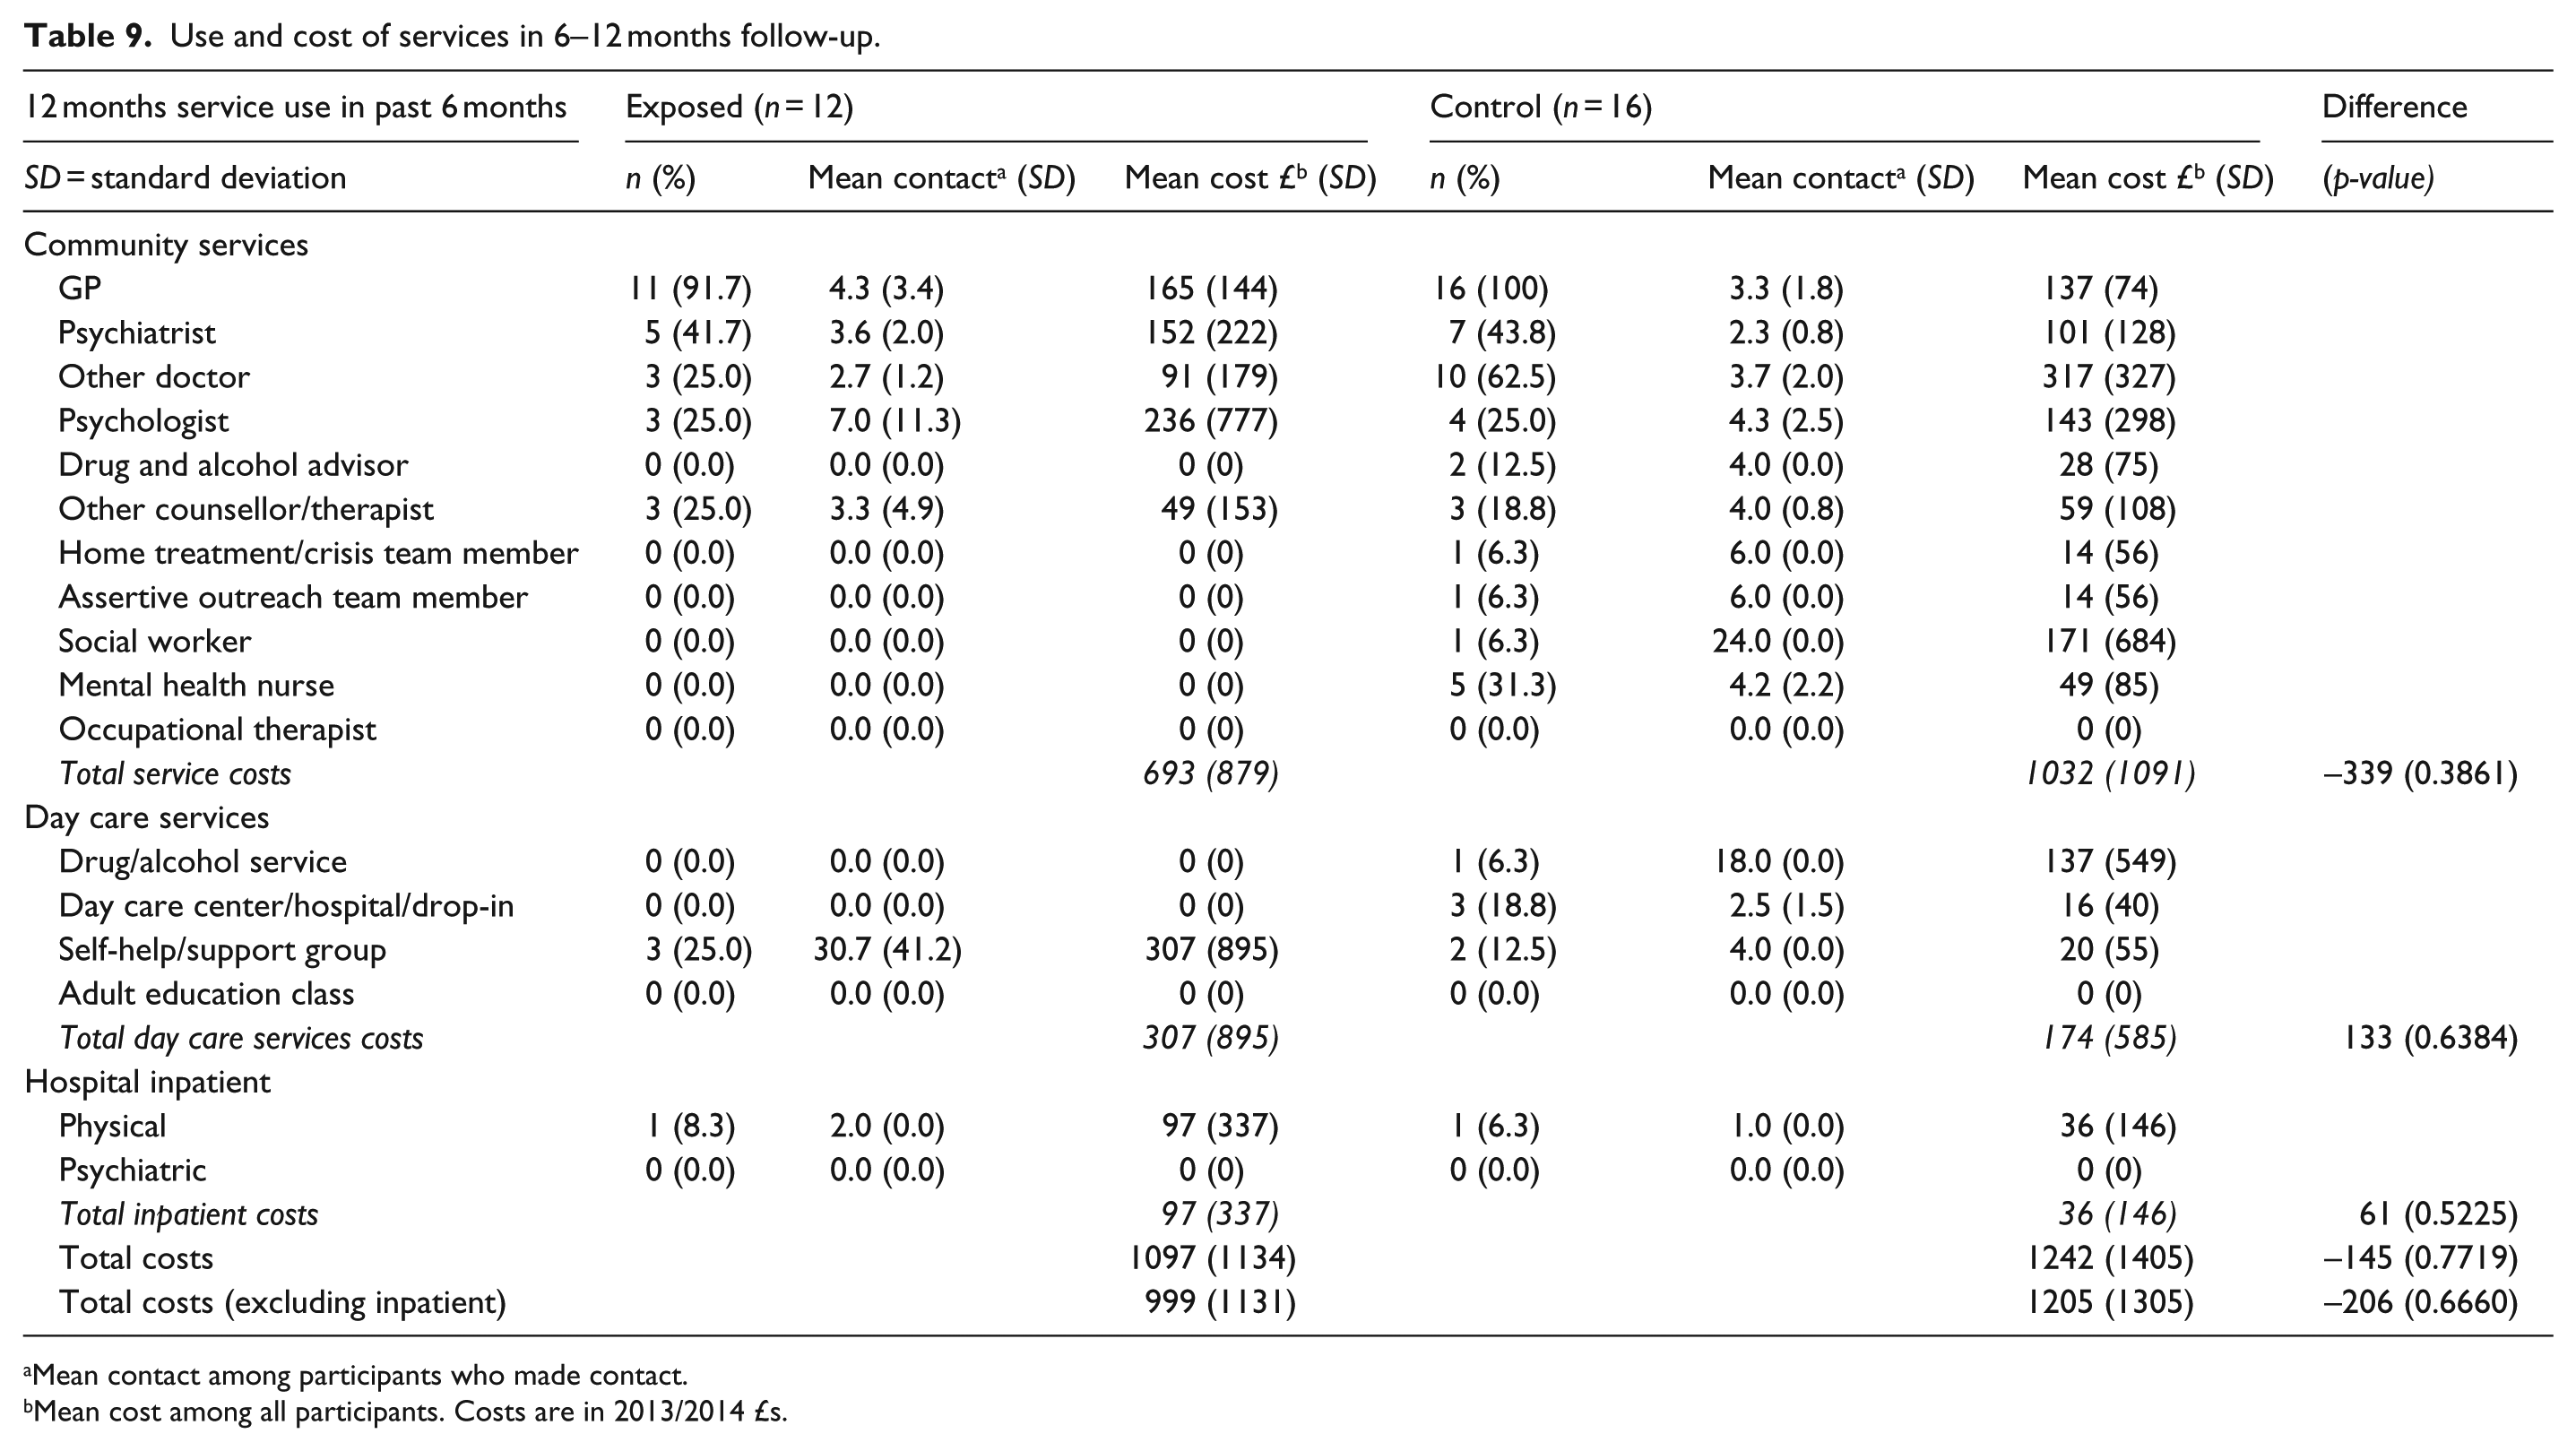
Tables 6 to 9 set out the numbers of participants using services and the mean number of contacts they had with each service. Table 6 covers service use reported for the 6 months prior to baseline, Tables 7 and 8 show data for the 3-month periods up to the 3- and 6-month follow-ups, and Table 9 shows service use for the 6 months up to the final 12-month follow-up.
Use and cost of services in 6 months prior to baseline.
GP: general practitioner.
Mean contact among participants who made contact.
Mean cost among all participants. Costs are in 2013/2014 £s.
Use and cost of services from baseline to 3 month follow-up.
Mean contact among participants who made contact.
Mean cost among all participants. Costs are in 2013/2014 £s.
Use and cost of services from 3- to 6-month follow-up.

Mean contact among participants who made contact.
Mean cost among all participants. Costs are in 2013/2014 £s.
Use and cost of services in 6–12 months follow-up.
Mean contact among participants who made contact.
Mean cost among all participants. Costs are in 2013/2014 £s.
At every time point a higher proportion of the control group used community services. For example at baseline (Table 6) higher proportions of the control group used 9 of the 11 categories of community services. High percentages of both groups saw their GPs throughout the study period (E: 84.6%–95.0%; C: 86.7%–100%) and a substantial minority in both groups had contacts with psychiatrists (E: 41.7%–46.2%; C: 33.3%–44.4%). A quarter to two-thirds of participants saw other doctors (E: 25.0%–38.5%; C: 31.1%–62.5%).
In both groups, the proportion of participants using any of the four categories of day-care services was low throughout (0%–25.0%).
Over the whole study period there were 30 hospital inpatient stays: 9 within the exposed group and 21 in the controls. Only two (both controls) were psychiatric admissions. The other 28 were all for physical health.
Cost of services used
Higher numbers of control participants seeing community health professionals lead to higher mean community costs for the control group over the duration of the study, although not for every category of community service at every time point. The exposed group had higher total costs for day care at baseline and 12 months, and for inpatient stays at 12 months. Total costs at all time points were dominated by the cost of inpatient care for a few participants. Over the study period standard deviation figures for mean total inpatient costs range from 0 to 11,037. When inpatient costs are excluded (see bottom line Tables 6 to 9) the mean total costs were consistently lower for the exposed group.
The estimated cost of the welfare benefits advice was modest: an average of £211.36 per exposed participant (eight 1-hour appointments over the 12-month study period at £26.42 per hour).
To summarise, the mean total service costs (including benefits advice and excluding inpatient stays) were higher for the control group during the 18 months assessed, but the difference at each time point was not greater than chance variation of service use in the general population.
Discussion
Anxiety and depression scores were significantly higher for the exposed group at baseline, but they did not consult their GPs or use other health services more than the controls. It is possible that the benefits advice the exposed participants received at that time had a therapeutic effect by reducing their anxiety.
The control group had significantly better wellbeing scores at baseline and 12 months, but at 6 months the exposed group had a higher mean wellbeing score. Overall the control group reported greater use and cost of services. Our findings therefore only partially support our first hypothesis that the exposed group would have: (1) poorer mental health status; (2) increased mental health service use; and (3) increased service costs compared to the control group. Throughout the study period, the proportions of exposed and control participants engaged in reassessment were similar and this may explain why our data showed little difference between the groups’ wellbeing. It is also possible that the exposed group had less contact with community mental health services because of their level of contact with the WBAS, particularly if this had a therapeutic affect as suggested above.
It was not possible to assess hypothesis two: that the loss of income and/or threatened loss of income among those undergoing the WCA would be associated with (1) worse mental health status; (2) increased mental health service use; and (3) increased service costs, because it was not possible to isolate a clear WCA-only sub-sample.
Our data is consistent with the third hypothesis, that the exposed group would have a lower income. However, the difference between the groups may simply reflect variation in counting, or not counting, Housing Benefit as income. Tenants renting in the private sector receive Housing Benefit payments to pass on to their landlords, while social housing tenants have the benefit credited directly to their rent account and may not recognise it as income. Most incomes for both groups were less than the London Living Wage (‘Living Wage Foundation’, 2013–2015).
Limitations
The control group did not allow comparison between exposed and a group currently unexposed to the assessment process. Although their advisors believed their benefits situation had been resolved, at baseline three quarters reported being engaged in claiming for, being assessed or reviewed or appealing their disability benefits. Some may have reported recent successful claims and appeals as ‘current’ but, this would still indicate that participants had been living with uncertainty about their income, and disruption or even cessation of their benefits payments.
The sample cannot be representative of a UK population of people with mental health conditions because participants were all local to Mind in Croydon and were all current or former beneficiaries of the WBAS and other services Mind in Croydon offers.
Both groups suffered significant attrition from baseline so that those surveyed at 12 months may not be representative of the samples at baseline. The drop off reflects the struggle to sustain participation for a year in the context of health and benefits problems. Where possible Mind in Croydon staff asked participants about their reasons for dropping out of the study and recorded the following responses: intrusive, unwell due to mental illness, unwell due to physical illness, moved house, too little time, too much stress, questionnaires upsetting, concerned answers would be passed to the benefits agency, and felt like they were repeating themselves (because the questions were same at every time point). It is possible that one or more participants missed study follow-ups because they were in hospital. Mind in Croydon was unable to contact participants who could not afford to maintain a telephone connection.
The participants already had a surfeit of bureaucracy with benefit claims, assessments, and appeals. Although shorter than a 55-page ESA claim form or the 24-page Capability for Work questionnaire, the length of the study questionnaires, 87 questions over 12 pages, required sustained concentration. Some questions contained unfamiliar jargon such as names of services. The service-use question about contacts with health professionals listed 11 professionals which for some were difficult distinguish (e.g. a social worker or someone from the home treatment team). It was also difficult for some to recall how many times over the past few months they had seen professionals (e.g. their GP).
Conclusion
Assessment and review of all claimants is now part of the UK welfare benefits system. Our control sample was not free from assessment and review which raises the question: are people with mental health conditions (or a combination of mental and physical conditions) being assessed and reviewed more frequently than others? Further research could be conducted to check whether parity for mental and physical health extends from health services to the benefit system. Instead of seeking a control group, a future study could follow a single cohort over a longer period. It could obtain baseline data from benefit recipients identified as not being reassessed, making additional claims or appealing (unexposed), and then follow them regularly for 3 years during which time we expect all would be exposed to at least one benefits review. Loss to follow-up could be reduced if, at each time point, the questionnaires were completed as interviews: opportunities to better explain why we repeat the same questions, to support participants as they respond to questions about their feelings, and to demonstrate that their contributions are valued.
Our data do not confirm that benefit assessments and reviews are leading to greater health service costs, but Shefer’s qualitative study (Shefer et al., 2016) of our exposed participants describes daily hardship and distress. We do not think our participants, and others with mental health conditions living independently on benefits, have sufficient security to protect their health. In the many changes to disability benefits since 1971, the objectives of security and welfare are being lost. In the absence of reform of the current system it is vital to ensure access to specialist benefits advice for people with mental health problems. The WBAS at Mind in Croydon is a model for this as it has a 98% success rate in resolving benefit problems thereby reducing worry and poverty at less cost than health services. Two other models which are also showing positive impacts on mental health and finances are to offer advice through co-location with primary care (Woodhead et al., 2017); and through home visits to socially disadvantaged older people (Haighton et al., 2019). Future research could seek to further evaluate the economic and therapeutic effects of these services.
Footnotes
Acknowledgements
The authors thank all participants and Mind in Croydon staff and volunteers who assisted with data collection. Thanks also to Alex Wylde for ascertaining reasons for dropout, to Leo Koeser for his Stata expertise and to Guy Shefer for his advice.
Funding
The author(s) disclosed receipt of the following financial support for the research, authorship and/or publication of this article: The study was funded by Trust for London through a grant to Mind in Croydon [grant number 6324]. The funders had no role in the study design, data collection, analysis or preparation of this paper.
