
Abstract
The e-readiness indexes measured by accessibility and content have typically been employed in e-government website evaluations. We present empirical evidence from four e-readiness indexes (such as accessibility, e-information, e-petition and e-participation) and the clickstream website usage data of the Korean central government units from 2003 to 2005 to evaluate whether better e-readiness induces more use of e-government websites. We find that only the e-information index was significantly correlated with website usage, and the majority of usage variations were attributable to the unit-specific effects including the nature of each unit’s public service. Our findings also indicate that the accessibility index should not be considered a key factor to evaluate e-government websites any longer, and the traditional supply-side e-government content evaluations may provide misleading information on e-government evolution.
Points for practitioners
Traditional supply-side e-government evaluations may not reflect citizens’ actual needs and use of e-government services. The e-government deployment across different units should take account of each unit’s nature of public services.
Introduction
Since the late 1990s, the surge of the Internet and the World Wide Web has led to the launch of e-government projects at all levels of government worldwide. Despite various definitions of e-government, 1 the construction and management of websites have become an essential element of e-government (Torres et al., 2005), which is believed to have the potential to shape public administration to be more citizen oriented (Schedler and Summermatter, 2007).
E-government is a recent phenomenon, but a rapidly growing field of empirical studies has tried to evaluate the performance and characteristics of e-government initiatives. This new empirical literature has put major emphasis on the evaluations of web-based e-government services, focusing on the assessment of ‘e-readiness’ in terms of accessibility (or functionality) and content. This ‘supply-side’ evaluation approach may be understood as an adaptation of the Technology Acceptance Model (TAM) in the literature on Information Systems. 2 In the TAM, perceived ease of use and perceived usefulness have been considered fundamental in determining the acceptance and use of Information Technology (IT). Accordingly, in the evaluation of e-government, it has been alleged that the acceptance and use of e-government is mainly determined by the typical e-readiness indexes, such as accessibility and content, which have been treated as proxy variables for perceived ease of use and perceived usefulness of e-government services.
However, to our knowledge, no evidence has been provided to support the alleged positive correlation between e-readiness and e-government website usage. Indeed, we have reasons to be concerned that e-readiness, which measures the deployment of e-government, may have a weak (or even negative) correlation with citizens’ actual usage of e-government websites. 3 As pointed out by Fountain (2001), public managers may have a disincentive for successful deployment of IT, while as discussed in Coursey and Norris (2008), overspending may occur due to e-government enthusiasm. Hence, e-government deployment may not be in line with actual website usage. In this article, for the first time, we present empirical evidence from e-readiness indexes and the clickstream website usage data of the Korean central government units from 2003 to 2005 to evaluate the correlation between e-readiness and website usage.
A concern for the appropriateness of typical e-government models is shared by our study and Coursey and Norris (2008) which, based on surveys of municipalities, tested whether the e-government evolution models are consistent with empirical evidence from the actual developments of local e-government in the United States. However, our focus is on citizens’ actual usage instead of what the content on the websites are and how they are accessed. Our study also differs from Coursey and Norris (2008) and others since we study central government units. 4 As noted in Coursey and Norris (2008), municipalities are differentiated by population size and the executive form of government and are often faced with a lack of financial resources and web staff. However, the central government units are more homogeneous in these aspects and are better financed for e-government projects. For instance, about 0.7 percent of the budget of the Korean central government from 2003 to 2005 was spent on e-government. However, unlike municipalities, the central government units are differentiated by the public services which they provide.
In order to consider the extent to which the nature of public services provided by different central government units affects citizens’ usage of their websites, 5 we will treat the nature of public service as a unit-specific effect, conducting panel data regressions. However, our panel data analysis is confined to the period between 2003 and 2005 because the e-readiness indexes at the unit level of the Korean central government were made available only from 2003 to 2005. However, as will be discussed in the section on the regression results, we have reasons to believe that the conclusions of the article will remain unchanged even if our data set expands to more recent years.
In our regression analysis, we also will take account of the effects of organizational factors on citizens’ usage of e-government websites. As discussed in Brudney and Selden (1995) and Schedler and Summermatter (2007), among the organizational factors, the size of an organization is likely to be correlated with its innovative ability and exploration of citizens’ need. Brudney and Selden (1995) also found that a local government with a professional manager was more likely to use computer technology extensively. In the case of the central Korean government, almost all the units have professional e-government staff, and thus we direct our attention to the effect of kinds of leadership by the unit head with regard to e-government. In Korea, the heads of the central government units (usually called ministers, commissioners or administrators) are typically appointed from among bureaucrats and experts (including professors, researchers and businessmen in the related fields) as well as politicians. Hence we will control the types of unit heads as well as the size effect in our regression analyses.
The Korean case is well suited to our study for a couple of reasons. First, Korea has a very high broadband penetration rate and is well known for rapid and huge investments in the e-government infrastructure. In 2008, Korea had the sixth highest broadband penetration rate among the OECD countries 6 and was ranked at the sixth highest position by the UN for e-government readiness. 7 Second, website usage data of the central government units can be calculated from citizens’ clickstream data which were collected by KoreanClick, an Internet research and consulting company. The clickstream data are real-time surfing records of the entire websites by representative Internet users and have been widely used in the study of consumer behavior and demands in the literature of e-commerce (see, for example, Moe and Fader, 2004). By contrast, e-government evaluation studies have typically relied on survey data which are prone to missing information and low response rates, and thus the results should be viewed with caution. As will be detailed in the ‘Data and descriptive statistics’ section, the clickstream data are obtained from the real-time behavior of the sample users who are carefully selected to represent the Internet user population. Hence the clickstream data are more accurate with no missing information.
Literature review of e-government evaluations
The literature on e-government evaluations is a rapidly growing field of empirical studies. A major focus of this literature lies on the assessment of accessibility (or functionality) of e-government websites. For instance, Petricek et al. (2006) developed some measures such as navigability and nodality, and quantitatively evaluated the structure of e-government websites, while Jaeger (2006) suggested a multi-method approach to evaluate website accessibility, including policy analysis, expert testing, user testing, automated testing and Webmaster questionnaires. Based on website accessibility guidelines, accessibility tools, and survey to Webmasters, Abanumy et al. (2005) evaluated e-government website accessibility in Saudi Arabia and Oman. Peters et al. (2004) argued that website evaluation criteria developed for e-commerce sites might be applied to e-government sites. More recently, Yu and Parmanto (2011) evaluated accessibility in a comparison of 50 US state government websites with federal government and randomly selected commercial websites.
Another focus is on the analysis of the contents or services offered by e-government websites. For instance, Torres et al. (2005) gathered information from the websites of 33 EU cities on the depth and breadth of services offered online. Choudrie et al. (2004) evaluated the quality and privacy (as well as accessibility) of e-government portals of five nations ranked as the best practice countries by Accenture in 2002. Holzer and Kim (2003), on the other hand, extended the assessment of functionality to include security and privacy, usability, content, services, and citizen participation, and then evaluated 84 official websites out of the 100 possible cities with an online population greater than 100,000.
The e-government evolution is another major topic in the literature and has been evaluated mainly by content or from the survey data of citizens’ adoption. Moon (2002) and Edmiston (2002) provided descriptive studies of local e-government and found that local governments had barely surpassed the information dissemination stage. Holden et al. (2003) and Ho (2002) extended these previous studies and provided statistical tests on e-government adoption, finding that e-government was past the initial stage of information dissemination. Reddick (2005) acknowledged some initial movement from street-level to system-level bureaucracies. However, Thomas and Streib (2003) found that citizens used government websites more often to obtain information than to make transactions, and Coursey and Norris (2008) indicated that as of 2004, local e-governments in the United States were mainly informational with a few transactions, but virtually no indication of high-level functions.
Other studies have paid attention to the interaction between user characteristics and government unit characteristics. Typically, a log file analysis is used for the study of user characteristics (Zawitz, 1998). Based on a case study of citizens’ information-seeking activities on the Syracuse City School District website, Wang et al. (2005) explored the reasons why some websites succeed or fail to help citizens find their needed information. Cullen and Hernon (2004) conducted focus group interviews and obtained views on e-government services from various socioeconomic groups. Schedler and Summermatter (2007) surveyed the local governments in Switzerland and found big differences in exploring customer needs for e-government services among municipalities, which can be partly explained by the general characteristics of municipalities and different degrees of support from administrative leaders and politicians. These studies, however, have not incorporated citizens’ needs into performance comparison across different e-government websites.
Recently, Rorissa et al. (2011) and Papadomichelaki and Mentzas (2012) acknowledged the importance of citizens’ needs in evaluating e-government websites, putting an emphasis on the quality of websites. Kunstelj et al. (2009) paid attention to the fact that the supply of e-government services is being increasingly enhanced but does not meet user expectations, and suggested a set of indicators observed through a citizen satisfaction survey. However, these articles fell short of relating citizens’ actual website use to their needs and satisfaction. In this article, we utilize the clickstream data of the Korean central government units to evaluate e-government performance and evolution from citizens’ actual website usage.
Data and descriptive statistics
In this section, we begin by briefly explaining the institutional background of the Korean central government and then provide descriptions of the data used in the article.
Institutional background
From 2003 to 2005, there were 22 (executive) ministries in the Korean central government, including the Government Information Agency. These ministries are typically responsible for the formulation and implementation of government policies in their respective policy areas. Besides the ministries, there were 16 functionally independent agencies and administrations whose scope of activities is relatively narrow and specific. 8 These agencies and administrations (called ‘sub-ministries’ in the article) are typically headed by vice-minister-level administrators and are formally under the supervision of the affiliated ministers. Although the agencies and administrations are typically categorized as sub-ministries in English translation, they operate independently of the affiliated ministries, have separate budgets, provide distinct public services, and have their own websites and domain names. In addition, the Korean central government has administrative commissions such as the Civil Service Commission, the Fair Trade Commission, the Financial Supervisory Commission, the Ombudsman of Korea, and the Commission on Youth Protection. The administrative commissions and the executive ministries are called ‘ministries’ in the article. In the Appendix, we provide the missions as well as the full names and the abbreviations of ministries and sub-ministries of the Korean central government in 2003.
Data description
For citizens’ usage of e-government websites, we employ clickstream data collected by KoreanClick, which is a leading Internet research and consulting company in Korea and a provider of the KoreanClick clickstream data to various domestic and foreign clients including Google, Microsoft, and Samsung. 9 To accurately represent the Internet user population in its clickstream data, KoreanClick conducts biannual telephone surveys and calculates the Internet user population in the grid of socioeconomic information such as age, occupation, education, income, and location. Then KoreanClick samples households (and adjusts this sample) accordingly and assigns different identifications to all Internet users of each selected household. This sample of individual Internet users is called the KoreanClick Panel, whose clickstream data are collected by the software program (called iTrack) installed in the Panel members’ PCs at home and at the workplace. 10 Hence, KoreanClick clickstream data are real-time surfing records of the entire websites by the Panel members.
A citizen’s usage of a website can be typically measured in the clickstream data by either finding out whether the user has visited the site during the time period concerned or calculating the duration of his/her visits to the site. 11 Aggregating all the Panel members’ usage, the KoreanClick calculates the number of citizens who have visited a particular Korean central government unit’s website in a year (called ‘number of visitors’ in the article) and the sum of the duration of visits by these citizens (called ‘duration of visits’ in the article). 12 These aggregate usage data of the Korean central government units were made available to us. KoreanClick provided us with the website usage of 39 units out of the 43 central government units in 2003, 41 units in 2004 and 42 units in 2005. 13 For these units, we have e-readiness indexes and budget information as well. However, since the National Maritime Police Agency has usage data for 2005 only, we have to exclude it from our panel data, and thus the total number of observations is 121 in our data set.
As discussed in the literature review, the e-readiness indexes typically include a technical evaluation called accessibility and content evaluations. During the time period concerned (from 2003 to 2005), the Korean government sponsored a research project which collected the data of all central government units for accessibility and three indexes of content such as e-information, e-petition and e-participation. 14
The accessibility index in this government-sponsored project aimed to measure the ease and convenience of the use of e-government websites by citizens and was evaluated in 60 items in eight categories such as interoperability, readability, structural consistency, navigability, structure, modality, convenience, and Web design. Each of the 60 items was evaluated by four experts on a 5-point Likert scale, and the average points of these eight categories were aggregated into the 100-point scale accessibility index via category weights which were determined through a survey of 28 experts. For content, the e-information index measured online cataloguing of information on policies, related laws, work plans, budgets, and related documents while the e-petition index focused on online the petition procedure including online consultation, and the e-participation index dealt with online polls and votes, online discussions, and online policy proposals. The indexes for e-information, e-petition and e-participation were calculated from 41, 19 and 21 items, respectively. 15 Each of these items was also evaluated by four experts on a 5-point Likert scale, and then the average point of the item evaluations was converted to a 100-point scale index.
As a control variable for size effect, we will employ the total budget of each government unit, which is available on the National Assembly website. 16 The budget of the Korean central government consists of a General Account and many Special Accounts. Separately from the budget, the government also operates a number of Funds, which are established for stable long-term financing or flexible, responsive management of financial resources for certain specific projects. In this article, the sum of the budget and Funds will be called the ‘total budget’. 17 Finally, to see whether different types of unit head affect the provision of citizen-oriented e-government services, we will employ dummy variables for the three types of heads of central government units such as politicians, experts and bureaucrats. Our data indicate that 52.1 percent of heads of the central government units were bureaucrats, 17.4 percent politicians, and 30.6 percent experts during the years concerned.
Summary statistics and simple correlations
Some statistics for the Korean central government units for 2003–05
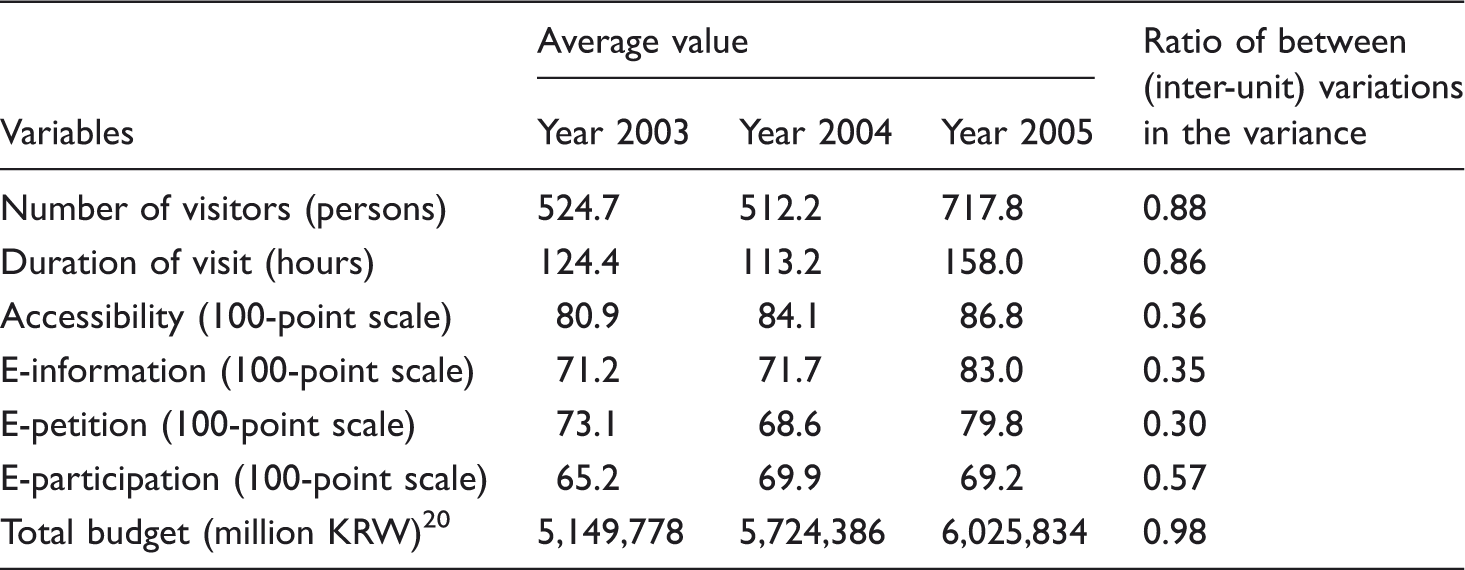
From Table 1, it is interesting to note that e-petition turned out to be almost as good as e-information in the Korean central e-government. Hence, we may infer that the central e-government in Korea might have surpassed the stage of information dissemination if we judge the Korean central e-government only from website content. In the studies of local e-government evolution, typically e-transactions, which include filing of tax returns, renewal of a driver’s license or auto registration, getting fishing or hunting licenses, and paying a fine on websites, has been considered to be the next stage following e-information. However, these transactions are typical matters of local governments, and thus in the central e-government evaluations, e-petition is considered instead. 21
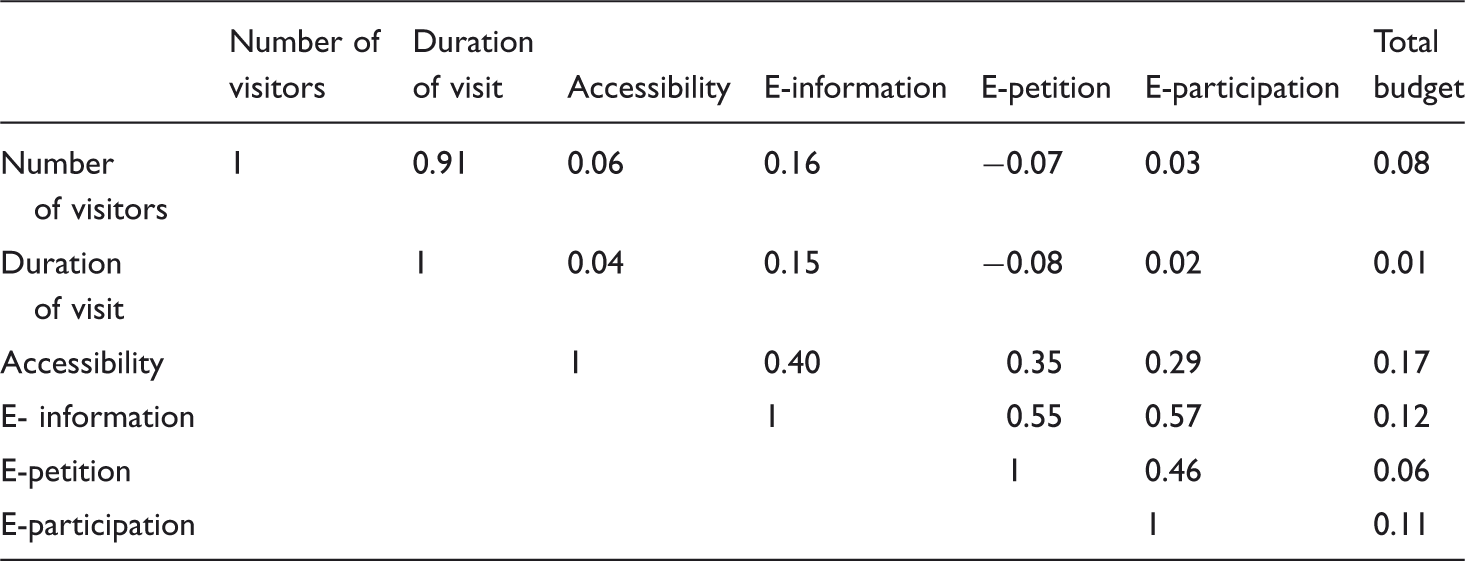
Simple correlation coefficients
Regression results
The correlation coefficients in Table 2 are not complete since they do not take account of the unit-specific effect and other control variables. In order to take account of the unit-specific effect as well as other control variables, we need to use panel data regression analyses.
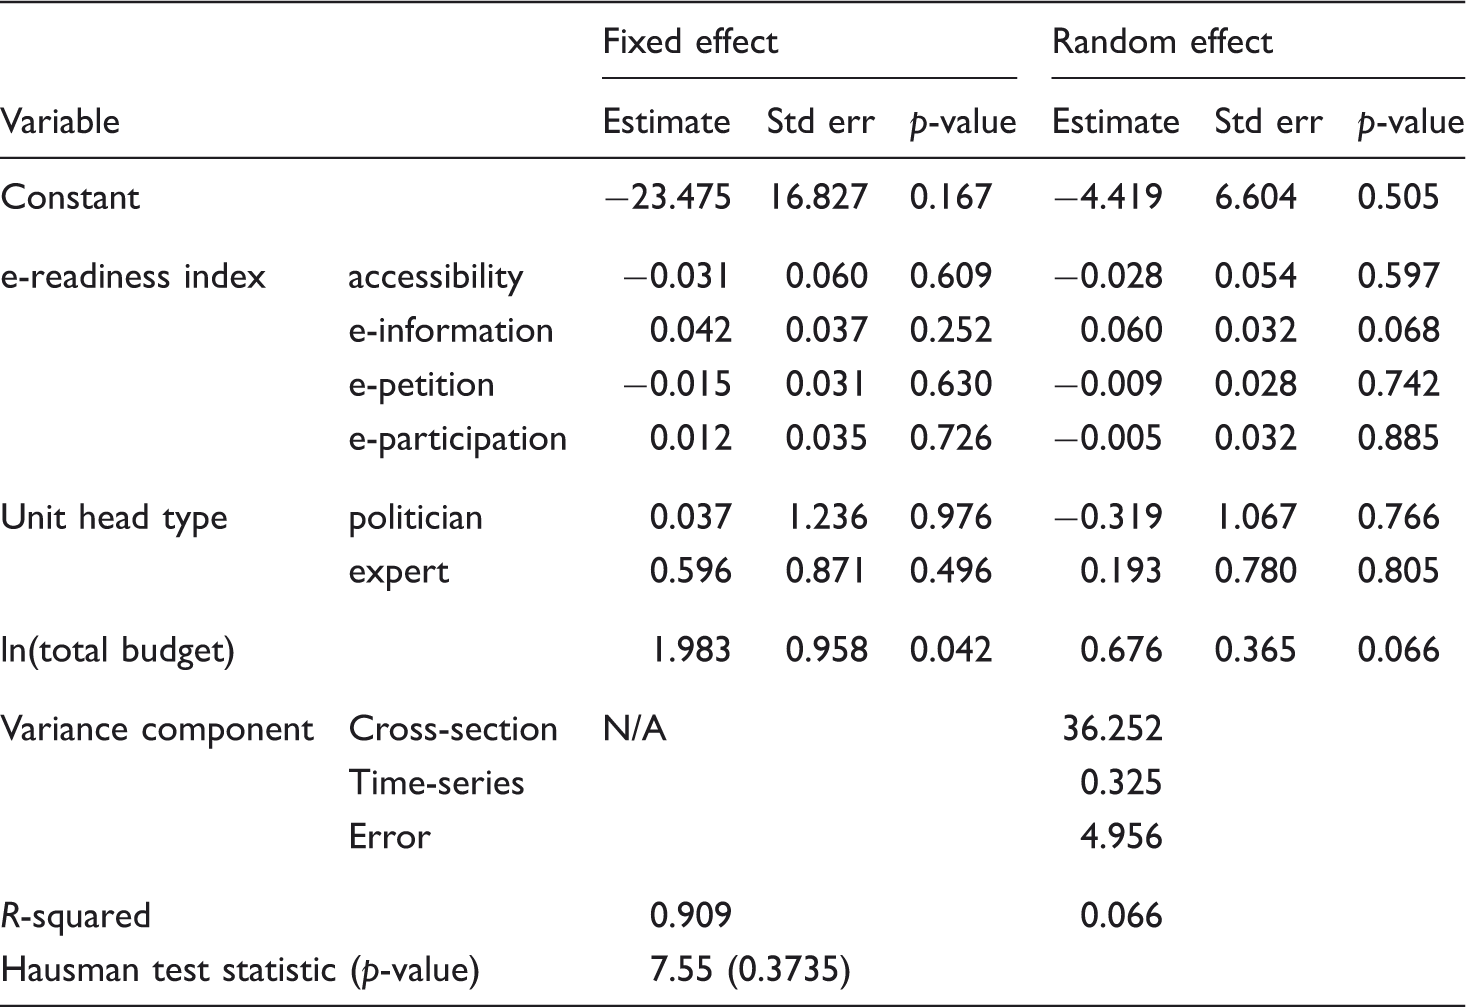
Regression results (number of unique visitors: hundred persons)
Regression results (duration of visit: hours)
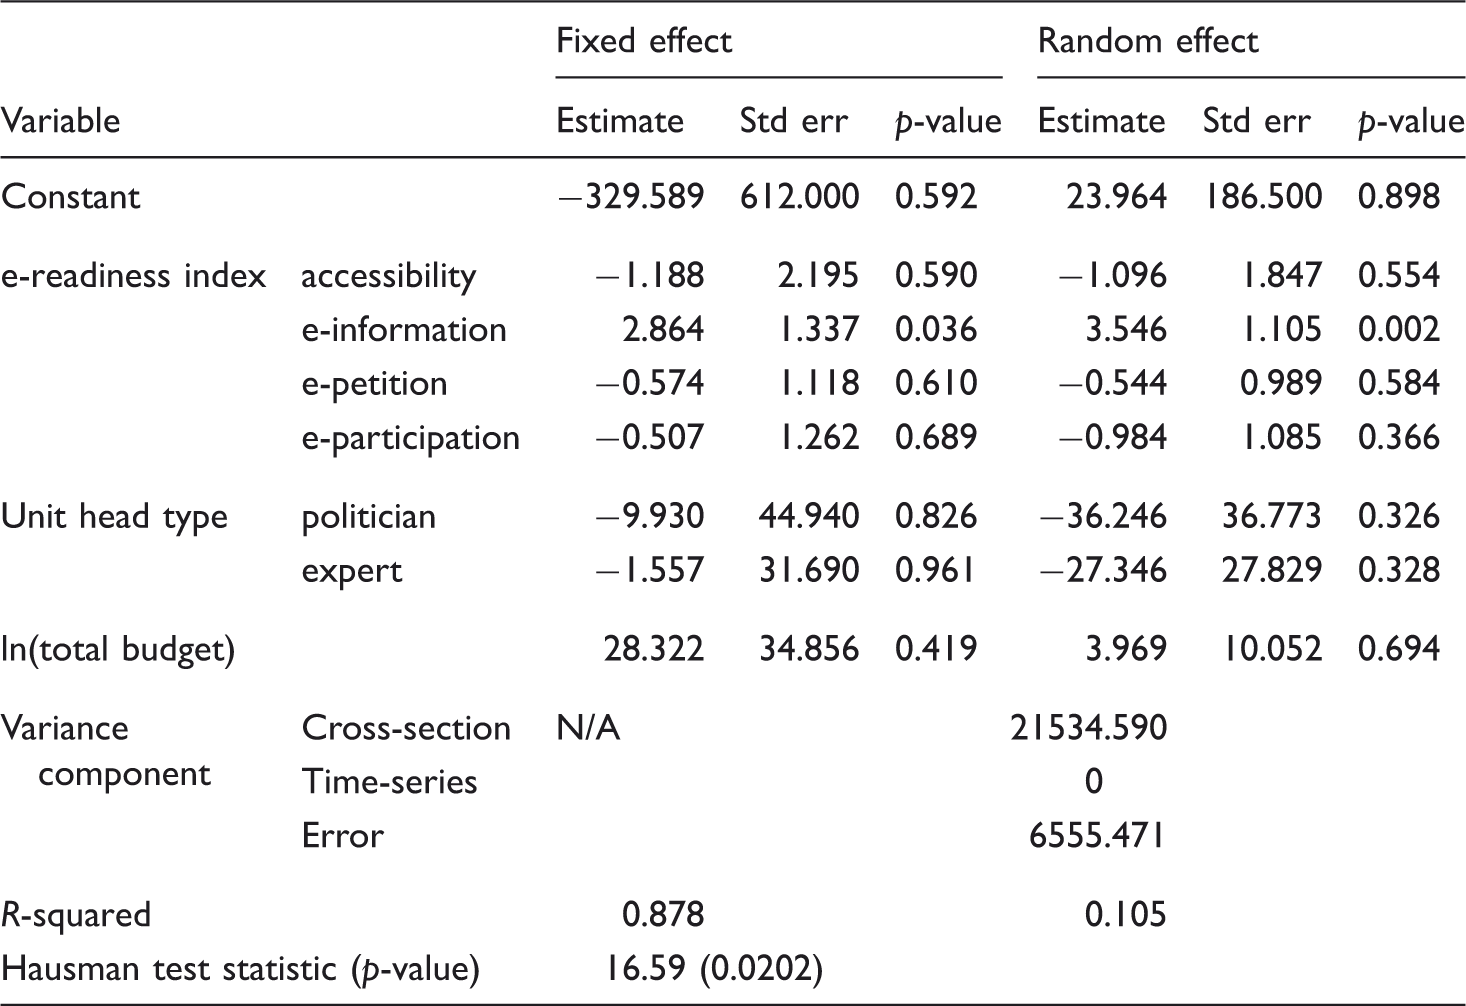
Our estimation results indicate that the e-information index is the only statistically significant e-readiness index in explaining citizens’ usage of central e-government in Korea. This is a striking finding, considering that (i) the accessibility index has been considered a key factor in evaluating e-government websites 24 and (ii) e-petition readiness was almost as good as e-information readiness in the Korean central e-government. Moreover, despite the statistical significance of the e-information index, its quantitative effect on citizens’ usage was very limited. The estimates of the random-effect model predict that a 10-point increase in the e-information index will add only 60 more visitors and 35 more hours of duration of visit to a central e-government unit per year.
Indeed, our estimation results indicate that citizens’ usage of central e-government is mainly explained by the unit-specific effects, including the nature of each unit’s public service, since (i) the R2 value of the random-effect model is very low while that of the fixed-effect model is very high, and (ii) the variance component for cross-sections accounts for the most of variance in the random-effect model. Therefore, we can infer that the majority of usage variations were attributable to the nature of the public service provided by each unit, and the e-readiness indexes were barely correlated with citizens’ usage of central e-government in Korea.
As shown in Table A2 in the Appendix, the central government units, whose sites were used more by citizens due to the nature of their public services, include the NPA (National Police Agency), the NTS (National Tax Service), the GIA (Government Information Agency), the MA (Meteorological Administration), the MOLEG (Ministry of Legislation), the MMA (Military Manpower Administration), the CSC (Civil Service Commission), and the NSO (National Statistical Office). From these websites, citizens typically obtain a variety of information. For example, citizens can obtain driver license renewal information from the NPA website, various statistics from the NSO website, military listing information from the MMA website, public officer recruitment information from the CSC website, policy information and related data from the GIA website, and information regarding legislative bills from the MOLEG website. On the other hand, the NTS website mainly works as a gateway to the related sites including tax filing sites and tax-related information sites.
The estimation results in Tables 3 and 4 also show that the types of unit head were not correlated with citizens’ usage, which implies that these types were not relevant to the provision of more citizen-oriented e-government services. On the other hand, the size of a central government unit, measured by the logarithm of total budget, turned out to be statistically significant in explaining the number of visitors to the unit. The unit size may matter because it is proportional to the variety of public services which the unit provides or because large units are more likely to explore customer needs as discussed in Schedler and Summermatter (2007).
As discussed in the Introduction, our data set is a dated one due to the availability of e-readiness indexes. The e-readiness indexes in our data indicate that the Korean central e-government was already in an advanced stage in the years 2003 to 2005, and the Korean central government has introduced a score of e-government services over the last few years to remain at the top of the e-government performance rankings. However, the Clickstream data show that e-government website usage has decreased a little from 2006 to 2010. 25 Hence our conjecture is that the conclusions of the article will remain unchanged even if our data set expands to the recent years.
Implications and conclusion
The regression results reported in Tables 3 and 4 suggest that traditional e-government evaluations based on website content may provide misleading information on the actual stage of e-government evolution. As far as content is concerned, the central e-government provided online petition services on their websites which were almost as good as information dissemination services (see Table 1). In addition, the central e-government units adopted many features for citizen participation via their websites. Hence, the traditional e-government evaluations based on content indicate that the central e-government in Korea has already surpassed the information dissemination stage. However, it turns out that only the e-information index was relevant to citizens’ actual usage and government units which provide more citizen-oriented information attract more citizens’ usage, suggesting that citizens typically used the central e-government units to obtain information. That is, from the viewpoint of citizens’ use, the Korean central e-government was still at the stage of information dissemination even in 2005. 26
Government units with significant and positive unit-specific estimates
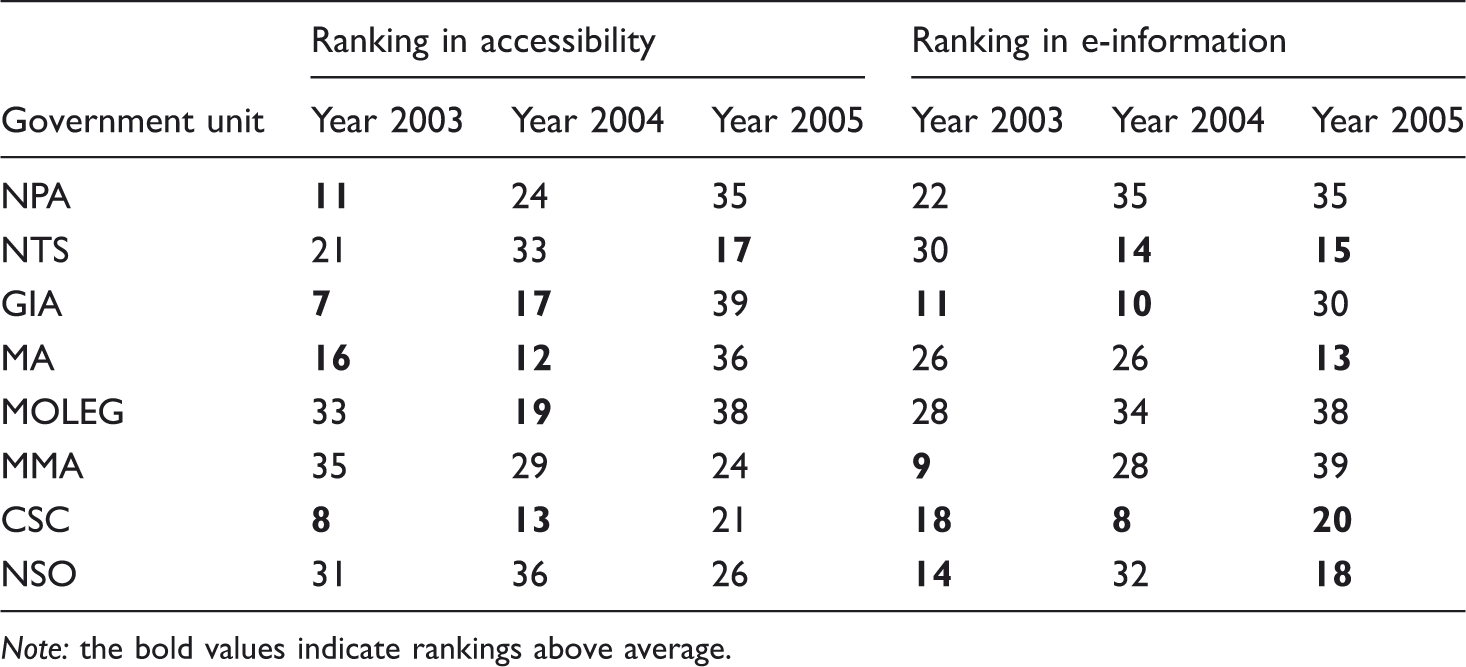
Note: the bold values indicate rankings above average.
E-government has been believed to make public administration more citizen oriented. However, our empirical findings indicate that e-government deployment, measured by e-readiness, was not in line with actual website usage by citizens at least in the Korean central e-government. Further research is invited to investigate specific organizational failures in the deployment of e-government service. 27