
Abstract
Ventilated cavitation can enhance the performances of various vehicles, including hydrofoil ships. Partial cavitation can reduce the drag coefficients of hydrofoils. For natural partial cavitation of specially designed hydrofoils this reduction is coupled with a significant increase of their lift. The intention to obtain a similar enhancement at smaller vehicle speeds using ventilation of hydrofoil by air looks natural. However, for hydrofoil ventilated cavitation the lift increase at the same cavitation numbers is substantially smaller. The physics of this lift difference is explained here via numerical analysis of the data obtained in water tunnel during experiments with the specially designed hydrofoil OK2003. The unavoidable lift difference is caused by a decrease of medium density downstream of the ventilated cavity due to the air escape from it.
Introduction
As described by Sverchkov,
1
Gorbachev and Amromin,
2
and Zverkovsky et al.
3
in particular, ventilated cavities maintained with the artificial air supply (lubrication) can be beneficial for the performances of various kinds of vehicles. Also, the examples of hydrofoil lift increase by partial cavitation can be found in many sources, from the quite old book by Knapp et al.
4
to the recent paper by Garg et al.
5
This effect is caused by the increases in the effective hydrofoil thickness and camber. Their increases occur because of the displacement of liquid from the hydrofoil surface by growing cavities. Of course, a significant increase of the lift due to partial cavitation (like reported in Kopriva et al.
6
for the hydrofoil OK2003) requires a special design technique explained later by Amromin
7
in more detail. Such a design allows for substantial drag reduction due to both friction reduction over the part of the hydrofoil surface located under the cavity and suppression of the re-entrant jet in the cavity tail (this jet causes a drag penalty). The measured lift to drag ratio C

Comparison of cavitation effect on lift to drag ratio of two hydrofoils at α = 7°.
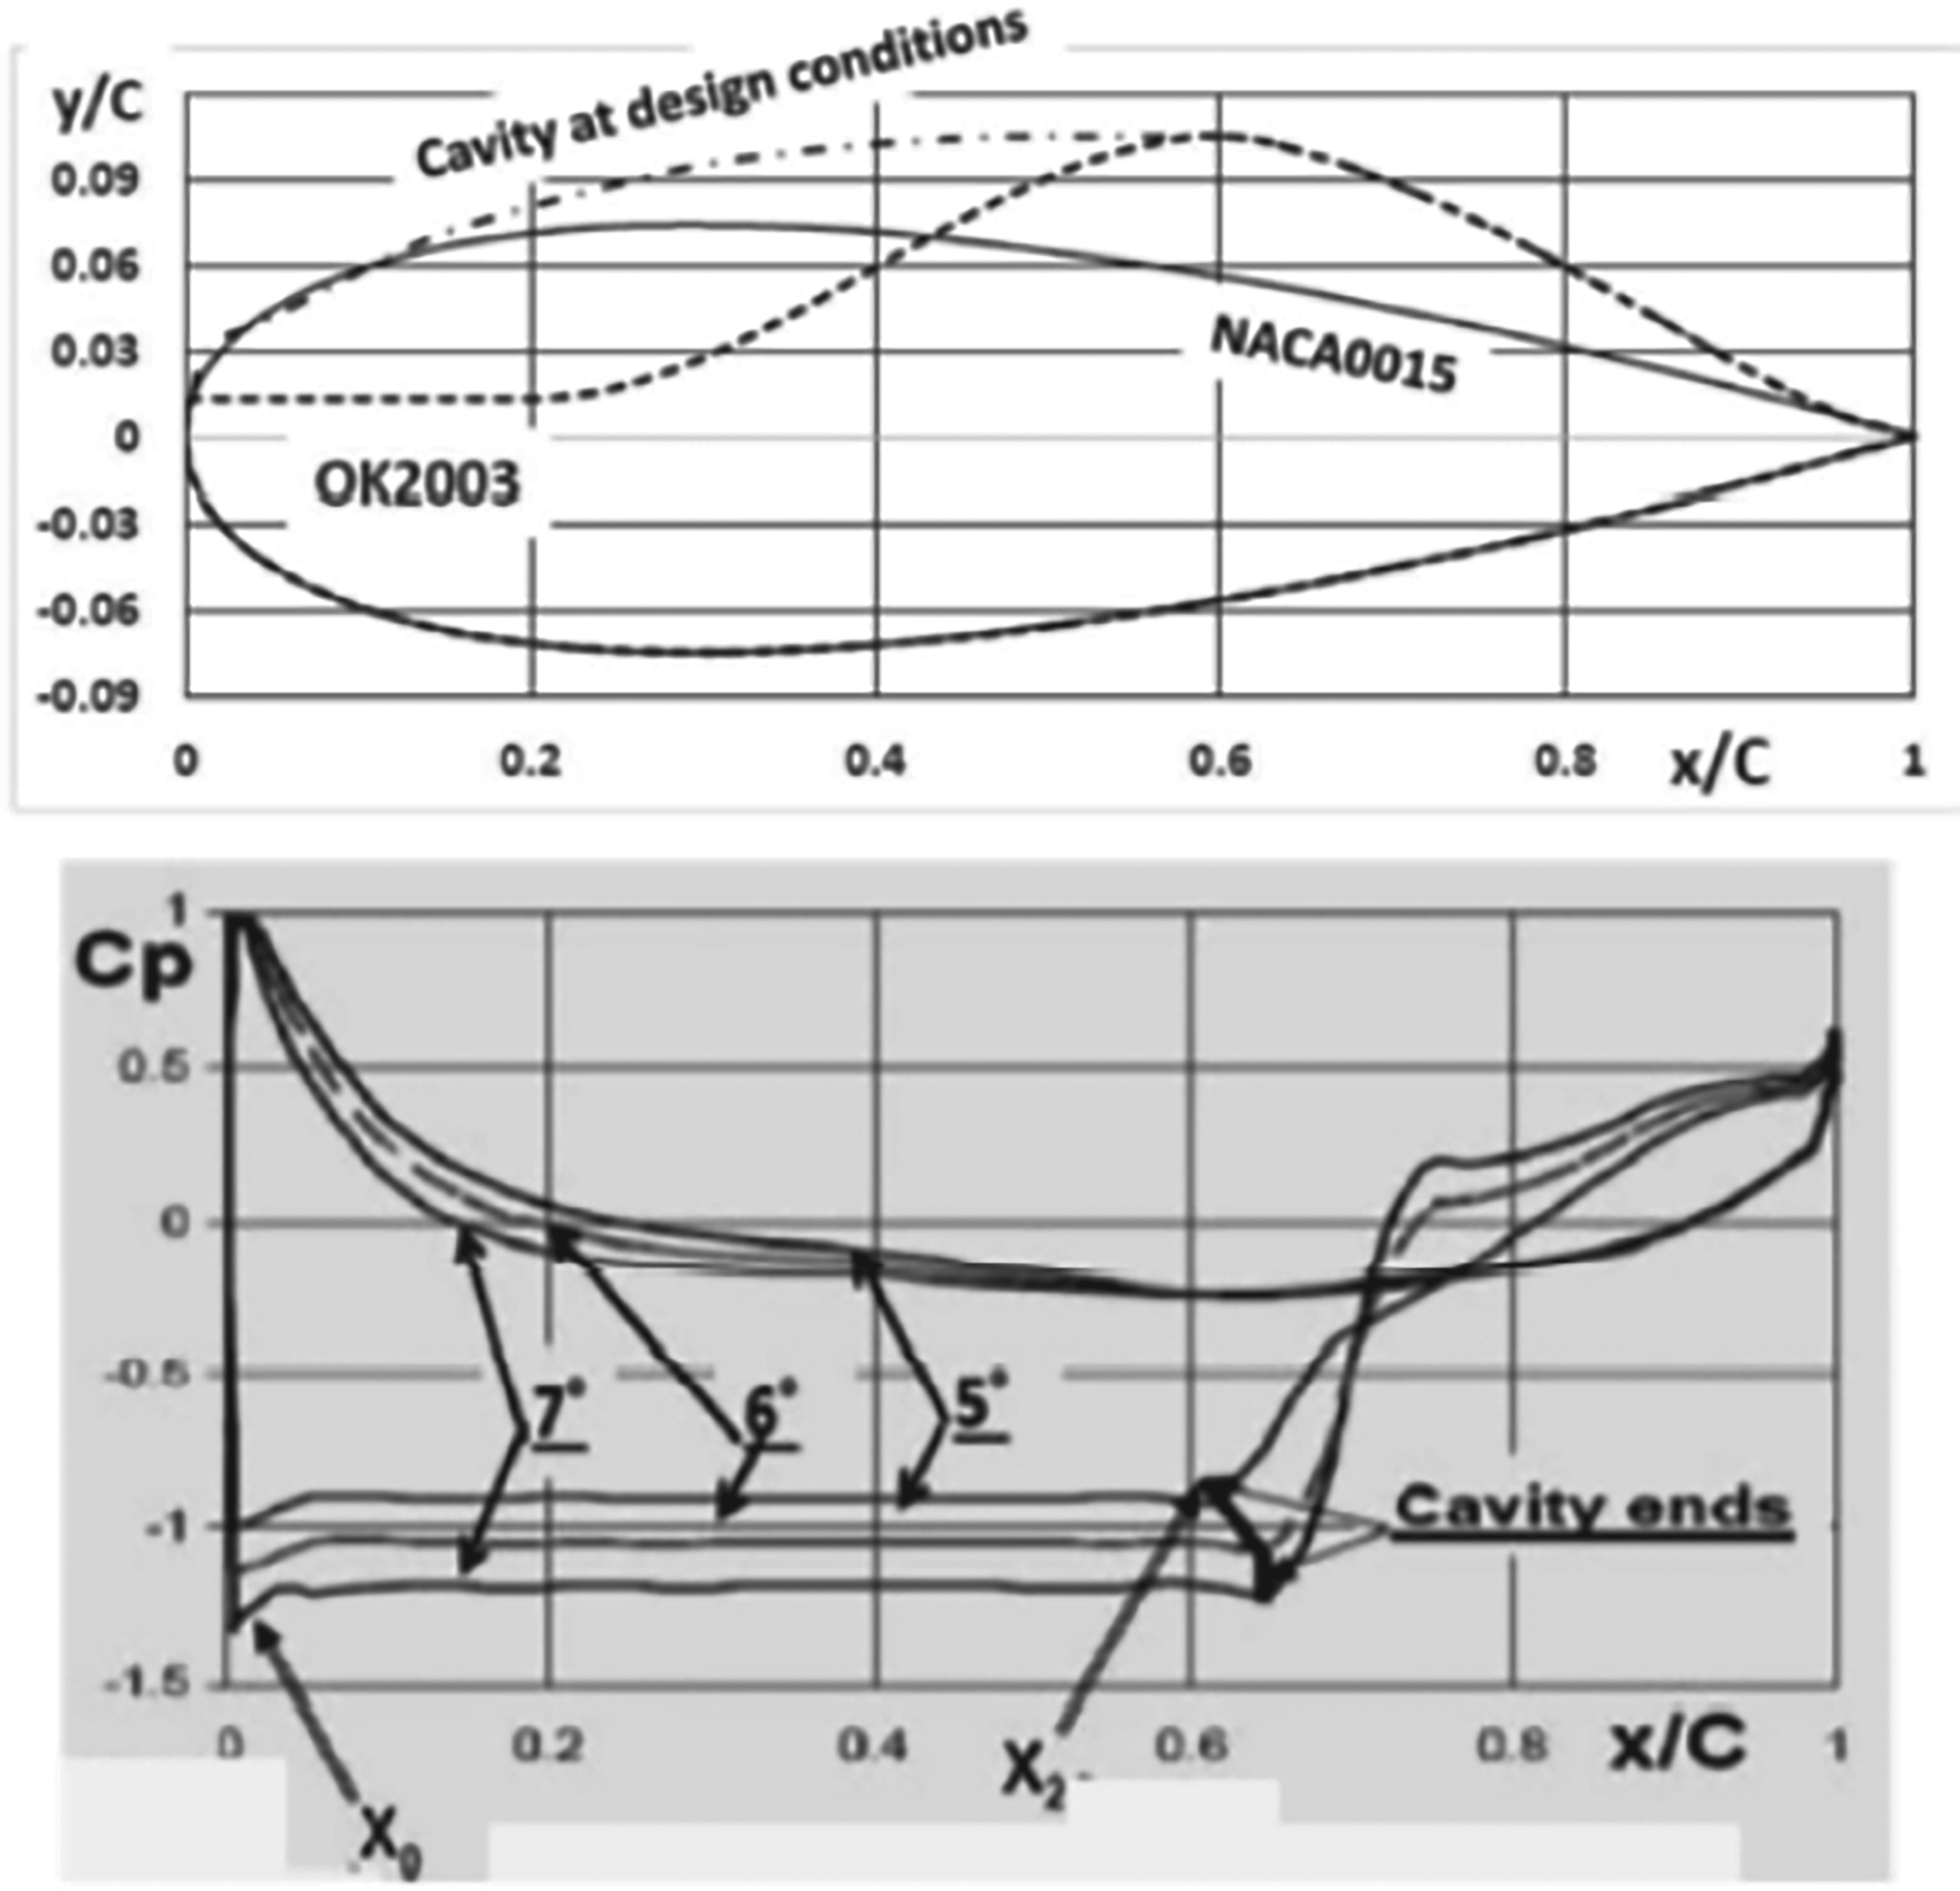
Hydrofoil OK2003 with the contour of a cavity in comparison with hydrofoil NACA0015 (in the top; pressure sides of hydrofoils coincide) and computed pressure distributions on OK2003 at several angles of attack (in the bottom).
The lift and drag measurements were carried out in the water tunnel of Saint Anthony Falls Laboratory with hydrofoils of 0.081 m chord C at the inflow speed up to U0 = 10 m/s. Three types of cavitating flows over OK2003 were studied in this tunnel. The first type is natural cavitation, and cavitation number
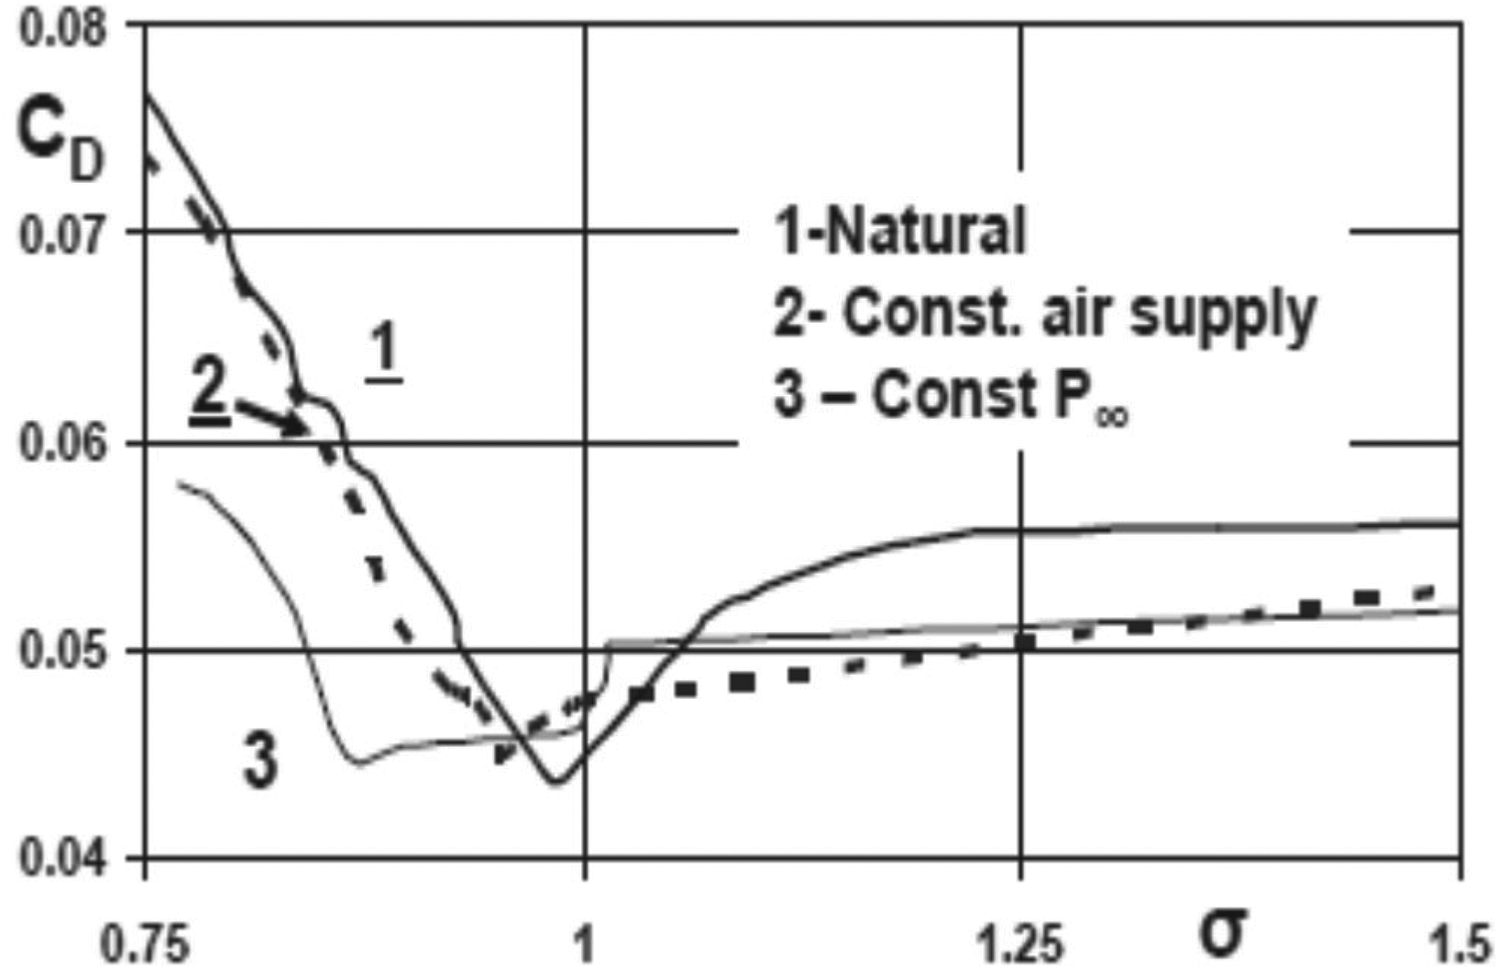
Drag coefficient of naturally cavitating and ventilated hydrofoils OK2003 at α = 6°.
So, the possibility of obtaining a similar ratio of

Lift coefficients of naturally cavitating (square) and ventilated with a constant air supply (circles) hydrofoil OK2003 at α = 6°.
The required explanation of the above-described lift behavior will be given here via a numerical analysis. As will be shown, because the air supplied to the ventilated cavity for its maintenance must completely escape, the fluid over the hydrofoil downstream of the cavity becomes a gas–liquid mixture. As a result, the fluid density significantly drops there. Such a drop leads to the pressure increase on the part of the hydrofoil suction side and this changes the lift.
Computations of the water pressure and velocities around the hydrofoil at moderate angles of attack α can start in the framework of ideal fluid theory. At such angles, neither cavities nor viscous separation zones cover the hydrofoil trailing edge, and the hydrofoil lift coefficient linearly depends on this angle.
As seen in Figure 5 (obtained from video recording), shapes of natural and ventilated cavities at the same cavitation number are very close. So, such computations are acceptable for both types of cavitation.
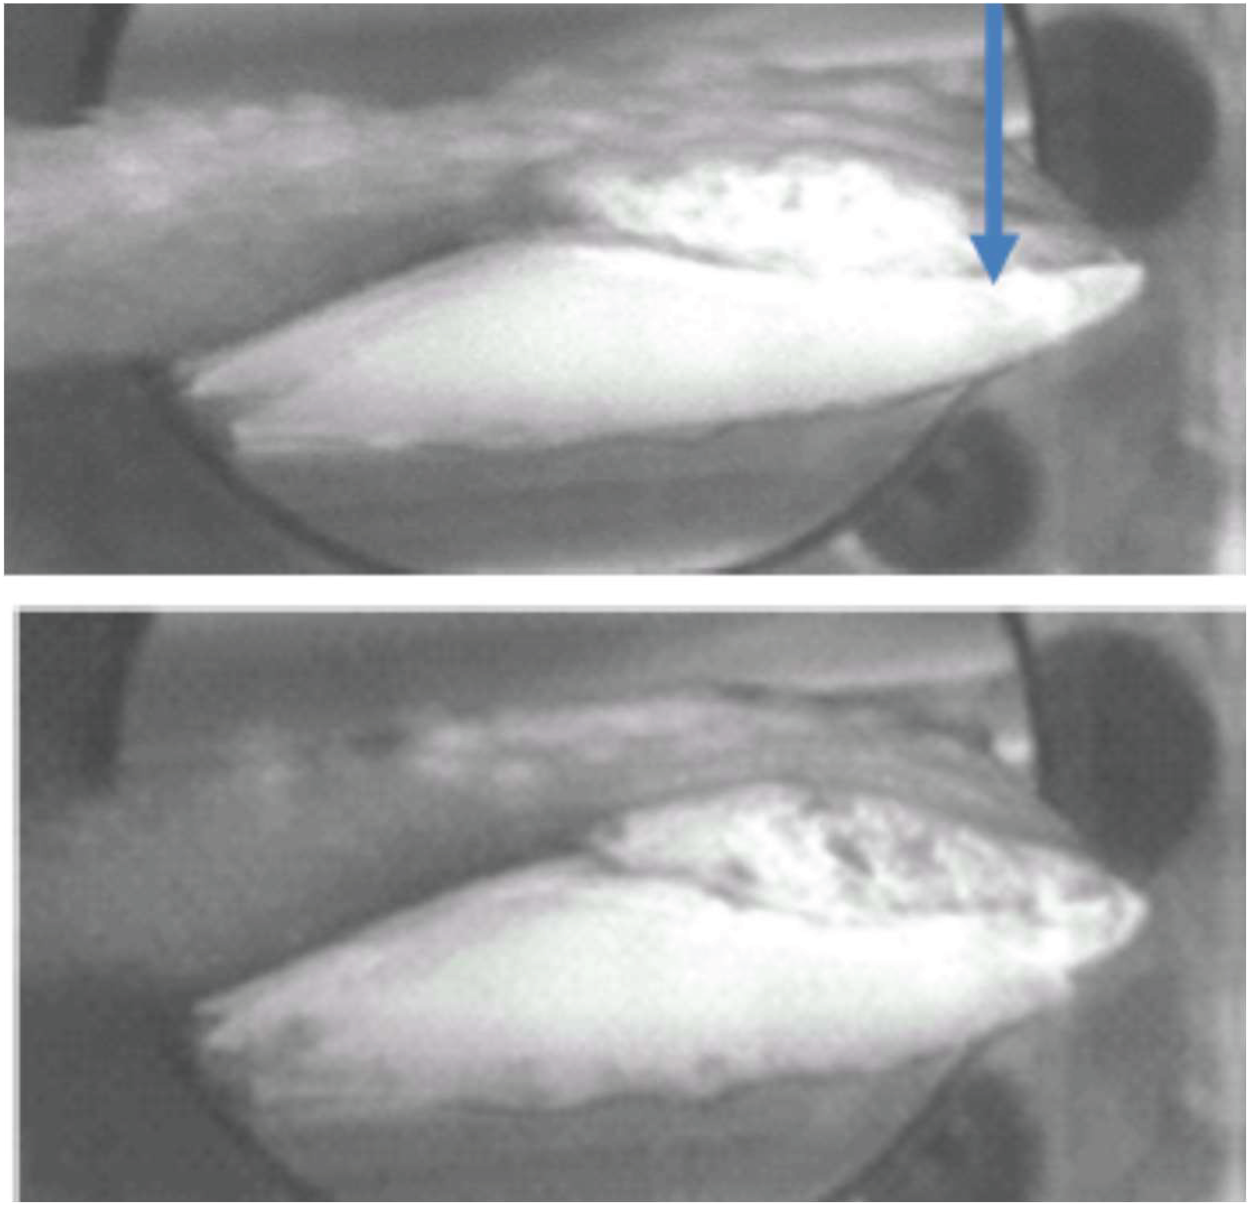
The maximum extends of the ventilated cavity at Q = 2 L/min (in the top; the arrow shows location of the ventilation slot) and the natural cavity (in the bottom) in conditions of the maximum lift of the hydrofoil OK2003. Flow goes from right to left.
The velocity determination is carried out by solving the Laplace equation


As shown in Figures 6 and 7 with the experimental data of Ihara et al. 10 for Clark11.7 hydrofoil and of Kopriva et al. 6 for OK2003 hydrofoil, the following integration of pressure computed around partially cavitating hydrofoils in ideal fluid allows for the satisfactory predictions of the lift on them at moderate angles of attack (coordinates of Clark11.7 hydrofoil can be found in Table 7.3 of the monograph 4 in particular). The snapshots of natural cavities in Figure 8 correspond to the 7 degrees angle of attack (similar to the data sets in Figure 7). Such snapshots are not a good basis for conclusions on cavitation-induced pulsations, but the same Figure 8 shows also the difference in measured lift pulsations between a traditional hydrofoil and OK2003: for the range of σ corresponding to partial cavitation, pulsations for OK2003 incomparably smaller (down to the level inherent to cavitation-free flows). The sharp lift increase at the design values of σ for OK2003 becomes clear after the observation of cavity shapes in Figure 8. One can see that for higher values of σ, cavities do not fill completely the concavity on the suction side and the flow boundary does not get the curvature necessary for a high lift. The high lift is kept within a limited range of σ and drops after transformation of partial cavitation into supercavitation with a decrease of σ. Also, one can be surprised that a significant variation of cavitation number does not result in a visible variation of cavity lengths seen in Figure 8 (unlikely to a situation with traditional hydrofoils such as NACA0015).
Computed and measured lift coefficient of naturally cavitating hydrofoil OK2003.

Computed and measured lift coefficient of the hydrofoils Clark11.7.

Cavity shapes on OK2003 at 7 degrees angle of attack and σ = 1.46. 1.2 and 1.1 correspondingly (in the top) and comparison of measured lift pulsations for this naturally cavitating hydrofoil and NACA0015 (in the bottom).
As a result of solving equations (1)–(5), the velocity U = grad{
The air necessary to maintain the ventilated cavity completely escapes from it through the hydrofoil boundary layer. This layer starts as a single-phase laminar layer. Its transition into a turbulent multi-phase layer occurs over ventilated cavities. The integral boundary layer equations have been used for the boundary layer analysis. The one-parameter integral method described by White
11
can be applied to the laminar single-phase boundary layer upstream of the cavity, but for the air-water mixture, the density variations must be taken into account. Therefore, the displacement thickness


It is important to point out the initial conditions for integration equations (6)–(8) downstream of the cavity. The boundary layer over the cavity itself can be described with the von Karman equation in the form


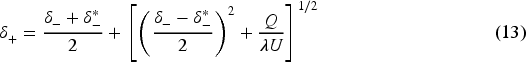

The described method to compute multi-phase boundary layers was validated using the experimental data of Sanders et al.
14
for microbubble drag reduction over a plate. Integration of equations (6)–(8) with the initial conditions (12)–(14) provides the functions δ(x),
Computed (lines) and measured (symbols) ratios of normalized friction coefficient along a flat plate with microbubble drag reduction. The first number in the legend shows the flow speed (in m/s), the second number shows the initial void fraction.
As noted above, the hydrofoil lift can be computed directly by pressure integration. In the case of natural partial cavitation, the first method was proven and illustrated by Figures 6 and 7. In the case of ventilated cavitation, this method will be used together with the assumption that the difference of pressure in these cases is much smaller than the pressure in the stagnation point. Although a density profile could be also introduced, only the averaged across the layer ratio r of the mixture density to the water density was used here.
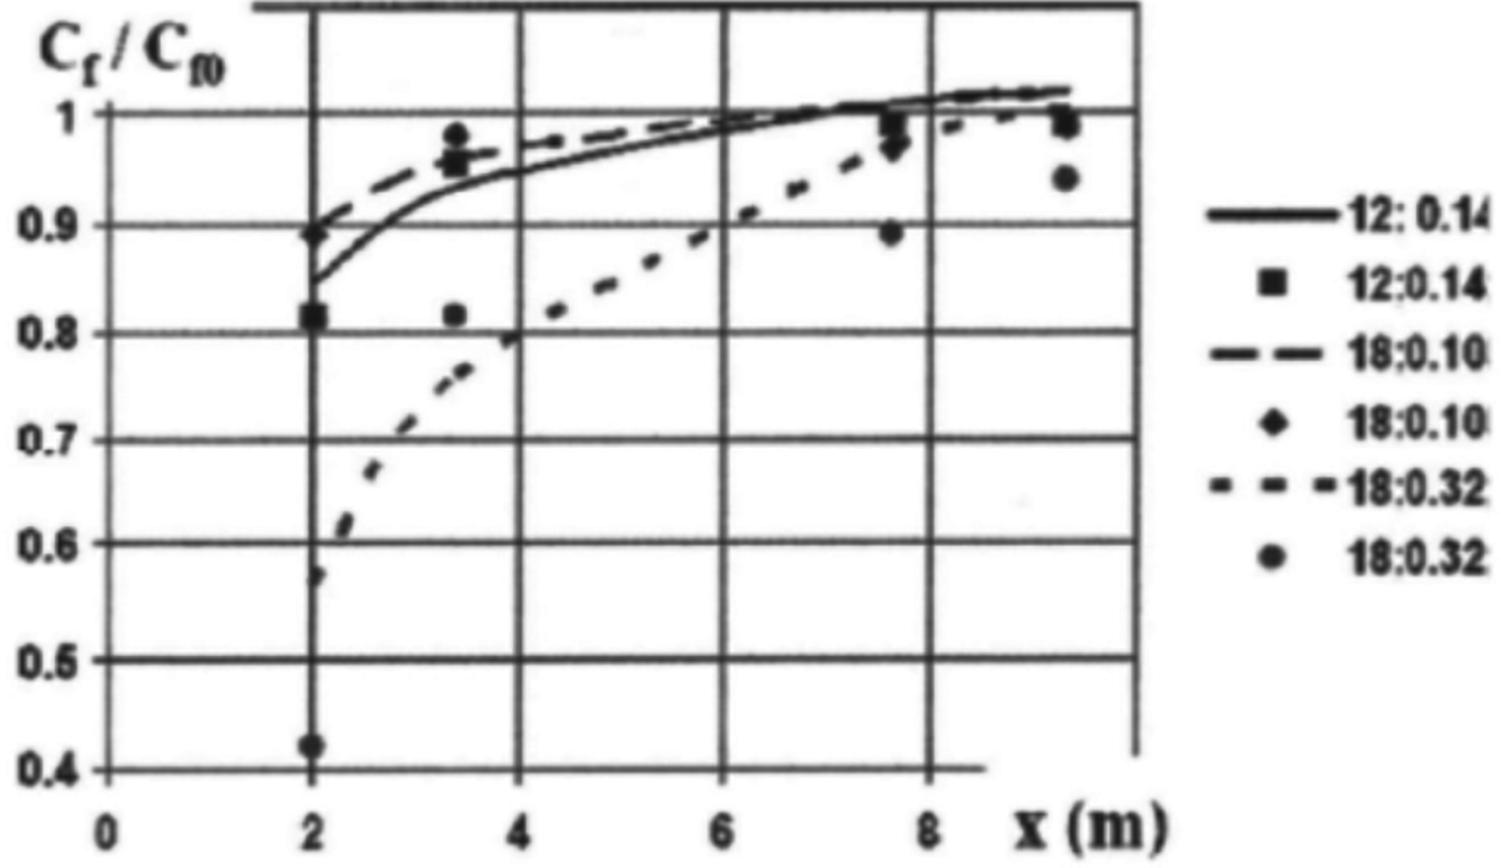
The computed distributions of flow density r(x) behind the cavity for two values of Q are shown in Figure 10 along with thickness distributions H(x) for several cavities. Downstream of the ventilated cavity
Computed distributions of the ratio of flow density to the water density behind ventilated cavities over the hydrofoil OK2003 for two values of Q at α = 6° and σ = 0.95 (in the left) and thickness of natural partial cavities at α = 5°, α = 6° and α = 7° (in the right).
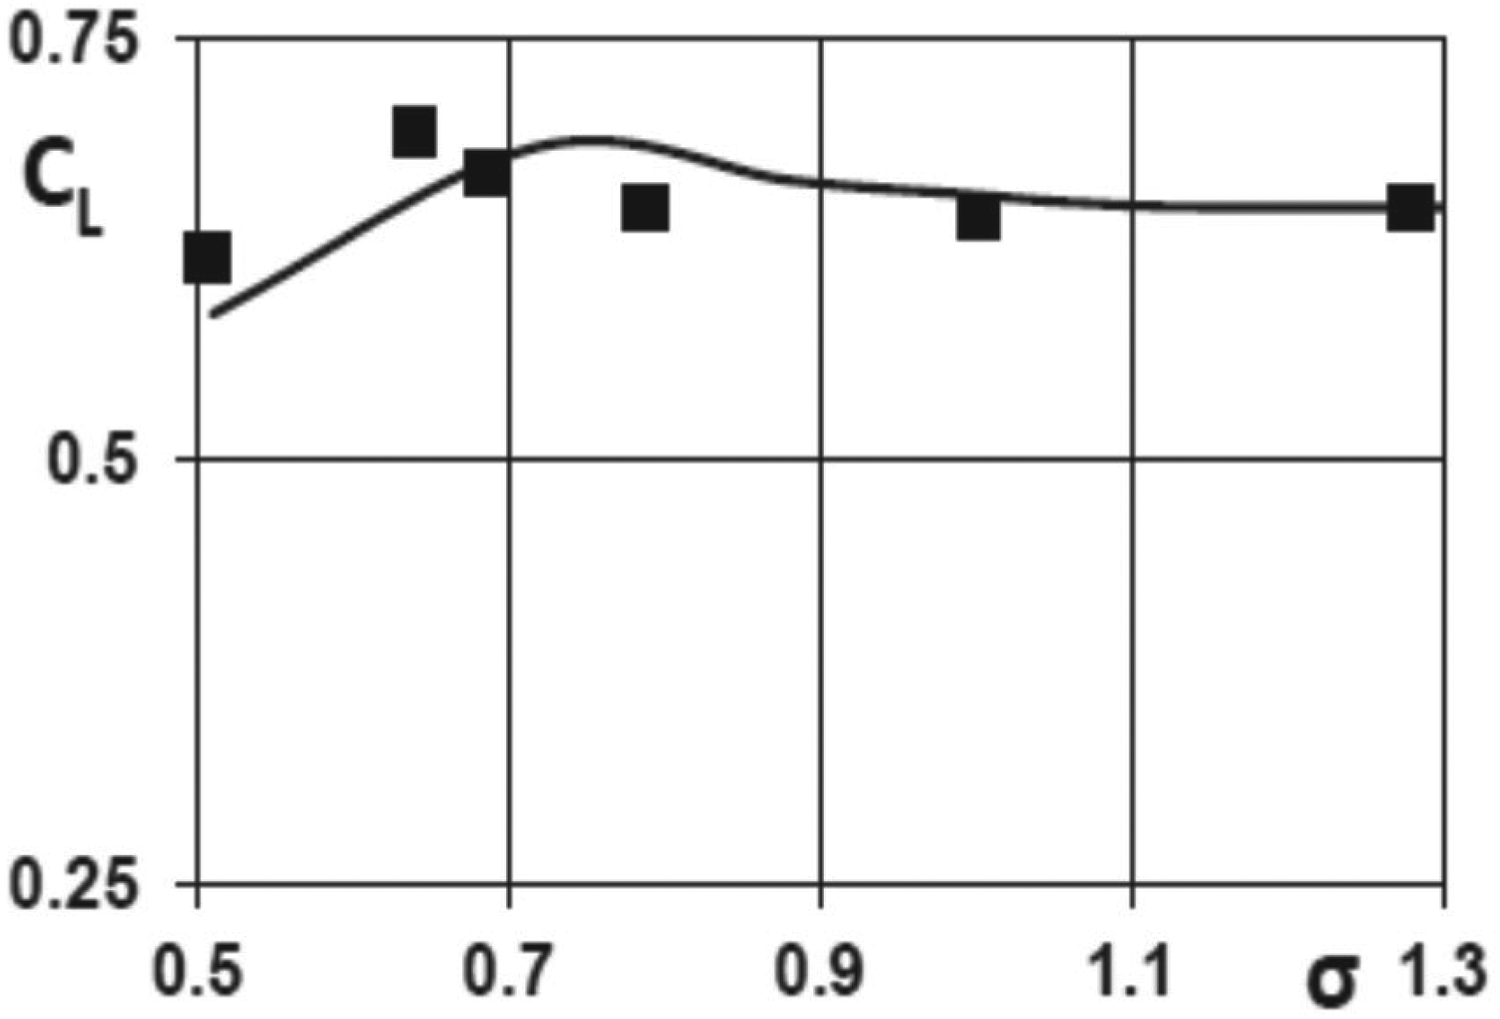
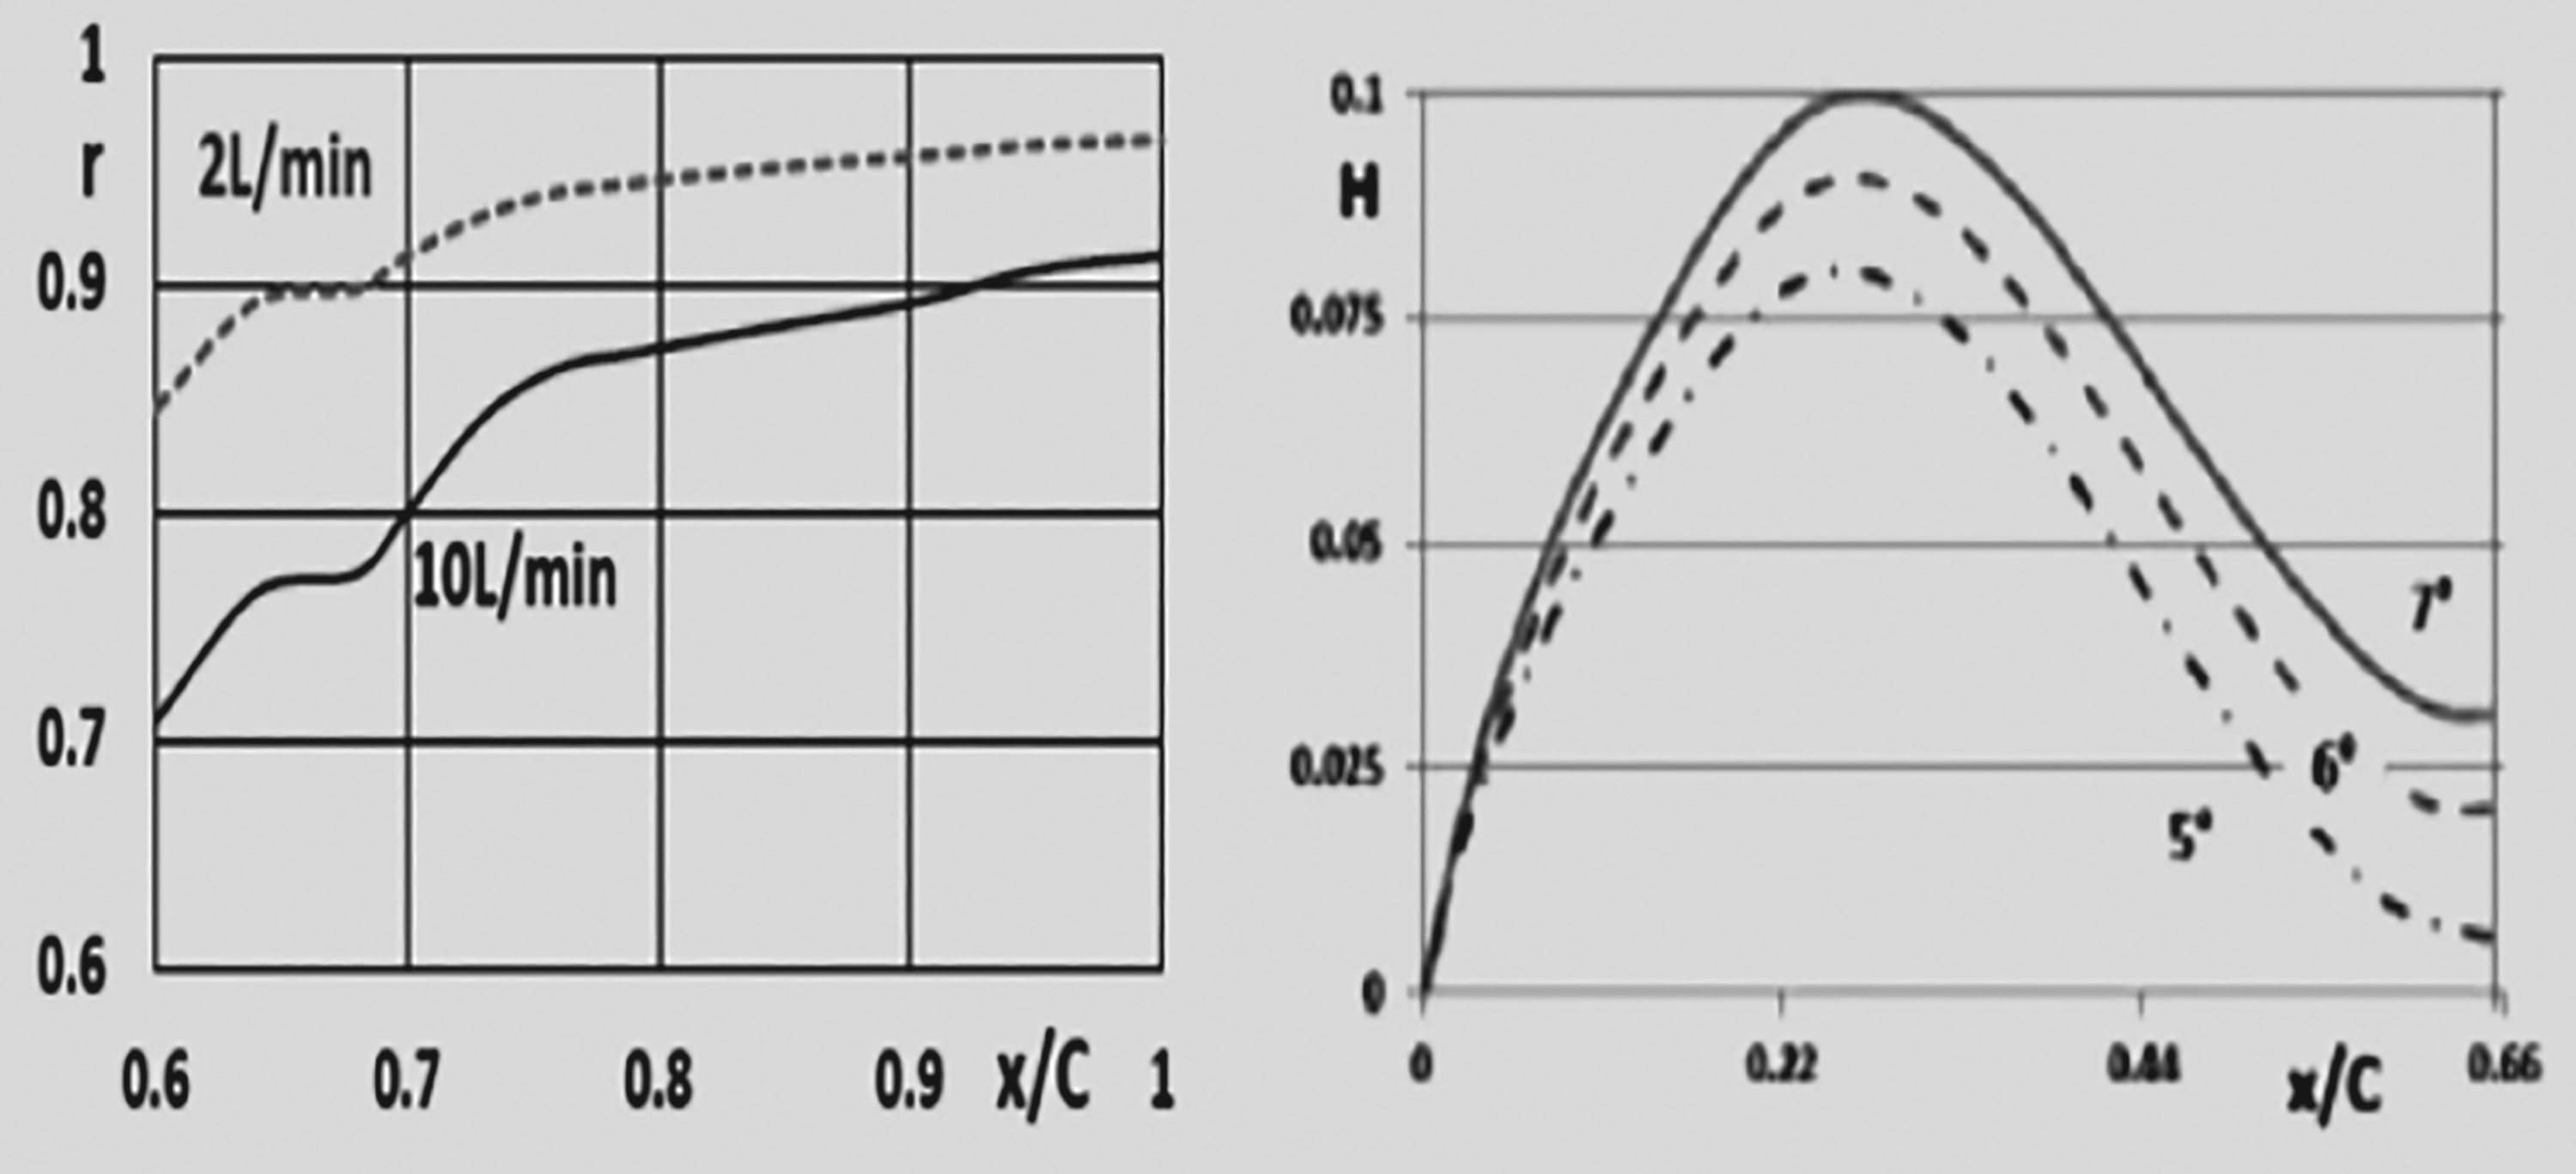
Computed (line) and measured (squares) maximum lift coefficients for ventilated hydrofoil OK2003 at α = 6° and σ corresponding to the maximum of C

Photos of swept cavitating hydrofoil with OK2003 sections at peaks of its lift to drag ratios for α = 5° (σ = 0.92), 6° (σ = 1.04), and 7° (σ = 1.20).
The computed effect of the ventilation rate on the maximum of the hydrofoil lift coefficient is compared with the measured effect in Figure 11. The agreement of theory and experiment is satisfactory there. So, ventilation was able to provide around 25% drag reduction to a quite thick hydrofoil OK2003 that was designed as a modification of NACA0015. This reduction is calculated in comparison with the drag of cavitation-free hydrofoil that can be defined at the intersection of Curve 1 with the line σ = 1.5 in Figure 3. However, about 25% enhancement of the hydrofoil lift inherent to natural cavitation of OK2003 at its design conditions is not achievable with ventilation at the same cavitation number. So, unlikely to the situation for the hull of a displacement ship observed by Gorbachev et al., 16 the air escape from the partially ventilated cavity over a hydrofoil has a negative effect on its performance. Meanwhile, it is impossible to achieve the performance of specially designed naturally cavitating hydrofoils via their ventilation at smaller ship speeds. A ship with ventilated hydrofoils must have supplementary devices or a reserve of power propulsor power to reach the speed sufficient for the peak of lift enhancement by natural partial cavitation.
Three-dimensional (3D) (swept) hydrofoils with the OK2003 contour as their sections were designed and tested in the same water tunnel at the same Reynolds number by Kopriva et al. 17 These tests included studies of natural cavitation only. As one could expect and see comparing Figure 12 with Figure 8, the cavity sections become monotonously shorter in the direction of the hydrofoil tip. For 3D hydrofoils, the lift peaks become a little bit smaller than for two-dimensional (2D) OK2003. Nevertheless, as one can find in Figure 13, the main trend was kept. The design correction for the section of 3D hydrofoil by taking into account the downwash may reduce the difference with 2D peaks.
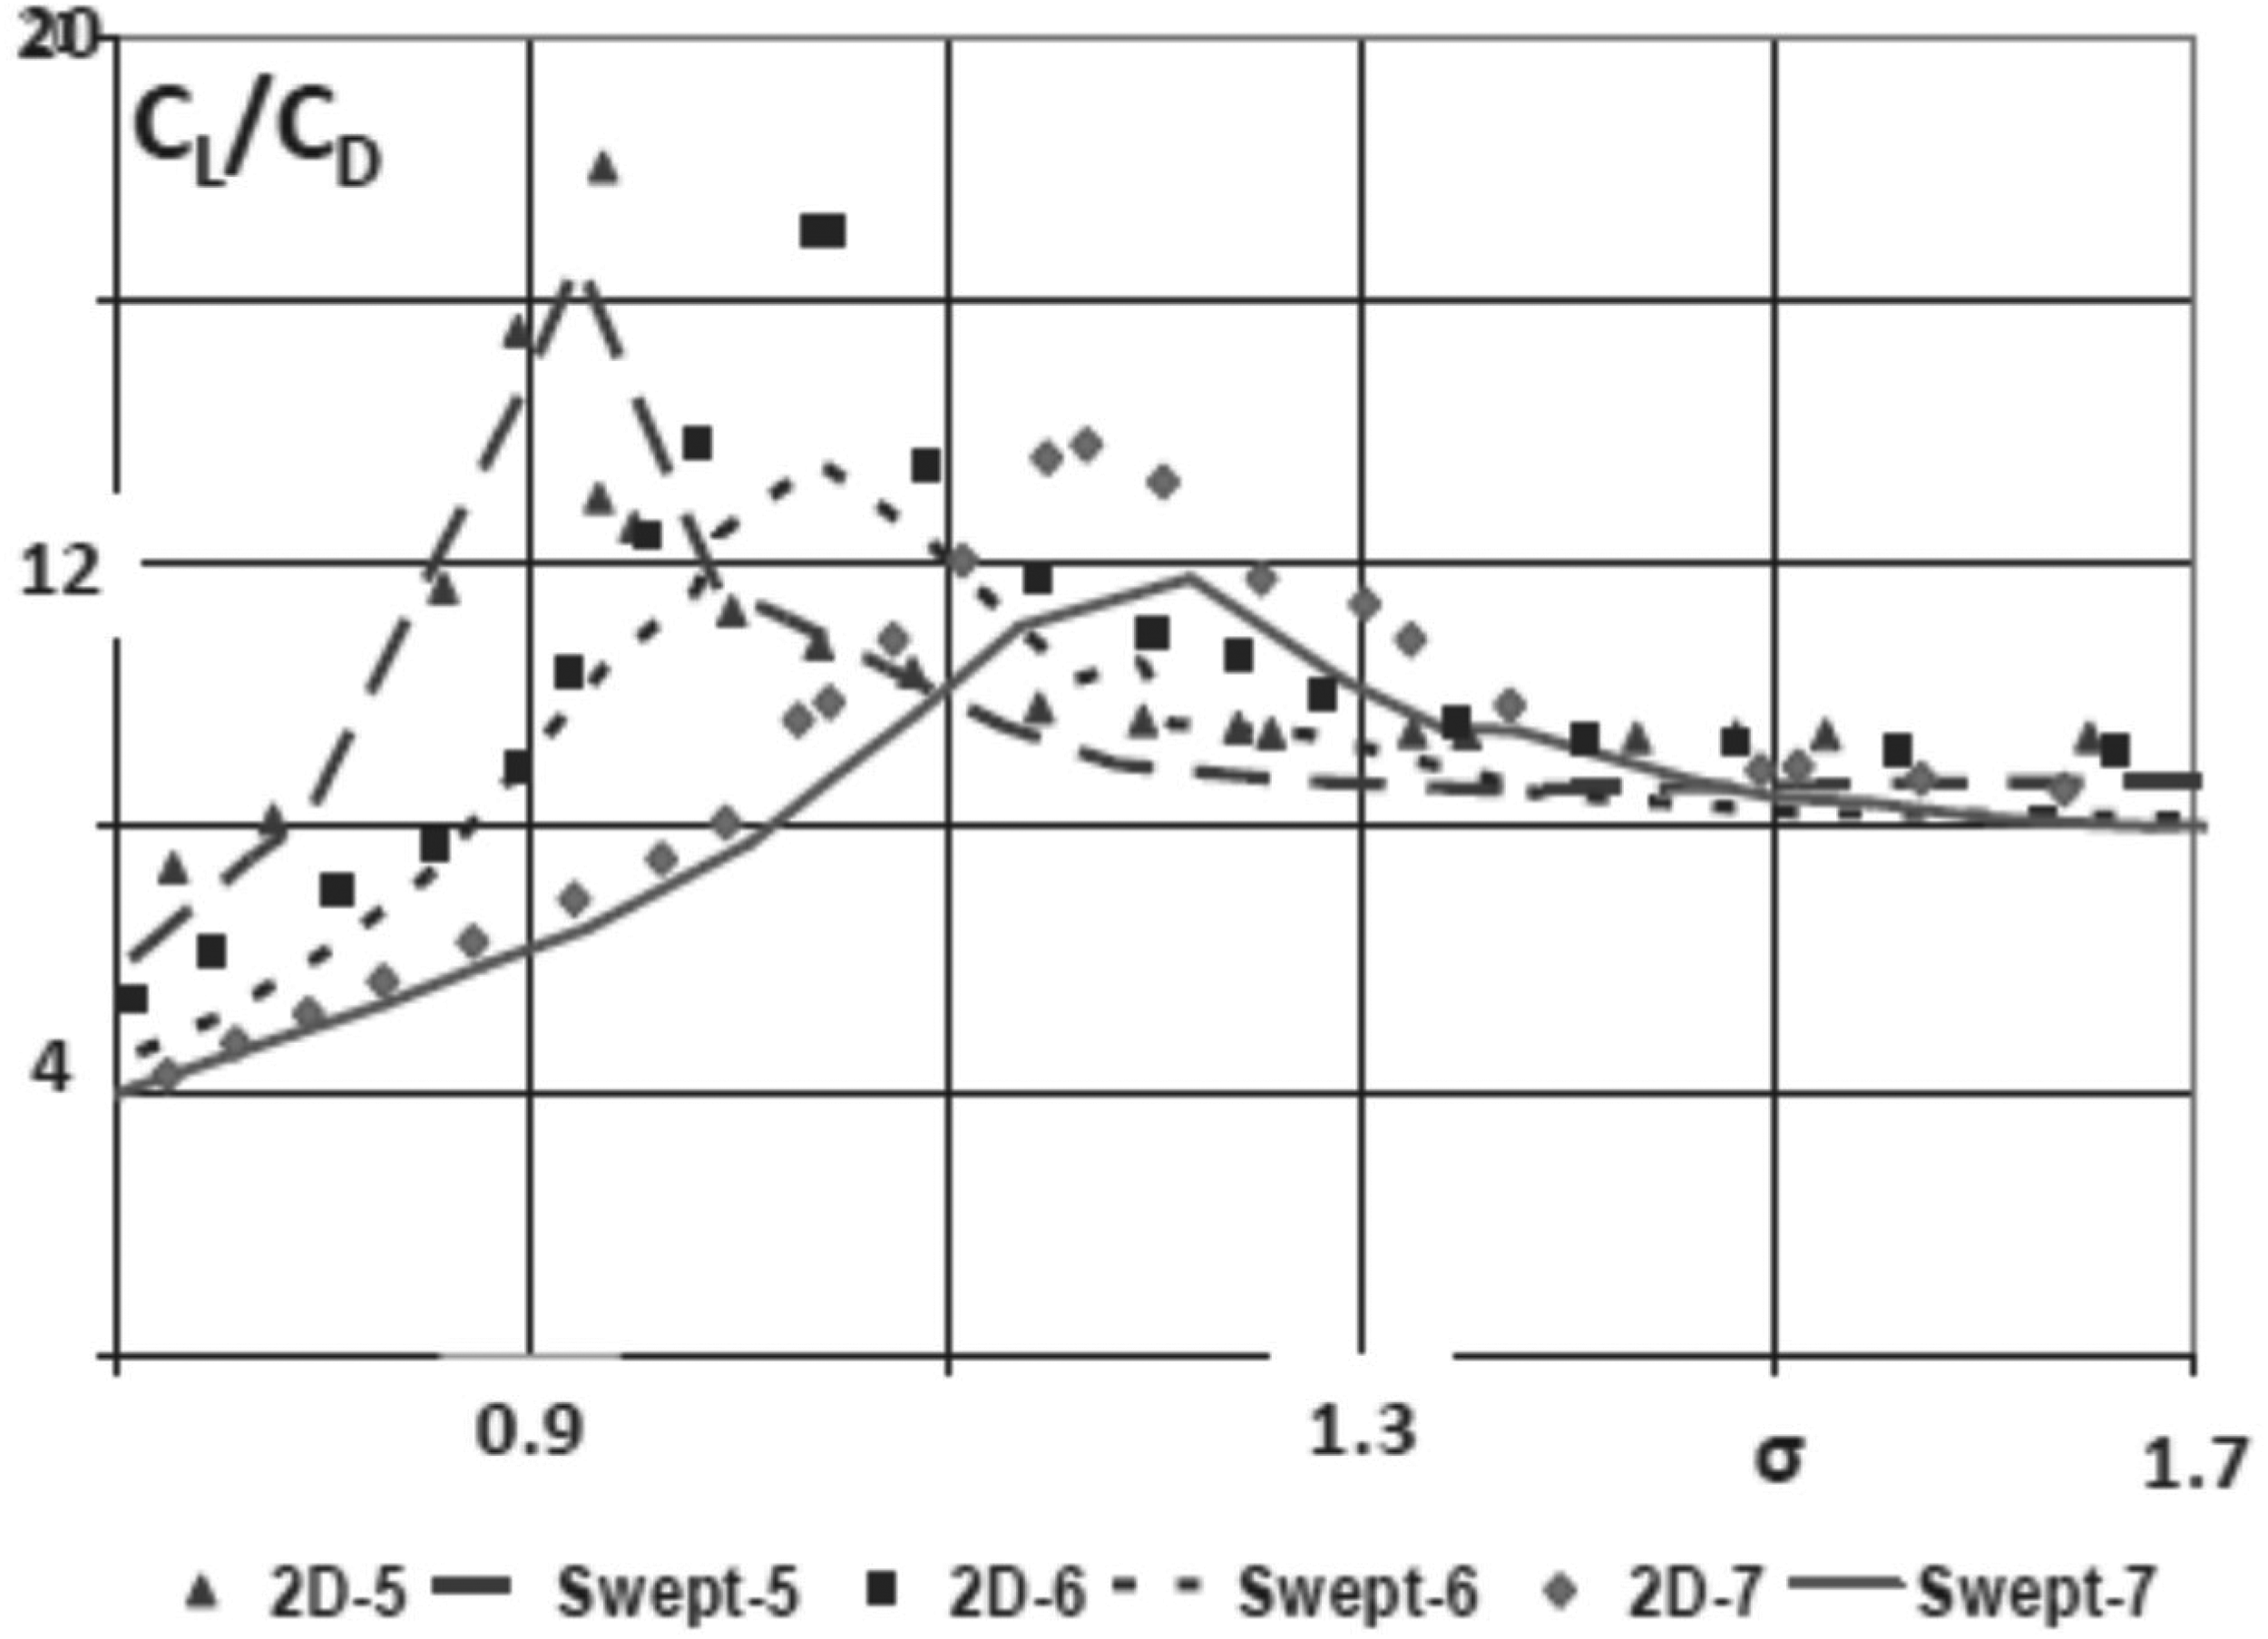
Measured lift to drag ratios for two-dimensional (2D) and swept OK2003 hydrofoils. Data 2D-5 relates to 2D hydrofoil at α = 5°, swept-5 to the swept hydrofoil at α = 5°, etc.
An analysis of scale effects on the performance of OK2003 was carried out only numerically by Amromin and Kovinskaya. 18 The corresponding illustration is provided in Figure 14. The expected drag decrease with the increase of Re is associated mainly with the friction decrease on cavitation-free surfaces due to this increase.
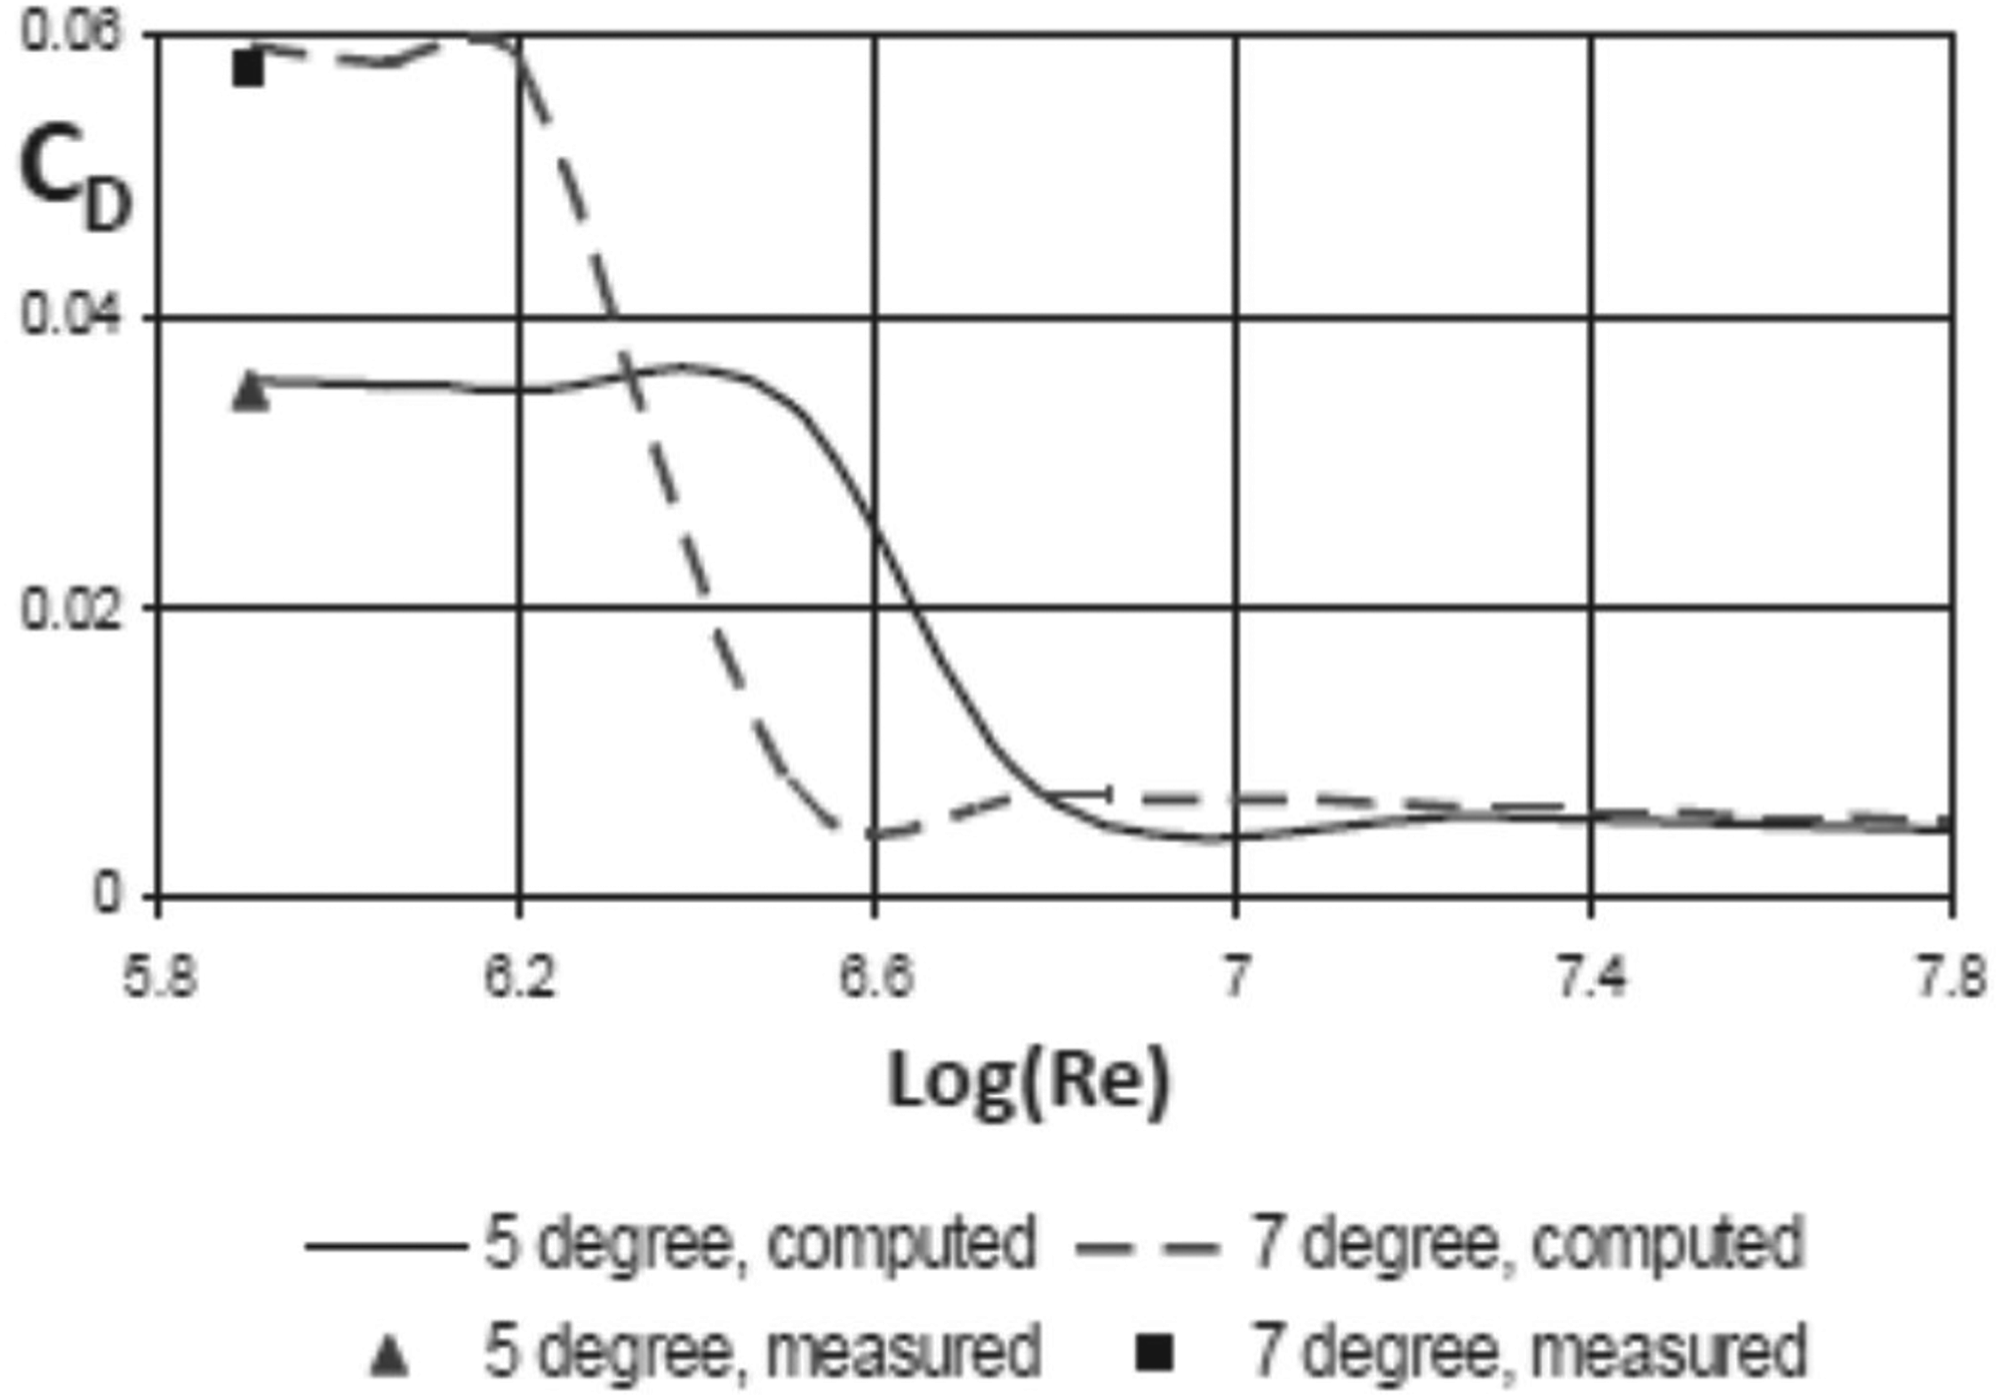
Reynolds number effect on drag coefficient of naturally cavitating hydrofoil OK2003 at its design values of σ.
Specially designed hydrofoils can give a very significant increase in lift coupled with a significant drag reduction in the case of natural partial cavitation. The possibility of maintaining a similar drag reduction at smaller inflow speeds using ventilation by air is associated with the much smaller lift enhancement at the same cavitation numbers. This circumstance substantially affects the performance of ventilated hydrofoils.
The described numerical simulation manifested that such an affect is an unavoidable phenomenon. The physics behind this phenomenon is in the decrease of the media density just downstream of the ventilated partial cavity. This density decrease is caused by the air escape from the cavity.
Footnotes
Author contributions/CRediT
All contributions to this paper belong to the author himself.
Funding
The author received no financial support for the research, authorship, and/or publication of this article.
Declaration of conflicting interests
The author declared no potential conflicts of interest with respect to the research, authorship, and/or publication of this article.
Appendix: Shape of hydrofoil OK2003
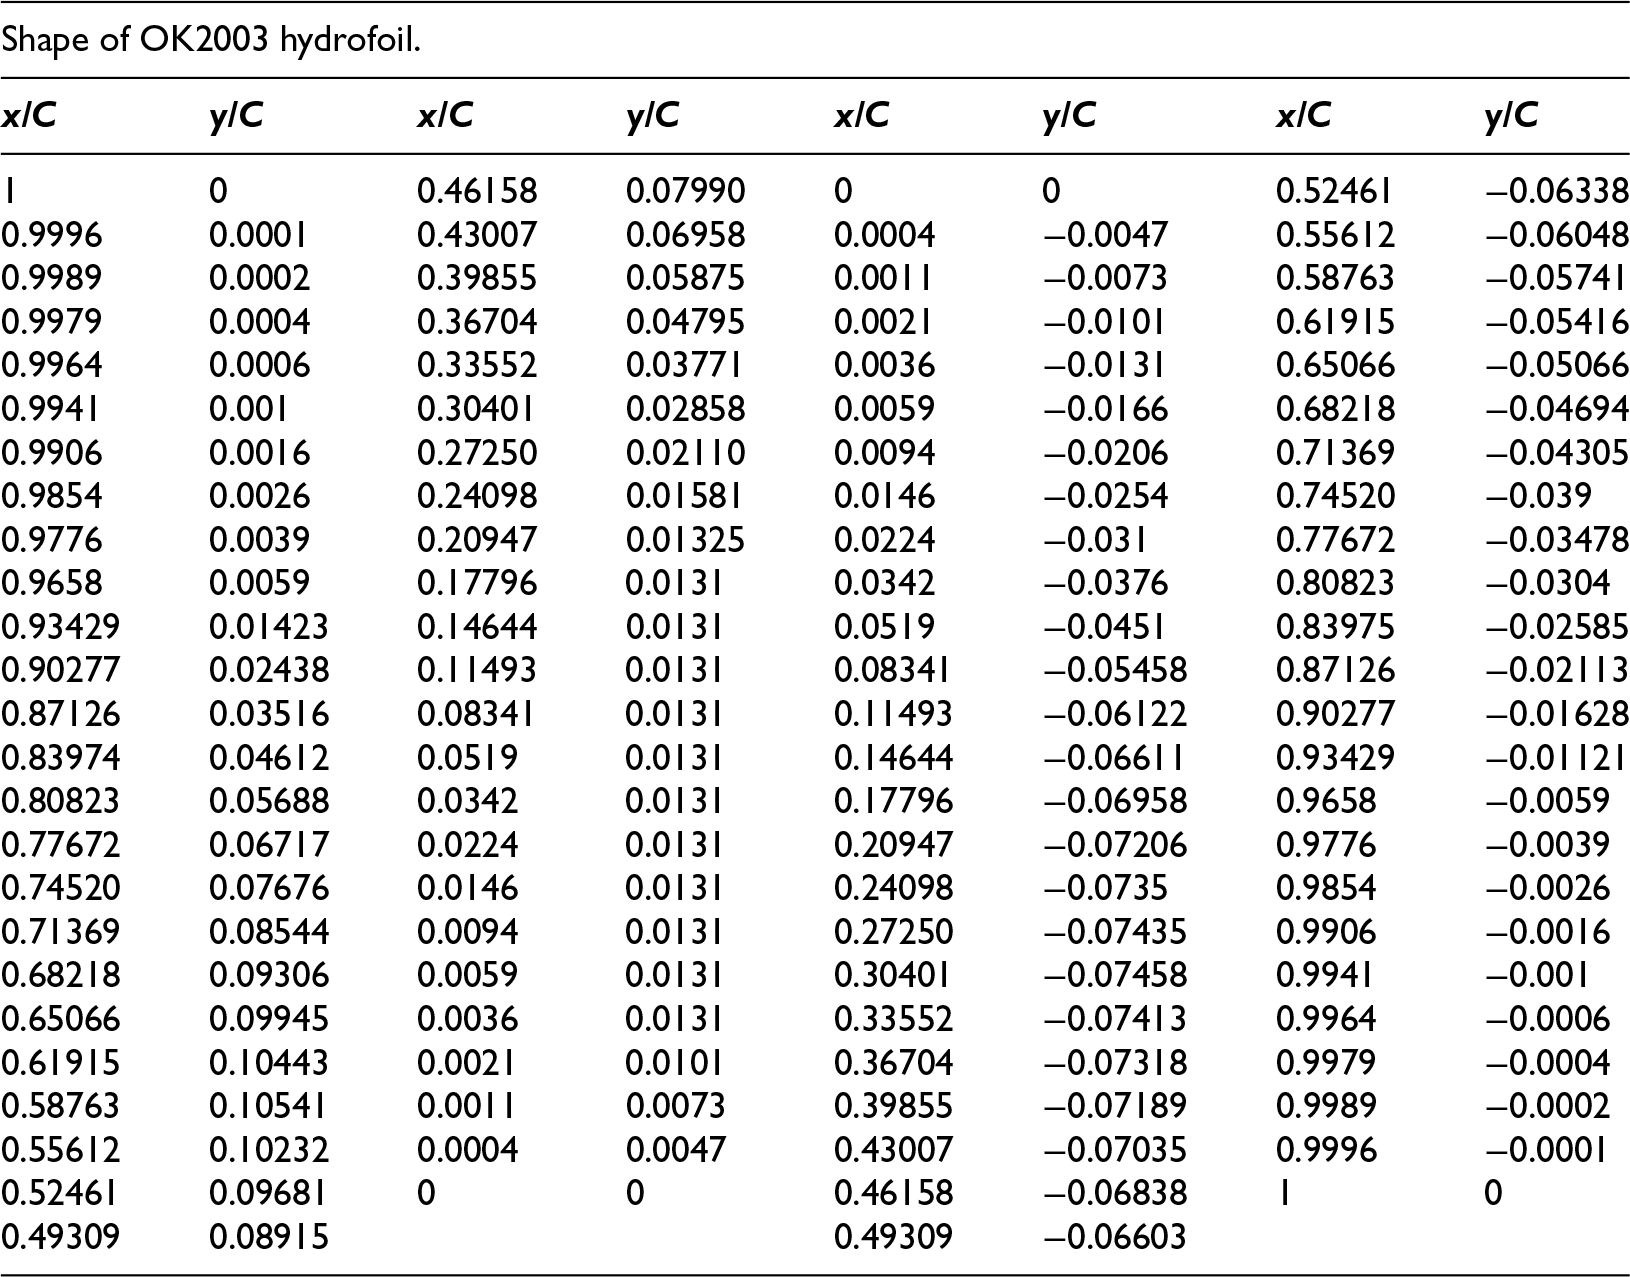
| Shape of OK2003 hydrofoil. | |||||||
|---|---|---|---|---|---|---|---|
|
|
|
|
|
|
|
|
|
| 1 | 0 | 0.46158 | 0.07990 | 0 | 0 | 0.52461 | −0.06338 |
| 0.9996 | 0.0001 | 0.43007 | 0.06958 | 0.0004 | −0.0047 | 0.55612 | −0.06048 |
| 0.9989 | 0.0002 | 0.39855 | 0.05875 | 0.0011 | −0.0073 | 0.58763 | −0.05741 |
| 0.9979 | 0.0004 | 0.36704 | 0.04795 | 0.0021 | −0.0101 | 0.61915 | −0.05416 |
| 0.9964 | 0.0006 | 0.33552 | 0.03771 | 0.0036 | −0.0131 | 0.65066 | −0.05066 |
| 0.9941 | 0.001 | 0.30401 | 0.02858 | 0.0059 | −0.0166 | 0.68218 | −0.04694 |
| 0.9906 | 0.0016 | 0.27250 | 0.02110 | 0.0094 | −0.0206 | 0.71369 | −0.04305 |
| 0.9854 | 0.0026 | 0.24098 | 0.01581 | 0.0146 | −0.0254 | 0.74520 | −0.039 |
| 0.9776 | 0.0039 | 0.20947 | 0.01325 | 0.0224 | −0.031 | 0.77672 | −0.03478 |
| 0.9658 | 0.0059 | 0.17796 | 0.0131 | 0.0342 | −0.0376 | 0.80823 | −0.0304 |
| 0.93429 | 0.01423 | 0.14644 | 0.0131 | 0.0519 | −0.0451 | 0.83975 | −0.02585 |
| 0.90277 | 0.02438 | 0.11493 | 0.0131 | 0.08341 | −0.05458 | 0.87126 | −0.02113 |
| 0.87126 | 0.03516 | 0.08341 | 0.0131 | 0.11493 | −0.06122 | 0.90277 | −0.01628 |
| 0.83974 | 0.04612 | 0.0519 | 0.0131 | 0.14644 | −0.06611 | 0.93429 | −0.01121 |
| 0.80823 | 0.05688 | 0.0342 | 0.0131 | 0.17796 | −0.06958 | 0.9658 | −0.0059 |
| 0.77672 | 0.06717 | 0.0224 | 0.0131 | 0.20947 | −0.07206 | 0.9776 | −0.0039 |
| 0.74520 | 0.07676 | 0.0146 | 0.0131 | 0.24098 | −0.0735 | 0.9854 | −0.0026 |
| 0.71369 | 0.08544 | 0.0094 | 0.0131 | 0.27250 | −0.07435 | 0.9906 | −0.0016 |
| 0.68218 | 0.09306 | 0.0059 | 0.0131 | 0.30401 | −0.07458 | 0.9941 | −0.001 |
| 0.65066 | 0.09945 | 0.0036 | 0.0131 | 0.33552 | −0.07413 | 0.9964 | −0.0006 |
| 0.61915 | 0.10443 | 0.0021 | 0.0101 | 0.36704 | −0.07318 | 0.9979 | −0.0004 |
| 0.58763 | 0.10541 | 0.0011 | 0.0073 | 0.39855 | −0.07189 | 0.9989 | −0.0002 |
| 0.55612 | 0.10232 | 0.0004 | 0.0047 | 0.43007 | −0.07035 | 0.9996 | −0.0001 |
| 0.52461 | 0.09681 | 0 | 0 | 0.46158 | −0.06838 | 1 | 0 |
| 0.49309 | 0.08915 | 0.49309 | −0.06603 | ||||