
Abstract
Decarbonization of the maritime industry requires fostering habits and conditions that enable operators to make energy-conscious decisions. User interface (UI) design can play a key role in developing strategies to enhance user awareness and motivation. Specifically, UI design can implement feedback mechanisms that help users better understand the consequences of their actions on energy consumption. This approach has demonstrated measurable reductions in energy use in domains such as automotive systems and home appliances. However, research on eco-feedback and its implementation through UI design remains limited in the maritime context. We aimed to address this gap by conducting a systematic review of eco-feedback research and developing an eco-feedback framework (EFF) for UI design. We identified 39 strategies for providing feedback on a UI. These strategies were organized and synthesized into a design framework, the EFF. We illustrate the proof of concept of the EFF with a maritime example: a cruise control system that regulates a ship's speed and power use. Finally, we discuss other potential applications of the EFF in UI design research and conclude by highlighting its importance in fostering habits and conditions for energy-conscious decision-making in the maritime industry.
Keywords
Introduction
Supporting energy-conscious choices in maritime decarbonization
Maritime transport plays a crucial role in the global economy. Shipping accounts for 80% to 90% of global trade, transporting over 10 billion tonnes of containers and bulk cargo annually. 1 However, the exponential growth of the global economy and maritime trade is also one of the main drivers of the negative impacts of shipping on the environment, particularly marine life and human health.2–5 Therefore, the International Maritime Organization aims to fully decarbonize the maritime transportation sector. It targets a 30% reduction in greenhouse gas emissions by 2030 and an 80% reduction by 2040 compared to 2008 levels. 6
The decarbonization of the maritime sector depends on technological innovation and the everyday decisions made by those who operate and manage ships. 7 While new fuels, propulsion systems and energy-efficient technologies are vital, they can only reach their full potential when embedded within pro-environmental behaviour that focuses on energy-conscious decision-making (i.e. actions and judgements that consciously prioritize energy efficiency, environmental impact and long-term sustainability) emerge. 8
Supporting energy-conscious choices through design, specifically through user interface (UI) design, by using eco-feedback as a strategy to achieve energy reduction goals, represents a crucial yet often underestimated dimension of the transition towards sustainable shipping. Eco-feedback is designed to provide users with information about their energy consumption over a specific period to influence individual or group behaviours to reduce environmental impact and encourage pro-environmental actions.9,10 Eco-feedback interfaces, for example, can transform invisible energy consumption information into tangible signals to which crews can respond. 11
Decision-making systems that integrate performance data, environmental conditions and operational constraints into visible and meaningful feedback can help bridge the gap between sustainability goals and real-world operations. Supporting energy-conscious choices in maritime decarbonization bridges technological innovation and human behaviour.12,13 Through this interplay, decision-making becomes not merely a functional task but a creative and adaptive process, an instance of distributed cognition in action.
Challenges of supporting energy-conscious choices in maritime decarbonization through UI design
A key challenge in supporting energy-conscious decisions in maritime decarbonization is the design of UIs. Many seafarers rely heavily on intuitive knowledge; however, this alone is insufficient to maintain energy consumption within sustainable targets.
Designing UIs that support energy-conscious decision-making is a complex task that depends on technological advancements and human factors.12,13 Behavioural change is critical to achieving sustainable goals in any field that involves human interaction.14,15 Behaviour change refers to the process of altering people's actions and decision-making patterns through targeted interventions.16,17 We argue that studying human behaviour in context can reveal how individuals interact with equipment and systems, providing insights into how their behaviour can be guided towards more sustainable practices. 18 Consequently, behaviour change as a discipline offers valuable tools for understanding and shaping human behaviour in the maritime sector.
The digital transformation of the maritime sector is one of the most important steps towards improving seafarers’ safety, monitoring equipment usage, making ships more sustainable and keeping maritime companies competitive. Digital transformation is the use of information and communication technologies (ICTs) to improve or change existing business processes or models.19–21
In the maritime sector, digitalization manifests in several ways, including the improvement of existing equipment, the development of new technologies, process automation, personnel training, the integration of sensors, and the adoption of artificial intelligence. 22 However, even with the ongoing digitalization of the sector, challenges persist, such as the lack of integration between the different equipment used by seafarers on the bridge.
According to Nordby et al., 23 a bridge with equipment from different manufacturers includes various product types, installation methods and UI design specifications and philosophies. This gap between systems forces seafarers to manage inconsistencies across multiple UIs, which can potentially lead to human error, the cause of approximately 80% of maritime incidents and accidents. 24 Therefore, it is essential to adapt tasks, equipment, and environments to the user's skills, avoiding situations where seafarers are forced to operate poorly designed or inappropriate systems. 25
Inadequately designed UIs, with poor usability and a lack of standardization, can lead to the misuse of equipment, which in turn may result in excessive energy consumption.23,26 Despite the growing adoption of digital technologies in the maritime domain, there is still no established design precedent for eco-feedback UIs specifically applied to maritime systems. Existing maritime UIs primarily focus on navigation, safety, and operational efficiency, rarely incorporating mechanisms that promote energy awareness or sustainable behaviour among seafarers. Therefore, the development of an eco-feedback design framework represents an important step towards integrating sustainability-driven interaction principles into maritime interface design.
Current maritime UIs are limited to presenting analytical data on energy use, often using highly technical terms such as NOx, SOx, sulphur or CO2. According to Mäkivierikko et al., 27 these terms can be difficult to translate into clear, actionable insights about real energy use, even for professionals in the field. This raises concerns about the actual understanding of energy information.
Moreover, these UIs tend to display energy consumption data that are not in real time and do not reflect the current operational state. This can hinder decision-making and prevent behavioural adjustments during voyages or operations such as dynamic positioning. However, considering the digitalization of the maritime industry and the growing pressure from regulatory agencies to make the sector more sustainable, there is a strong need to design interfaces that go beyond purely instrumental tasks and help seafarers develop new behaviours and increase their energy consciousness.
Eco-feedback research and its application in UI design in non-maritime domains
To design an effective eco-feedback UI to encourage sustainable actions, the designer should understand how users process information and make decisions related to energy consumption, considering theories of motivation and behaviour change, such as self-determination theory, 28 nudge theory, 29 goal setting, 30 and persuasive technology. 31 Understanding these theories is valuable because how information is visualized should guide design decisions. When designing for eco-feedback, many designers employ techniques such as metaphorical representations, comparative feedback, and gamification to enhance users’ understanding of energy consumption and increase engagement.27,32,33
In human–computer interaction (HCI) design, feedback is used to provide users with information about the results of their actions or the state of a system. This keeps users informed in digital environments and fulfils communication expectations during interaction. 34
In HCI, eco-feedback aims to promote environmentally responsible behaviour. According to Froehlich, 35 (p1999) ‘eco-feedback is a variation of feedback that describes strategies or technologies that can affect individual or group behaviours to reduce environmental impact and guide people toward pro-environmental behaviour’. By providing users with information about their consumption patterns, eco-feedback helps them become aware of the environmental consequences of their actions, enabling more sustainable choices. 36 This awareness, in turn, can foster ‘pro-environmental behaviour (e.g., minimizing resource and energy consumption, using non-toxic substances, and reducing waste production)’. 37 (p240)
In the context of energy management for homes and buildings, feedback has proven to be an effective approach for promoting energy conservation and raising awareness.38,39
Feedback presented on displays such as tablets, computers, or smartphones can save energy by 5% to 20%. 9 A study by Sanguinetti et al. 40 showed that prompting drivers with visual cues or tangible feedback can improve fuel efficiency by 6.8% to 18.4%. Similarly, Ahmed et al. 41 showed that in-vehicle feedback provided through dashboard displays can reduce carbon emissions by 5% to 20%.
A meta-analysis by Karlin et al., 42 which reviewed 42 studies conducted between 1976 and 2010, found that providing feedback through interactive media (e.g. computers) can influence people's energy consumption behaviour, leading to reductions of 8% to 12%. According to Darby, 43 a 25-year study demonstrated that feedback delivered via interactive media, such as smart meters, smartphones, in-home displays, or other digital devices, can reduce energy consumption by up to 20%. These findings illustrate the effectiveness of eco-feedback when provided in a specific setting using appropriate technologies. While data on long-term impacts remain limited, interactive feedback systems consistently demonstrate positive short-term effects on human behaviour, highlighting their value in promoting energy-conscious actions.
Scope and goal of this paper
While research shows that eco-feedback can be effective in helping users reduce their environmental footprint and energy consumption in various industries, its applicability in the maritime sector remains unexplored; guidelines for designing a UI for eco-feedback are lacking.
The goal of this paper is twofold. First, to conduct an extensive literature review to identify eco-feedback strategies across academic fields related to interaction design, HCI, environmental psychology, ubiquitous computing, behaviour change, persuasive technology, sustainable design, and the environment. Second, to develop a design framework that can serve as a practical and creative tool for practitioners and researchers to design more effective eco-feedback UIs that help users change their behaviour and reduce energy consumption. We present this framework and proof of concept before discussing potential other ways to use the framework.
Current maritime user interfaces
The ongoing digitalization of the maritime sector has introduced a growing variety of technologies and systems on board vessels. However, this proliferation of equipment has not been accompanied by consistent design standards, particularly at the level of the ship's bridge. In multivendor bridge systems, navigators are required to interact with equipment that presents multiple design languages across physical and digital inputs and outputs, increasing cognitive demands and the potential for operational errors.26,44
Studies have found that a significant number of seafarers report being confused by information presented across bridge systems, a problem directly linked to the coexistence of multiple equipment types on the bridge. 45 Despite the recognized need for consistency, current maritime regulations and design guidelines have not provided a clear path to user interface consistency across all bridge systems. 23
Given this fragmentation, current maritime UIs mainly focus on displaying operational data or supporting voyage planning and navigation tasks. Although such interfaces are essential for these purposes, they do not enable seafarers to make informed decisions regarding energy consumption. The information presented tends to be static and retrospective, offering little support for real-time behavioural adjustments during voyages or operations. As a result, there remains a significant gap between the data these systems provide and the energy-conscious decision-making that sustainable maritime operations increasingly require.
Research methodology
We applied the Preferred Reporting Items for Systematic Reviews and Meta-Analyses methodology to conduct the systematic literature review46,47 as follows: (1) establish the search strategy, (2) initial screening, (3) eligibility, (4) explore the resulting dataset, and (5) extract data from the dataset to build the eco-feedback framework (EFF).
Figure 1 summarizes the search process and the resulting dataset.
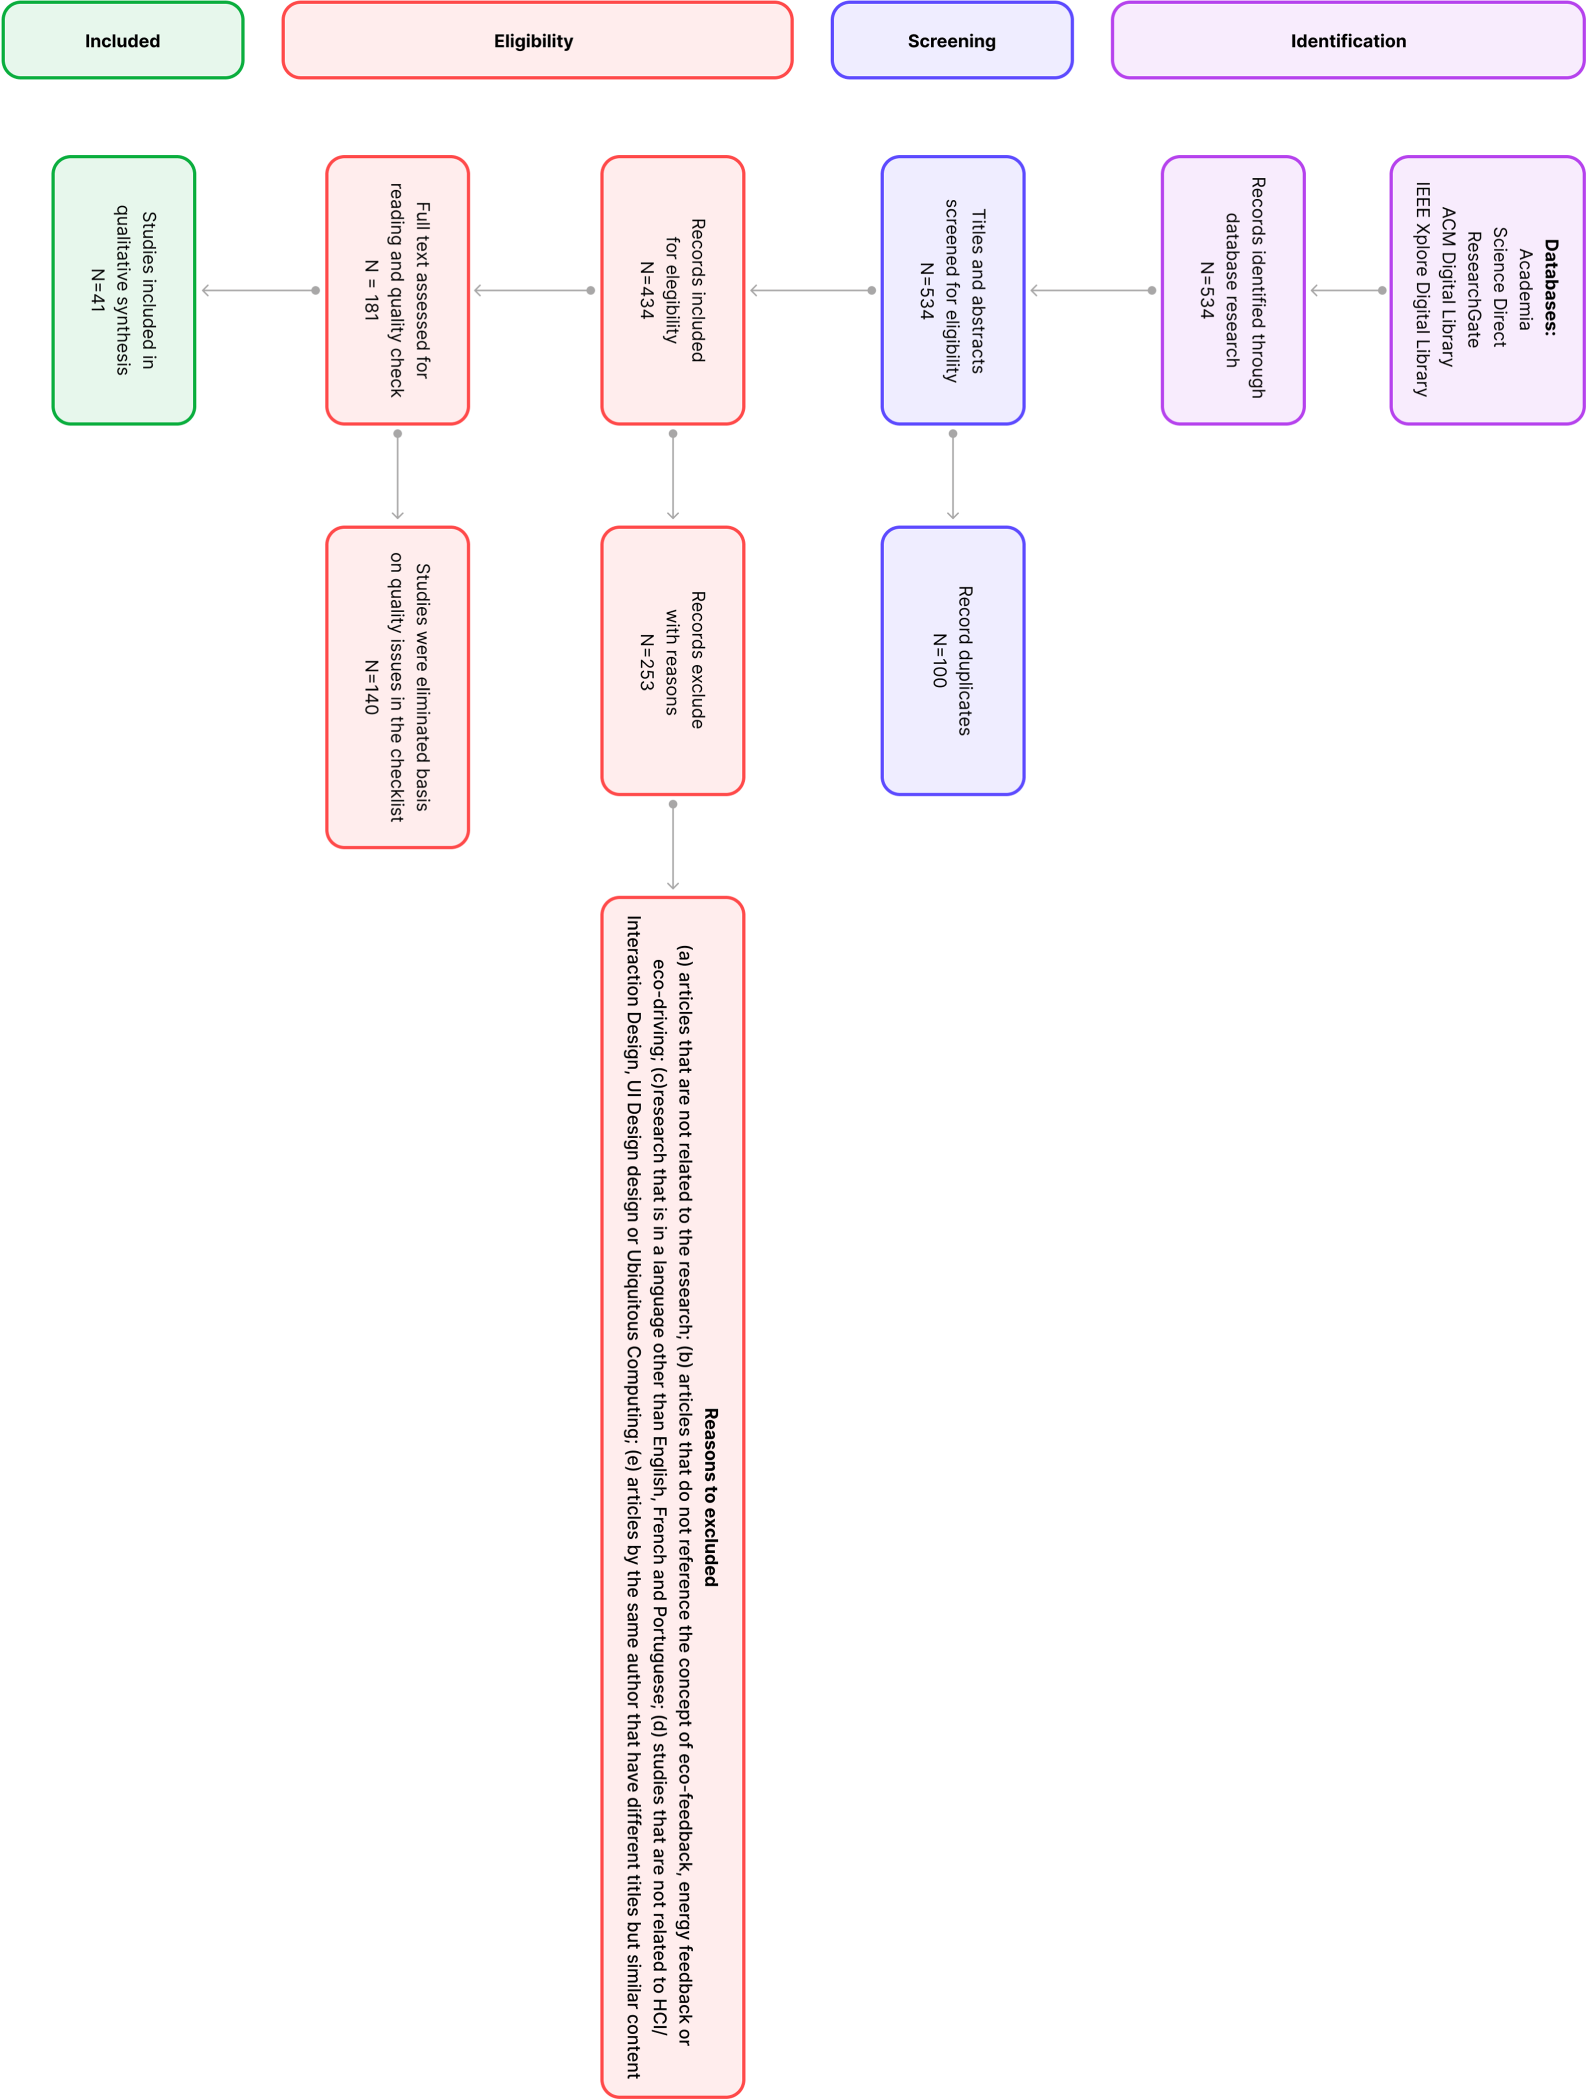
Flow diagram of the systematic review.
Eco-feedback was the primary focus of this review, and we also considered related concepts such as eco-driving and energy feedback. This strategy ensured that relevant studies were not overlooked due to variations in terminology. We conducted the literature search across five academic databases to maximize coverage and minimize bias. The search string was adapted to each database to decrease the risk of missing eligible studies. We used a comprehensive search string with core eco-feedback and related terms, employing customized, case-sensitive queries across the different databases.
The specific search queries and their results are as follows: ACM Digital Library: [Title: eco-feedback] AND [Abstract: eco-feedback] AND [Keywords: eco-feedback] yielded over 756,990 records. When we restricted the search to articles published between 1980 and 2023 [AND E-Publication Date: (01/01/1980 TO 31/12/2023)], this resulted in 22 articles. ScienceDirect: [Title, abstract, keywords: Eco-feedback, energy feedback, Eco-driving] resulted in 12 records. IEEE Xplore Digital Library: (‘Publication Title’: Eco-feedback) OR (‘Abstract’: eco-feedback) OR (‘Author Keywords’: Ecofeedback) OR (‘Author Keywords’: Eco-Feedback) OR (‘Publication Title’: ECO FEEDBACK) AND (‘Author Keywords’: Energy-Feedback) OR (‘Publication Title’: energy feedback) OR (‘Abstract’: ENERGY-FEEDBACK) AND (‘Publication Title’: Eco-driving) OR (‘Author Keywords’: Eco-Driving) OR (‘Publication Title’: ECO-DRIVING) returned 244 records. ResearchGate: (‘Publication Title’: Eco-feedback) OR (‘Abstract’: eco-feedback) OR (‘Author Keywords’: Ecofeedback) OR (‘Author Keywords’: Eco-Feedback) OR (‘Publication Title’: ECO FEEDBACK) AND (‘Author Keywords’: Energy-Feedback) OR (‘Publication Title’: energy feedback) OR (‘Abstract’: ENERGY-FEEDBACK) AND (‘Publication Title’: Eco-driving) OR (‘Author Keywords’: Eco-Driving) OR (‘Publication Title’: ECO-DRIVING) retrieved 100 articles. Academia: We performed the following query: ‘Eco-feedback’, ‘eco-feedback’, ‘ecofeedback’, ‘Eco-Feedback’, ‘ECO FEEDBACK’, ‘Energy-Feedback’, ‘energy feedback’, ‘ENERGY-FEEDBACK’, ‘Eco-driving’, ‘Eco-Driving’, ‘ECO-DRIVING’. This search returned 1539 results. After filtering the time span of 1980 to 2023, the results narrowed down to 111 journal articles and 45 conference articles in English, totalling 156 articles.
After removing duplicates, we screened the titles and abstracts to exclude articles that did not reference the concept of eco-feedback and were not related to HCI/interaction design, UI design, or ubiquitous computing.
Then, we screened the full text of the remaining articles and used the JBI checklist to assess the relevance of the articles. 48 We excluded any articles that did not meet all the criteria of the JBI checklist.
We examined key information contained in the dataset, such as the distribution of publication years and countries. Analysing these distributions provides valuable insights into the temporal and geographical trends of research within the field. The year distribution reveals how interest in the topic has evolved, for example, whether research on eco-feedback or energy-conscious design has increased in recent years, indicating growing academic and industrial relevance. Similarly, analysing the countries of publication highlights where research efforts are concentrated, revealing regional leadership, policy influence, or cultural emphasis on sustainability and design practices.
Subsequently, we explored how each article approached eco-feedback and how it was applied within design processes, particularly from the perspective of designers.
We analysed each article and identified the individual descriptions and categorizations of eco-feedback. From this process, we created a cluster of all the identified eco-feedback types. Next, we compiled a comprehensive list of these eco-feedback strategies, along with their definitions. In the second iteration, we began grouping each feedback type into affinity categories based on similarities and shared characteristics. In the third iteration, these feedback groups were organized into distinct design patterns. This structured process resulted in the development of the EFF (see Figure 2).
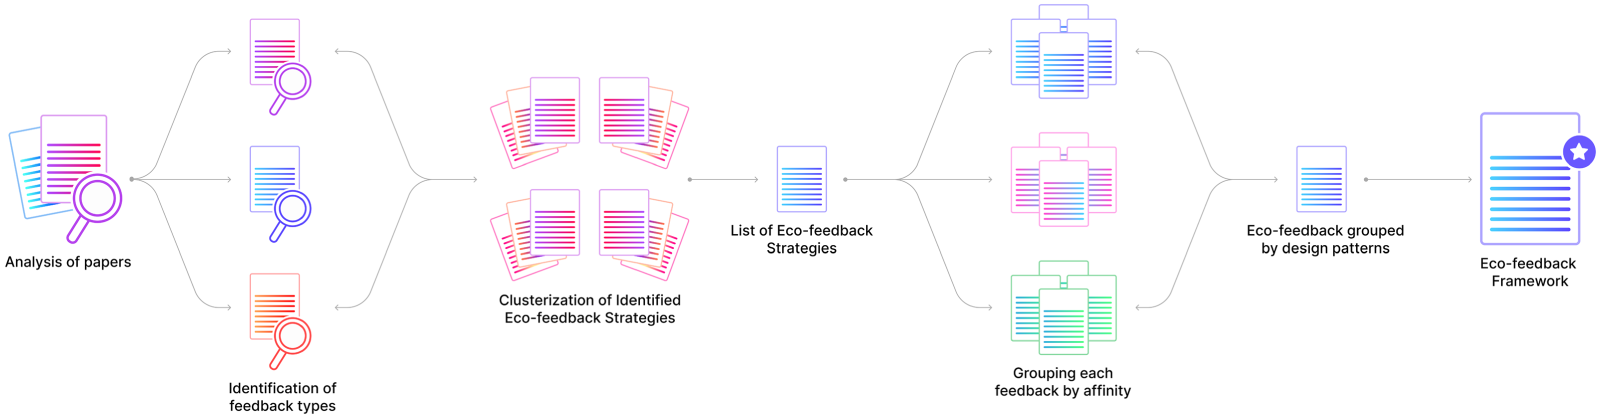
Flow of the development process of the eco-feedback framework.
We first present the obtained dataset (i.e. the list of articles that resulted from the systematic search and screening). Then, we look at the dataset itself, and finally, we present the EFF.
The dataset
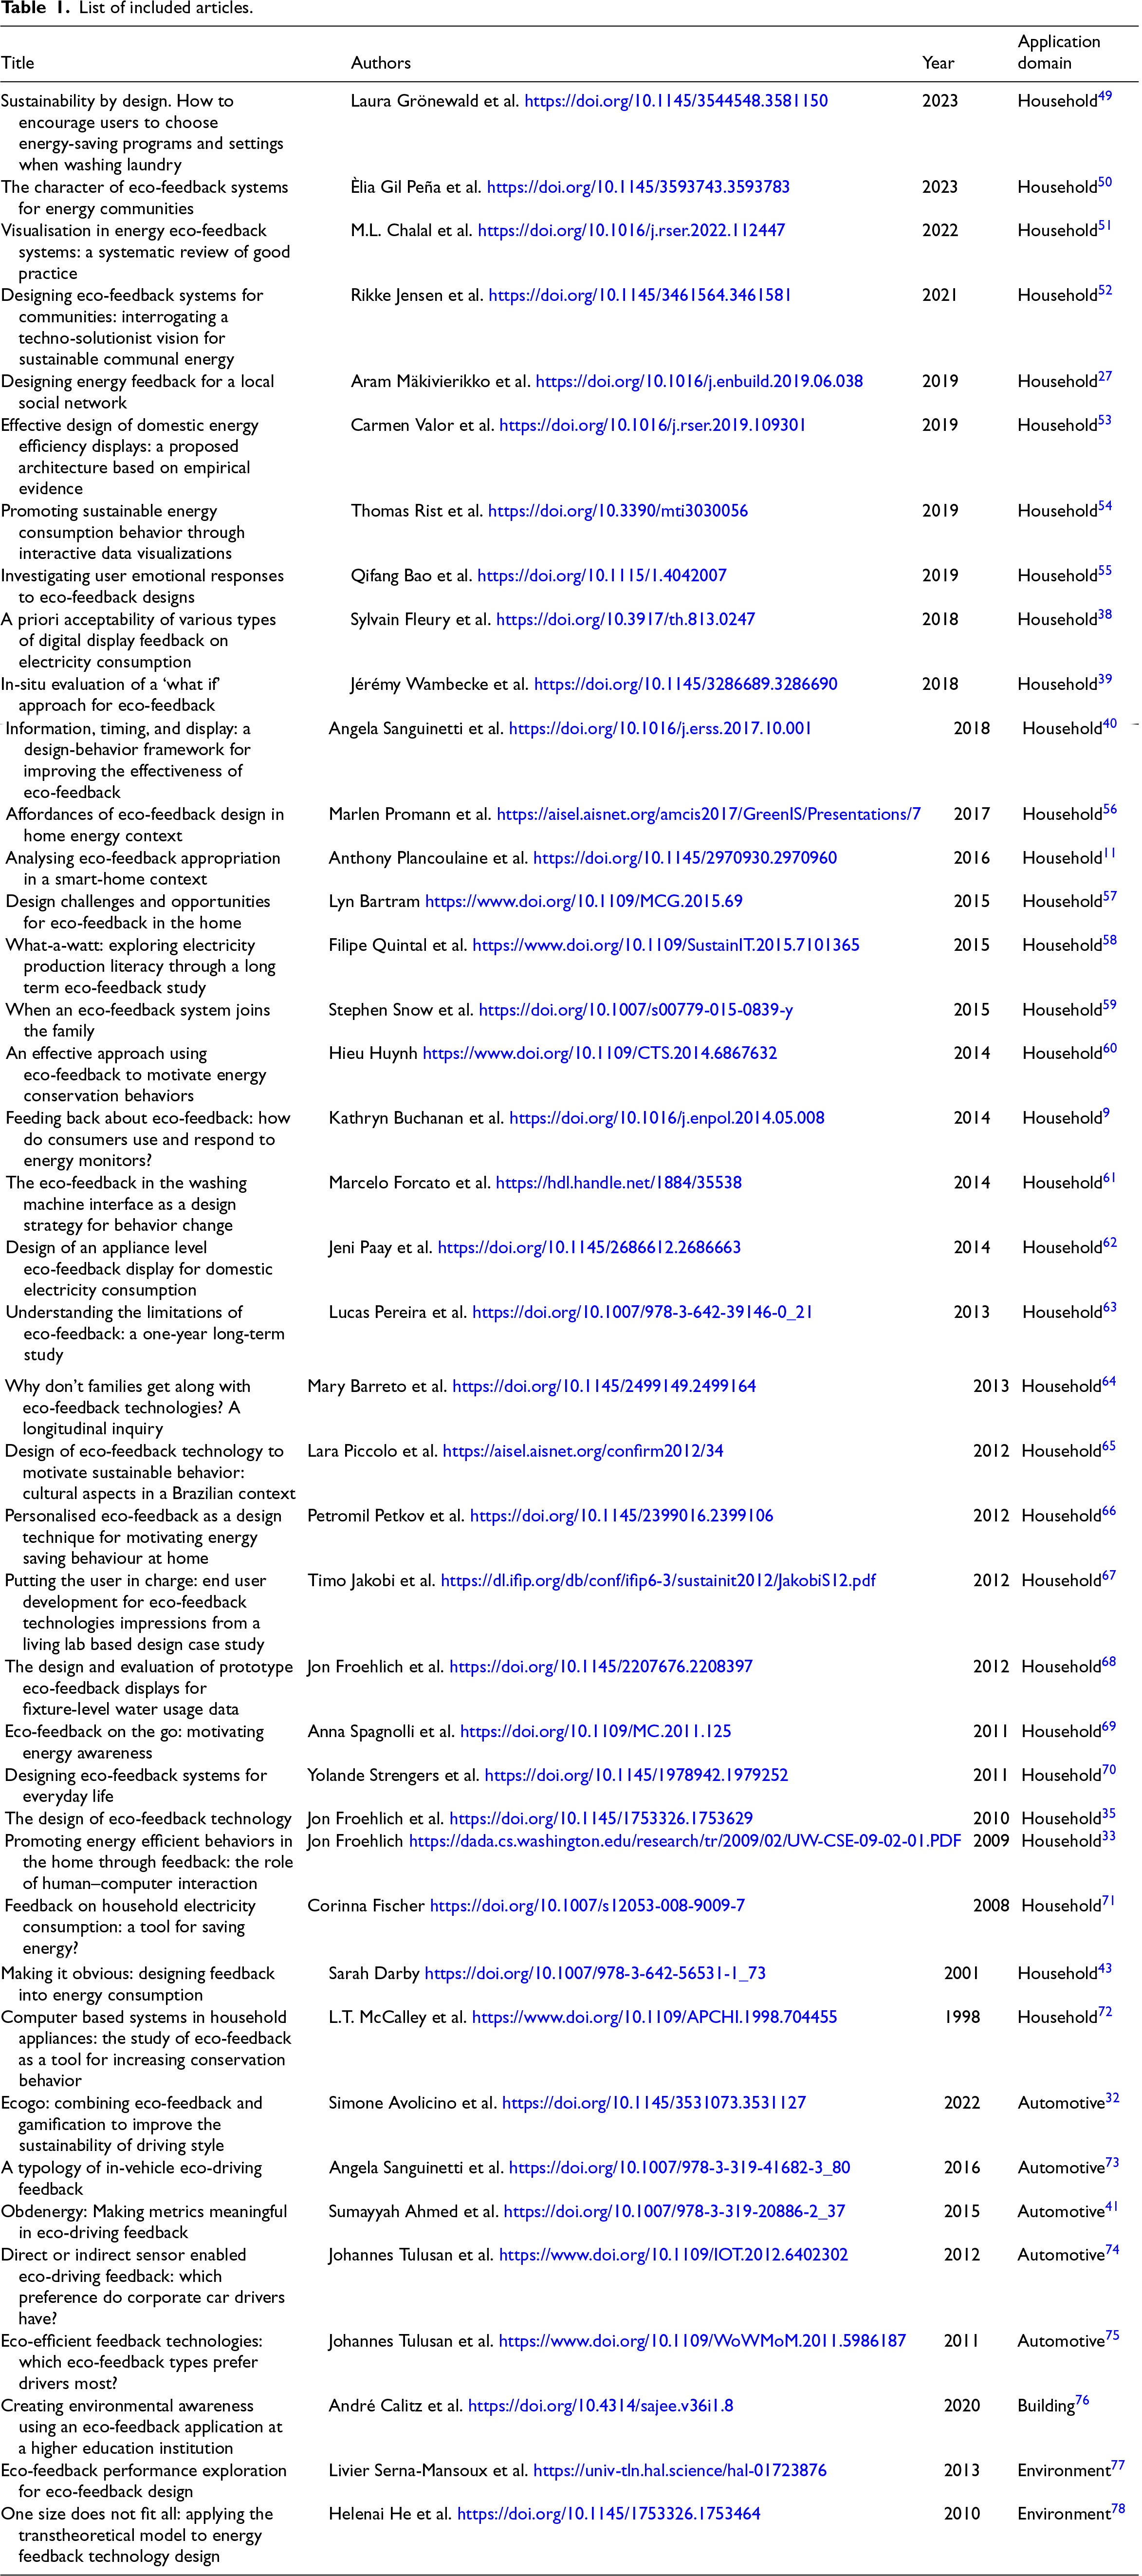
The initial search yielded 534 articles, of which 41 were eligible for inclusion in the study. Of these, 14 are journal articles and 27 are conference papers. Table 1 provides an overview of the selected studies.
List of included articles.
List of included articles.
The selected articles for this study came from various domains. The most prevalent domain for the application of eco-feedback strategies was the household, where eco-feedback was used to reduce energy and water consumption, monitor household waste, and promote behaviour change. Although fewer in number, other studies demonstrated the application of eco-feedback in domains such as the automotive industry, buildings, and environmental monitoring.
The following list is organized by descending year of publication and application domain.
The EFF is a design framework encompassing 39 eco-feedback strategies categorized into five main types: direct, indirect, offline, real-time, and accumulated. Additionally, the framework incorporates five design patterns: self-evaluation, comparison, temporal, metaphorical, style, and visual design. The eco-feedback strategies and design patterns presented in this framework can be applied either individually or in combination, depending on the goals of the practitioners or the project. Their applicability is not limited to specific contexts or domains.
Our aim with this framework is to offer practitioners a set of actionable strategies for designing more effective eco-feedback UIs. These strategies are considered eco-feedback strategies because they represent planned, systematic approaches intended to influence behaviour to achieve specific environmental goals, such as reducing energy consumption, water use, or emissions. 68
The EFF provides designers and researchers with a theoretical and practical basis for creating more engaging and effective eco-feedback systems. The framework integrates several aspects of eco-feedback previously treated in isolation in the academic literature. Figure 3 depicts how the framework is structured.
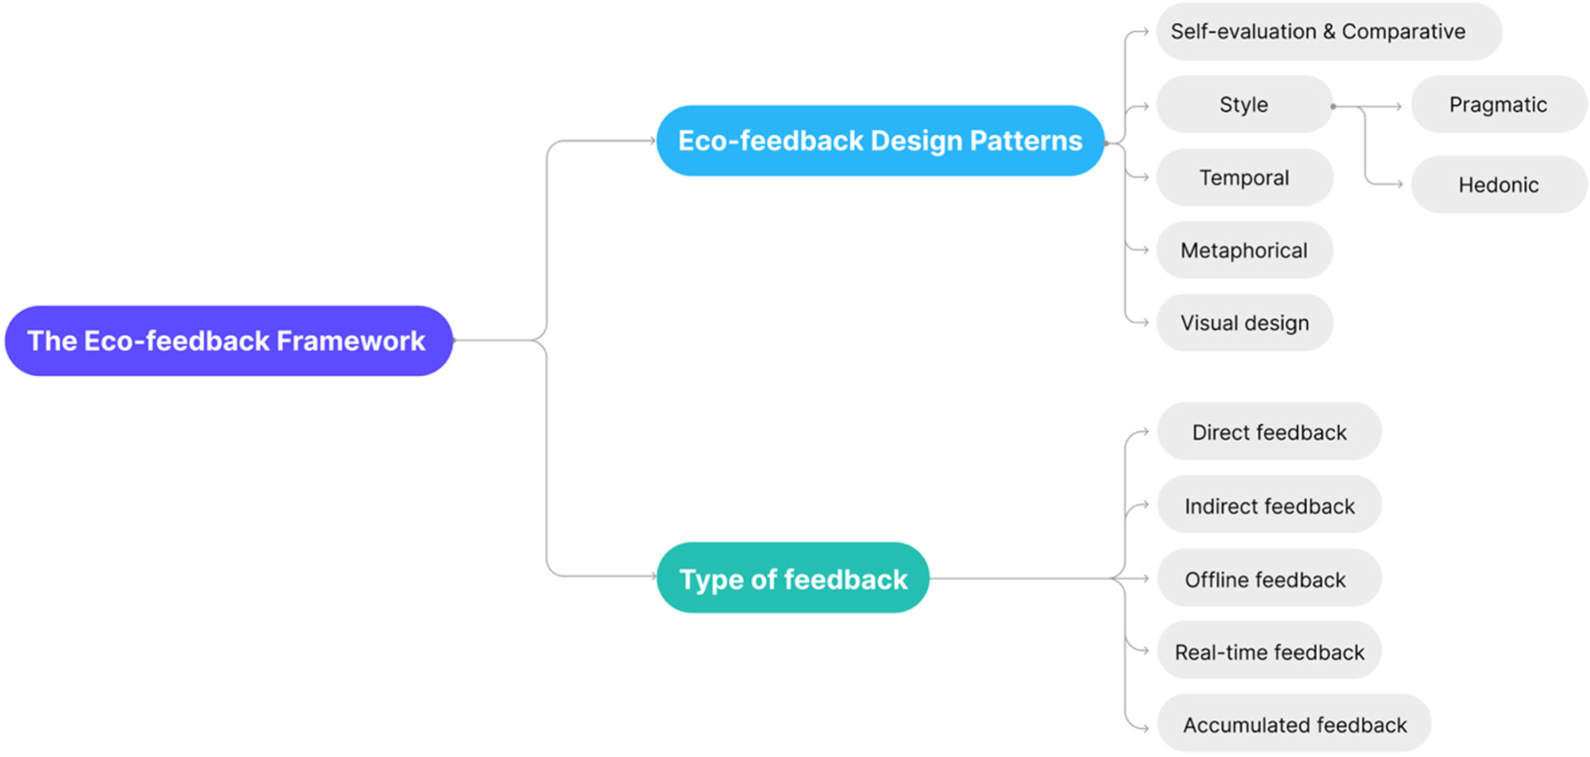
Eco-feedback framework structure.
In the next sections, we introduce the main components of the EFF, starting with the type of feedback.
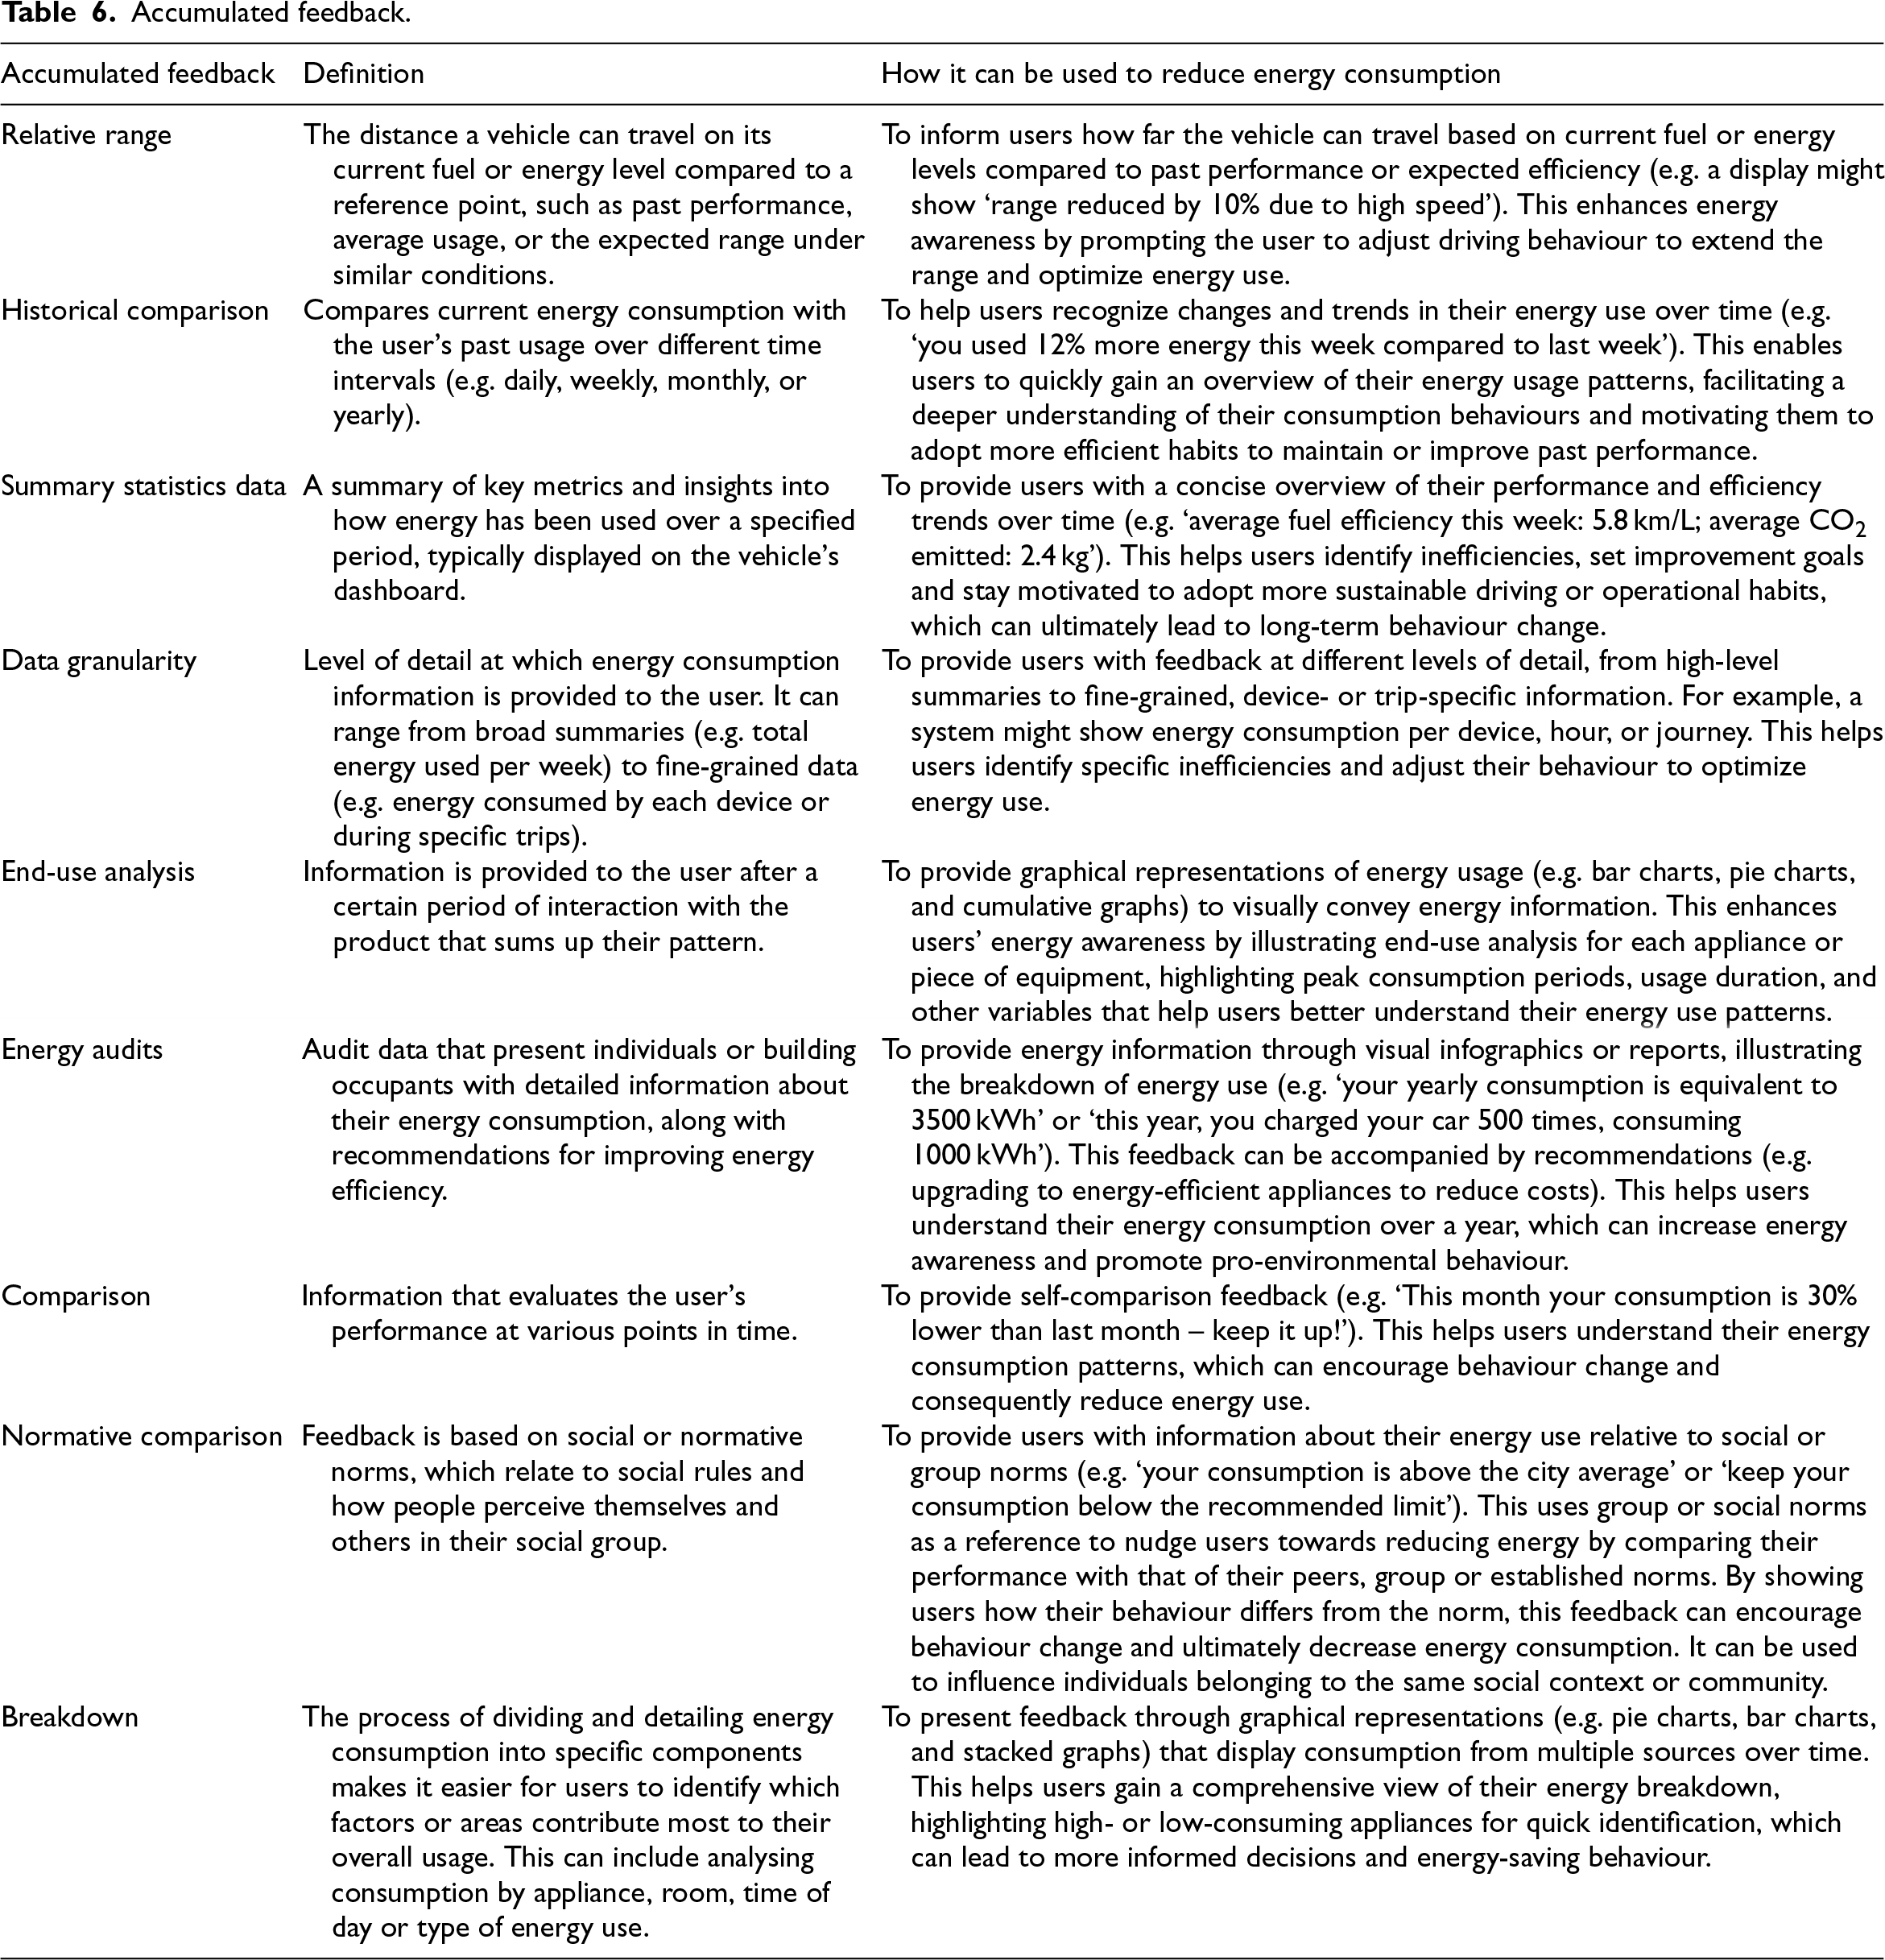
We identify five types of feedback: direct, indirect, offline, real-time, and accumulated. Each type of feedback can function independently or be combined with other eco-feedback strategies to enhance the user experience regarding energy consumption and decision-making processes. Each type can target different behaviours. For instance, they can inform users about energy consumption, nudge them towards better energy management or raise awareness about ecological impacts or economic waste, such as leaving appliances in standby mode, excessive use of air conditioning and heating or inefficient water heaters. Tables 2–6 summarize the different eco-feedback strategies, which total 39 strategies.
Direct feedback.
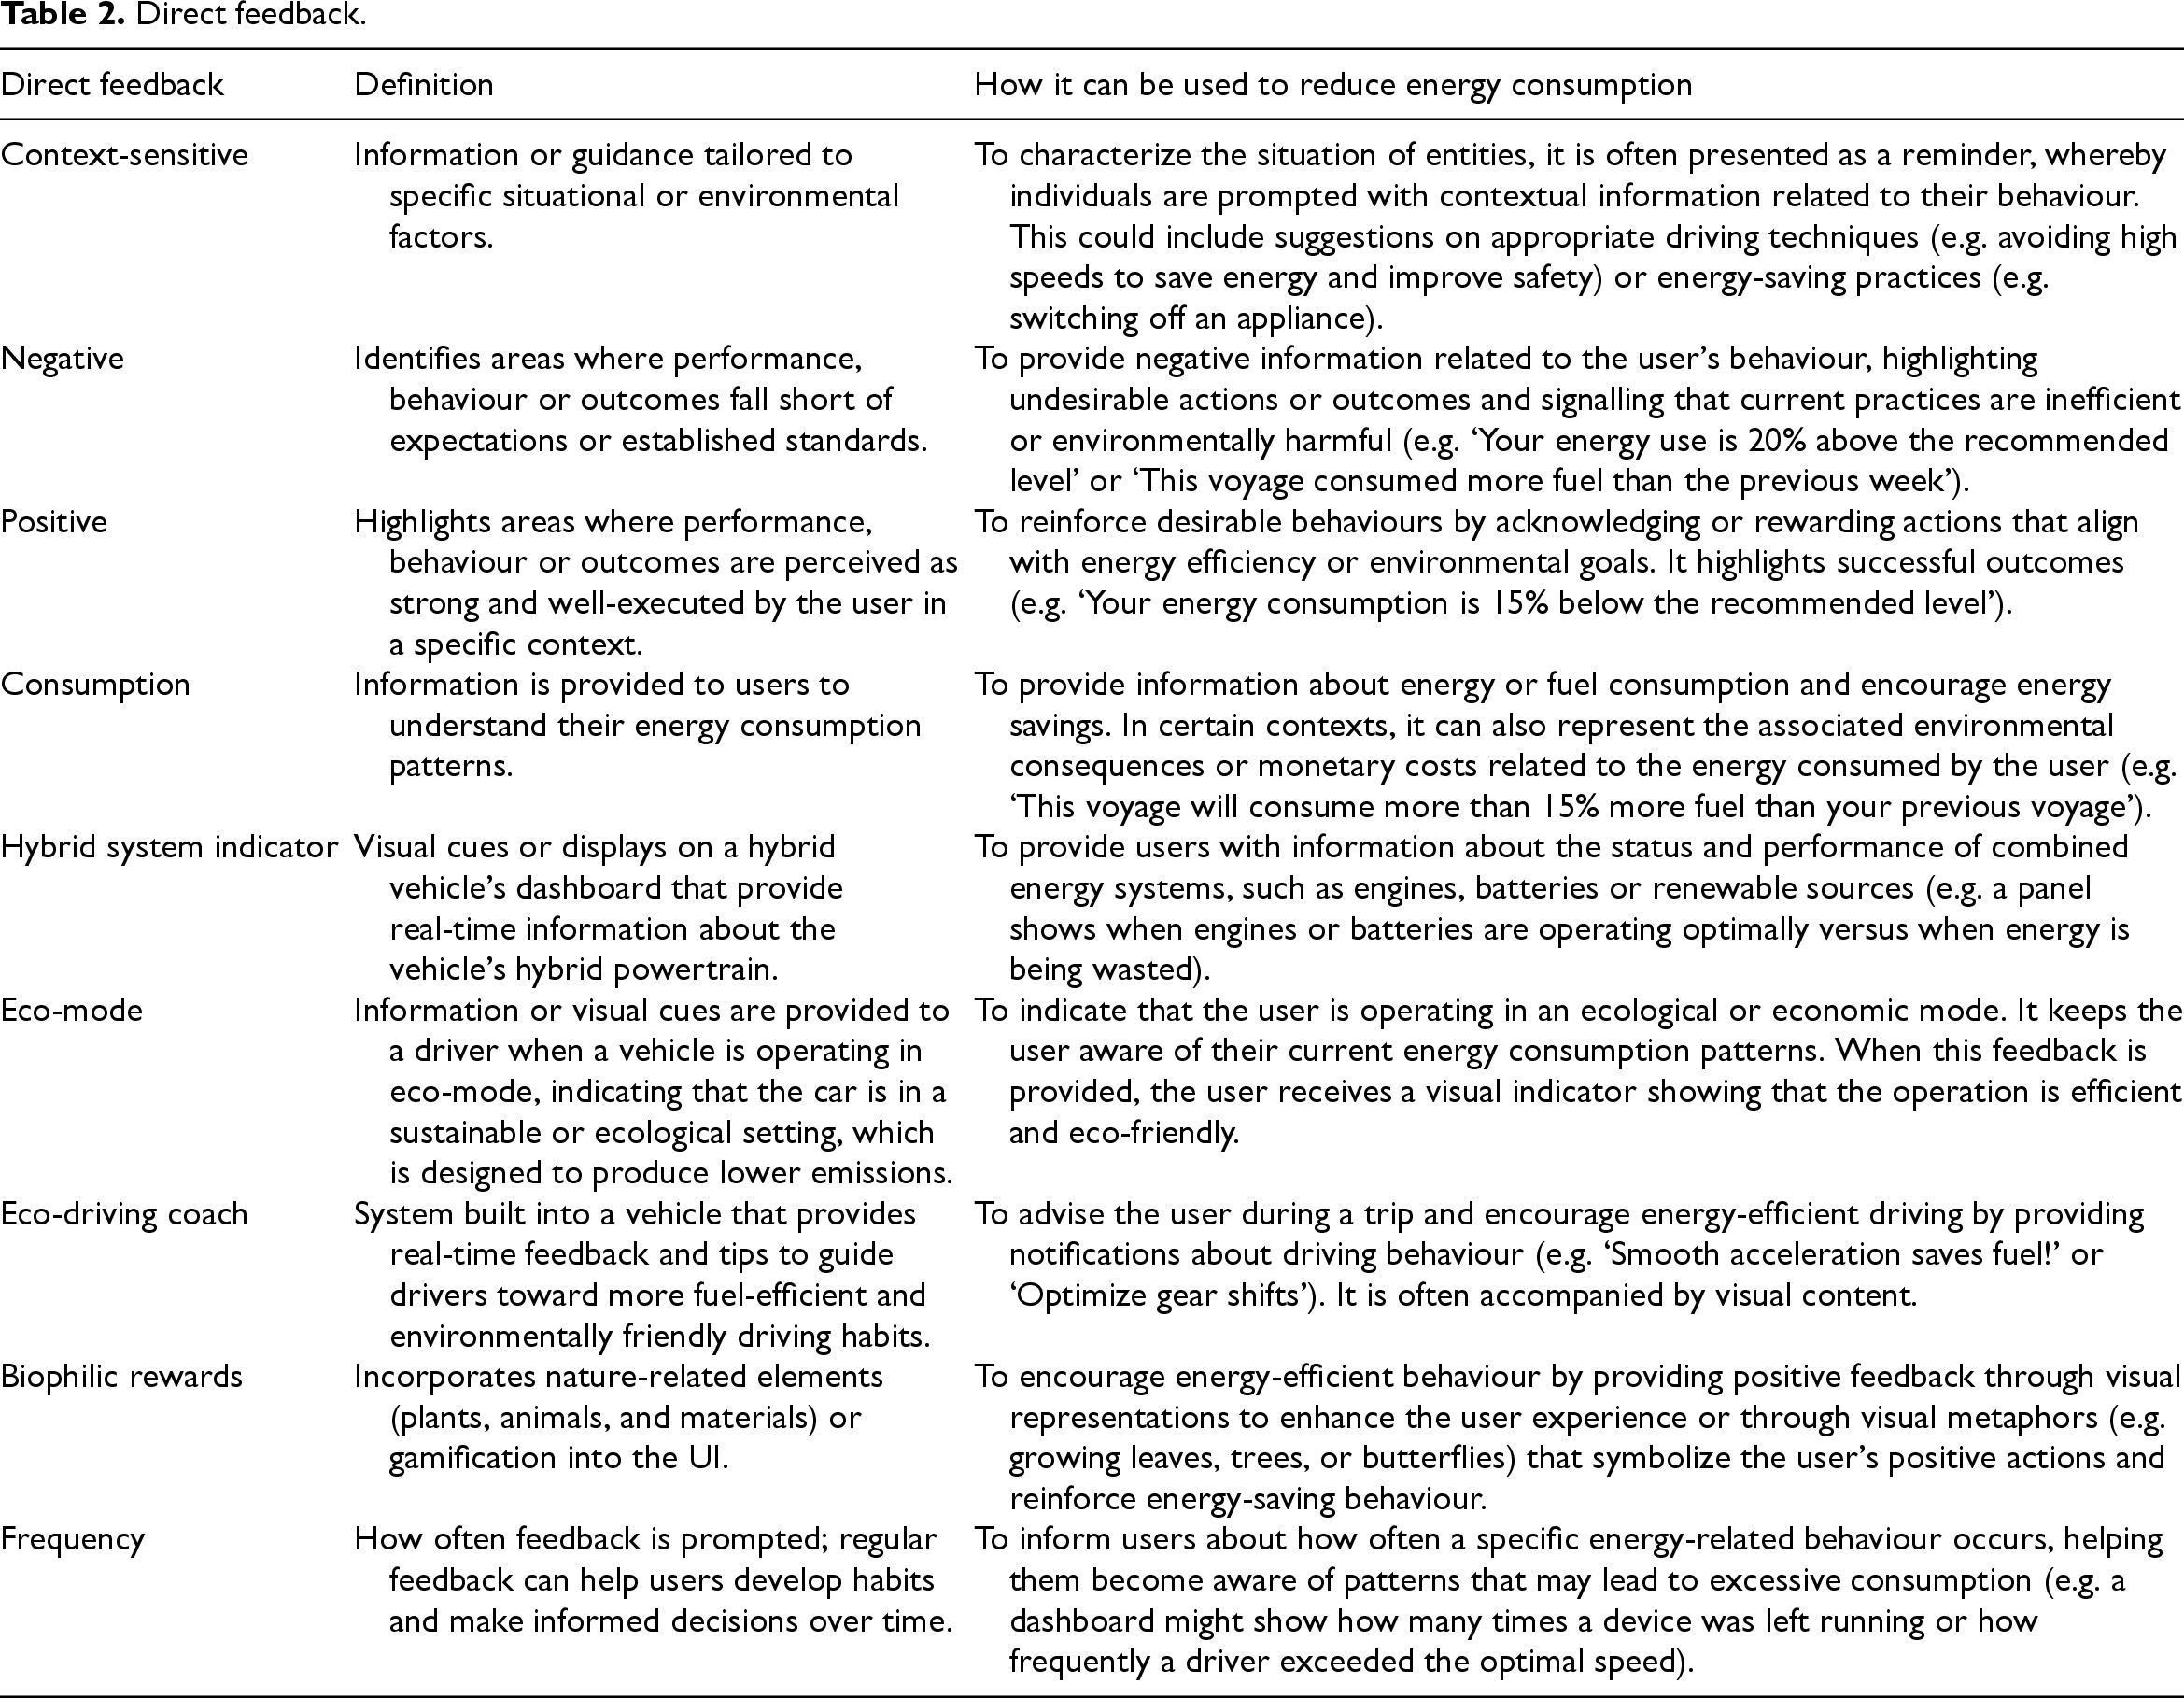
Direct feedback.
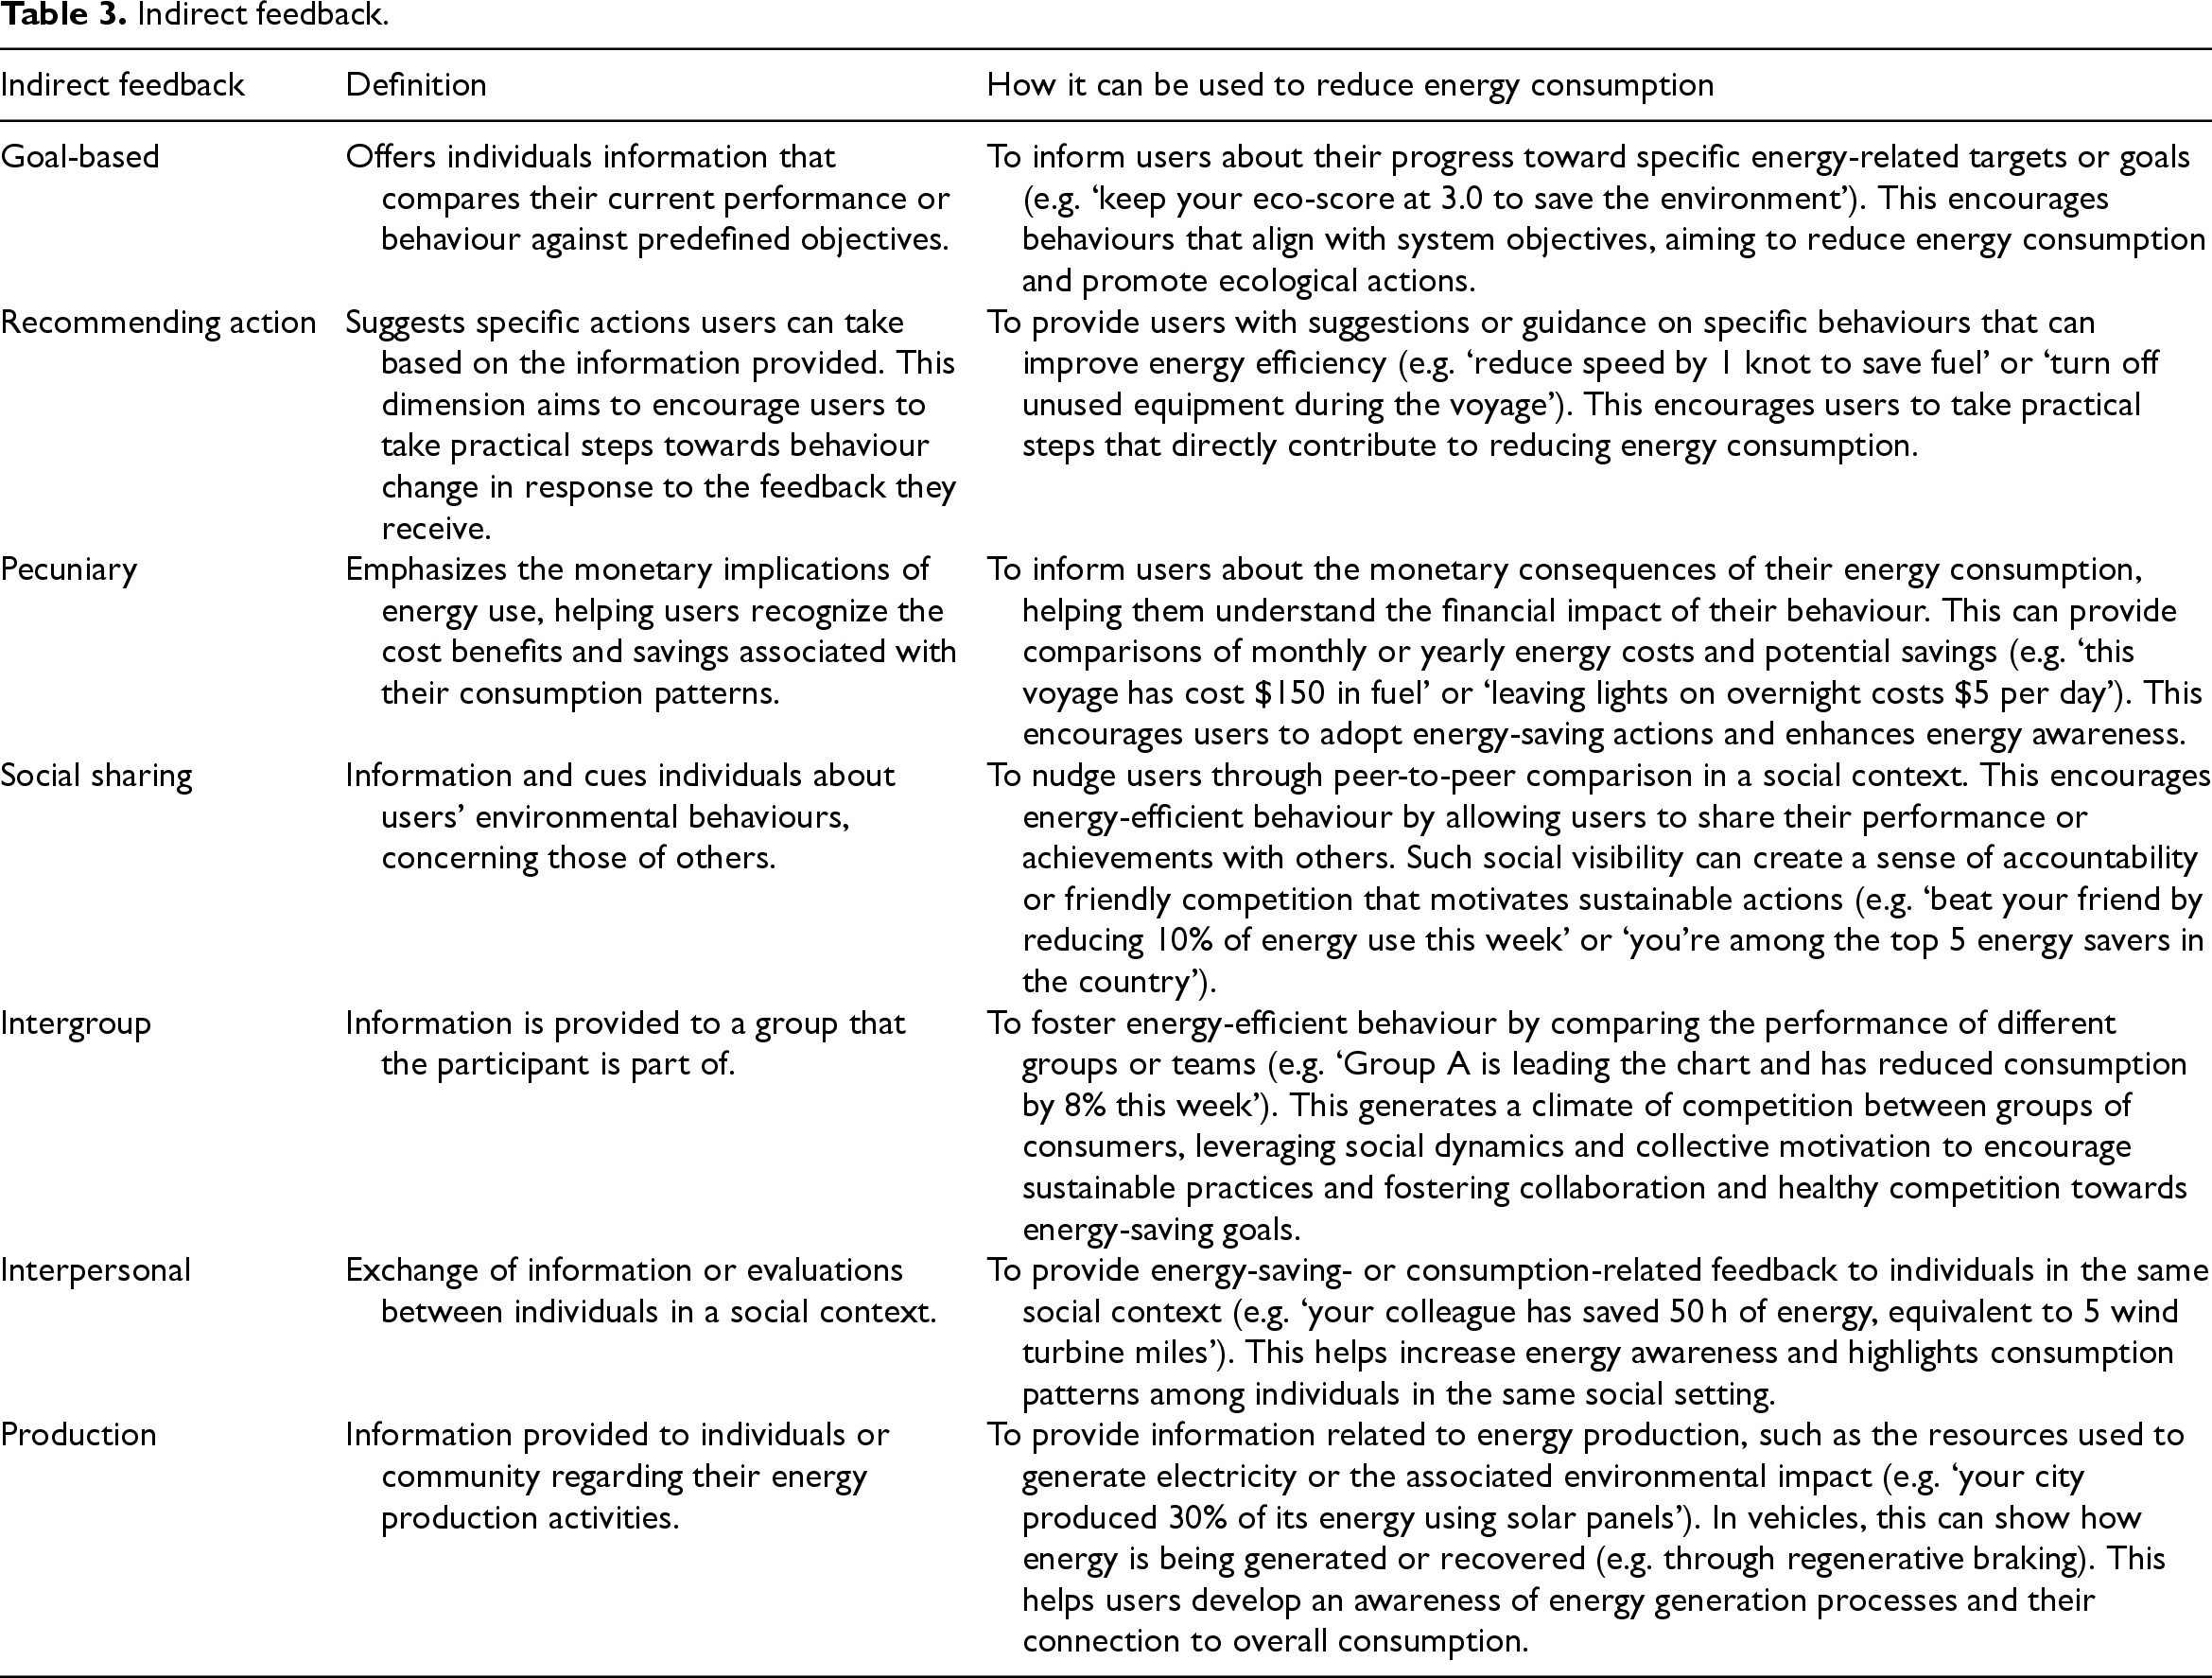
Indirect feedback.
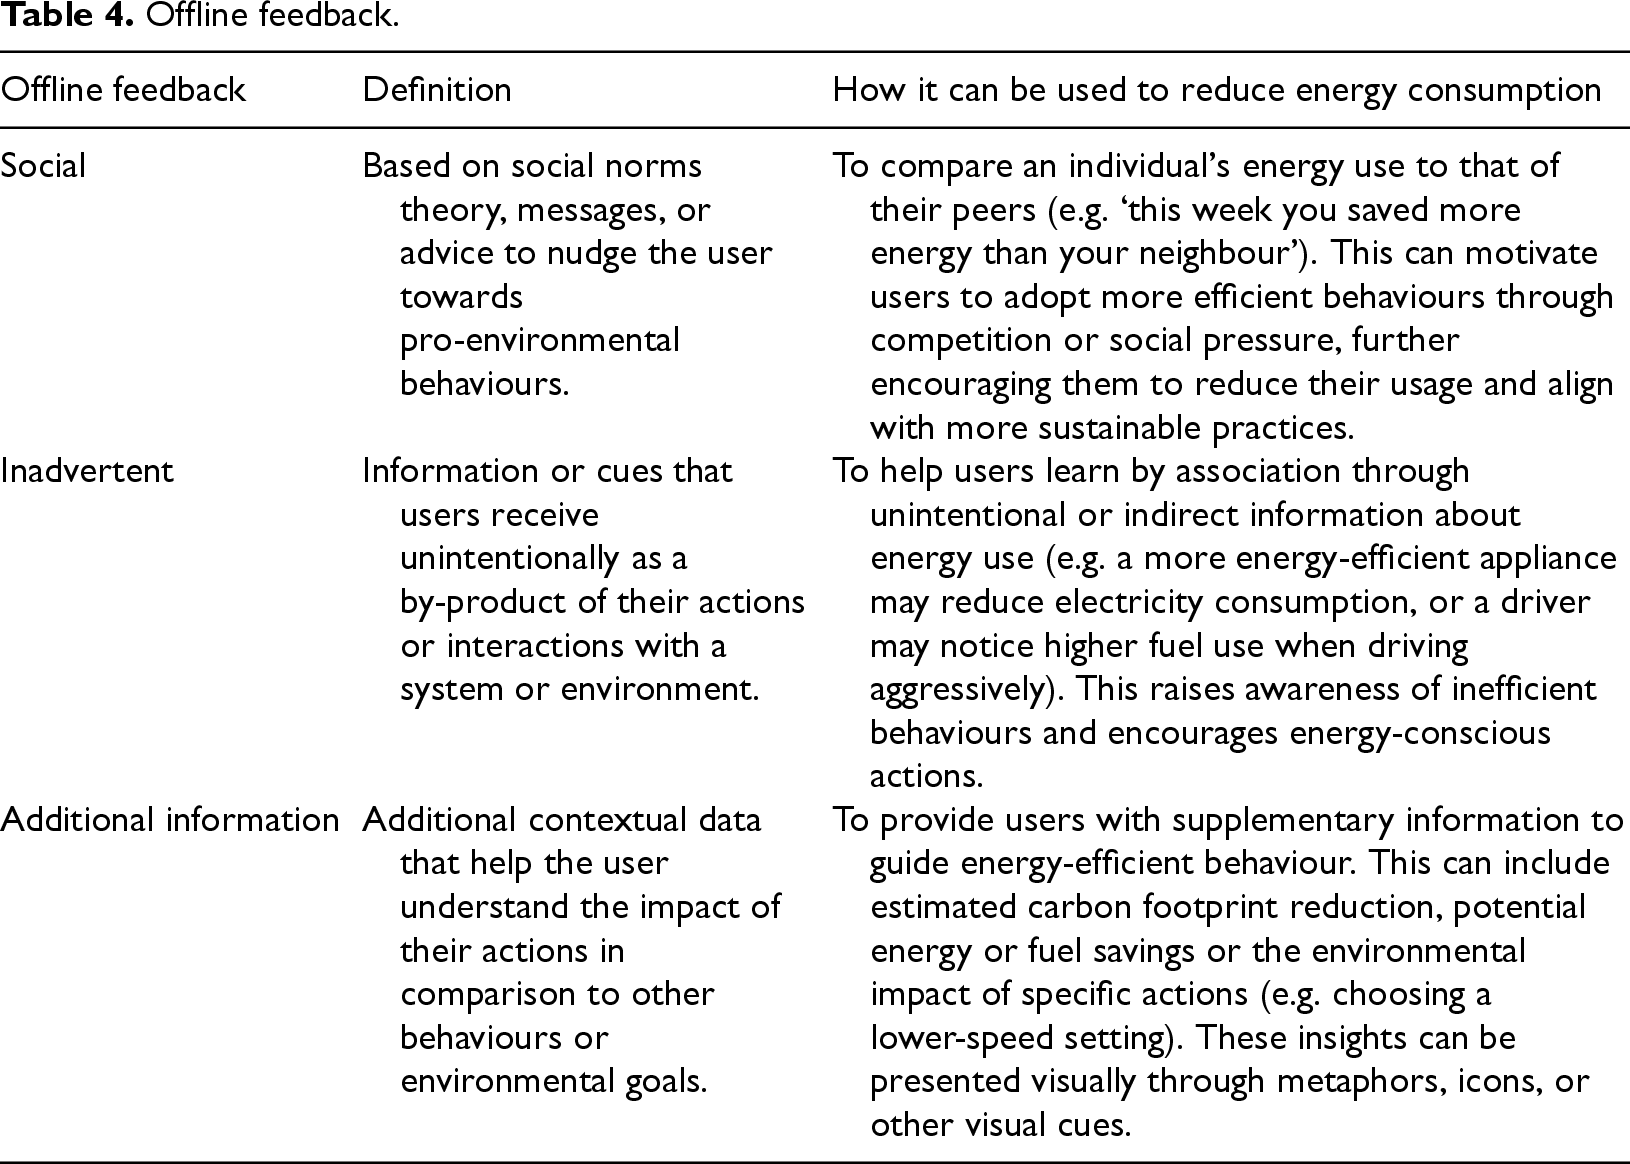
Offline feedback.
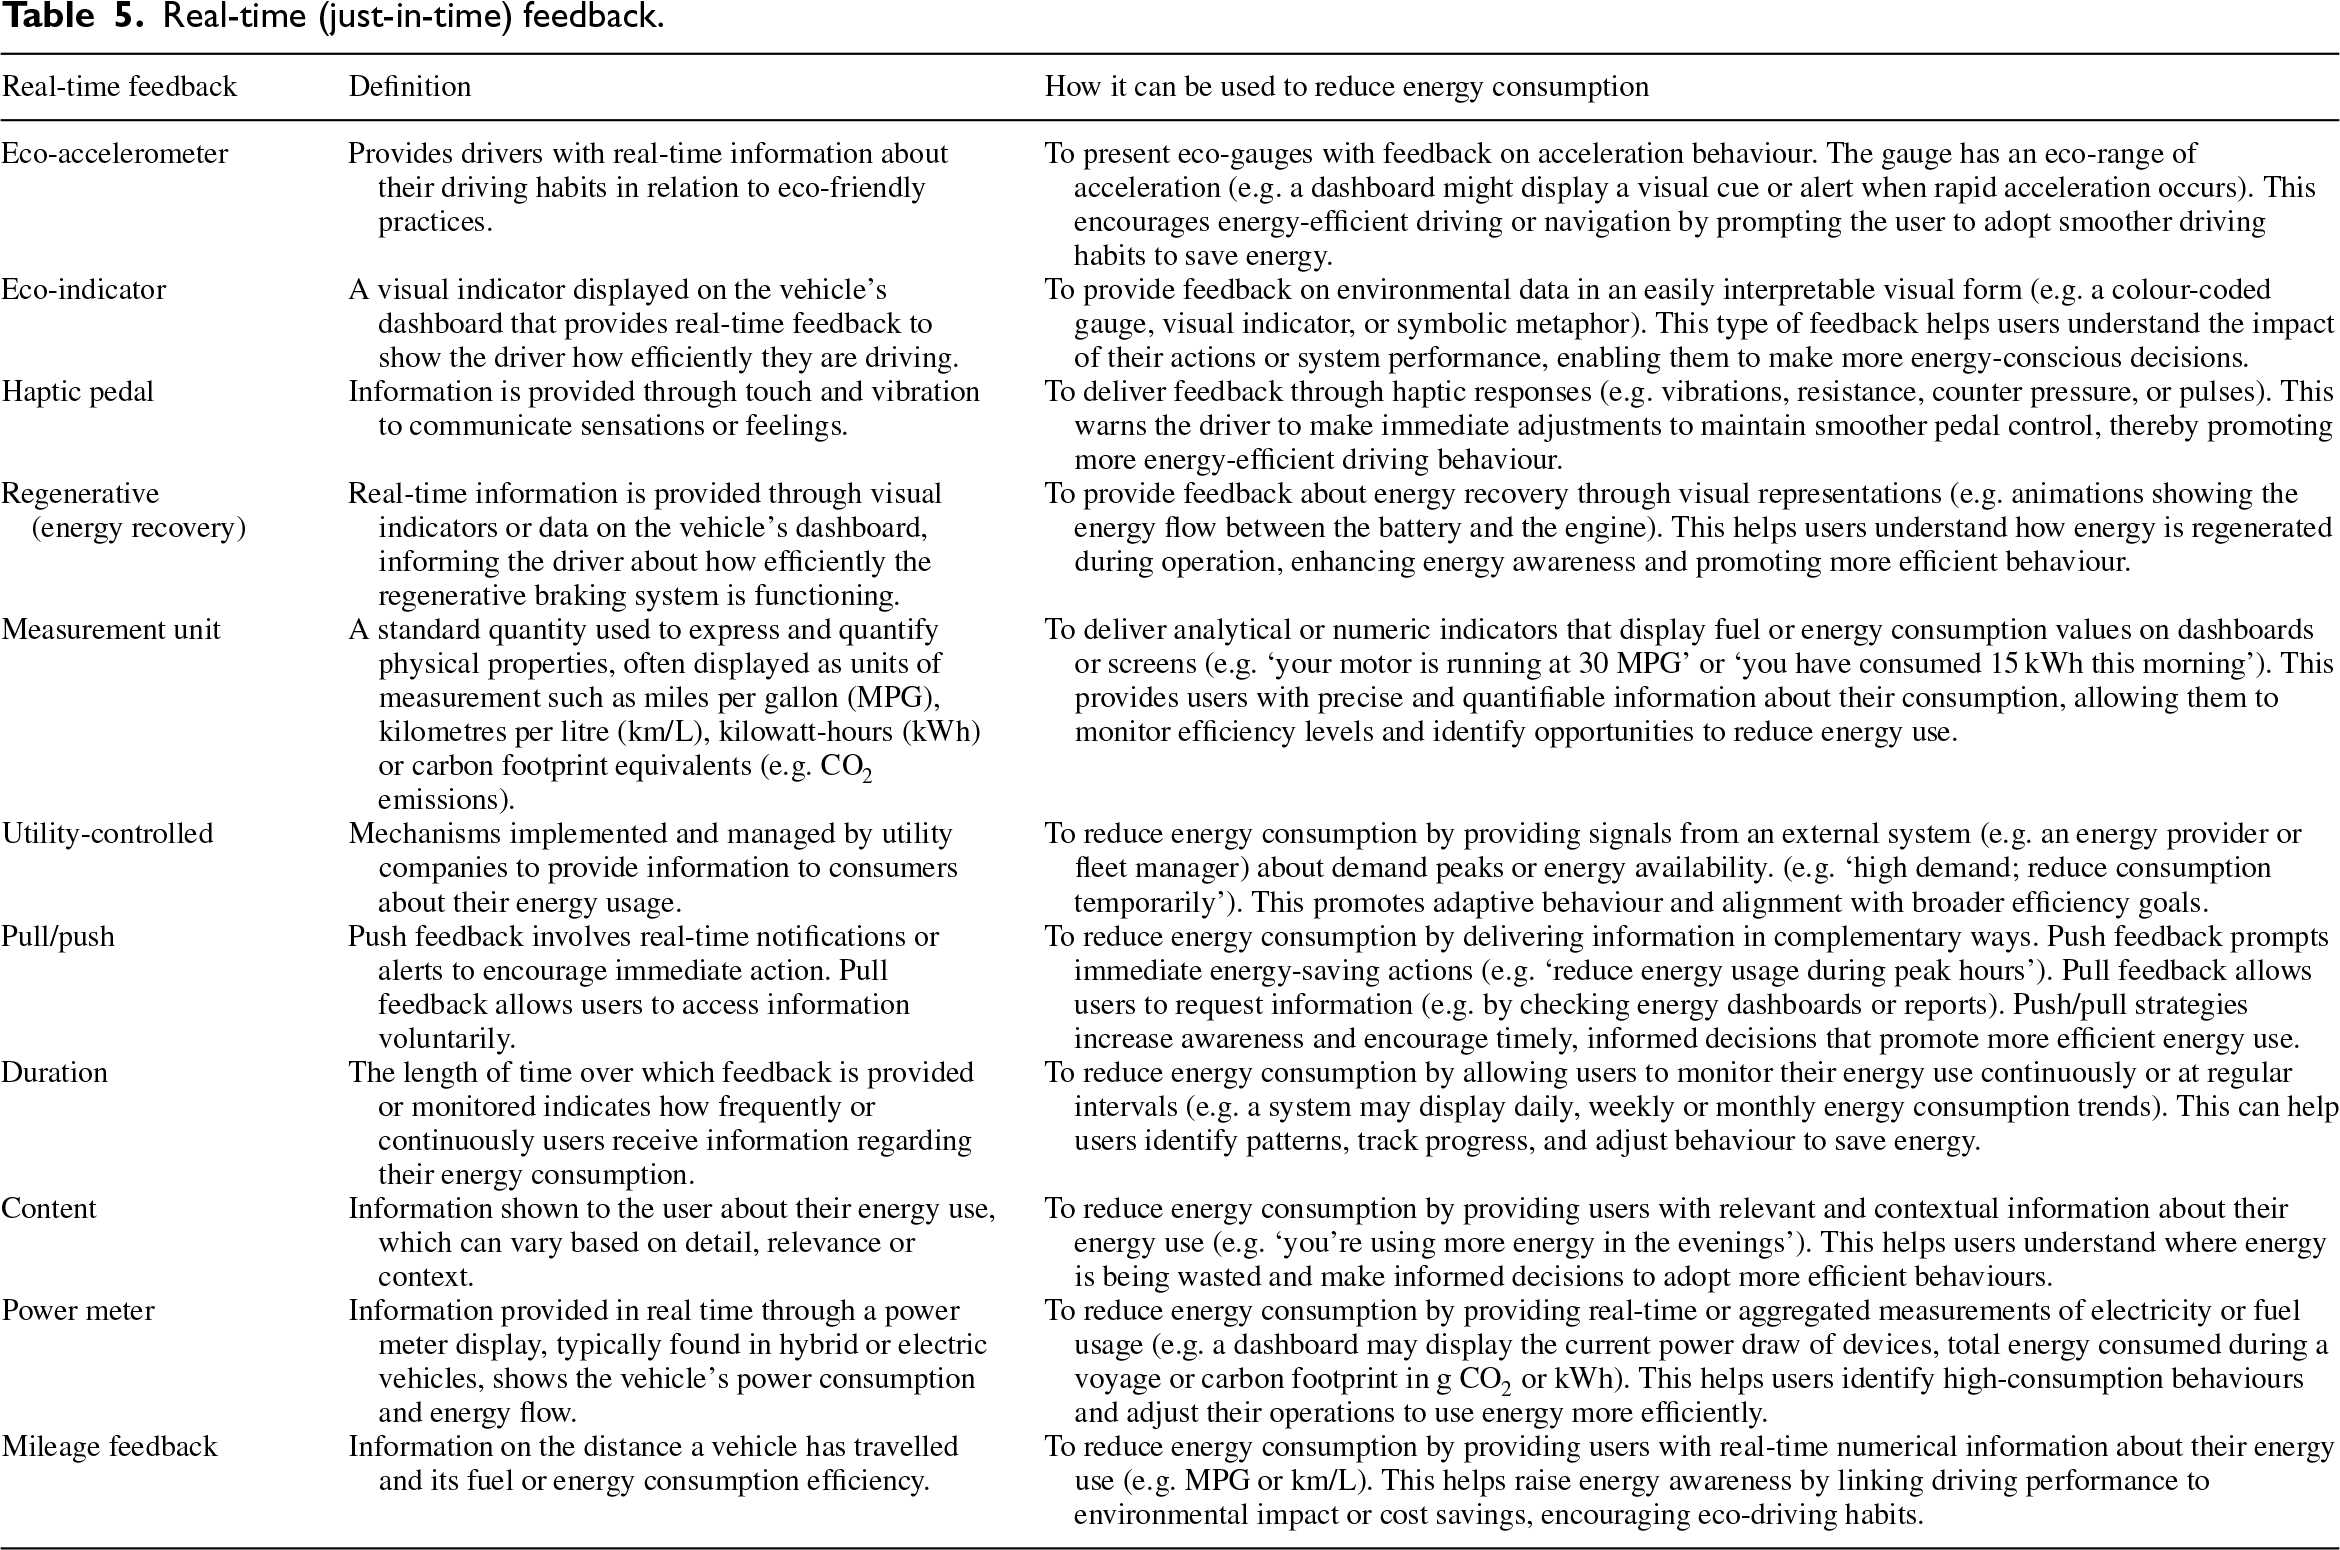
Real-time (just-in-time) feedback.
Accumulated feedback.
This type of feedback explicitly communicates information about the impact of an action in a clear and understandable way, directly linking the user's behaviour to its environmental consequences. Typically provided shortly after the behaviour occurs, it ensures that users can easily associate their actions with the resulting outcomes (see Table 2).
Indirect feedback
This refers to information or cues given to individuals that indirectly communicate evaluation, guidance, or suggestions about their actions, behaviours, or performance (see Table 3).
Offline feedback
This refers to information, evaluation, or comments provided to individuals outside of real-time or immediate interaction (see Table 4).
Real-time (just-in-time) feedback
This feedback is delivered immediately after an action is taken, allowing for immediate awareness and response (see Table 5).
Accumulated feedback
This refers to the results from aggregating multiple sources or instances of feedback, such as evaluations, assessments or comments collected over days, weeks or months (see Table 6).
Design patterns
According to Bosch, 79 (p1) ‘design patterns provide solutions to general design problems that can be customized for particular applications’. We categorize these patterns into self-evaluation and comparative, temporal, style (pragmatic or hedonic), metaphorical, and visual design to guide designers and researchers in creating an eco-feedback UI that meets different needs. For example, feedback can focus on practical actions (pragmatic), use metaphors to convey ideas or compare a user's performance to themselves or others. Each approach helps users achieve their sustainability goals in unique ways.
Self-evaluation and comparative design pattern
Self-evaluation and comparative patterns are often influenced by the context in which feedback is presented. For example, the eco-score can serve as individual feedback reflecting personal progress. However, if the presentation includes an average score from other users, it becomes a comparison. Likewise, self-comparisons can be an assessment of the user's behaviour over time and an indirect comparison when aligned with standardized goals.
Temporal design pattern
The temporal perspective differentiates between immediate feedback (real-time data for instant behavioural adjustments) and long-term cumulative feedback (data that encourage reflection and gradual adjustments over time). The distinctions based on temporal perspective illustrate how feedback can be tailored to meet immediate needs (e.g. adjusting behaviour while driving) or foster long-term reflections on consumption habits.
Style design pattern
The style perspective refers to how eco-feedback is presented to the user. We identify two distinct presentation styles of eco-feedback: pragmatic and hedonic.
Pragmatic
The pragmatic style focuses on efficiency, measurable outcomes, and observable behaviours. This style is essential for optimizing actions and promoting better resource utilization because it emphasizes numerical or analytical data. It provides users with concrete feedback to drive immediate improvements in their behaviour.
Hedonic
The hedonic style focuses on user experience, emotional responses, and personal satisfaction. This approach examines how individuals perceive their actions and the influence of social dynamics on their behaviour. The emphasis is on subjective experiences, enjoyment, and social context rather than strictly on performance metrics. Such a focus is important for reflecting on and understanding behaviour over time.
Metaphorical
Eco-feedback elements can use visual or conceptual metaphors to represent consumption and encourage sustainable behaviours, often manifesting through symbols or visual representations that evoke natural or behavioural concepts. These elements facilitate comprehension and foster engagement, making abstract ideas about energy use and conservation more relatable and intuitively understandable. By connecting environmental actions with familiar metaphors, such feedback helps users internalize sustainable practices on an emotional and cognitive level, ultimately promoting lasting behavioural change.
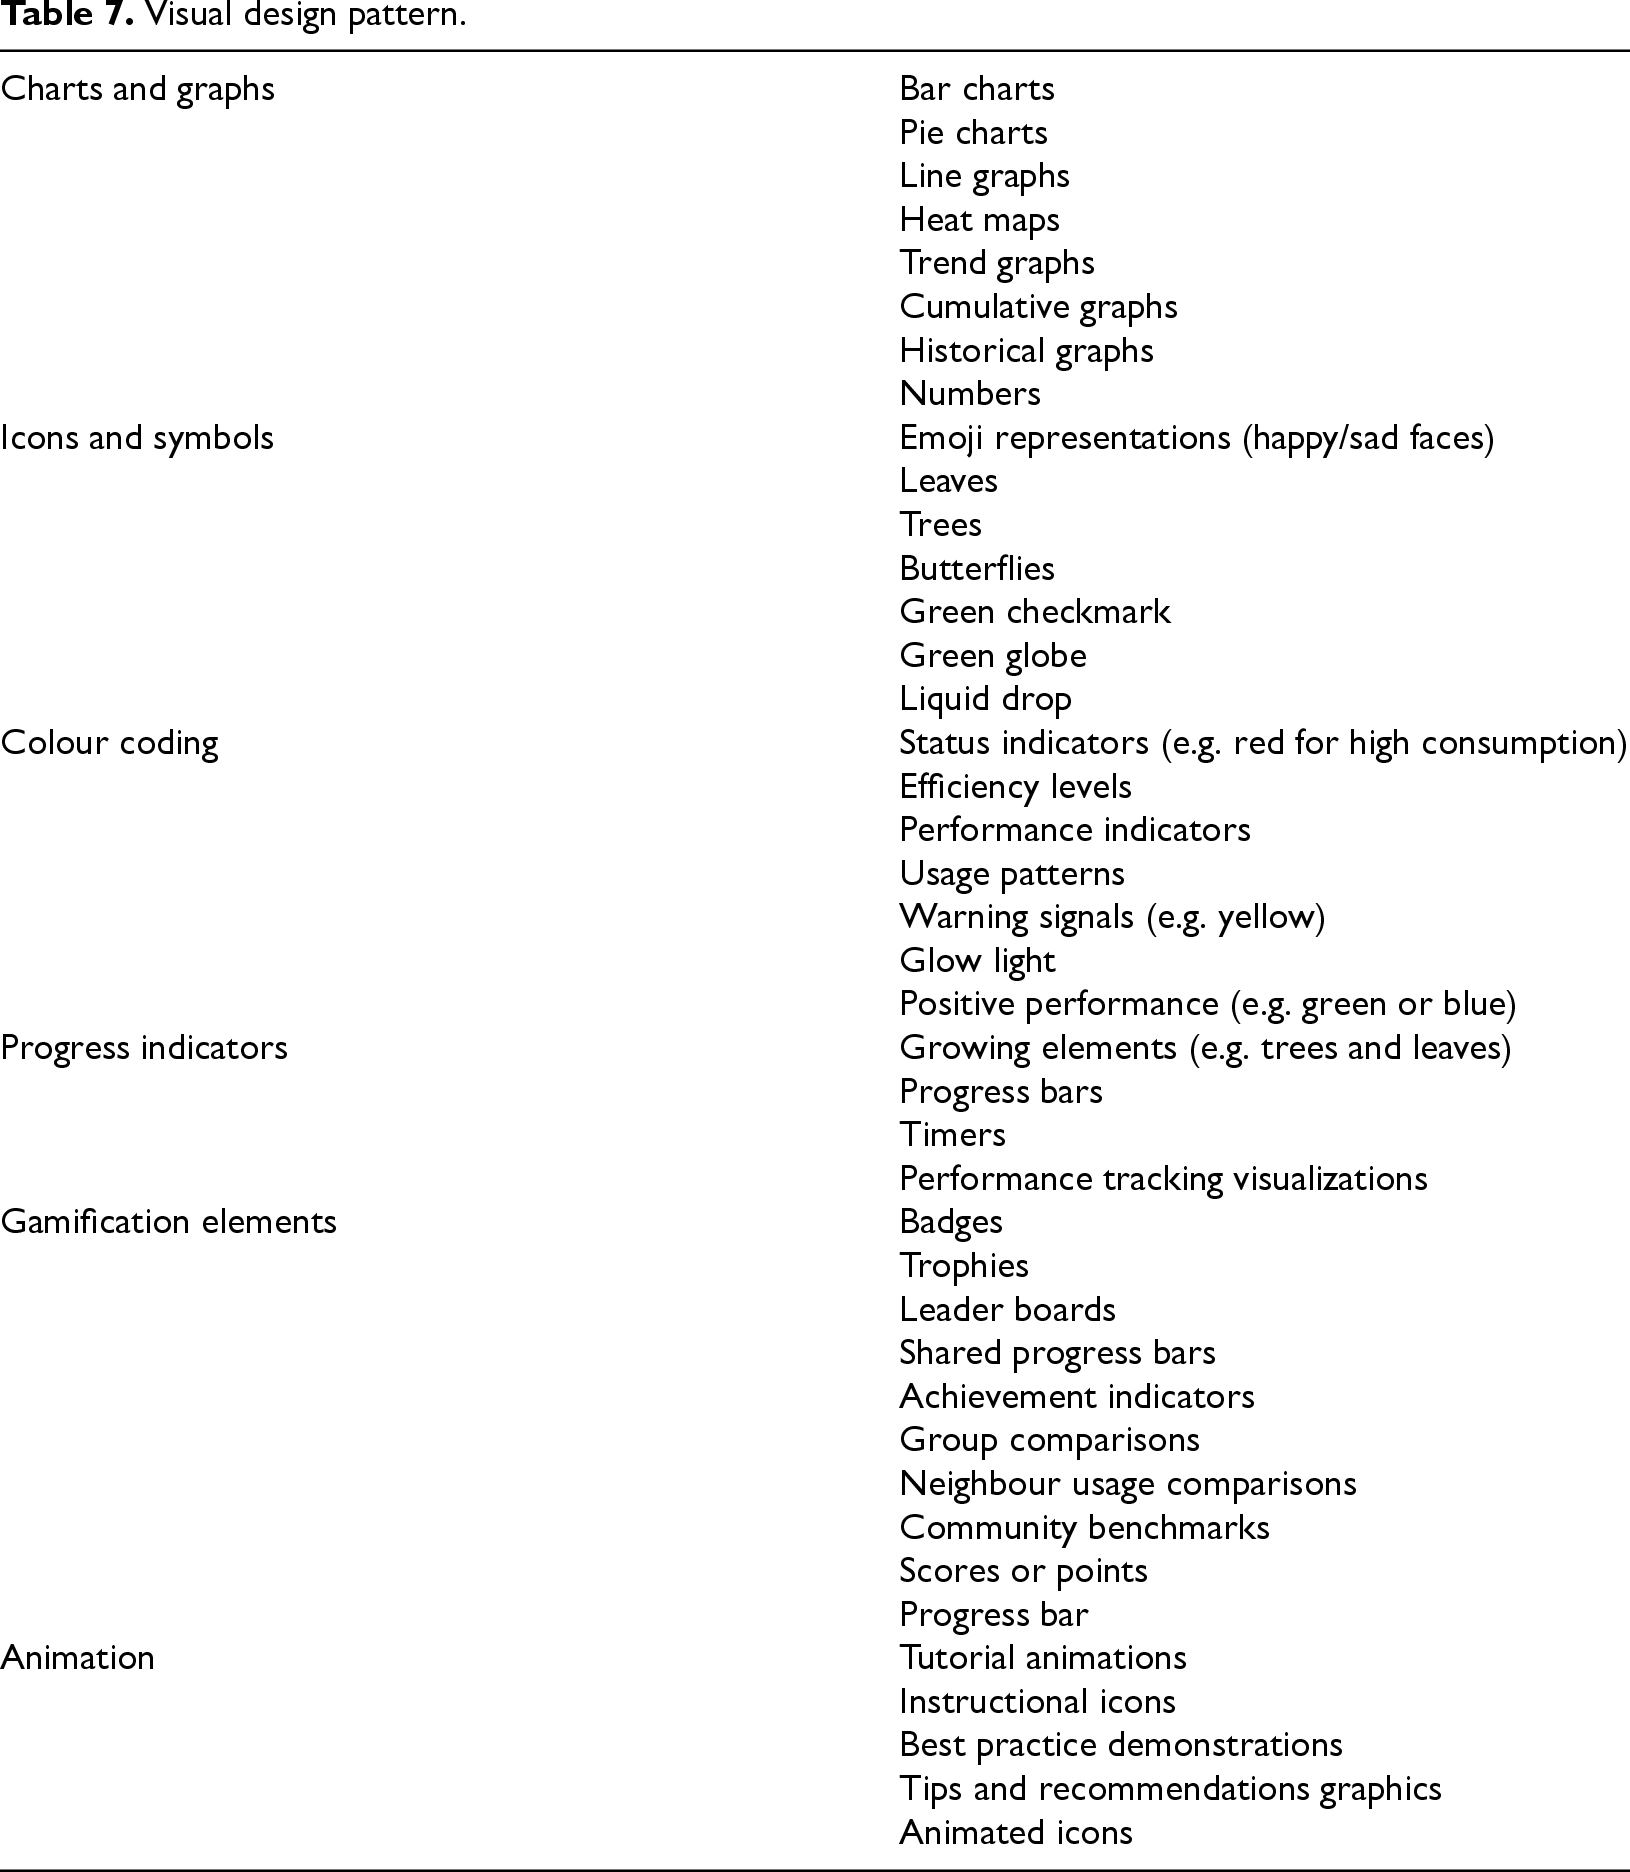
Visual design
The visual design perspective encompasses various visual strategies and concepts employed to convey environmental information to users. The components are summarized in Table 7.
Visual design pattern.
Visual design pattern.
Charts and graphs relate to self-evaluating and temporal feedback by providing visual representations of energy consumption data over time, enabling individuals to assess their energy consumption patterns.
Icons and symbols relate to metaphorical feedback by providing a meaningful representation of energy consumption over time, enabling individuals to grasp abstract or technical data about their energy consumption impacts and encouraging them to think about how their actions affect the environment.
Colour coding provides a semiotic language representation that the user can easily internalize. The use of colours allows for easy identification of patterns or trends in energy consumption, helping users recognize when their energy consumption is high, low, or within desired thresholds.
Progress indicators relate to self-evaluation, metaphorical, and comparison feedback by displaying a visual representation of energy consumption and performance compared to themselves or their peers, enabling individuals to assess their progress towards a goal and compare their performance against a target or previous achievements.
Gamification elements relate to metaphorical and hedonic styles by providing a fun or playful presentation of energy consumption data and patterns, enabling individuals to explore their energy consumption information in an engaging manner.
Animation relates to different visual design patterns, and it can be pragmatic, temporal, hedonic, or metaphorical, providing animated and dynamic visual presentations of energy consumption data or a way to read energy data, providing users with the ability to track their progress, stay engaged with the information, and gain an understanding of their consumption habits.
In the following section, we present a case study that illustrates the practical application of the EFF. It is important to note that the eco-feedback strategies and design patterns presented in the framework can be applied either individually or in combination, depending on the goals of the practitioners or the specific project. In this case study, we combined them to communicate information related to energy consumption in a more meaningful and engaging way.
Case study: EFF applied in practice
This case study was limited to the conceptual phase and did not include user testing. For this study, we focused on a fuel control system, a digital panel designed to monitor and optimize energy consumption on ships, similar to a cruise control system in a car. The interface displays key parameters such as vessel speed and fuel usage, giving mariners a clear overview of consumption throughout the voyage (see Figure 4).
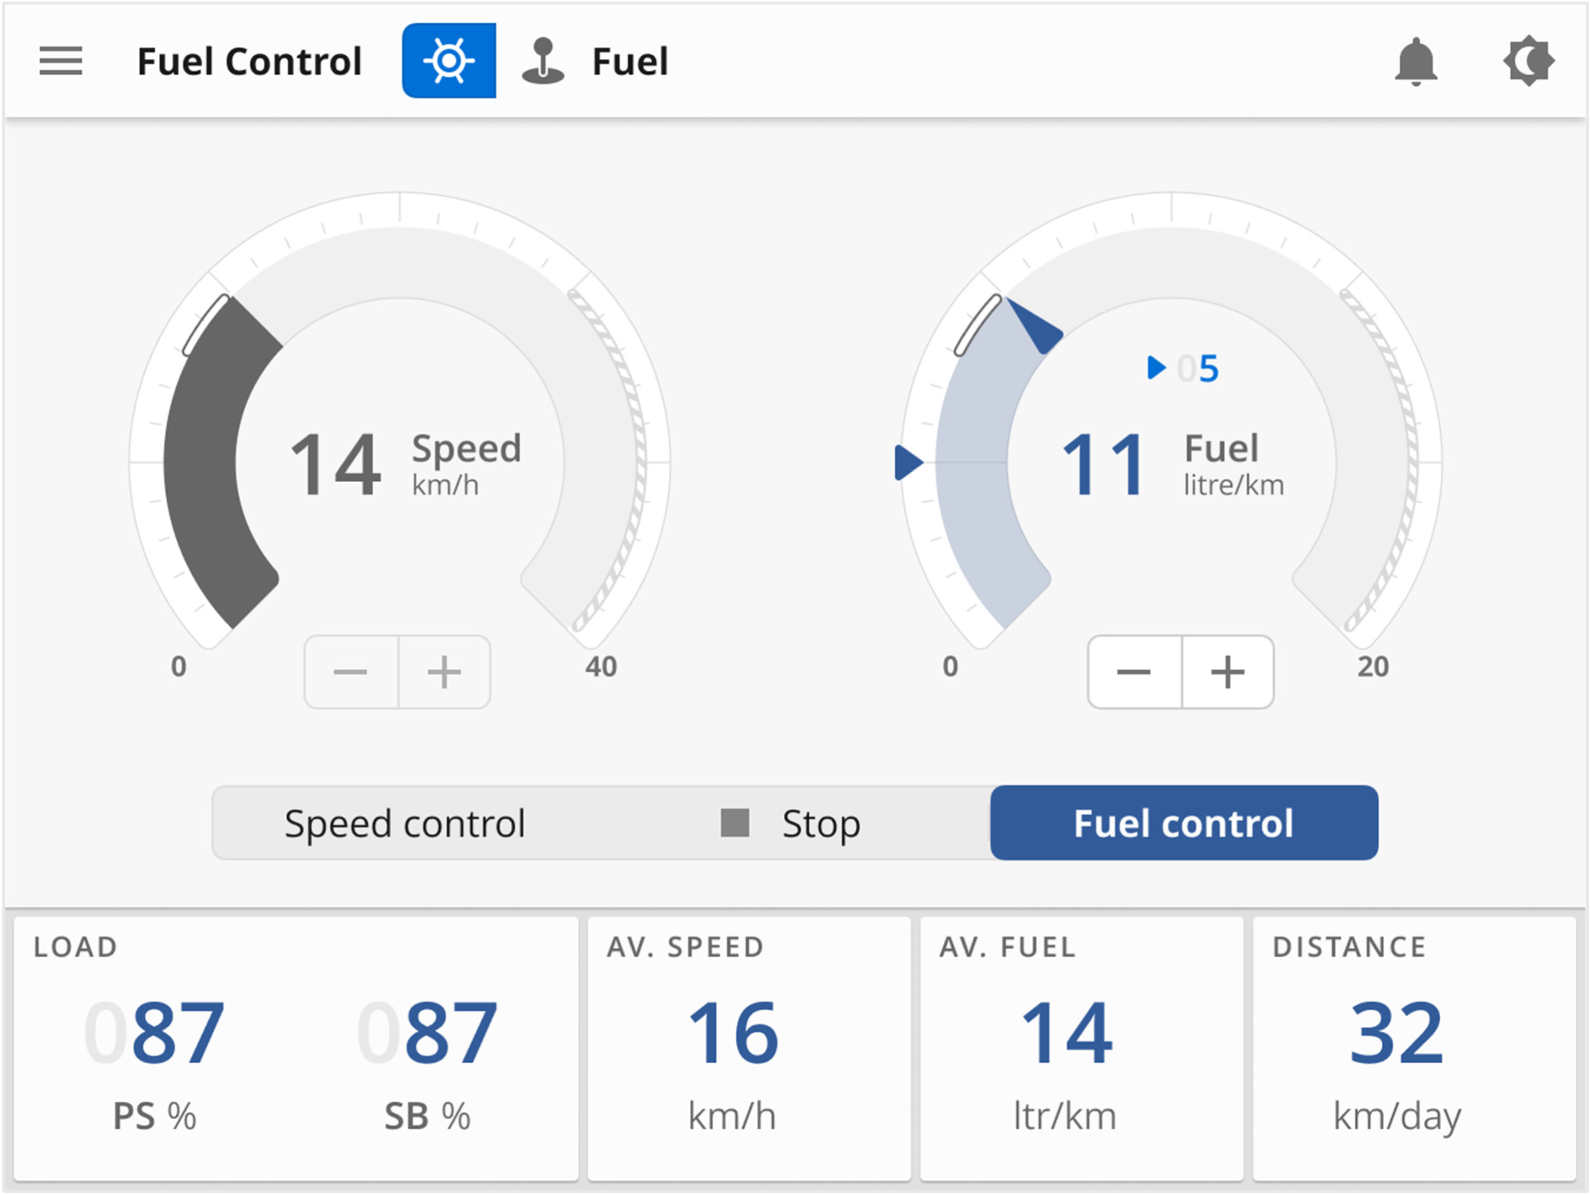
Fuel control digital instrument cluster.
To promote energy-efficient operations, we designed three eco-feedback UI concepts for the digital panel (average fuel consumption, summary information, and real-time fuel consumption). These concepts aim to enhance mariners’ energy awareness and encourage behavioural change. To develop the interfaces, we selected 12 eco-feedback strategies from the EFF (see Table 8).
Selected eco-feedback strategies.
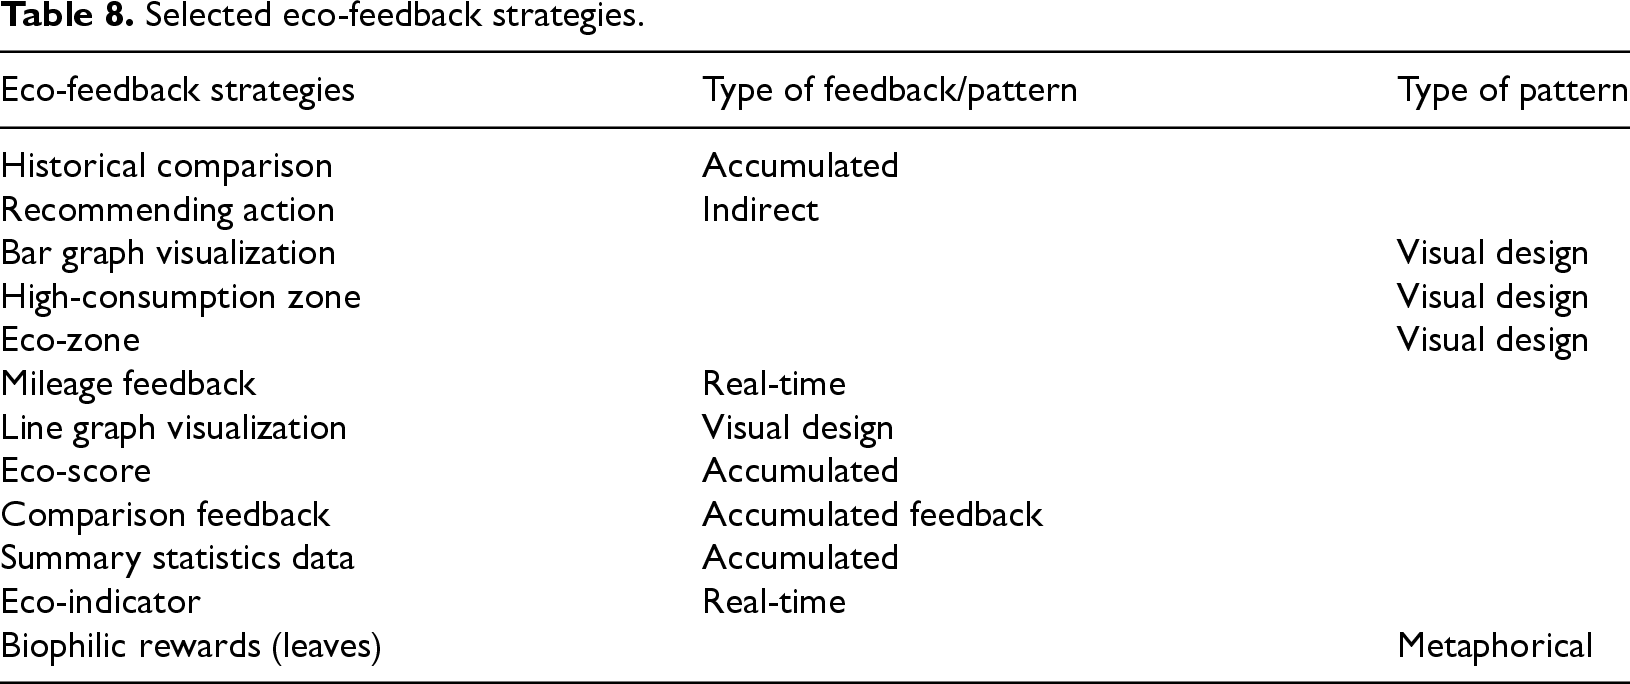
From this selected list of strategies, we started the conceptual phase of the UI. These feedback strategies were applied in combination rather than individually. This approach was intended to enhance the presentation of energy-related information, allowing users to reflect more effectively on their consumption patterns and actions.
The average fuel consumption concept is a UI modal (i.e. a secondary interface window that overlays the main display) (see Figure 5). It is accessible to the captain or crew members to visualize energy consumption data over a specified period. Here, multiple eco-feedback strategies are integrated to help users understand and reflect on their energy performance.
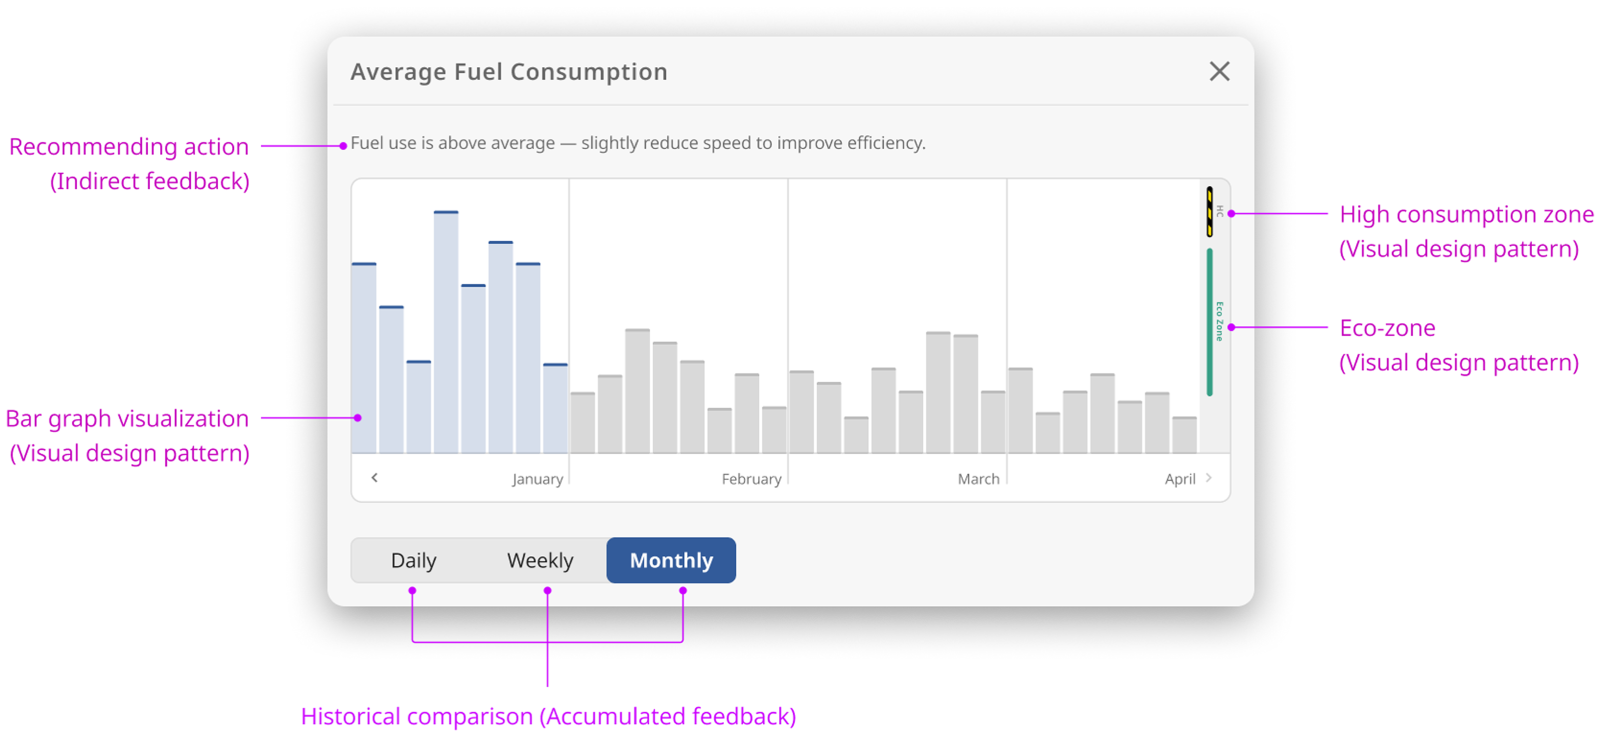
Average fuel consumption user interface (UI) modal.
The first strategy is recommending action, which suggests specific actions users can take based on the information provided. This feedback is mostly delivered as text. Here, it indicates that fuel consumption in January exceeds the eco-zone, which represents the recommended limit or threshold.
Historical comparison
The second strategy is historical comparison, which is categorized as accumulated feedback. This feedback results from the aggregation of multiple instances of data over time. It compares current consumption with past consumption by the same user over short periods (daily or weekly) or long periods (monthly or yearly). This strategy increases the captain's awareness of the vessel's energy consumption and promotes more efficient and informed operation.
Bar graph visualization
The interface also includes a bar graph visualization, using the charts and graphs’ visual design pattern. This type of visual feedback helps users understand overall energy consumption trends by showing how much energy they have consumed each day.
Eco-zone and high-consumption zone
Finally, the interface incorporates eco-zone and high-consumption zone indicators, both of which are based on colour coding, a component of the visual design pattern. The first uses green to represent positive performance, helping users maintain energy use within a sustainable range, while the second uses yellow as a warning signal to alert users when consumption exceeds the recommended limit.
Summary information
Summary information is a UI modal that can be accessed by the captain or crew members to visualize summary statistical data on energy consumption.
Summary statistical data
These present key metrics and insights into energy usage during a completed voyage. Here, we use it to communicate voyage-related information by combining several eco-feedback strategies to present energy consumption data in a comprehensible way (see Figure 6).
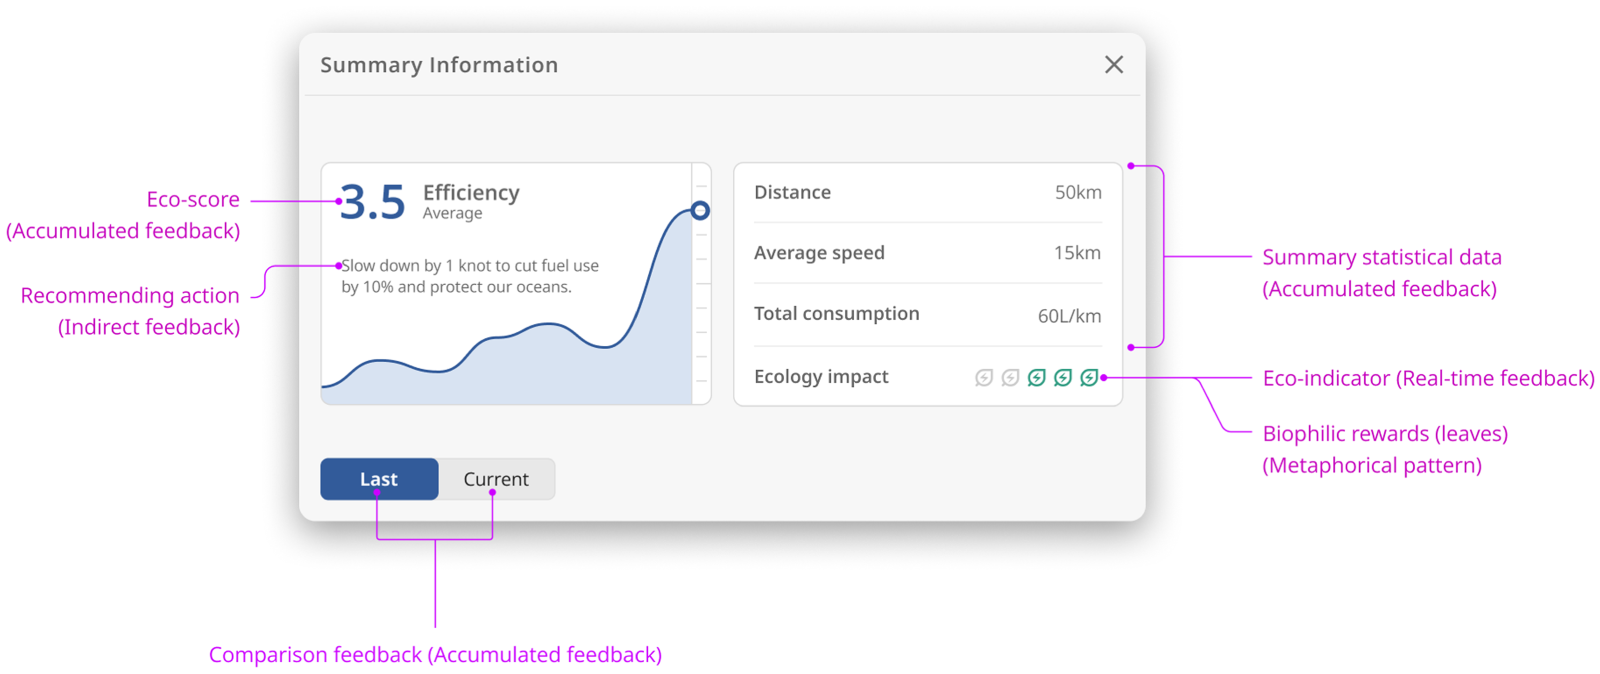
Summary statistical data.
The eco-score represents an efficiency metric based on energy consumption during a voyage. This feedback is less technical and easier for users to interpret: A low score indicates higher energy consumption, whereas a high score reflects greater efficiency. By translating complex fuel data into a simple score, users can quickly understand their performance and are encouraged to adopt more energy-efficient behaviours.
Recommending action
We also include recommending action, which represents indirect feedback. This type of feedback provides information or cues that convey evaluation, guidance, or suggestions regarding users’ actions. In this case, the UI offers advice for the next voyage to help reduce energy consumption.
Eco-indicator
Additionally, the UI features an eco-indicator, a real-time visual indicator displayed on the dashboard to show the captain how efficiently and sustainably the voyage is proceeding. This visual indicator is associated with the metaphorical design pattern using icons and symbols.
Metaphors to represent consumption or encourage sustainable behaviours often use symbols or visual representations that evoke natural concepts. Furthermore, metaphors facilitate the comprehension of energy consumption by making abstract or technical units more relatable and intuitively understandable, thereby fostering engagement.
Comparison
Finally, we added comparison feedback, which assesses the user's current performance against past performance. This can increase energy awareness and encourage pro-environmental behaviour.
Real-time fuel consumption
Real-time feedback
In the third UI concept, we applied a real-time feedback strategy, which allows for instant awareness and response (see Figure 7). This enhances the understanding of the ship's energy dynamics and encourages more informed sailing behaviours.
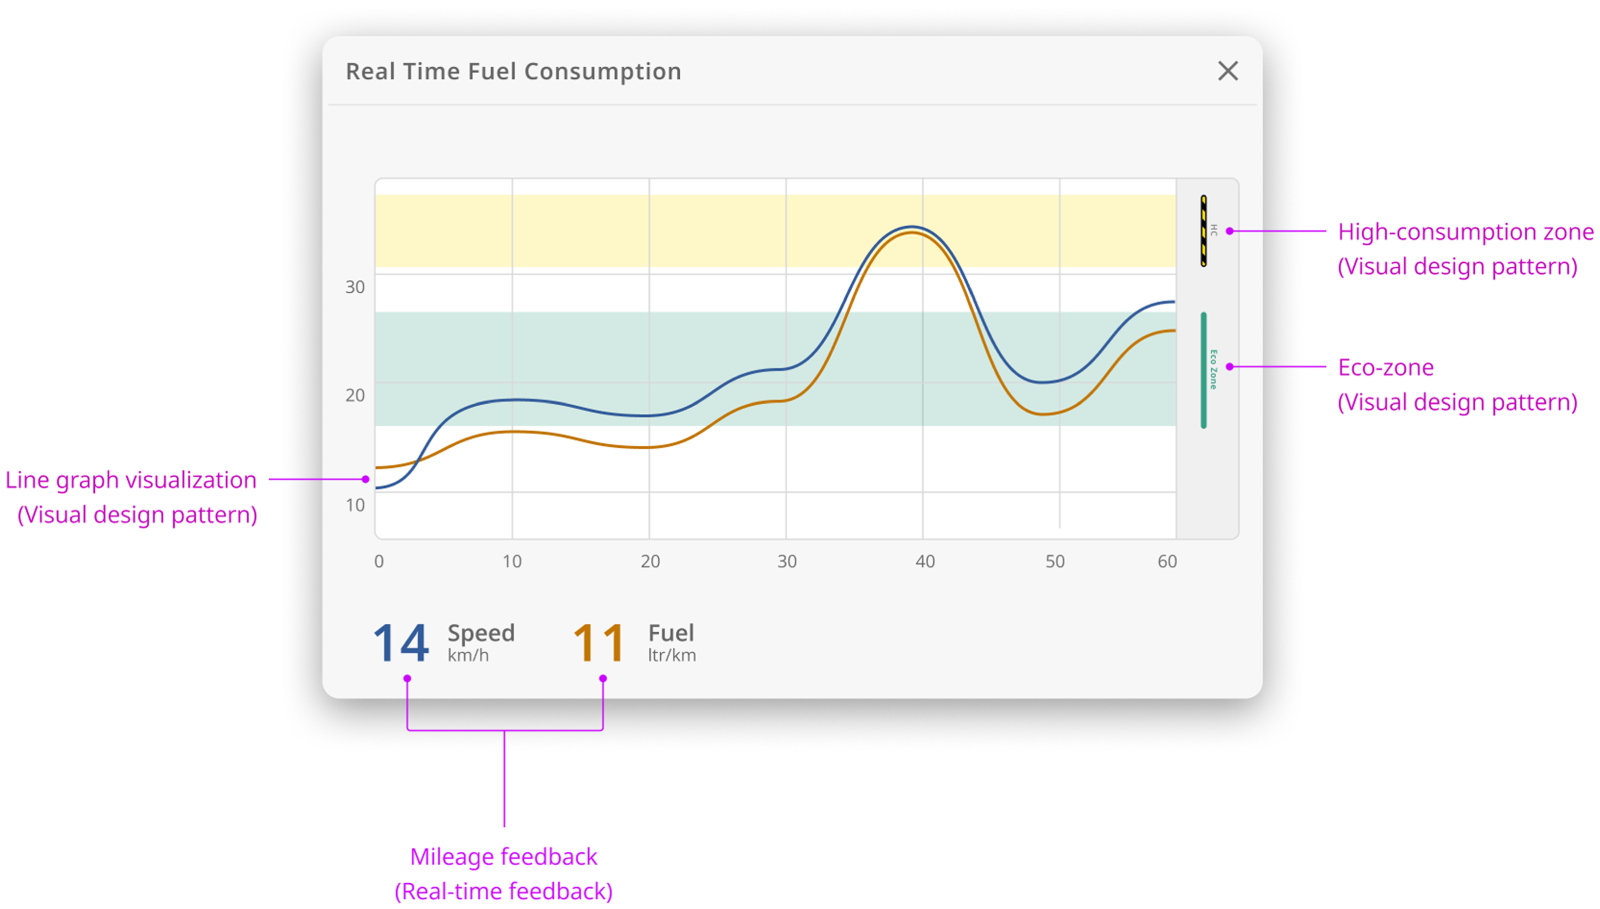
Real-time fuel consumption.
The use of a line graph to visualize energy consumption in real time is particularly important for decision-making during ship operations. This visual feedback can help the captain optimize sailing techniques to maximize efficiency and minimize energy waste.
Mileage feedback
In this concept, two-line graphs are used to represent fuel consumption and speed. These two types of information are expressed through mileage feedback, a form of real-time feedback that provides operators with information about the distance travelled and the efficiency of fuel or energy consumption.
Eco-zone and high-consumption zone
Finally, the interface incorporates eco-zone and high-consumption zone indicators, both based on colour coding, a component of the visual design pattern. The first uses green to represent positive performance, helping users maintain energy use within a sustainable range, while the second uses yellow as a warning signal to alert users when consumption exceeds the recommended limit. These visual cues play a crucial role in supporting decision-making during a voyage.
Discussion
In our systematic literature review, we identified key eco-feedback strategies and design patterns to inform UI development for energy management systems. Based on our review, we developed the EFF to provide a structured approach to designing and evaluating eco-feedback mechanisms. However, several opportunities and considerations remain.
Opportunities for applying the EFF in design research
The EFF is intended as a practical resource for researchers and practitioners in HCI and related fields. It can serve multiple purposes across different stages of the design research process, as follows: Qualifying eco-feedback in empirical studies: The EFF structure and categories can be used to describe in detail how different feedback mechanisms may influence user behaviour in experimental settings. Supporting explorative design: The EFF can serve as a guide when exploring the solution space for designing energy-efficient UIs. The eco-feedback design patterns can provide researchers with interaction techniques and visual metaphors. Developing design guidelines: The EFF can also be used to develop guidelines for designing eco-feedback interfaces. It provides a structured approach to analysing design precedence, which involves examining previous design solutions to inform current decisions, and links eco-feedback strategies to the core design patterns for eco-feedback UI design. Supporting co-design processes: The EFF can be integrated into design workshops and participatory design sessions to frame discussions and generate design ideas. Helping to bridge theory and practice in HCI: The EFF contributes to linking theoretical perspectives on behavioural change with practical UI design strategies.
Key considerations for eco-feedback design
Aesthetic considerations
The EFF addresses aesthetics through visual design patterns, providing designers with UI content examples for eco-feedback systems. Topics such as how perceived attractiveness and emotional responses influence motivation and trust are not yet well covered by the framework. This is important because the aesthetic dimension of UIs should not focus only on the visual appeal of a representation but also on the effect they evoke (see, e.g. Bartram 80 ).
Alignment with user goals
Effective eco-feedback must align with users’ motivations and contextual needs. The EFF incorporates self-evaluation, comparison, temporal and metaphorical patterns to support this alignment. Topics such as how eco-feedback interfaces resonate with user perspectives to foster trust and long-term behavioural change are not yet well covered by the framework. This is important because feedback is more effective when it aligns with users’ goals (see, e.g. Sanguinetti et al. 40 ).
Moreover, metrics such as carbon footprints or kilowatt-hours often create barriers for users in understanding energy information. 33 From a user perspective, technical units are difficult to interpret and demand greater cognitive effort, which can reduce the overall effectiveness of feedback.41,65 Therefore, using metaphors to convey energy consumption information tends to be more effective and easier for users to comprehend. 55
Presentation modes and feedback saliency
How eco-feedback is presented plays a key role in user comprehension and engagement. The EFF includes metaphorical and hedonic style patterns to enhance saliency. Other topics not yet well covered by the EFF include the impact of gamification, storytelling and immersive feedback (e.g. ambient and auditory cues) on supporting knowledge internalization and behavioural change.
Calitz et al. 76 argue that using metaphors can simplify feedback by transforming complex energy metrics into more accessible and relatable representations. Similarly, Avolicino et al. 32 found that providing eco-feedback in the form of metaphors, rather than raw data, can enhance users’ understanding and attention to the feedback received. Bartram 80 also emphasizes that people tend to prefer receiving information in artistic or metaphorical forms that demand less cognitive effort. For example, representing energy usage through a metaphor such as a ‘dying tree’ can engage users more effectively than presenting numerical data alone. This approach not only reduces users’ cognitive load but also provides a more visual and emotionally engaging form of feedback.55,76.
Long-term impact of eco-feedback
The EFF integrates self-evaluation and hedonic design patterns to support long-term engagement. Topics such as how pecuniary feedback, self-monitoring, and social comparison contribute to sustained energy-saving behaviours are not yet well covered by the EFF.
An interaction design perspective on eco-feedback
In addition to research focusing on eco-feedback as a technological tool for reducing energy consumption, we propose that eco-feedback research should also adopt an interaction design perspective, focusing, for example, on how to apply eco-feedback strategies across delivery platforms, including mobile, desktop, and ambient interfaces, and across physical interactions and modalities, such as ambient audio or haptic feedback. In future research, we will apply this framework in the maritime setting to explore how people interact with eco-feedback and make decisions that impact energy consumption and emissions reduction.
Conclusion
The EFF contributes to HCI, interaction design, and related research fields for both practitioners and researchers. For practitioners, it offers actionable guidance for designing UIs for energy consumption management and the promotion of sustainable behaviours. For researchers, the EFF serves as a tool for better understanding how eco-feedback strategies and design patterns can drive energy conservation. This study contributes to maritime decarbonization as a baseline for designing better feedback systems aimed at reducing energy consumption within maritime settings.
We argue that the EFF can serve as a creative and practical tool to help practitioners and researchers design better eco-feedback UIs for maritime equipment. These UIs aim to reduce energy consumption by raising energy awareness and promoting behavioural change among seafarers, encouraging the optimal use of equipment and energy and, from a cognitive perspective, guiding seafarers towards pro-environmental behaviour that ultimately benefits both the crew and the environment.
Footnotes
Acknowledgements
We would like to thank the Maritime Group at the Technical University of Denmark (DTU) and DNV for organizing the 25th DNV Nordic Maritime Universities Workshop. We were able to present this study at the workshop and received useful feedback. Special thanks to Mostafa Amini for leading the event and providing important information for the submission.
Author contributions
Funding
The authors disclosed receipt of the following financial support for the research, authorship, and/or publication of this article: This work was funded by the Norwegian Research Council – project number 344160: OpenZero – Digital UI design for energy-conscious and safe maritime operations.
Declaration of conflicting interests
The authors declared no potential conflicts of interest with respect to the research, authorship, and/or publication of this article.